life science journal 2014;11(4) … · evaluation of spatial image processing approaches for...
TRANSCRIPT

Life Science Journal 2014;11(4) http://www.lifesciencesite.com
114
Evaluation of Spatial Image Processing Approaches for Calculating Water Surface Area: Case of the Dead Sea
Mua’ad Abu-Faraj1, Nazeeh Ghatasheh2, Hossam Faris3 and Osama Harfoushi3
1Department of Computer Information Systems, Faculty of Information Technology and Systems, The University of
Jordan, Aqaba, Jordan 2Department of Business Information Technology, Faculty of Information Technology and Systems, The University
of Jordan, Aqaba, Jordan 3Department of Business Information Technology, King Abdullah II School for Information Technology, The
University of Jordan, Amman, Jordan Email: [email protected]
Abstract: The Dead Sea plays an important role for regional development in tourism, agriculture, and industry in the middle east. Different studies stated that the water level of the Dead Sea is dropping at an average of 3-5 feet per year. Such studies are mainly environmental, some lack comparisons of their results with actual readings taken from the Dead Sea, based on heuristic predictions, lack rich technical details, consider specific cases and others rely on heterogeneous input data sets. Accordingly there is a need to provide accurate and reliable estimates for future water level and edges span of the Dead Sea as well as proving the accuracy and reliability of the selected approaches. This study presents a comparison between different approaches attempted to find the declining rate and surface area of the Dead Sea. It also presents empirical remarks on edge detection and a color based data extraction approaches in order to overcome the estimation accuracy issues. All the approaches were tested on the same data set for credibility. However remote sensing image processing can be used to derive important measurements, it requires careful selection of the approaches and data sets. [Mua’ad Abu-Faraj, Nazeeh Ghatasheh, Hossam Faris and Osama Harfoushi. Evaluation of Spatial Image Processing Approaches for Calculating Water Surface Area: Case of the Dead Sea. Life Sci J 2014;11(4):114-121]. (ISSN:1097-8135). http://www.lifesciencesite.com. 15 Key Words: Dead Sea; Edge-Based Analysis; Color-Based Analysis; Image Processing.
1. Introduction The Dead Sea, is considered as one of the world’s saltiest bodies of water, that is why it is also called the “Salt Sea”. It is called the Dead Sea because its salinity prevents the existence of any life forms in the lake. The Dead Sea receives a number of incoming rivers, including the River Jordan. Once the waters reach the Dead Sea they are land-locked and have nowhere to go, so they evaporate, leaving behind a dense, rich, cocktail of salts and minerals that supply industry, agriculture and medicine with some of its finest products. The quantity of water that evaporates from it is greater than that which flows into it, such that this body of water has the highest concentration of salt in the world (340 grams per liter of water)[1]. That same salt, on the other hand, provides tremendous relief to the many ailing visitors who come to the Dead Sea and benefit from its healing properties [2].The Dead Sea is also known for being the earth’s lowest spot on the face of the earth, the Dead Sea is 377 meters deep [1-4].
The Dead Sea has a cultural, economical, and historical importance locally and globally. One of the economical importance of Dead Sea is its huge content of potash (potassium chloride) and bromine;
both Jordan and Israel have established fertilizer makers on both sides of the Dead Sea. The potash companies and other companies that benefit from the Dead Sea water for their business have negative impact on the Dead Sea due to extraction processes [3].
Satellite imagery provides effective means of observing and quantifying the complexities of the surface of the earth. It allows us to see the world in a different way and provides a huge information source at our fingertips as we look to increase our knowledge about the environment. The technologies behind the application of this imagery are mature, and evolving rapidly [6,7].
Remote sensing data from satellite sensors and aerial photography for coastal management has been highly effective in acquiring information for marine habitat mapping, water quality monitoring, oil spill detection, emergencies, environmental impact, red tide monitoring, and mapping of reclamation activities for many years [9].
In this study, we present analysis of Dead Sea images. A comparison between different methods of calculating the declining rate of the Dead Sea water level and its surface area. Also a new method
Life Science Journal 2014;11(4) http://www.lifesciencesite.com
115
for calculating the declining rate of the Dead Sea is presented. 2. Data and Methodology
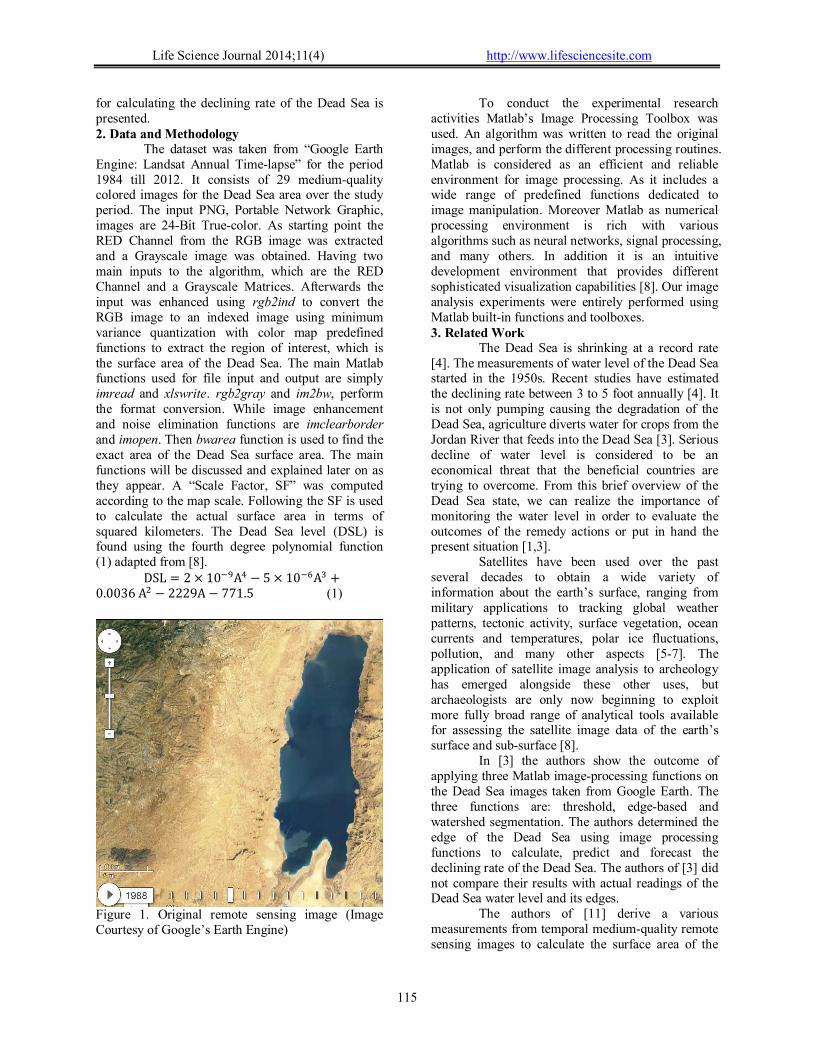
The dataset was taken from “Google Earth Engine: Landsat Annual Time-lapse” for the period 1984 till 2012. It consists of 29 medium-quality colored images for the Dead Sea area over the study period. The input PNG, Portable Network Graphic, images are 24-Bit True-color. As starting point the RED Channel from the RGB image was extracted and a Grayscale image was obtained. Having two main inputs to the algorithm, which are the RED Channel and a Grayscale Matrices. Afterwards the input was enhanced using rgb2ind to convert the RGB image to an indexed image using minimum variance quantization with color map predefined functions to extract the region of interest, which is the surface area of the Dead Sea. The main Matlab functions used for file input and output are simply imread and xlswrite. rgb2gray and im2bw, perform the format conversion. While image enhancement and noise elimination functions are imclearborder and imopen. Then bwarea function is used to find the exact area of the Dead Sea surface area. The main functions will be discussed and explained later on as they appear. A “Scale Factor, SF” was computed according to the map scale. Following the SF is used to calculate the actual surface area in terms of squared kilometers. The Dead Sea level (DSL) is found using the fourth degree polynomial function (1) adapted from [8].
DSL = 2 × 10��A� − 5 × 10��A� +0.0036 A� − 2229A − 771.5 (1)
Figure 1. Original remote sensing image (Image Courtesy of Google’s Earth Engine)
To conduct the experimental research activities Matlab’s Image Processing Toolbox was used. An algorithm was written to read the original images, and perform the different processing routines. Matlab is considered as an efficient and reliable environment for image processing. As it includes a wide range of predefined functions dedicated to image manipulation. Moreover Matlab as numerical processing environment is rich with various algorithms such as neural networks, signal processing, and many others. In addition it is an intuitive development environment that provides different sophisticated visualization capabilities [8]. Our image analysis experiments were entirely performed using Matlab built-in functions and toolboxes. 3. Related Work
The Dead Sea is shrinking at a record rate [4]. The measurements of water level of the Dead Sea started in the 1950s. Recent studies have estimated the declining rate between 3 to 5 foot annually [4]. It is not only pumping causing the degradation of the Dead Sea, agriculture diverts water for crops from the Jordan River that feeds into the Dead Sea [3]. Serious decline of water level is considered to be an economical threat that the beneficial countries are trying to overcome. From this brief overview of the Dead Sea state, we can realize the importance of monitoring the water level in order to evaluate the outcomes of the remedy actions or put in hand the present situation [1,3].
Satellites have been used over the past several decades to obtain a wide variety of information about the earth’s surface, ranging from military applications to tracking global weather patterns, tectonic activity, surface vegetation, ocean currents and temperatures, polar ice fluctuations, pollution, and many other aspects [5-7]. The application of satellite image analysis to archeology has emerged alongside these other uses, but archaeologists are only now beginning to exploit more fully broad range of analytical tools available for assessing the satellite image data of the earth’s surface and sub-surface [8].
In [3] the authors show the outcome of applying three Matlab image-processing functions on the Dead Sea images taken from Google Earth. The three functions are: threshold, edge-based and watershed segmentation. The authors determined the edge of the Dead Sea using image processing functions to calculate, predict and forecast the declining rate of the Dead Sea. The authors of [3] did not compare their results with actual readings of the Dead Sea water level and its edges.
The authors of [11] derive a various measurements from temporal medium-quality remote sensing images to calculate the surface area of the

Life Science Journal 2014;11(4) http://www.lifesciencesite.com
116
Dead Sea over the past 29 years. It shows the outcome of applying spatial data calculations on the Dead Sea images taken from Google Earth Engine. The authors approach in [11] was to extract the region of interest followed by performing spatial based calculations. The authors also derived several results according to proposed mathematical model of the Dead Sea. The calculations presented in [11] are the calculated 60 km2 shrinkage and the 18 meters decline over the study period. Which results in maximum of 1.8 meters in the water level change. The authors also showed the atmospheric noise tolerance of each processing technique and compared their results to actual numbers taken from real environment.
In [12], the authors used remote sensing images to estimate the water surface decline over the period 1810- 2005 for the Dead Sea. According to spatial analysis the decline was about 20 meters and the surface area in the 2004 reached 640.62 km2. The authors conducted the analysis on images from different sources for specific time periods; precisely 1973, 1983, and 2004. Afterwards the three images geometry was corrected followed by edge enhancement routine. Furthermore the images were manipulated to remove atmospheric effects. Finally an overlay analysis determined the shrinkage of the water body.
Regarding the water level the authors in [12], relied on historical data and few measurements using a GPS (Global Positioning System) device. They pointed to the water level increase in the years 1991-1992. The increase was due to the excessive water inflows in that period. Their own survey recordings of water levels in the years 2005 and 2006 were about -416 meters and -417 meters respectively. A remark stated that the water level measurements were conducted after rainfall periods to have homogeneity in the results. The authors concluded that the water body of the Dead Sea is declining over time. And a remedy might be taken by applying the Red-Dead Sea Canal proposal.
According to the investigation conducted by the authors in [13,14], there are many causes for a damaging water loss in the Dead Sea. That includes the inflows shortage, natural evaporation, potash companies consumption and salt production. Based on the authors model the Dead Sea is expected to decline from 411 meters below sea level in 1997 to 479 meters in 2097. Moreover, the authors tried to formalize different approaches to analyze the Dead Sea changes in terms of water level and volume. In addition the authors pointed to their efforts in studying the time it takes to mix the inflows with the existing water body. Their two developed models consider the mixing time for the changes in sea level
and surface area. Namely a “single-layer” and a “two-layer” Dead Sea models.
Aral Sea, found between Kazakhstan and Uzbekistan, shares a similar fate to the Dead Sea. In [15], the authors point to the common features of both seas in terms of the dramatic decline and properties, despite the significant difference in volume. Over centuries both seas faced a tremendous water volume loss that needed serious attention. What is interesting is the changes in minerals concentration in both water bodies. That drags the attention to new perspective of important environmental, economical and industrial issues. The benefits of studying the chronological history of both areas may lead to better development and water management practice. 4. Methods Evaluations
Although different researchers proposed and deployed a wide range of analysis approaches, it is valuable to evaluate some of the methodologies used. Correspondingly, the main focus here is to highlight aspects of spatial domain analysis using remote sensing images, mainly edge-based and contrast-based segmentation illustrated in [3,11].
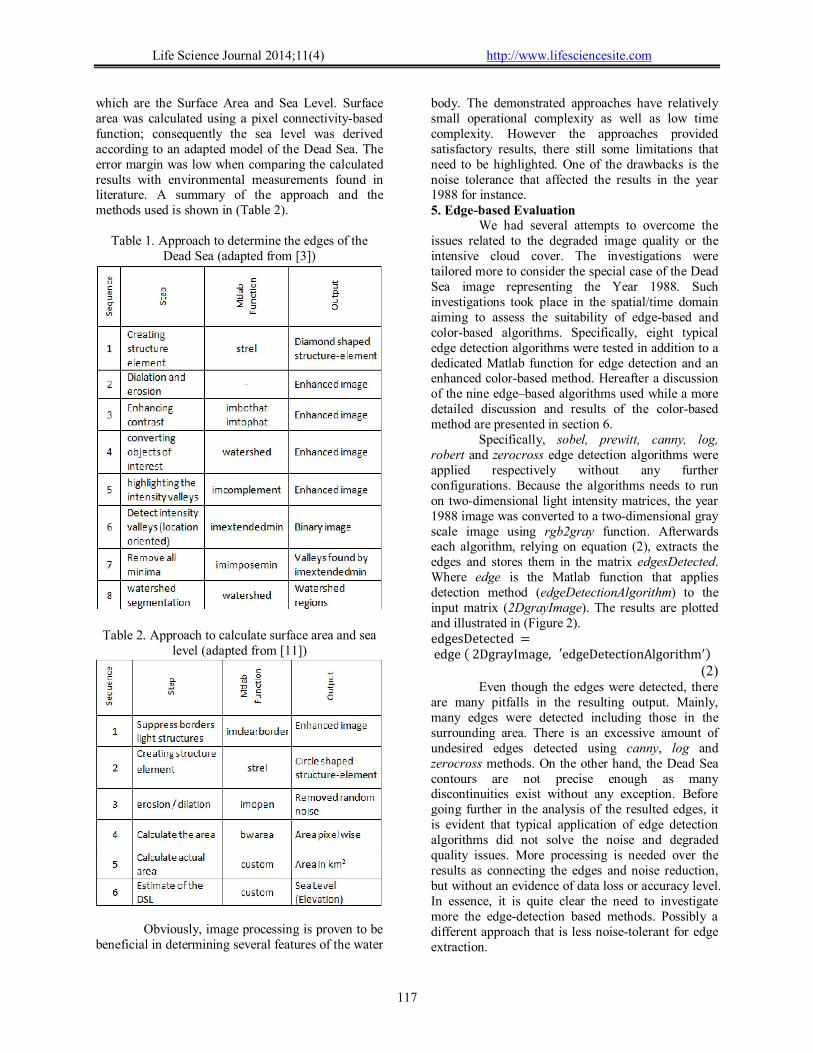
Typical edge detection algorithms were examined in [3] for the sake of extracting water body region in remote sensing images. Initially the images were morphologically enhanced using a diamond shaped structuring element, followed by contrast enhancement. Afterwards watershed function was used to highlight the areas of interest, then the intensity valleys were detected. Finally the watershed regions were extracted by watershed segmentation. Furthermore, the performance of three methods was presented showing that threshold outperformed the other methods in terms of speed, however edge-based and watershed segmentation were nominated to be effective. A summary of the approach and the methods used is listed in (Table 1).
Starting from the results presented in [3], an adapted application of the findings was conducted in [11] to automatically process remote sensing images. In which Medium-quality colored images of the Dead Sea over 29 Years period were analyzed to calculate the surface area and sea level. Two primary inputs were generated that are the gray scale and the extracted red channel. Image processing started by suppressing light structures sticking to the borders of the image and removing the random noise elements. Where a morphological open operation using a circle-shaped structure element was used in the noise removal step. The relatively few pixel-wise image processing operations were sufficient to extract the region of interest effectively. Moreover, two important findings were derived from the extracted region of interest, the Water Surface of the Dead Sea,
Life Science Journal 2014;11(4) http://www.lifesciencesite.com
117
which are the Surface Area and Sea Level. Surface area was calculated using a pixel connectivity-based function; consequently the sea level was derived according to an adapted model of the Dead Sea. The error margin was low when comparing the calculated results with environmental measurements found in literature. A summary of the approach and the methods used is shown in (Table 2).
Table 1. Approach to determine the edges of the
Dead Sea (adapted from [3])
Table 2. Approach to calculate surface area and sea
level (adapted from [11])
Obviously, image processing is proven to be
beneficial in determining several features of the water
body. The demonstrated approaches have relatively small operational complexity as well as low time complexity. However the approaches provided satisfactory results, there still some limitations that need to be highlighted. One of the drawbacks is the noise tolerance that affected the results in the year 1988 for instance. 5. Edge-based Evaluation
We had several attempts to overcome the issues related to the degraded image quality or the intensive cloud cover. The investigations were tailored more to consider the special case of the Dead Sea image representing the Year 1988. Such investigations took place in the spatial/time domain aiming to assess the suitability of edge-based and color-based algorithms. Specifically, eight typical edge detection algorithms were tested in addition to a dedicated Matlab function for edge detection and an enhanced color-based method. Hereafter a discussion of the nine edge–based algorithms used while a more detailed discussion and results of the color-based method are presented in section 6.
Specifically, sobel, prewitt, canny, log, robert and zerocross edge detection algorithms were applied respectively without any further configurations. Because the algorithms needs to run on two-dimensional light intensity matrices, the year 1988 image was converted to a two-dimensional gray scale image using rgb2gray function. Afterwards each algorithm, relying on equation (2), extracts the edges and stores them in the matrix edgesDetected. Where edge is the Matlab function that applies detection method (edgeDetectionAlgorithm) to the input matrix (2DgrayImage). The results are plotted and illustrated in (Figure 2). edgesDetected = edge ( 2DgrayImage, e� dgeDetectionAlgorithm�)
(2) Even though the edges were detected, there
are many pitfalls in the resulting output. Mainly, many edges were detected including those in the surrounding area. There is an excessive amount of undesired edges detected using canny, log and zerocross methods. On the other hand, the Dead Sea contours are not precise enough as many discontinuities exist without any exception. Before going further in the analysis of the resulted edges, it is evident that typical application of edge detection algorithms did not solve the noise and degraded quality issues. More processing is needed over the results as connecting the edges and noise reduction, but without an evidence of data loss or accuracy level. In essence, it is quite clear the need to investigate more the edge-detection based methods. Possibly a different approach that is less noise-tolerant for edge extraction.

Life Science Journal 2014;11(4) http://www.lifesciencesite.com
118
Figure 2. Typical edge-extraction methods on Dead Sea 1988
In order to have better edge extraction we
examined an enhanced approach on different images (3), including the year 1988 image. To reduce the number of the undesired edges and apply the approach demonstrated here, the gray image was converted to binary (black and white) matrix using im2bw Matlab function. The conversion to black and white results in giving ON value for intensities exceeding certain threshold, while the rest are given
OFF value. Consequently it was possible to trace the contours of the sub-areas using the Matlab function bwboundaries, in which external and internal edges of the regions are traced. By setting the function’s parameter “holes”, every region and its sub-regions “parent-children” are examined having as a result the contours of each area and its sub-areas identified. At the same time by default 8-pixel connectivity is considered for identifying the regions. The output of

Life Science Journal 2014;11(4) http://www.lifesciencesite.com
119
the bwboundaries function is divided into two main matrices, “B” having the identified edges and “L” containing labeled regions and background. However it is possible to derive other findings as the adjacency matrix of the regions but the purpose here is to show the applicability of the selected method. (Figure. 3) illustrates the main results.
[B, L] = bwboundaries(bwImage, 8, ′holes′) (3)
Figure 3. Result of applying bwboundaries for the years 1988 1990 2000 2012
Despite the presence of scattered noise
elements in the results, it shows a significant improvement in precisely identifying the edges of the Dead Sea. As has been noted that edge detection within the low quality image has been enhanced. This overcomes the edge connectivity issues as well as noise tolerance of edge detection algorithms. Moreover, the area of the Dead Sea is labeled and separated from the background. To apply this method it is recommended to select the region with higher values in the output matrices, that denotes the Dead Sea surface area, while lower value objects denote the noise or undesired edges or regions.
6. Color-based Evaluation
The color of water body in colored images is distinguishable by human eye, but in grayscale or monochrome images the color ranges are confusing and limited. Such natural aspects are considered in this research to separate the water body from its surroundings. First rgb2ind converts the input images into indexed images, in which each spatial point in the image is given an index, where colors are stored in lookup table. Each original color is mapped to the nearest color in the lookup table, in our case we used Matlab’s “summer” color map. Second step is to construct a monochrome image relying on a specific color range in the indexed image by applying equation (4). minColor and maxColor are arbitrary-selected color values used to match the Dead Sea color range in the indexed image. Finally any water cover connected to image borders is omitted using
imclearborder function, being part of the Dead Sea surroundings. Due to the presence of small noise structures in the background, imopen is used to apply a disk-structuring mask to remove them. (Figure 4) below shows the extracted region of interest based on color separation in which the monochrome images was inverted for better visualization.
bwImage = roicolor(indexedImage, minColor, maxColor ) (4)
Figure 4. Color-based Extraction
Afterwards the same approach in [11] was
used to calculate the surface area of the extracted region, using bwarea, the result is a connectivity-based area in pixels. Following a scale factor of 1-to-100 calculates the actual surface area in square kilometers. Consequently the Dead Sea Level in meters was derived according to a polynomial function. Forthwith the whole process was repeated for the 29-entry dataset entries resulting in a chronology of water surface area and elevation from 1994 till 2012. A comparison of this research results and those in [11] are plotted in (Figure 5).
Apparently the two approaches follow the same declining pattern but with noticeable displacement for most of the period 1988-1999. While two significant spikes appear in the years 1988 and 1999 due to noise and image quality tolerance. To judge which is closer to the actual measurements it is required to confront the findings to credible surface area source for the whole period, at the same time considering the period in which the staellite images were taken. Even Though the actual

Life Science Journal 2014;11(4) http://www.lifesciencesite.com
120
environmental readings may vary, the two approaches successfully spot the fluctuations and decline. The exact calculated values using this method are listed in (Table 3).
Table 3. Color-Based ROI Calculations
Year Area km2 Elevation
1984 670.3088 -405.5112
1985 668.3313 -406.0553
1986 669.355 -405.7726
1987 666.6862 -406.5143
1988 671.605 -405.159
1989 661.835 -407.9014
1990 657.98 -409.0397
1991 657.0875 -409.3078
1992 658.3212 -408.9377
1993 653.1525 -410.5101
1994 651.2 -411.1191
1995 650.5712 -411.317
1996 650.3275 -411.3939
1997 649.9837 -411.5026
1998 649.5625 -411.6362
1999 642.7688 -413.8435
2000 645.6825 -412.8846
2001 645.1925 -413.0445
2002 642.2213 -414.0257
2003 644.0762 -413.4109
2004 641.6275 -414.224
2005 638.1513 -415.4007
2006 637.7012 -415.555
2007 633.485 -417.0215
2008 632.2763 -417.449
2009 628.7425 -418.7172
2010 626.9225 -419.3809
2011 624.3112 -420.3458
2012 620.9238 -421.6196
Figure 5. Surface Area by Color-based Extraction
7. Conclusion
As a matter of fact, image processing is proven to be applicable in determining several features of water bodies. Which are beneficial to the plans against various risks for the industry, environment, tourism and many others. The tremendous water level drop for instance is related to the sinkholes, subsidence and landslides which are some of the serious issues threatening the surrounding area of the Dead Sea [16]. Due to the importance of the Dead Sea and the critical situation it faces, it is required to formulate a reliable monitoring scheme based on empirical analysis rather than predictions for the past chronology. At the same time future predictions should be based on highly accurate historical and expected variables as inflows, rainfall, evaporation, surface area and industrial consumption. In this research, we revised different approaches that have relatively low operational and time complexity to find the declining rate and surface area of the Dead Sea. However these approaches provided satisfactory results, there still some limitations that were highlighted. One of the drawbacks is the noise tolerance that affected some of the results, for instance the year 1988 in our dataset. Moreover, using the same data set eight edge-detection algorithms tested in addition to a dedicated Matlab function and an enhanced color-based method. Starting from our attempts to overcome some issues and limitations future work is to combine the best of edge-based approaches with the color-based segmentation. Another opportunity for higher accuracy is to explore the frequency domain analysis, possibly a spatial based pre-processing and frequency domain analysis. Not to forget the derivation of different measurements as density, and future state of the minerals concentration. Such components are related directly to important industries locally and internationally as bromine, potash and medicine.
Life Science Journal 2014;11(4) http://www.lifesciencesite.com
121
Correspondent author: Mua’ad M. Abu-Faraj, Department of Computer Information Systems Faculty of Information Technology and Systems The University of Jordan P.O. Box 2595 Aqaba 77110, Jordan Email: [email protected] References 1. McPhail, S. Lintner. (2014, January 9). Red Sea
Dead Sea Water Conveyance Study Program Overview [Online]. Available: http://siteresources.worldbank.org.
2. S. Arab, A. Alshikh, “The Role Of Natural Mineral Dead Sea Waters Therapy In Various Rheumatic Diseases”. Nature and Science, Vol 8, No. 12, pp. 194-197, 2010.
3. M. Abu-Faraj and N. Ghatasheh , “Using Image Processing Functions to Determine the Edges of the Dead Sea and Calculate the Declining Rate,” International Journal of Computer Science Issues (IJCSI), Vol.10, Issue 6, No 2, pp. 97-101, 2013.
4. R. N. Nof, et al., “Rising of the lowest place on Earth due to Dead Sea water-level drop: Evidence from SAR interferometry and GPS,” in Journal of Geophysical Research: Solid Earth, Vol. 117, Iss. B5, 2012, pp. 217-229.
5. O. Muresan, et al., “Satellite Image Processing Applications in MedioGRID,“ in the 5th Int. Symposium on Parallel and Distributed Computing IS- PDC ’06, 2006, pp. 253-262.
6. D. Gorgan, et al., “Grid based satellite image processing platform for Earth observation application development,” in IEEE Int. Workshop on Intelligent Data Acquisition and Advanced Computing Systems: IDAACS ‘09, 2009, pp. 247- 252.
7. Z. Wang and X. Pei, “Application of Principal Component Extraction technique in processing cloud images from Chinese FY-1 satellite,” in International Conference Image Analysis and Signal Processing: IASP 2009 ‘09, 2009, pp. 18-21.
8. M. Montufo, “The Use of Satellite Imagery and Digital Image Processing in Landscape Archaeology. A Case Study from the Island of Mallorca, Spain,” in an Int. Journal Geoarchaeology, Vol. 12, No. 1, 7185, 1997.
9. T. Ahmad, et. al., “Need for Software Design Methodology for Remote Sensing Applications,” in Life Sci Journal Vol. 9 No. 3 pp. 2152-2156, 2012.
10. S. Bharathi, et al., “Performance analysis of segmentation techniques for land cover types using remote sensing images,” in 2012 Annual IEEE India Conference (INDICON), 2012, pp. 775-780.
11. N. Ghatasheh, M. Abu-Faraj, and H. Faris “Calculating Dead Sea Water Level and Surface Area using Remote Sensing Images,” International Review on Computers and Software (IRECOS), Vol. 8, No 12, pp. -, 2013.
12. S. Rawashdeh, R. Ruzouq, A. Al-Fugara, P. Biswajeet, Z. Abu- Hamatteh, and G. AbuRumman. “Monitoring of Dead Sea water surface variation using multi-temporal satellite data and GIS.” Arabian Journal of Geosciences, Vol. 6, No. 9, pp. 3241-3248. 2013.
13. R. Bashitialshaaer, K. Persson, and M. Aljaradin. “The Dead Sea Future Elevation.” Int. J. of Sustainable Water and Environmental Systems. Vol. 2, No. 2, pp. 67-76. 2011.
14. R. Al-Zubaidy, and M.Y. Shambour. “Prediction of the Dead Sea water level using neural networks, ” in Fourth International Symposium on Innovation in Information & Communication Technology (ISIICT), pp. 147-154, 2011.
15. Oren, I. Plotnikov, S. Sokolov and N. Aladin. The Aral Sea and the Dead Sea: Disparate lakes with similar histories. Journal of Lakes & Reservoirs: Research & Management, Vol. 15, No. 3, pp. 223-236. 2010.
16. D. Closson and N. Abou Karaki, “Dead Sea water level decline and the direct cause of sinkhole's proliferation, subsidence and landslides hazards,” in Tectonics of the Levant Fault and Northern Red Sea Workshop, Institut de Physique du Globe, Paris, 2013.
2/19/2014