life science journal 2013; 10 (2) ... · a novel fmea approach for ranking mould designs in...
TRANSCRIPT
Life Science Journal 2013; 10 (2) http://www.lifesciencesite.com
http://www.lifesciencesite.com [email protected] 51
A Novel FMEA approach for ranking Mould Designs in foundries
T.A. Selvan 1, C. Jegadheesan2, P. Ashoka Varthanan1, K.M. Senthilkumar3
1 Department of Mechanical Engineering ,Sri Krishna College of Engineering and Technology, Coimbatore, Tamil
Nadu, 641008, India 2 Arulmigu Meenakshi College of Engineering, Vadamavandal, Tamilnadu, 604410, India
3 Sri Ranganathar Institute of Engineering and Technology, Coimbatore, Tamil Nadu, 641111, India Email: [email protected]
ABSTRACT:This paper addresses a novel Failure Mode and Effect Analysis (FMEA) to prioritize the mould design of a specific cast component by evaluating the risks associated with failure modes using a case study data. The data is obtained from a macro foundry industry in India. Traditional FMEA uses Risk priority Number (RPN) to evaluate risk level of a component or process. The RPN index is found by calculating the product of severity (S), occurrence frequency (O) and detection (D) indexes. The various sets of S, O, and D indexes may produce an identical value of RPN. But in foundries, prioritizing the failures through the traditional FMEA produces unmatched results when RPN values are identical during preproduction trials. This research paper explains an alternate FMEA approach named FEAROM (Failure Effects And Resolution Of Modes) to determine matched result in practice for finalizing the mould designs. Modified fuzzy TOPSIS (Technique for Order Preference by Similarity to Ideal Solution) method interdependent with the Analytic Hierarch Process (AHP) is used for validating the results obtained using FEAROM method. The results presented are based on an experimental study carried out for a specific component in a foundry using the sand casting method. It is found that proposed FEAROM model harmonizes nicely in practice and turns out quality castings. [T.A. Selvan,C. Jegadheesan, P. Ashoka Varthanan, K. M. Senthilkumar. A Novel FMEA approach for ranking Mould Designs in foundries. Life Sci J 2013;10(2):51-60] (ISSN: 1097-8135). http://www.lifesciencesite.com. 9 Keywords: Failure mode effect analysis, Risk Priority Number, Failure Effects And Resolution Of Modes, TOPSIS, AHP
1. INTRODUCTION Currently, the foundries are encountering
mammoth pressure to manufacture high quality casting at a high requisite speed. To ensure the essential quality level, the foundries have to put into service a continuous quality enhancement strategy during development stage of cast components. Failure deterrence is an important practice to
improve the quality level [Ahmed, 1996; S. Dowlatshahi, 2001; Lu, 2002]. Among the various failure prevention techniques, FMEA has been used popularly in several areas during the past few decades. Traditional FMEA approach is based on three important indexes, viz., severity (S), occurrence (O) and detection (D) with scale levels of 1 to 10 indicated in Table 1.
Table 1. Traditional rating for S, O, D indexes of failures
Level Severity [S] Occurrence [O] Ability to detect [D] 10 Safety issue and/or non-compliance with government regulation without warning Almost every time Almost no 9 Safety issue and/or non-compliance with government regulation with warning 1 in 2 Very remote 8 Operation down for a significant period of time and major financial impact; Loss of
primary function 1 in 5 Remote
7 Serious disruption to operations, defects caught at customer site, requires major rework or scarp; Reduction in primary function
1 in 10 Very low
6 Major disruption to operations and requires light rework or scarp; Loss of comfort or convenience function
1 in 100 Low
5 Minor disruption to operations and requires light rework or scarp; Loss of comfort or convenience function
1 in 500 Moderate
4 Inconvenience to the process and requires minor rework; Returnable appearance and /or noise issue noticed by the most customers
1 in 1,000 Moderately High
3 Inconvenience to subsequent task and require minor rework; Non – returnable appearance and/or noise issue noticed by customers
1 in 5,000 High
2 Inconvenience to current task and requires minor rework; Non-returnable appearance and/or noise issue rarely noticed by customers
1 in 50,000 Very high
1 No discernable effect Almost impossible Almost certain
In traditional FMEA the RPN index is calculated as: RPN = S O D

Life Science Journal 2013; 10 (2) http://www.lifesciencesite.com
http://www.lifesciencesite.com [email protected] 52
In traditional RPN evaluation, the original ordinal scale values of S, O and D is transformed into a new metric cardinal scale value. This cardinal scale defines the RPN does not cover the range [1, 1000] continuously and presents a series of “holes” corresponding to prime numbers present in the range itself. Actually, 88% of the scale is empty with only 120 unique RPNs because some of the RPNs are repeating. For example, RPN 120 appears 24 times from product of S, O and D. Other extremes 1, 123, 1000 appear only once. RPNs are not continuous and heavily distributed at the bottom of the scale from 1 to 1000. This leads to series of problems in RPN interpretation. This causes problems in interpreting the meaning of the differences between different RPNs. For example, the difference between 400 and 500 the same as or less than the difference between 600 and 700 is not interpreted.
Another inherent drawback in the RPN analysis is that various sets of S, O and D may produce exactly the same value of RPN. For example, consider two different events having values of (5, 6, 1) and (10, 3, 1) for S, O and D respectively. Both these events will have a total RPN value of 30, but their hidden risk implications may be totally different. This may lead to either waste of resources and time or in some cases a high risk event may go unnoticed.
Furthermore the RPN scale properties lead to a series of problems in the RPN interpretation. For example, if two or more failure modes have the exact RPN, one may face difficulty in selecting which failure mode demands higher priority for corrective action. Also, the assumption is that the three failure mode indexes are all equally important. The relative importance among S, O and D is not taken into consideration. But in real practical applications the relative importance among the factors exists because different experts have different knowledge and judgments. Further, in order to ensure the estimation more precise and more reliable there is a need to handle the subjective or qualitative information associated with the analysis in consistent and logical manner even after suitable weights are assigned to the S, O and D indexes.
Many researchers have proposed modified versions of the FMEA approach to overcome the above difficulties associated with it. One among them is the assessment of RPN prioritization in FMEA using fuzzy logic system (Bowles and Bonnell, 1998; Bowels 2003). Xu et al., (2002) proposed a fuzzy logic base approach for FMEA with fuzzifier and defuzzifier method to address the interdependencies among various failure modes with uncertain and imprecise information. Sharma et al., (2005) proposed a fuzzy logic based approach resolves the limitations of conventional RPN evaluation and also
permits the experts to combine S, O and D indexes in a more flexible and realistic manner. Wang et al., (2009) proposed a fuzzy FMEA approaches to reduce the dependence on expert opinion in traditional FMEA. Chang et al., (1999) has proposed a modified FMEA using fuzzy methods and grey theory to eliminate the pitfalls in the traditional FMEA. This could be even extended to the cases where they may possess same RPN indexes. Franceschini and Galetto (2001) investigated and devised a novel method for ranking the risk priorities of failures in FMEA. The authors devised a method for managing data provided by the design team. The investigation considers each characteristic index as a fuzzy subset along with the ‘tie ranking’ rule when two or more failure modes have the same RPN. Further investigation of this work was extended by Sellapan and Karuppusami (2009) using ANOVA. Chen and Ko (2009a, 2009b) proposed a fuzzy based approach to cope with the vague nature of product development processes for both FMEA and Quality Function Deployment (QFD) through fuzzy Linear and Nonlinear Programming models. Zhang and Chu (2011) proposed the fuzzy based linear programming method as an effective solution for the calculations of fuzzy RPNs which resolves the vagueness and uncertainty existing in the evaluating process of the traditional FMEA.
Overall, it is obvious that many investigators proposed a modified FMEA approach to overcome the shortcomings of the traditional FMEA by combining fuzzy sets with different techniques. Other fuzzy FMEA approaches have been proposed for the RPN calculation in the literature (Bowles and Pealz 1995; Bragila et al. 2003; Pillay and Wang 2003; Guimaraes and Lapa 2004; Garcia et al. 2005). Vast majority of fuzzy FMEA approaches employs fuzzy-if then rules for prioritization of failure modes. This requires vast amount of expert knowledge and expertise. In particular, different experts may have different knowledge and judgments. When their judgments are inconsistent, it is nearly impossible to combine or reduce rules. In general, most of these techniques are very complex and require a special function definition and technical know-how. In particular, these methods are quite complex to manage and are not always available to the designers. Hence, there is a clear need to develop a straight forward and simple fuzzy logic approach for FMEA which can take advantage of the benefits of fuzzy logic. Moreover, Wong and Lai (2011) indicated in his work that most research is carried out only in Universities and suggested to make more effort to develop real world applications. Also, the authors have attempted traditional FMEA method for finalizing mould designs in foundries and found that it produces unmatched results in real time practice.
Life Science Journal 2013; 10 (2) http://www.lifesciencesite.com
http://www.lifesciencesite.com [email protected] 53
These issues motivated the authors to devise a simplified but an effective fuzzy FMEA model named FEAROM (Failure Effects And Resolution Of Modes). The FEAROM methodology is developed based on the investigations of Franceschini and Galetto (2001) and Sellapan and Karuppusami (2009). The new logic synthesis expression for Risk Priority Code (RPC) to change the order of priority among indexes is the basis for our work. The new logics of synthesis expresses changed composition of the operators and tie-ranking rule which is different from the one proposed by Franceschini and Galetto (2001). It is appropriate to apply for finalizing mould designs in foundries during preproduction trials.
The proposed FEAROM model eliminates the drawbacks associated with the traditional FMEA and helps the FMEA team to implement consistent and suitable strategy to find the most favorable mould design in preproduction trials. The approach also enables the possibility of accounting the discriminating importance of the characteristic indexes. FEAROM method is capable of dealing with information expressed on an ordered qualitative scale. An artificial numerical conversion of the scale is not necessary. The proposed FEAROM model is a fuzzy multi-criteria decision-making (MCDM) method. Hence it has been validated using similar MCDM method called modified fuzzy TOPSIS (MFTOPSIS) method is interdependent to the AHP method. 2.0 SOLUTION METHODOLOGY
The proposed FEAROM approach is discussed in detail under this section. Also, the MFTOPSIS method hybrid with AHP used for validating the results of the FEAROM approach is discussed under this section. 2.1 FEAROM METHODOLOGY
Initially, the methodology uses the traditional FMEA to find the rank order of mould designs. The mould design that has the least RPN value is considered most important, next higher RPN value as second important and so on.
The FEAROM model advocates the decision making criteria to prioritize mould designs during the development stage of cast components. This method is suitable when the three index values, viz., S, O and D are considered equally important or different weights are given for each index by team members. The decision making criteria utilizes an ordered qualitative scale for data processing which have ordinal properties only. The proposed FEAROM model considers fuzzy subset to find the rank order of the mould designs in preproduction trials.
The projected FEAROM technique is proficient to deal with the circumstances when,
The ranking scale for S, O and D is assigned different values by the team members but
the indexes have the same maximum importance.
Two or more mould designs have the same RPN.
When three S, O, and D indexes are assumed with a different level of importance The evaluation criteria S, O and D are
denoted by Kj (with j = 1, 2, 3) while the alternative mould designs during development stage are denoted by Mi (with i = 1, …, m). The grade membership of alternatives Mi in Kj indicates the degree to which Mi satisfies the criterion specified. The FEAROM model suggests a two step procedure: Step 1: Calculate Risk Priority Code (RPC)
RPC (Mi) =
(2)
where RPC (Mi) is the Risk Priority Code for the
moulds design Mi
I (Kj) is the importance associated with each criterion Kj = Lk Lk is the kth level of the scale (refer Table 3) Kj(Mi) = Lij (refer Table 2)
From equation (2) it is evident that the Max operation selects the largest of its arguments. If all the arguments are low, they do not affect the Max operation. Consider a criterion that has more importance, it will get an importance rating of Lk that is high on the scale. When we take Min of the importance criteria with evaluation Kj (Mi) we still get a low score. Thus, it is clear that high-importance criterion have little effect on the overall score (based on Franceschini and Galetto, 2001.p 8).
The formulation suggested in the equation (2) satisfies the properties of Pareto optimality. The term [Min {(I (Kj), Kj (Mi)}] indicates that ‘if the criterion is important, then it has a low score’. The mould design with the most dangerous failure mode is the one with the highest RPC value. Step 2: Calculate Critical Failure Mode (CFM)
The CFM equation given below is used for determining the least RPC value. The mould design with the lowest RPC value is chosen as per FEAROM method.
CFM (M*) = (3)
where A is the set of failure modes of mould designs RPC (Mi) is defined on a new 10 point ordinal scale If two or more mould designs have the same critical failure mode, then the following equation is used for breaking the tie: T (Mi) = N (Mi) (4)
Where,

Life Science Journal 2013; 10 (2) http://www.lifesciencesite.com
http://www.lifesciencesite.com [email protected] 54
N (Mi) is the number of elements in the row corresponding to Mi for which Lij < CFM (M*) Let Lij denote the levels of S, O and D respectively corresponding to the mould designs Mi where i = 1, 2, 3… m and j = 1, 2, 3. Take 1≤ Lij ≤ 10 for all i, j. Lij precisely takes the levels {1,2, …, 10} in some order as shown in Table 2. Table 2. General form (Lij) of moulds design indexes and RPN
Moulds design S O D RPN M1 M2
.
.
. Mm
L11 L21
.
.
. Li1
L12 L22
.
.
. Li2
L13 L23
.
.
. Li3
R1
R2
.
.
. Rm
The importance rating and correspondence map for S, O and D, is mentioned in Table 3. These values are used in FEAROM model to rate the relative importance of S, O and D. Table 3. Correspondence map and Relative importance rating of S, O and D [Franceschini and Galetto, 2001]
Level (Lk)
S Index O Index D Index I(S,O,D)
L1 No Almost never
Almost certain
No
L2 Very slight Remote Very high Very low L3 Slight Very slight High Low L4 Minor Slight Moderate
high Minor
L5 Moderate Low Medium Moderate L6 Significant Medium Low Significant L7 Major Moderately
high Slight Major
L8 Extreme High Very slight
High
L9 Serious Very high Remote Very high L10 Hazardous Almost
certain Almost impossible
Absolute
2.3 Validation using Modified Fuzzy TOPSIS (MFTOPSIS) Method hybrid with AHP Method
The familiar fuzzy TOPSIS method has been modified to suit the selection of an appropriate mould design in foundries. The outcome of MFTOPSIS method is used to verify and validate FEAROM model. Hwang and Yoon (1981) were the first to develop the TOPSIS method for solving multiple criteria decision making problem. It is based on the concept that the chosen alternative should have the shortest distance from the positive ideal solution and the farthest from the negative ideal solution. Lai et al. (1994) used the TOPSIS method for solving a multi-criteria water quality management problem. Mohammed et al. (2012) used a new technique
named Information Entropy Weighting (IEW) combined with TOPSIS method to rank the consulting firm. Ali Akbar Farhangi et al., (2012) proposed a model to design the quality of Employee-Organization Relationships (EORs) based AHP method. Reza Kiani mavi et al., (2012) proposed a study to identify and prioritize the Effective Factors in Material Requirement Planning implementation using Fuzzy AHP method. Ali Dadaras Moghadam et al., (2012) used the TOPSIS method is interdependent to the AHP method in ranking the training methods that are used for sustainable agriculture. Suitably, the present paper considers the importance weight for each criterion in TOPSIS method is integrated to the AHP method. Analytic Hierarchy Process (AHP)
The AHP is used to provide weight criteria of decision factors to MFTOPSIS method. Thomas L. Saaty (1980) was the first to develop the AHP for decision making where objective is to select the best alternative. It is based on the concept that the inconsistencies in making subjective judgments are sorted out. AHP is a multi criteria decision-making method that can be used in both subjective and objective evaluation criteria. AHP allows the systematic consideration and evaluation of multiple decision criteria. The analytic hierarchy process involves pairwise comparisons of the decision elements. The use of AHP in solving a decision problem involves the following five steps [Francis and White, 1984]:
Step 1: Setup the decision hierarchy by breaking down the decision problem into a hierarchy of interrelated decision elements.
Step 2: Collect input data by pairwise comparison of decision elements.
Step 3: Use the eigenvalue method to estimate the relative weights of decision elements.
Step 4: Check for consistency using the consistency ratio (CR) is . µ is the largest positive eigen value. ACI is the average consistency index of randomly generated weights. According to Saaty, the values for ACI depended on the order (n) of the matrix and are as follows (first row is the order of the matrix; second row is the ACI value). 1 2 3 4 5 6 7 8 9 10
0 0 0.58 0.90 1.12 1.24 1.32 1.41 1.45 1.49
As a working rule of AHP, a CR value of 10% or less is acceptable.
The relative importance (weights) of the categories and criteria in the model for pairwise comparisons is established as follows: W = (Ln Li) + 1 (5)
where W = Weight or relative importance Ln and Li are any two criteria.

Life Science Journal 2013; 10 (2) http://www.lifesciencesite.com
http://www.lifesciencesite.com [email protected] 55
The relative importance is W when Ln > Li and it is 1/W when Ln < Li.
Each comparison in pair is made to evaluate the importance of one factor over another relative to the criteria to be evaluated at that point. In typical analytic hierarchy studies a nine-point scale is used as explained in Table 4.
Table 4. The Nine-point scale used by the AHP Intensity of importance
Definition explanation
1 Equal importance Two activities contribute equally to the objective
3 Weak importance of one
Experience and judgment over the other slightly favor one activity over the other
5 Essential or strong
Experience and judgment over the other strongly favor one activity over the other
7 Demonstrated importance
An activity is strongly favored and its dominance is demonstrated in practice
9 Absolute importance
The evidence favoring one activity over another is of the highest possible order
2, 4,6,8 Intermediate values
When compromise is between two adjacent needed judgments
Following steps are considered in
MFTOPSIS method (based on Pragati Jain, 2011). A set of m alternatives and n attributes are considered.
Step 1: Construct normalized decision matrix: Y = (yij) m x n matrix.
Normalize scores or data are as follows: =
for i = 1,2,3,…, m; j = 1,2,3,…,n Step 2: The weighted normalized decision
matrix is constructed by assuming a set of weights for each attribute wj for j = 1, 2, 3, …, n , such that, each wj(0,1) and =1 or simply it can be said that
each wj is a normalized fuzzy number Then, each column of the normalized
decision matrix is multiplied by its associated weight. An element of the new matrix is: vij = wj. rij
Step 3: The ideal and negative ideal solutions are determined.
Ideal solution: A* = {v1*,…, vn
*}, where vj*=
{ (vij) if jJ; (vij) if jJ'}
Negative ideal solution: A' = {v1',…, vn'}, where v' =
{ (vij) if jJ; (vij) if jJ'}
Let J be the set of benefit attribute or criteria (more is better) and J' be the set of negative attributes or criteria (less is better).
Step 4: The separation measures for each alternative is calculated The separation from the ideal solution is:
S1*= i = 1, …, m
Similarly, the separation from the negative ideal alternative is:
S1'= i = 1, …, m Step 5: The relative closeness to the ideal solution Ci
* is determined
Ci* = 0< Ci
*<1 The alternative to Ci
* closest to 0 is selected. 3. APPLICATION OF FEAROM THROUGH AN EXPERIMENTAL CASE STUDY
The study was carried out in the steel sand casting foundry called SHREE HARIE STEEL & ALLOYS located at Coimbatore city of India. The Bearing Housing, which is being manufactured using CO2 sand casting, is considered in this work. The Bearing Housing is made using ASTM A 352 WCB grade steel. The aim of this work is to predict and finalize the appropriate mould design in order to produce qualitatively superior castings. Three alternative mould designs (M1, M2 and M3) of bearing housing are considered by the industry during the preproduction trials as shown in Figures 1- 3. The pattern for the Bearing Housing is shown in Figure 4. The sample of inspection-ready fettled castings, which was made using one of the moulds discussed above, is shown in Figure 5.
Figure 1. Moulds Design one (M1) for Bearing Housing
Figure 2. Moulds Design two (M2) for Bearing Housing
Life Science Journal 2013; 10 (2) http://www.lifesciencesite.com
http://www.lifesciencesite.com [email protected] 56
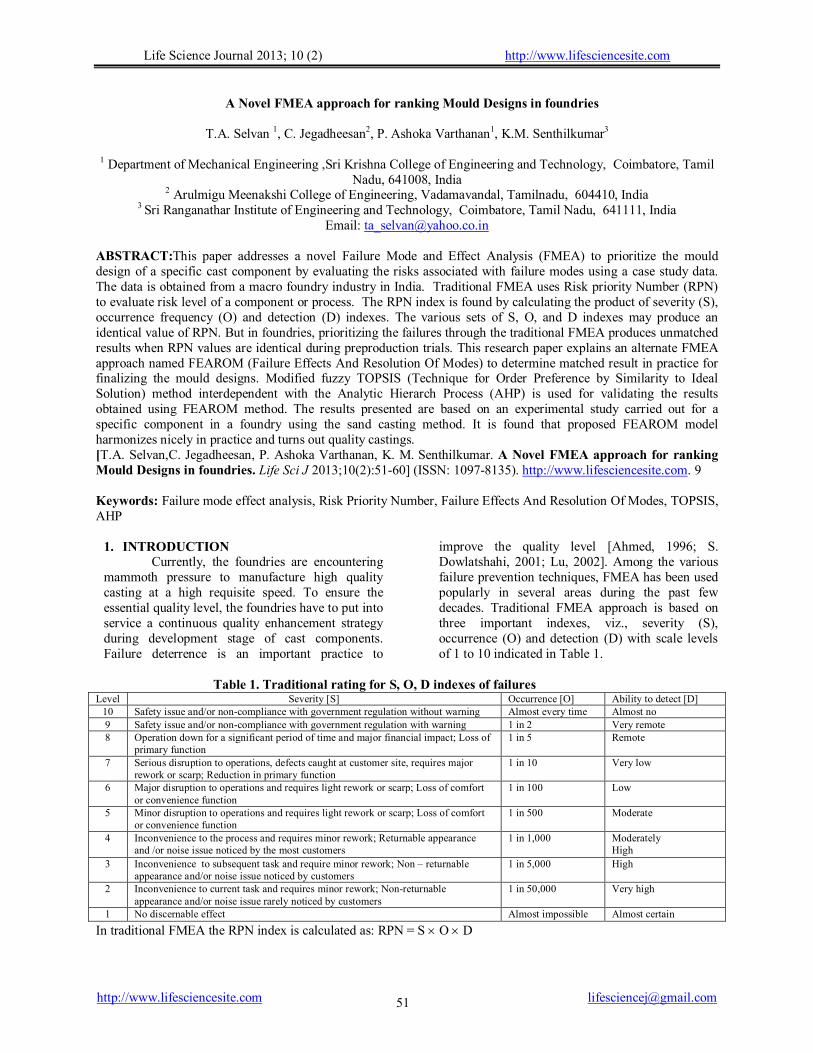
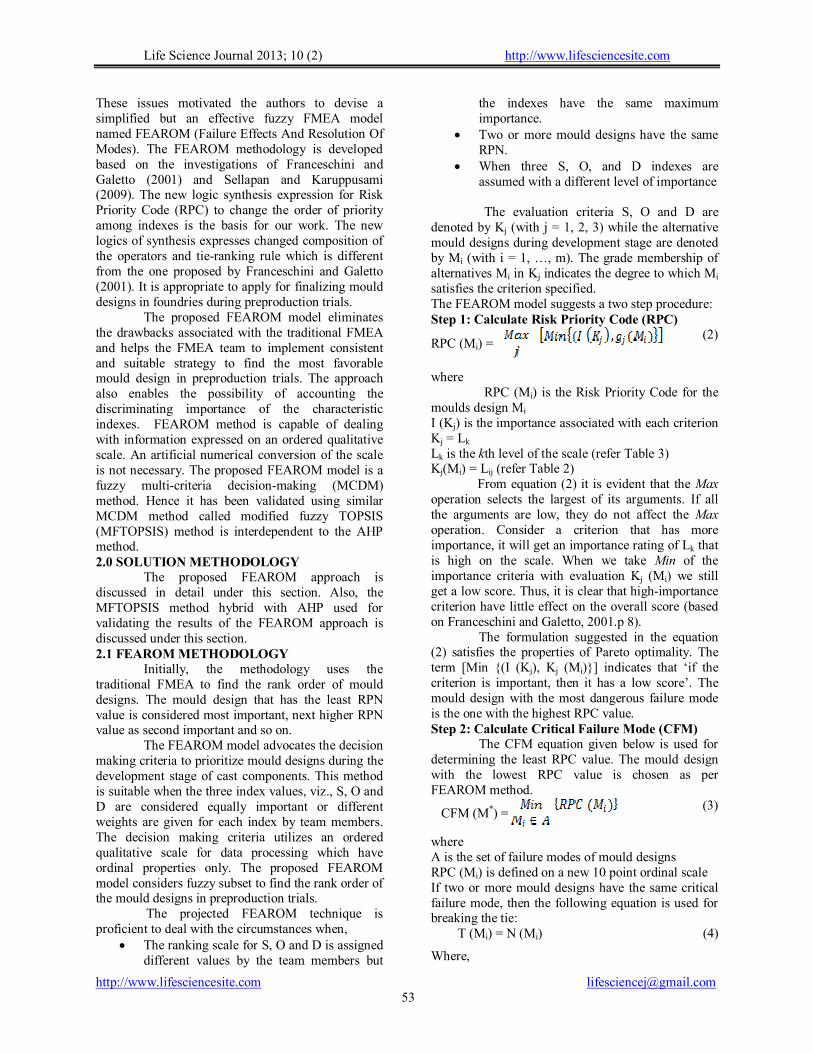
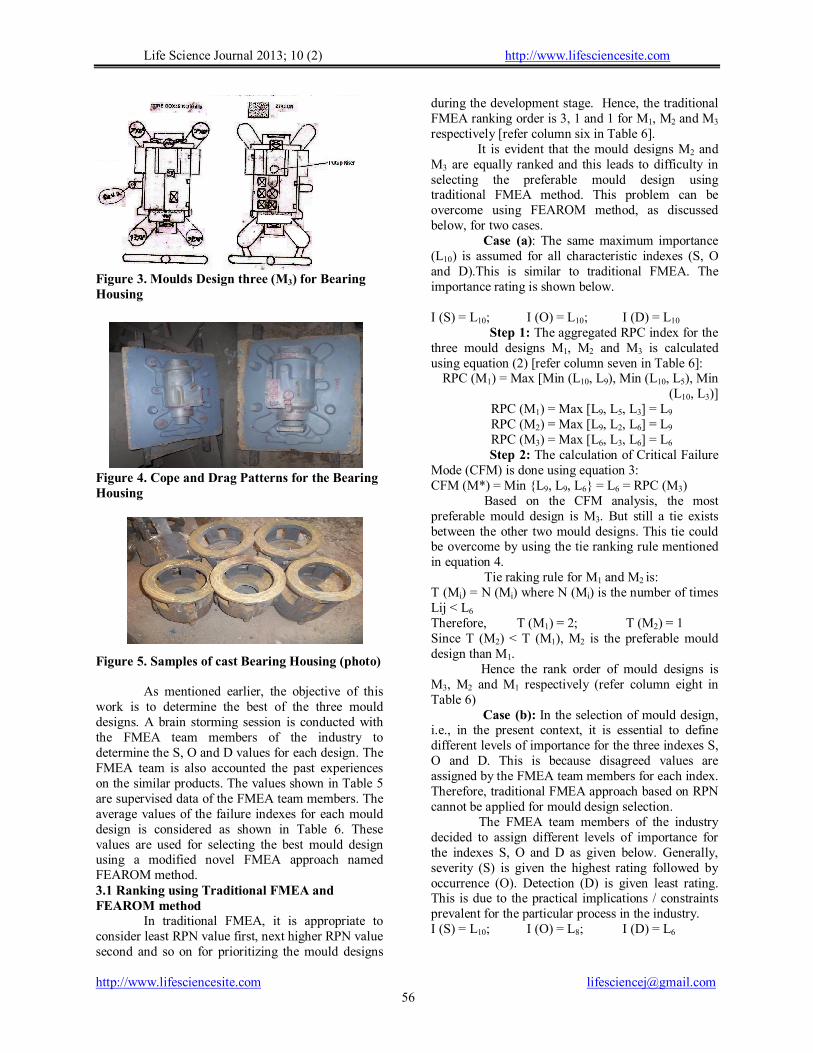
Figure 3. Moulds Design three (M3) for Bearing Housing
Figure 4. Cope and Drag Patterns for the Bearing Housing
Figure 5. Samples of cast Bearing Housing (photo)
As mentioned earlier, the objective of this
work is to determine the best of the three mould designs. A brain storming session is conducted with the FMEA team members of the industry to determine the S, O and D values for each design. The FMEA team is also accounted the past experiences on the similar products. The values shown in Table 5 are supervised data of the FMEA team members. The average values of the failure indexes for each mould design is considered as shown in Table 6. These values are used for selecting the best mould design using a modified novel FMEA approach named FEAROM method. 3.1 Ranking using Traditional FMEA and FEAROM method
In traditional FMEA, it is appropriate to consider least RPN value first, next higher RPN value second and so on for prioritizing the mould designs
during the development stage. Hence, the traditional FMEA ranking order is 3, 1 and 1 for M1, M2 and M3 respectively [refer column six in Table 6].
It is evident that the mould designs M2 and M3 are equally ranked and this leads to difficulty in selecting the preferable mould design using traditional FMEA method. This problem can be overcome using FEAROM method, as discussed below, for two cases.
Case (a): The same maximum importance (L10) is assumed for all characteristic indexes (S, O and D).This is similar to traditional FMEA. The importance rating is shown below.
I (S) = L10; I (O) = L10; I (D) = L10
Step 1: The aggregated RPC index for the three mould designs M1, M2 and M3 is calculated using equation (2) [refer column seven in Table 6]:
RPC (M1) = Max [Min (L10, L9), Min (L10, L5), Min (L10, L3)]
RPC (M1) = Max [L9, L5, L3] = L9 RPC (M2) = Max [L9, L2, L6] = L9 RPC (M3) = Max [L6, L3, L6] = L6
Step 2: The calculation of Critical Failure Mode (CFM) is done using equation 3: CFM (M*) = Min {L9, L9, L6} = L6 = RPC (M3)
Based on the CFM analysis, the most preferable mould design is M3. But still a tie exists between the other two mould designs. This tie could be overcome by using the tie ranking rule mentioned in equation 4.
Tie raking rule for M1 and M2 is: T (Mi) = N (Mi) where N (Mi) is the number of times Lij < L6 Therefore, T (M1) = 2; T (M2) = 1 Since T (M2) < T (M1), M2 is the preferable mould design than M1. Hence the rank order of mould designs is M3, M2 and M1 respectively (refer column eight in Table 6)
Case (b): In the selection of mould design, i.e., in the present context, it is essential to define different levels of importance for the three indexes S, O and D. This is because disagreed values are assigned by the FMEA team members for each index. Therefore, traditional FMEA approach based on RPN cannot be applied for mould design selection.
The FMEA team members of the industry decided to assign different levels of importance for the indexes S, O and D as given below. Generally, severity (S) is given the highest rating followed by occurrence (O). Detection (D) is given least rating. This is due to the practical implications / constraints prevalent for the particular process in the industry. I (S) = L10; I (O) = L8; I (D) = L6

Life Science Journal 2013; 10 (2) http://www.lifesciencesite.com
http://www.lifesciencesite.com [email protected] 57
By applying equation (2) to (4), the results obtained are shown in columns (9) and (10) in Table 6.
Further analysis of Table 6 has been described in section 4.
Table 5. Failure Mode and Effects Analysis Worksheet FMEA Team: Production manager, Moulds engineers, Quality engineer Team Leader: Quality assurance manager Component: Bearing Housing (A sand casting component)
S No
Moulds design brief details
Potential Failure Mode
Potential Effect(s) of Failure
Sev
erit
y Potential
Cause(s)/ Mechanism(s)
of Failure Occ
urr
ence
Detection method
Det
ecti
on
RP
N
1
METHOD 1 (M1) Runner: 35 x 25 Ingate: 30 x 20 Chills: 22 Nos No. of cores = 3 Riser: 90 x 150 – 2 Nos 75 x 150 – 3 Nos 50 x 150 – 1 No 100 x 150 – 1 No Yield: 46% (3 pieces)
Shrinkage is in section
Rejected at manufacturing
plant
10
Improper directional solidification due to inadequate risers feeding
6
Rad
iog
rap
hy
/ult
ras
on
ic
test
ing
/Mag
net
ic
par
ticl
e in
spec
tio
n
4
9 5 3
8 4 2
Average
9 5
3 135
2
METHOD 2 (M2) Runner: 35 x 25 Ingate: 30 x 20 Chills: 22 Nos No. of cores = 3 Riser: 90 x 150 – 2 Nos 75 x 150 – 3 Nos 50 x 150 – 1 No 38 x 100 – 1 No Yield: 49.5% (3 pieces)
Shrinkage is in
section
Rejected at manufacturing
plant
9
Inadequate riser feeding
3
R
adio
gra
phy
/Ult
raso
nic
te
stin
g
7
8 2 6
10 1 5
Average 9 2 6 108
3
METHOD 3 (M3) Runner: 35 x 25 Ingate: 30 x 20 Chills: 22 Nos No. of cores = 3 Riser: 90 x 150 – 2 Nos 75 x 150 – 3 Nos 50 x 150 – 1 No 38 x 100 – 1 No Put up riser introduced Yield: 47.5% (3 pieces)
Shrinkage is found in flange
Rejected at manufacturing
plant
7
Adequate riser is not present at flange portion
4 R
adio
gra
phy
/Mag
net
ic p
arti
cle
insp
ecti
on
8
5 3 6
6 2 4
Average 6 3 6 108
Table 6. Calculation of RPN and RPC indexes for the moulds designs
Mould Designs
(Yield)
Mean values of
RPN
FMEA
Rank order
FEAROM Case (a) Case (b)
RPC Rank Order
RPC Rank Order
S
O
D
I(S) = L10 I(O) = L10 I(D) = L10
I(S) = L10 I(O) = L8 I(D) = L6
(1) (2) (3) (4) (5) (6) (7) (8) (9) (10) M1
9 5 3 135 3 L9 3 L9 3
M2
9 2 6 108 1 L9 2 L9 2
M3
6 3 6 108 1 L6 1 L6 1
Note: I(S), I (O), I (D) are the importance associated with each index

Life Science Journal 2013; 10 (2) http://www.lifesciencesite.com
http://www.lifesciencesite.com [email protected] 58
3.2 Validation using MFTOPSIS Method hybrid with AHP Method
The same mould design cases solved using FEAROM method is also attempted using the MFTOPSIS method integrating with AHP Method.
Case (a): As applied for FEAROM approach, maximum importance (L10) is assumed for all the three characteristics indexes. The three mould designs M1, M2 and M3 are considered as alternatives and the indexes S, O, and D are the attributes. The relative weights are calculated as follows using AHP method:
AHP method: Relative weight between S and O, S and D and O and D is: (Ln Li) + 1 = (10 – 10) + 1 = 1 Step 1: Pairwise comparison matrix S O D S 1 1 1 O 1 1 1 D 1 1 1 Step 2: Formation of normalized matrix Elements value = original value (from pairwise matrix)/Total column value S O D Row average S 1/3 1/3 1/3 1/3 O 1/3 1/3 1/3 1/3 D 1/3 1/3 1/3 1/3 Step 3: The weights of various criteria are as follows: Severity (S) = 0.33 Occurrence (O) = 0.33 Detection (D) = 0.33 W = {S, O, D} = {0.33, 0.33, 0.33} Step 4: Check for consistency
=
= 3
The consistency ratio (CR) is = 0
Because CR value is less than 10%, the present matrix is consistent. MFTOPSIS Method: Weight of each attributes, W = {0.33, 0.33, 0.33}
Table 7. Preliminary entries Weight 0.33 0.33 0.33
Attributes S O D
Alternatives
M1 9 5 3
M2 9 2 6
M3 6 3 6
Step 1: Calculate (y2ij)
1/2 for each column and divide each column by that to get rij values (refer Table 8).
Table 8. rij = yij / ((yij)2)1/2
Weight 0.33 0.33 0.33
Attributes S O D
Alternatives
M1 0.64 0.81 0.33
M2 0.64 0.32 0.67
M3 0.43 0.49 0.67
Step 2: Multiply each column by wj to get vij = wj.rij (refer Table 9)
Table 9. vij = wj.rij
Weight 0.33 0.33 0.33
Attributes S O D
Alternatives
M1 0.2112 0.2673 0.1089 M2 0.2112 0.1056 0.2211 M3 0.1419 0.1617 0.2211
Step 3 (i): The ideal solution A* is determined by selecting the minimum value from column D and maximum values from columns S and O (from Table 9).
Thus A* = {0.2112, 0.2673, 0.1089} Step 3 (ii): The ideal solution A' is
identified by choosing the maximum value from column D and minimum values from columns S and O (from Table 9).
Thus A' = {0.1419, 0.1056, 0.2211} Step 4(i): The separation Si
* is determined for each row from ideal solution A* = {0.2112, 0.2673, 0.1089} (refer column two of Table 10)
Step 4(ii): Similarly, separation Si’ is determined for each row from ideal solution A’ = {0.1419, 0.1056, 0.2211} for each row (refer column three in Table 10)
Step 5: The relative closeness to the ideal solution (Ci*) is calculated using the equation
Ci* = (refer column four of Table 10)
The value of Ci* for Mould Design M3 is
0.25. This is the closest value to 0. Therefore, Mould design M3 is the best alternative.
Case (b): The indexes S, O and D having importance of 10, 8, and 6 respectively are considered in consistent with FEAROM case (b). The set of relative weight (W) is computed using AHP method. The result obtained is as follows.
W = {S, O, D} = {0.633, 0.261, 0.106} The MFTOPSIS method discussed above is
applied for this case also. The results obtained for this case is shown in Table 11. Again, for the weights allotted by the FMEA design team, the alternative M3 is chosen as the Ci
* value 0.21 is the one closest to 0.
Life Science Journal 2013; 10 (2) http://www.lifesciencesite.com
http://www.lifesciencesite.com [email protected] 59
4. RESULTS AND DISCUSSIONS As discussed in the previous sections, a
modified FMEA approach termed FEAROM is applied for selecting the best mould design out of three alternatives. The detailed data related to the Bearing Housing sand casting given in Table 5 is used for identifying the best mould design. The best mould design is selected using FEAROM method based on the calculated RPC values (shown in Table 6). Two different cases are solved using FEAROM method. One is considering equal importance for all the three indexes (S, O and D) and the other is considering different importance ratings for S, O and D. The former case alone can be solved using the traditional FMEA approach. Traditional FMEA cannot be applied for the later case. But the proposed FEAROM methodology can solve both the cases.
FEAROM selects the mould design M3 in both the cases.
Analysis of the data in Table 6 reveals that the mould design M3 is ranked as first in both case (a) and case (b) using FEAROM model. But the mould design M2 and M3 are ranked as first using traditional FMEA method (refer Table 6). This leads to difficulty in selecting the best mould design.
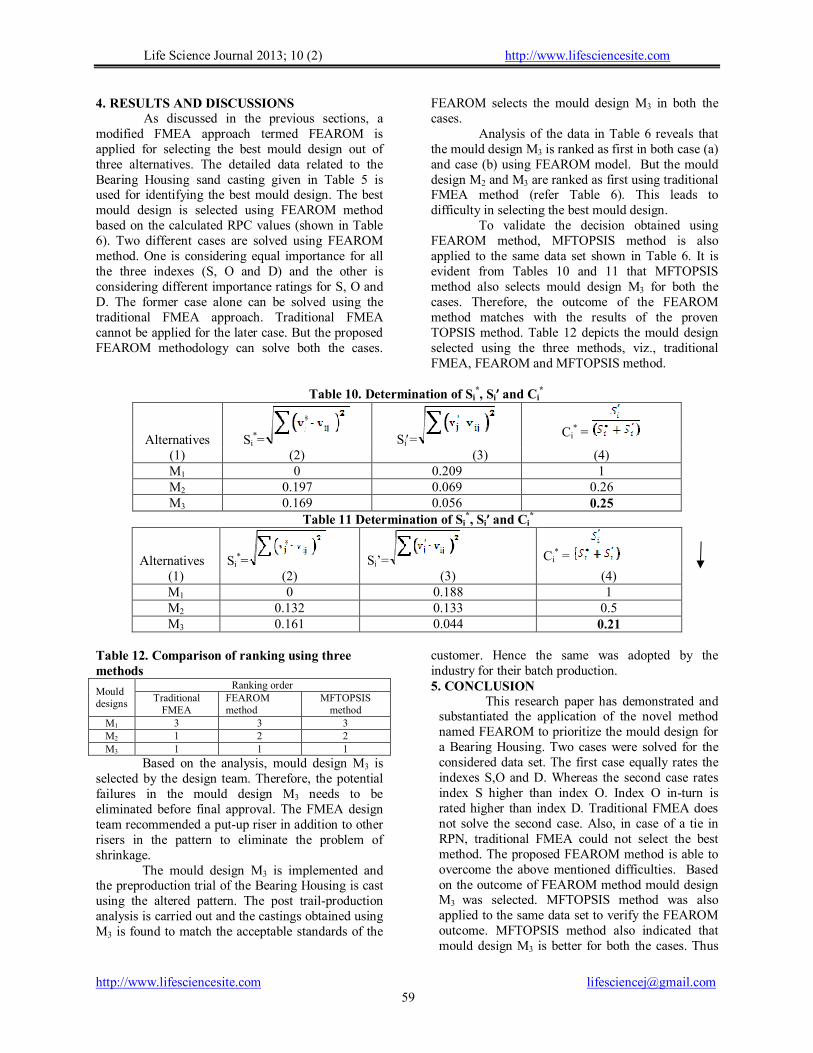
To validate the decision obtained using FEAROM method, MFTOPSIS method is also applied to the same data set shown in Table 6. It is evident from Tables 10 and 11 that MFTOPSIS method also selects mould design M3 for both the cases. Therefore, the outcome of the FEAROM method matches with the results of the proven TOPSIS method. Table 12 depicts the mould design selected using the three methods, viz., traditional FMEA, FEAROM and MFTOPSIS method.
Table 10. Determination of Si
*, Si’ and Ci*
Alternatives Si*= Si=
Ci* =
(1) (2) (3) (4) M1 0 0.209 1 M2 0.197 0.069 0.26 M3 0.169 0.056 0.25
Table 11 Determination of Si*, Si’ and Ci
*
Alternatives Si*= Si’= Ci
* =
(1) (2) (3) (4) M1 0 0.188 1 M2 0.132 0.133 0.5 M3 0.161 0.044 0.21
Table 12. Comparison of ranking using three methods
Mould designs
Ranking order Traditional
FMEA FEAROM method
MFTOPSIS method
M1 3 3 3 M2 1 2 2 M3 1 1 1
Based on the analysis, mould design M3 is selected by the design team. Therefore, the potential failures in the mould design M3 needs to be eliminated before final approval. The FMEA design team recommended a put-up riser in addition to other risers in the pattern to eliminate the problem of shrinkage.
The mould design M3 is implemented and the preproduction trial of the Bearing Housing is cast using the altered pattern. The post trail-production analysis is carried out and the castings obtained using M3 is found to match the acceptable standards of the
customer. Hence the same was adopted by the industry for their batch production. 5. CONCLUSION
This research paper has demonstrated and substantiated the application of the novel method named FEAROM to prioritize the mould design for a Bearing Housing. Two cases were solved for the considered data set. The first case equally rates the indexes S,O and D. Whereas the second case rates index S higher than index O. Index O in-turn is rated higher than index D. Traditional FMEA does not solve the second case. Also, in case of a tie in RPN, traditional FMEA could not select the best method. The proposed FEAROM method is able to overcome the above mentioned difficulties. Based on the outcome of FEAROM method mould design M3 was selected. MFTOPSIS method was also applied to the same data set to verify the FEAROM outcome. MFTOPSIS method also indicated that mould design M3 is better for both the cases. Thus

Life Science Journal 2013; 10 (2) http://www.lifesciencesite.com
http://www.lifesciencesite.com [email protected] 60
validation of FEAROM model was made. The preproduction trials were carried out using the proposed mould design M3 and the quality of the obtained castings was found to be good. Therefore, FEAROM method can be used for finalizing the mould design for similar sand casting components in future orders during their preproduction trials. The method is also easy to apply and can be used for making multi-criteria decision quickly. References [1] J.U. Ahmed (1996) Modern approaches to product
reliability improvement. Int. J. Qua and Reli.Mgt. 13: 27-41.
[2] S. Dowlatshahi (2001) The role of product safety and liability in concurrent engineering. Comp. Ind. Eng. 41: 187- 209.
[3] Y. Lu (2002) Analyzing the reliability problems in concurrent fast product development processes. PhD thesis, National University, Singapore.
[4] J.B. Bowles and R.D. Bonnel (1998) Failure mode, effects and criticality analysis – What it is and How to use it. Proceedings of IEEE Annual Reliability and Maintainability Symposium, New York: p.56.
[5] J. B.Bowles (2003) An assessment of RPN prioritization in failure modes, effects and criticality analysis. Proceedings of IEEE Annual Reliability and Maintainability Symposium, New York: p.380.
[6] K. Xu, L.C. Tang, M.Xie, S.L. Ho and M.L. Zhu (2002) Fuzzy assessment of FMEAfor engine systems. Reliability Engineering and system safety 75: 17-29.
[7] R.K. Sharma, D. Kumar and P. Kumar (2005) Systematic failure mode and effect analysis using fuzzy linguistic modeling. Int.J. of Qua. Reli.Mgt. 22(9): 611-619.
[8] Y.M. Wang, K.S. Chin, G.K. Kwai Poon, J. B. Yang (2009) Risk evaluation in failure mode and effects analysis using fuzzy weighted geometric mean. Expert System Applications, Int. J. 36: 1195-1207.
[9] B. K. Wong, V.S. Lai (2011) A survey of the application of fuzzy set theory in production and operations management: 1998 – 2009. Int. J Prod. Eco. 129: 157-168.
[10] C.L. Chang, C.C. Wei, Y.H. Lee (1999) Failure mode and effects analysis using fuzzy method and grey theory. Kybernetes 28: 1072- 1080.
[11] F. Franceschini, M. Galetto (2001) A new approach for evaluation of risk priorities of failure modes in FMEA. Int. J. Prod. Res. 39: 2991- 3002.
[12] N. Sellapan G. Karuppusami (2009) A New Approach for Prioritization of Failure Modes in Design FMEA using ANOVA. World academy Science, Eng. Tech. 49: 524- 531.
[13] L.H. Chen W.C. Ko (2009a) Fuzzy linear programming models for new product design using QFD with FMEA. Appl. Math. Mod. 33: 633-647.
[14] L.H. Chen, W.C. Ko (2009b) Fuzzy approaches to quality function deployment for new product design. Fuzzy Sets and Systems 160: 2620-2639.
[15] Zhang, Z. F., Chu, X. N. (2011) Risk prioritization in failure mode and effects analysis under uncertainty. Expert Syst. Appl. 38: 206-214.
[16] Bowles, J. B, Pelaez, C. E. (1995) Fuzzy logic prioritization of failures in a system failure mode, effects and criticality analysis. Reli. Eng. Sys. safety 50: 203-213.
[17] Braglia, M, Frosolini, M Montanari, R (2003) Fuzzy criticality assessment model for failure modes and effects analysis. Int. J. Qua.& Reli. Mgt. 20 (4):503-524.
[18] Garcia, P.A.A., Schirru, R., Frutuoso, P.F. Melo, E. (2005) A Fuzzy data envelopment analysis approach for FMEA. Progress in Nuclear Energy 46(3-4): 359-373.
[19] Guimaraes, A.C.F., and Lapa C.M.F. (2004) Effect analysis fuzzy inference system in nuclear problems using approximate resoning. Analysis of Nuclear Energy 31(1): 107-115.
[20] Pillay, A. Wang, J. (2003) Modified failure mode and effects analysis using approximate reasoning, Reli. Eng. Sys. safety; 79:69-85.
[21] Y. J. Lai, T.Y. Liu., C. L. Hwang. (1994) TOPSIS for MODM, Euro. J. Oper. Res. 76: 486-500.
[22] Pragati Jain (2011) The key of managerial problems in fuzzy world: Technique of order preference by similarity to ideal solution, Asian J. Mgt. Res. 2: 149-15.
[23] Thomas L Satty, The Analytic Hierarchy Process, Planning, Priority setting, Resource Allocation. McGraw Hill, New York, 1980.
[24] R.L. Francis and J.A. White (1984). Facilities Layout and Location – An analytical approach. PHI. 21-55.
[25] Mohamed F. El-Santawy and A. N. Ahmed (2012) An Information Entropy Weighting Method Combined to TOPSIS Approach for Ranking Consulting Firms. Life Sci. J. 9(1s):147-150.
[26] Ali Dadaras Moghadam, Nona Ghanaat, Adel Ranji, Babak Mohammadi Sharafshade (2012) Ranking effective factors of training in basis of sustainable agriculture promotion using TOPSIS method. Life Sci.J. 9(4):886-890.
[27] Ali Akbar Farhangi, Sara moazen, Maryam Aliei (2012) Designing A Model For Quality of Employee-Organization Relationships (EORs) Based On Analysis Hierarchical Process (AHP). Life Sci. J. 9(1):231-241.
[28] Reza Kiani mavi, Kiamars Fathi Hafshejani, Hamid Bahrami, Davood Gharakhani (2012) Identifying and Prioritization effective Factors in MRP implementation Using FAHP Approach. Life Sci. J. 9(4):946-951.
2/22/2013