life-history evolution in hymenopteran parasitoids - universiteit leiden
TRANSCRIPT
Life-history evolution in hymenopteran parasitoids the roles of host and climate
To, my family, Laleh, Kaveh and Keyvan
Majeed Askari Seyahooei
Life-history evolution in hymenopteran parasitoidsthe roles of host and climate
Thesis Leiden University
Cover design and layout : René Glas (www.reneglas.com)Printed by : Offsetdrukkerij Nautilus, LeidenCover-photo Asobara japonica : Herman Berkhoudt
© 2010 Majeed Askari Seyahooei
ISBN/EAN: 978-90-9025045-8
Life-history evolution in hymenopteran parasitoids the roles of host and climate
Proefschriftter verkrijging van
de graad van Doctor aan de Universiteit Leiden,op gezag van de Rector Magnificus prof. mr. P.F. van der Heijden,
volgens het besluit van het College van Promotieste verdedigen op donderdag 3 februari 2010
klokke 13.45 uur
door
Majeed Askari Seyahooei
Geboren te Bandar Abbas, Iranin 1967
P r o m o t i e c o m m i s s i e
Promotor : Prof. dr. J. J. M. van Alphen
Copromotor : Dr. Ken Kraaijeveld
Overige leden : Prof. Dr. Paul M. Brakefield Prof. Dr. Jacintha Ellers Prof. Dr. Peter Kinkaamer Dr. Tom van Dooren
The research described in this thesis was funded by the Agriculture Research and Education Orga-nization (AREO) of Iran under Ministry of Agricul-ture.
C o n t e n t s
Chapter 1 General introduction and conclusion
Chapter 2 Closely related parasitoids induce different pupation and foraging responses in Drosophila larvae
Chapter 3
The Lack of correlation between developmental time and adult life span in parasitoids: the role of meta-bolic rate and fat reserves
Chapter 4
Adult size and early investment in reproduction in five species of Asobara parasitoid
Chapter 5 Genetic structure of Leptopilina boulardi populations from different climatic zones of Iran
Chapter 6 Local adaptation in life history traits of Leptopilina boulardi populations from different climate zones of Iran
References Appendices
Curriculum Vitae
7
19
39
55
73
89
111
135
143
7
C h a p t e r 1
General introduction and discussion
Life-history theory
Life-history theory predicts the existence of constraints and trade-offs between traits contributing to the fitness of an organism. Constraints reduce the flexibility in the evolution of particular combinations of traits (Roff 1992). A trade-off means that a trait can only increase in value at a cost to another trait. For instance, natural selection may favor an increased reproductive rate, but this may be impeded by a trade-off between reproduction and survival. Due to this trade-off any increase in reproductive rate will come at a cost to survival rate or vise versa (Roff 1992, Stearns 1992). This trade-off can be studied by measuring traits that are directly related to reproductive rate and survival such as age-specific fecundity, age and size at maturity, size at birth, number of offspring and survival rate. Traits that affect fitness indirectly, such as resource acquisition and allocation, foraging behaviour, stress tolerance, resisting parasite or predator, competitiveness are also considered life history-traits (Jervis et al. 2005; Maeda 2006; Steiner and Pfeiffer 2007). Life-history theory deals with analyzing variation in these traits and investigates relationships between them. The central aim is to establish how variation in life-history traits may lead to variation in fitness of individuals. Life-history theory views organisms from both ecological and evolutionary perspectives (Roff 1992).
Natural selection on life-history traits
Natural selection acts upon fitness-related variation in phenotypes. Given additive genetic variation, trait values that enhance fitness will increase in frequency over time (Fisher 1930). Fitness in general is defined as the ability of individuals to survive and reproduce in a given environment (Brwon 1993). Fitness thus reflects the contribution of that each individual makes to the gene pool of the next generation (King and Standsfield 1990; Daan and Tinbergen 1997; Sober, 2001; Orr 2009). Genetic variation in fitness is the raw material for natural selection without which adaptation can not occur (Orr, 2009). Two different fitness measures are used in evolutionary studies: global fitness and local fitness. Global fitness is the overall fitness of an organism that includes all the interactions between traits contributing to fitness. In other words global fitness is the balance between different fitness components. Global fitness has frequently been
8
Life-history evolution in hymenopteran parasitoids: the roles of host and climate
Chapter 1 General introduction and discussion
assumed to be identical to lifetime reproductive success (R0) in stable populations or to the intrinsic population growth rate (r) in growing populations (Roff 1981; Charnov and Berrigan 1991; Fox and Wolf 2006). Local fitness is the fitness of each component independently and can be use instead of global fitness only if overall fitness increases with local fitness (Roff 1992).
Life-history traits can vary enormously between and within species. For example, different species of flatfishes may range in body size from 2 cm to 200 cm and in age at maturity from less than one to over 10 years (Roff 1992). Another example is variation in clutch size in birds which ranges from one egg per clutch in albatrosses to nine eggs per clutch for geese species. Some impressive variation in life-history traits at the intraspecific level has also been documented. For example, members of one population of the flatfish Hippoglossoides platessoides averaged 25 cm in body length and took 6 years to reach maturity, while in another population the fish measured 60 cm and took over 20 years to reach maturity (Roff 1992). Similarly, age at maturity in the European minnow, a freshwater fish, ranged from one to seven years (Mills 1988). Such variation in life-history traits may be subject to natural selection and result in genetic and phenotypic differences between populations and even speciation when populations have diverged dramatically in the long term. Such continuous spectrum of change in life-history traits is called life-history evolution.
Reproductive success: the main target of selection
In many studies reproductive success has been used to represent global fitness (e.g., Roff 1981; Charnov and Berrigan 1991; Fox and Wolf 2006). Evolution is th result of natural selection favoring individuals with high global fitness. If we equate increase in global fitness with increased reproductive success then the main product of evolution is optimization of reproductive success. Life-history theory predicts a trade-off between reproduction and survival (Roff 1992). This means that the potential increase in reproductive rate in a given environment is limited by the imposed cost on survival rate. As a consequence, a balance between reproduction and survival is inevitable. This trade-off may be observed in nature in different forms, the simplest being a negative relationship between the number of young produced and the parent’s survival (Reznik 1985; Roff 1992). It can also be seen as a negative relationship between the number of offspring and the size of the offspring (Williams 1966; Smith and Fretwell 1974; Gustafsson and Suderland 1988; Roff 1992) or between time or resources spent on current versus future reproduction (Godfray 1987; Ackerman and Eadie 2003; Ellers and Jervis 2003, 2004). To maximize reproductive success, organisms must balance reproduction and survival optimally. The question of how individuals maximize reproductive success in a given
9
General introduction and discussion
environment is thus a fundamental question in evolutionary ecology. The maximization of reproductive success is influenced by different factors. The strength and importance of each factor can be determined by the environment. I will discuss some important factors affecting reproductive success in different environments.
Resource acquisition and allocation
One of the main factors influencing reproductive success is resource acquisition and allocation (e.g., de Jong and van Noordwijk 1992; Tanaka 1996). Life-history theory also predicts that resource availability shapes life-history-traits and drives the evolution of organisms (Roff 2002). If resource acquisition and allocation can change the fitness of organisms then it is expected to be subject to natural selection. A considerable number of life-history studies have been devoted to resource acquisition, allocation and the resulting optimal balance between life-history traits (e.g., van Noordwijk and de Jong 1986; Engen and Saether 1994; Worley et al. 2003; Jervis, et al. 2008). Resource acquisition often has been studied as a component of the foraging behaviour of animals. Foraging determines resource intake by the organism. A wide variety of animal foraging strategies has been reported both inter and intraspecifically (Gray and Hodgson 1997; Caldow et al 1999; Jia et al 2002; Cooper 2005). Boggs (1992) suggested that foraging is linked with life-history and must be studied together with resource allocation to provide a better understanding of population dynamics in contrasting environments. Variation in foraging strategies may change the pattern of resource allocation dramatically in different populations or individuals within the same population (Weimerskirch, et al 1997). Resource distribution patterns in the environment and competition between individuals within species also may change foraging strategies and resource intake rates (Sutherland 1996). Efficient foraging strategies may help organisms to overcome the competition between individuals of the same species (Caldow et al 1999). Variation in foraging may affect the fitness of individuals and consequently result in natural selection and potentially the diversification of populations. Many studies reported spatial or temporal partitioning in the foraging patterns of coexisting species under resource limitation (Shargal et al 2000; Hadiprakarsa and Kinnaird 2004). Niche partitioning is the result of long term evolution of traits which allow organisms to exploit distinct ecological niches and allows the coexistence of competitor species in same habitat. For example, differences in the combination of enzymes allows species to prefer different diets (Voytek and Joyce 2009). It is obvious that the presence or absence of a coexisting competitor in different habitats can drive the evolution of populations of the same species in different directions.
Allocation of resources to different traits strongly influences the
10
Life-history evolution in hymenopteran parasitoids: the roles of host and climate
Chapter 1 General introduction and discussion
fitness of an organism. We have already mentioned that the spatial or temporal distribution of resources influences foraging behaviour and thus resource intake rate (Roff 2002). The availability of resources is a habitat characteristic that may differ between environments. The allocation of limited obtained resources to competing traits can play a fundamental role in fitness of organisms. Many organisms are adapted to a narrow environmental range and may perform poorly in different habitats (Nagy 1970; Fenster and Galloway 2000). Different combinations of trait values may be optimal in different environments. For example, there is evidence for differences in reproduction and survival for birds in different habitats (Clark and Shutler 1999). Habitat specific resource allocation strategies may improve the fitness of individuals. One of the main challenges of evolutionary ecology is to understand the optimal strategies for resource acquisition and allocation. This optimal strategy can vary drastically depending on the habitat and resource distribution patterns. First we need to understand the role of habitat in life-history evolution. A habitat is a combination of biotic and non-biotic factors which form the environment of each organism. Interaction of the organism with both biotic (other species) and abiotic (climate factor and geographical structure) factors can shape its life-history traits. This thesis focuses on the role of hosts as the main biotic factor, and climate as the main abiotic factor in the evolution of life-histories in parasitoids.
Hymenopteran parasitoids
Parasitoids are a group of insects which lay their eggs on or inside the body of preimaginal (and rarely adult-) stages of other insects (egg, larva or pupa) and complete their development by consuming the host tissue, eventually killing their host (Godfray 1994, Quicke 1997). Juvenile parasitoids inhabit a single host from early life to maturity which results in an intimate relationship between parasitoid and host (Godfray 1994). Different groups have been defined within parasitoids, depending on their life style. Idiobionts are a group of parasitoids that start consuming their host immediately after parasitism, while koinobionts allow their host to continue feeding and increase in size. Endoparasitoids define a group of parasitoids that live and feed inside the host body incontrast ectoparasi-toids that live and feed externally on the host. Parasitoids have also been categorized based on the stage of the host which they attack for example egg, larval (nymph) or pupal parasitoids (Godfray 1994, Quicke 1997). Parasitoid life styles are predominantly found in two orders of Insecta. The greatest diversity of parasitoids occurs in the Hymenoptera, with a substantial minority in the Diptera. Much smaller numbers are found in other orders, e.g. in the Coleoptera. Parasitoids can in some cases control insect populations and are often used as biological control agents of insect pests on agricultural crops in field. Studies of the cues that parasitoids use to find their host gained them prominence in the scientific study of
11
General introduction and discussion
animal behaviour (Godfray and Shimada 1999). Using hosts- parasitoid as a model system provided an opportunity to test population dynamic models. Godfray (1994) reviewed most of these studies and many new studies have been published since then (Quicke, 1997; Tilman & Kareiva, 1997; Wilson and Hassell 1997; Turchin, 1998; Dieckmann et al., 2000; Ellers et al. 2000b; Schofield et al. 2002; Rivero and West 2002; Lett et al. 2003; Rivero and West 2005; Liu et al 2009). Studies on host-parasi-toid relationships have made valuable contributions to evolutionary eco-logy. Examples include the optimization of foraging strategy according to different host distribution patterns and environmental factors (e. g., Vet et al. 1990; Schofield et al. 2002) and in the role of habitat stochasticity in energy allocation strategy (e. g., Ellers et al. 2000b). Furthermore, comparative studies on host-parasitoid interactions have provided a spec-tacular evolutionary view of this interaction and the co-evolution of these organisms. Some well known examples of host parasitoid interactions are geographical variation in parasitoid virulence and host defense systems (Kraaijeveld and van Alphen 1994; Kraaijeveld and van Alphen 1995) or superparasitism as an adaptive strategy in parasitoids (Alphen and Visser, 1990; Kraaijeveld et al.,1995). All of these aspects have made parasitoids an excellent model system to study ecology and evolution.
Life-history traits in parasitoids
There is a substantial body of literature on parasitoid life-history (e. g., Price 1973; Blackburn 1991; Godfray 1994; Kraaijeveld & van der Wel, 1994; Jervis 2001; Ellers and Jervis 2003; Jervis et al 2003 Rivero and West 2005). Hymenopteran parasitoids show huge variation in life-history traits. For instance, the ectoparasitic wasp Sericopimpla sericata (Ichnieumonidae) measures 12 mm, lives up to 140 days and lays only 30 relatively large eggs (2 mm) in its entire life. By contrast, the endoparasitic wasp Trioxys complantus (Braconidae) is only 1.3 mm long, lives 28 days and lays 180 small eggs (0.1 mm) during its lifetime (Mayhew and Blackburn 1999). Astonishing variation in reproductive strategy was also reported for two hyperparasitoids of Cotesia glomerata, Gelis agilis and Lysibia nana. The former has large eggs, long life-span and few progeny per day but performed with similar efficiency as the latter which is reversed in all these traits (Harvey 2008). Although intraspecific variation in life-history traits of parasitoids is much smaller in scale compared to interspecific variation, still considerable life-history variation has been reported among populations of the same species. Variation in reproductive success and allocation to early life reproductive was observed for Asobara tabida populations along a geographic cline (Kraaijeveld & van der Wel, 1994). A quantitative genetic study also showed heritable variation in fecundity of the parasitoid Anagrus delicates (Cronin and Strong 1996). Studies have shown size dependent variation in life-span and fecundity
12
Life-history evolution in hymenopteran parasitoids: the roles of host and climate
Chapter 1 General introduction and discussion
of parasitoid individuals (Ellers and Jervis 2003; Jervis et al. 2003; Jervis and Ferns 2004; Thorne, et al. 2006).
Parasitoids should optimize their reproductive strategy by maximizing the number of eggs laid before the end of their life. This means that both time limitation, i.e. coming to the end of life with unlaid eggs left in their body, and egg limitation, i.e. finishing their eggs much earlier than the end of life, could both play a role in parasitoids (Ellers 1998). The optimization of reproduction has been the focus of many life-history studies in parasitoids in both ecological and physiological contexts. Timing of reproduction (age-specific fecundity) is an important component of the reproductive strategy of parasitoids. Parasitoids were initially divided into two groups based on their reproductive strategy. Pro-ovigenic species emerge with all eggs mature, while in synovigenic species, none or only a portion of eggs are mature at emergence (Flanders 1950). Synovigenic parasitoids are able to adjust the timing of egg maturation from early to later in life time. In fact, a continuum of strategies exists between these extremes, which is expressed as the index of ovigeny (Jervis et al. 2001). Timing of egg maturation shows a negative relationship with body size and a positive relation with habitat stochasticity (Ellers 1996; Ellers et al. 2000b; Ellers and Jervis 2003; Jervis et al. 2003; Jervis and Ferns 2004; Thorne, et al. 2006).
Resource allocation in parasitoids has been studied in both ecological and physiological contexts and has been reviewed recently by Jervis et al. (2008). Different nutrients (e.g. sugar, glycogen, lipid and protein) play different roles in locomotion or ovigenesis. Stored lipids are important in both ovigenisis and somatic function in parasitoids (Ellers 1996; Ellers et al. 1998; Pexton and Mayhew 2002; Casas et al. 2005; Rivero and West 2005). The lack of lipogenesis in adult parasitoids results in a key role for lipid allocation. A trade-off in lipid allocation to initial reproduction and fueling soma have been demonstrated both inter and intraspecificly for hymenopteran parasitoids (Ellers and van Alphen 1997; Pexton and Mayhew 2002). The cost of future reproduction on teneral lipid reserve was also shown for synovegenic parasitoids (Ellers et al. 2000b). Plasticity in resource acquisition and utilization, for example through adult host feeding or egg resorption may mask this trade-off (Jervis et al 2001, Jervis and Kidd 1986; Burger et al 2004; Heimpel and Collier 1996). The effect of host feeding on female fecundity varies between parasitoid species (Ueno and Ueno 2009). Resource allocation plays a pivotal role in intertrait correlations because of trade-offs in allocation of resources to different traits. In this thesis, I examine variation in resource allocation in hymenopteran parasitoids in relation to climate and host.
Climate
The ecological and evolutionary effects of climate on life-history
13
General introduction and discussion
traits have taken on a special relevance in the light of recent concerns over climate change (e.g., Stenseth and Mysterud, 2002, Stenseth et al. 2002; Winkler et al. 2002; Stenseth and Mysterud, 2005). A wide range of me-teorological factors contribute to form the climate. The strength of each factor may vary between climates. The Islamic Republic of Iran consists of a wide variety of climates. A study on the climatic regions of Iran analyzed the contribution of 27 factors to the variance in climate and identified six as the main climatic factors: temperature, humidity, precipitation, clou-diness, wind and thunder (Masoodian 2003). Among these, temperature and humidity are widely regarded as the most important components of climatic variation (Gorshkov and Makarieva 2002). In life-history studies too, temperature has been mentioned as a key factor affecting the fitness of a wide range of organisms (Roff, 2002). The effect of temperature on life history traits of different organisms has been well documented in many studies (e.g., Johnston and Benneth, 1996; Dahlgaard et al. 2001; Clarke, 2006). The role of temperature on insect life history traits include the increase of some traits with increasing temperature (Nespolo et al. 2007; Stelgenga and Fischer 2007; Karl and Fischer, 2008) or reduction of the traits with increasing temperature during development (Bazzocchi at al. 2003; Karl and Fischer, 2008; Nilssen 1997; Dhileepan at al., 2005; Colinet at al. 2007; Fischer et al. 2003). Climate may affect parasitoid life-history directly or indirectly by altering the life-history traits of the host. Both of these will be addressed in this thesis. Among the climatic factors that will be discussed are frost and drought. Frost can play a crucial role in shaping life-history traits of organisms (Inouye 2000). Dramatic declines in nutrient reserves (mainly in lipid content) under desiccation and cold stress have been documented for insects (Downer and Matthews 1976, Udonsi 1984, Djawdan et al. 1997, Minois and Le Bourg 1999, Colinet et al 2006). In nature, adult hymenopteran parasitoids can obtain carbo-hydrates from nectar. Carbohydrates and moisture are essential determi-nants of lifespan for many hymenopteran species (Lewis et al 1998). The availability of food sources in nature may not only affect the longevity of parasitoids but also their fecundity (Hagley and Barber 1992; Olson, D. L. and Nechols 1995). The patterns of nectar availability can be highly di-verse in nature due to climate. A lack of a carbohydrate sources in nature can result in starvation of parasitoids (Jones and Jackson 1990; Jervis et al. 1996;Williams and Roane 2007). The evolution of life-history traits in hymenopteran parasitoids is affected by climate in many different ways. It therefore requires broad-scale research to understand the evolutionary aspects of climate and climate change in hymenopteran parasitoids.
Host
The life histories of parasitoids and that of their hosts are intimately linked. Direct host-parasitoid interactions may result in co-evolution between the two species. Second, climate may affect the
14
Life-history evolution in hymenopteran parasitoids: the roles of host and climate
Chapter 1 General introduction and discussion
host distribution pattern and host quality, which may then affect the parasitoids. An important component of host-parasitoid interactions is the immune system of the host and the ability of parasitoids to suppress it. This has been well studied in hymenopteran parasitoids and their hosts. Encapsulation is a common reaction in insects host to escape parasitism. It operates by aggregation of haemocytes around the parasitoid egg which results in melanization of the egg (Nappi 1975; Rizki and Rizki 1984). Asobara tabida populations show geographic variation in their ability to resist encapsulation which is correlated with variation in encapsulation ability of the host, Drosophila melanogaster (Kraaijeveld and van Alphen 1994, Kraaijeveld and van Alphen 1995). Interactions between hosts and parasitoids are not limited to the immune system of the host and virulence of the parasitoids. Manipulation of host behaviour by the parasite in such a way that it increases the fitness of parasite has been termed the “extended phenotype” (Dawkins 1982). There are many examples in which parasites manipulate their host behaviour in wide range of host, including snails (Miura et al. 2006), birds (Holmstad et al. 2006) and hymenopteran parasitoids (Brodeur and Vet 1994; Tanaka and Ohsaki 2006; Grosman et. al 2008). Examining variation in the manipulation behaviour of closely related parasitoid species may help to understand its fitness value. The potential effect of climate in shaping these manipulative interactions has never been addressed. Two other important host effects that may be affected by climate are host quality and host distribution pattern. The effect of climate on vegetation and fruit availability may contribute to variation in host quality through differences in food sources and competition. For example, the performance of parasitoids on herbivorous insects has been shown to vary depending on plant cultivars or soil types (Moon et al. 2000; Moreau et al. 2009; Sarfraz et al. 2009). Immature parasitoids are limited to a single host and the amount of resources that they can exploit is thus dependent on the nutrients gained by the host, which in turn is affected by food availability and competition. Host availability in nature is highly dependent on temperature and precipitation. Both temporal and spatial distribution patterns of the host are dictated by climate and are important sources of selection on life history traits of parasitoids. In particular, the stochasticity of the climate has a strong effect on the evolution of life history traits in parasitoids (Ellers et al. 2000b; Ellers and Jervis 2003). In stable climates the probability of finding hosts may be constant in any season, while in more stochastic climates parasitoids may face a lack of hosts at certain times, because of host population crashes. Parasitoids are expected to adapt their life history decisions, such as foraging behaviour, in relation to host distribution pattern (Vos & Vet, 2004; Kraaijeveld & van der Wel, 1994; Kraaijeveld et al., 1995; Dubuffet et al., 2006). Overall, host quality and availability are crucial for parasitoids and are likely to impose strong selection on life-history traits of parasitoids.
15
General introduction and discussion
Aims and scope the thesis
This thesis explores the relationships between parasitoids, hosts and climate from an evolutionary point of view. I chose hymenopteran parasitoids as a model system. The Hymenoptera are one of the largest orders of Insecta and include the largest group of parasitoids with about 50000 described species (Godfray 1994). An additional motivation for this choice was the role of hymenoteran parasitoid as biological control agents in pest control in agriculture crops. Studying the interplay between parasitoids, hosts and climate may contribute to our understanding of processes involved in the establishment of parasitoids in a new habitat. To study these questions, I adopted a comparative approach. Variation in life-history traits has studied for species or populations from different habitats. First, I looked at closely related species which have evolved from a common ancestor, but occupy different habitats. Second, I studied genetic and life-history trait variation in different populations of a single species. These populations were geographically isolated in contrasting climates.
This thesis examines the following five predictions:
1. Closely related species manipulate their host’s behaviour in different ways, depending on their habitat.
2. Different strategies of parasitoid species in spending their limited resource budget result in a lack of correlation between developmental time and life span.
3. The trade-off between initial egg load and lipid reserve is influenced by body size at both the inter- and the intraspecific level.
4. Strong selection on life-history traits of parasitoids induced by climate and host is expected to promote genetic divergence of parasitoid populations along a geographical cline.
5. Natural selection in geographically isolated populations should favour different life history strategies. Variation in life-history traits is thus expected to correlate with climatic factors.
Chapter 2: Closely related parasitoids induce different pupation and foraging responses in Drosophila larvae
In this chapter I tested the first hypothesis by comparing pupation site of hosts parasitized by different species of Asobara (Braconidae). The central goal of this chapter was to show variation in adaptive host manipulation behaviour by parasitoids. The species originated from highly divergent habitats with very wide differences in climate, host and
16
Life-history evolution in hymenopteran parasitoids: the roles of host and climate
Chapter 1 General introduction and discussion
competitor species assemblages. The results not only revealed variation in strength of host manipulation but also in the direction of the induced changes. At least for one species (A. tabida) the induced change in pupation site was shown to be adaptive for the parasitoid.
Chapter 3: The lack of correlation between developmental time and adult life span in parasitoids: the role of metabolic rate and fat reserves
This chapter explores the relationship between developmental time and life span in presence and absence of food in five species of Asobara cultured on Drosophila melanogaster. The lack of lipogenesis during adult life in parasitoids places severe constraints on allocation of the limited amount of lipids that can be sequestered from a single host. This is expected to result in different life-history strategies and variation in metabolic rate, lipid storage and lifespan.
Chapter 4: Adult size and early investment in reproduction in five species of Asobara parasitoid wasps
Life-history theory predicts a trade-off between initial egg load and lipid content (Roff 1992). Furthermore, large individuals are expected to postpone maturation of more of their eggs than small individuals, while habitat stochasticity should select for higher initial egg loads (Ellers and Jervis 2003). I tested these predictions at both inter- and intraspecific levels for five species of Asobara. The results provided strong support for these predictions at both levels.
Chapter 5: Genetic structure of Leptopilina boulardi populations from different climatic zones of Iran
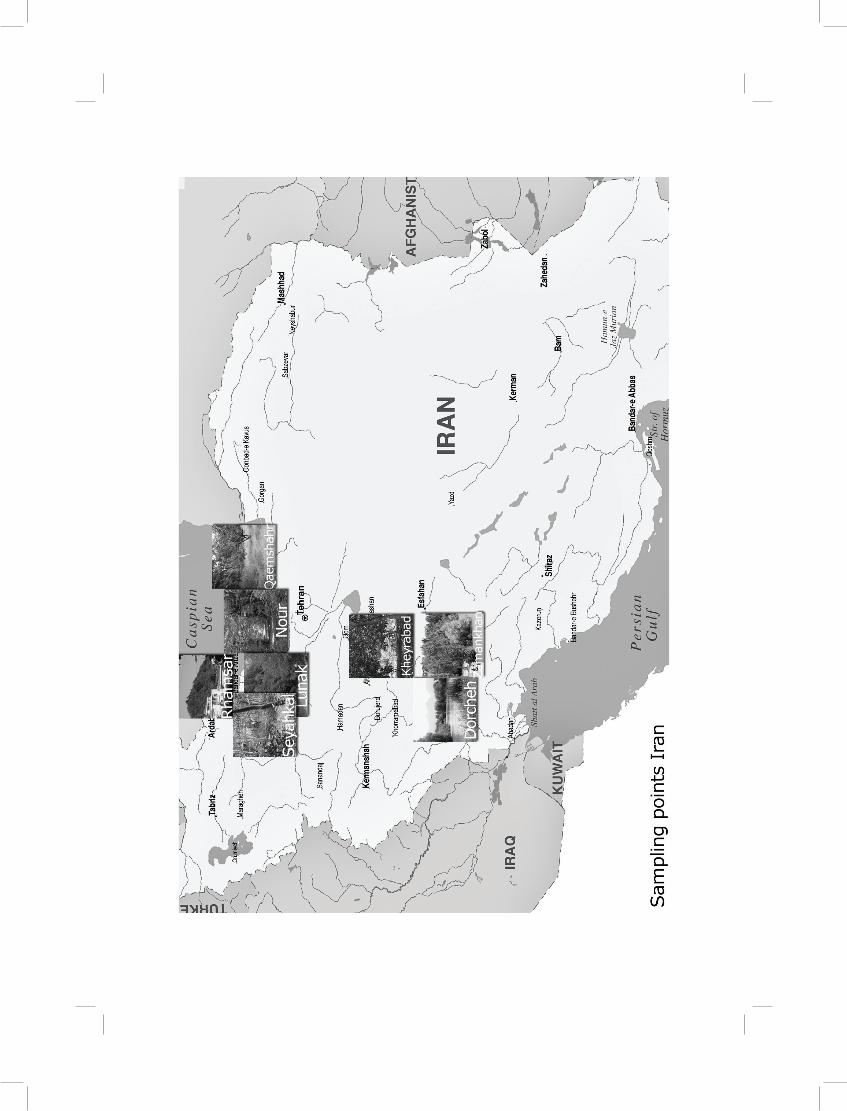
I documented genetic variation of 11 populations of Leptopilina boulardi along a geographic transect in Iran to test whether populations from different climatic zones had diverged genetically. Nine populations could be divided in groups clustering together based on their zone of origin. One population differed from all others and was probably imported from elsewhere. A montane population was found to be genetically similar to those from the nearby lowlands. Both distance and physical barriers contributed to the genetic structure of these populations.
Chapter 6: Local adaptation in life history traits of Leptopilina boulardi populations from different climate zones of Iran
I investigated the energy reserves (lipid, glycogen and sugar) and reproductive effort (egg load and egg size) of 11 populations of Leptopilina boulardi originating from contrasting climate zones of Iran. Most traits showed significant divergence according to climate. Two main climatic
17
General introduction and discussion
factors, precipitation and frost, explained significant amounts of the variance in life-history traits. This finding suggests that natural selection on life-history traits imposed by climate can result in rapid evolution of these traits.
General conclusion
The results in chapter two demonstrate significant manipulation of host behaviour by two out of five Asobara species affecting both pupation height of the host and foraging behaviour of host larvae. Manipulation of aspects of host behaviour by hymenopteran parasitoids have been reported previously (Brodeur and Vet 1994, Tanaka and Ohsaki 2006; Grosman et al. 2008). However, these studies only demonstrated a host manipulation by a single parasitoid species. Comparison of closely related species originating from different habitats revealed different manipulation strategies when interacting with a common host. Our empirical evidence demonstrated the adaptive value of the induced change by A. tabida but not for A. citri. As host manipulation by A. tabida and A. citri occurred in different directions, it is likely that the optimal strategy for host manipulation is species-specific, because these species live in climatically contrasting habitats.
The results of chapter three showed a lack of correlation between developmental time and adult life span of five Asobara species. This is consistent with previous findings for hymenopteran parasitoids (Blackburn 1991; Eijs & van Alphen, 1999). The novelty of this chapter is in revealing the role of lipid reserves and metabolic rate in adjusting species-specific life span. Much of the variation could be explained by the habitat of origin of the species. Variation in host distribution pattern results in differences in foraging behaviour among hymenopteran parasitoids (Vos & Vet, 2004; Kraaijeveld & van der Wel, 1994; Kraaijeveld et al., 1995; Dubuffet et al., 2006). It is obvious that different of variation in foraging behaviours require different activity patterns and different metabolic rates. As a consequence of the lack of adult lipogenesis in hymenopteran parasitoids (Ellers 1996; Rivero and West 2002; Giron and Casas 2003; Visser and Ellers 2008) and variation in metabolic rate, parasitoids will vary in lifespan due to exhausting lipid resources at different rates.
In chapter four I show a high initial reproductive effort in smaller Asobara species and low initial reproductive effort in larger species. Consistent with this interspecific pattern I found a negative correlation between size and initial reproductive effort on an intraspecific level. These patterns are in agreement with the Ellers and Jervis (2003) model on timing of reproduction in hymenopteran parasitoids. Furthermore, I found a trade-off between initial reproductive effort and lipid reserves in four out of five species, which is consistent with life-history theory (Roff 1992).
18
Life-history evolution in hymenopteran parasitoids: the roles of host and climate
Chapter 1
In chapter five I established the genetic structure of 11 populations of Leptopilina boulardi from different climatic zones of Iran by employing the Amplified Fragment Length Polymorphism (AFLP) technique. Except for an unexpected pattern for one population and an identical genetic structure for another population which is geographically close to the next zone, a clear genetic separation based on geography was observed. This is consistent with the results for AFLP patterns in other insect populations (Reineke et al., 1999; Ravel et al., 2001; Pannebakker et al. 2004; Alamalakala et al. 2009; Tao et al. 2009) and shows that local adaptation to climate is possible.
In the last chapter I found substantial variation in energy reserves (lipid, glycogen and sugar) and reproductive effort of Iranian L. boulardi populations. Similarly to genetic structure, the pattern of life-history traits separated populations clearly for most traits. This suggests that divergent natural selection may contribute to the differentiation of populations (Endler, 1986). Most traits showed a correlation with one or both of two climate factors, the number of rainy days and the number of frost days per year. These two climatic factors impose strong selective pressures in the form of drought and frost stress.
To conclude, I suggest that life-history traits of parasitoids are subject to natural selection pressures from both host and climate. These factors are likely to interact through the effect of climate on hosts. The intimate relationship of host and parasitoid and the dependency of parasitoids on their hosts for crucial resources like lipids, result in specific recourse allocation strategies to fit habitat requirements. Resource allocation in parasitoids is species specific and highly diverged among populations.
19
C h a p t e r 2
Closely related parasitoids induce different pupation and foraging responses in Drosophila larvae
Seyahooei, M. A., F. J. L. Kraaijeveld-Smit, Kraaijeveld, K., Crooijmans, J. B. M., Van Dooren, T. J. M. and van Alphen, J. J. M. 2009. Closely related parasitoids induce different pupation and foraging responses in Drosophila larvae. Oikos 118: 1148-1157
Abstract:
Few examples exist where parasites manipulate host behaviour not to increase their transmission rate, but their own survival. Here we in-vestigate fitness effects of parasitism by Asobara species in relation to the pupation behaviour of the host, Drosophila melanogaster. We found that Asobara citri parasitized larvae pupate higher in rearing jars compared to unparasitized controls, while A. tabida pupated on or near the medium. No change in pupation site was found for three other species. A follow-up experiment showed a non-random distribution of parasitized and un-parasitized pupae over the different jar parts. To test the adaptiveness of these findings, we performed pupal transfer experiments. Optimum pu-pation sites were found to be different between host individuals; wall in-dividuals survived better than bottom individuals, but bottom individuals did worse at the wall. Two parasitoid species that alter pupation site sig-nificantly showed high rates of diapause at their ‘preferred’ pupation site. For one of them, A. citri, pupation occurred at the optimal site for highest survival (emergence plus diapause). From literature we know that pupa-tion height and foraging activity are genetically positively linked. There-fore, we implement a short assay for rover/sitter behavioural expression by measuring distance travelled during foraging after parasitism. For one out of three species, foraging activity was reduced, suggesting that this species supresses gene expression in the for pathway and thereby re-duces pupation height. The parasitoid species used here, naturally inhabit widely different environments and our results are partly consistent with a role for ecology in shaping the direction of parasite-induced changes
20
Life-history evolution in hymenopteran parasitoids: the roles of host and climate
Chapter 2 Closely related parasitoids induce different pupation and foraging responses in Drosophila larvae
to host pupation behaviour. More parasitoids are found on the wall of the rearing jar when they originate from dry climates, while parasitoids from wet climates pupate on the humid bottom.
Introduction:
Parasite infection often induces changes in host behaviour (Combes 1991, 1998, Poluin 1998, Moore 2002). These changes can result from resistance adaptations of the host, pathological side-effects of the infec-tion or from the parasite manipulating host behaviour in order to enhance its own transmission rate. The latter is known as the ‘extended pheno-type’ (Dawkins 1982). Manipulation of host behaviour by a parasite will be selected for when the normal host behaviour is suboptimal for parasite transmission. Many examples of such manipulation exist. Snails change habitat preference when infected with a trematode parasite (Miura et al. 2006). Birds infected with a vector-borne parasite have decreased mo-bility, which increases predation risk and therefore stimulates parasite dispersal (Holmstad et al. 2006). Leptopilina boulardi, a hymenopteran parasitoid, has an increased tendency to lay eggs in already parasitized hosts when infected with a virus, which promotes horizontal transmission of the virus (Varaldi et al. 2003). Clearly, parasite-induced changes in host behaviour can have profound impacts on parasite fitness.
In addition to increasing their own transmission rate, parasites may also manipulate the behaviour of their host to enhance their own survival directly. Some examples exist, especially in relation to host and parasitoids (parasites that always kill their host), a common threat to insects. They lay their egg on (ecto) or inside (endo) the body of preima-ginal (egg, larva or pupa) or adult stages of the host and complete their development on or inside the host’s puparium or body (Godfray 1994, Quicke 1997). An example of host behavioural changes comes from the famous caterpillars infected with the ecto-parasitoid Cotesia glomerata which defends their parasitoid against natural enemies by behaving ag-gressively towards them and also via spinning a web around the pupae (Brodeur and Vet 1994, Tanaka and Ohsaki 2006). Similarly, the braconid parasitoid, Glyptapanteles sp. induces a behaviour in its host, Thyrinteina leucocera to guard parasitoid pupae and this results in increased para-sitoid survival (Grosman et al. 2008). In insects, one trait that has large consequences for survival, is pupation site selection behaviour. During the immobile stage, insects are vulnerable to many dangers, including desiccation, fungal infection, predation / parasitism and super or hyper-parasitism. Insects are thus under strong selection to optimize the timing and location of pupation in a way that minimizes such risks. Pupation site selection occurs at the late larval stage and is affected by moisture, tem-perature, density, phenotype/genotype, sex, species and the presence of predators or (super and/or hyper) parasitoids (Sameoto and Miller 1968,
21
Closely related parasitoids induce different pupation and foraging responses in Drosophila larvae
Barker 1971, Sokolowski and Hansell 1983, Sokolowski et al. 1986, Sch-nebel and Grossfield 1992, Pivnick 1993, Tanaka and Ohsaki 2006, Riedl et al. 2007).
Parasitoids and hosts may often differ in optimal pupation strategy. For example, when the parasitoid spends more time in the puparium than the host (which they often do) it will be at risk of desiccation, predation and hyperparasitism by pupal parasitoids for longer and may prefer a more humid and concealed pupation site. Furthermore, differences in body size between parasitoid and host results in differences in surface/body mass ratio, which may also influence the optimal pupation site (Carton et al. 1986, Ellers 1998). Because it is the host that pupates, the parasitoid has to manipulate the host if it is to achieve its own optimal pupation strategy. In spite of the considerable interest in parasite-induced changes in host behaviour, little is known of the effects of parasitism on pupation site se-lection behaviour. One example that we do know of is that of the Bertha armyworms, Mamestra configurate which pupate in the leaf litter around the host plant when parasitized by Microplitis mediator. Those not parasit-ized all pupate on the host plant (Pivnick 1993). Although these observa-tions are made, little experimental evidence is present to show that these behavioural changes actually increase parasitoid survival.
Here we investigate whether the pupation behaviour of Drosophila changes as a result of attack by Asobara parasitoid wasps. Species in the genus Asobara cover a wide range of ecological niches, including wet tropical conditions, dry deserts and cool temperate conditions. They fur-ther differ markedly in generation time and hence in the time spent in the host puparium. Thus, the different species of Asobara are expected to differ in the degree to which they are in conflict with their host over pupa-tion behaviour. This provides an ideal system to test if parasitoids alter pupation behaviour of their host in an adaptive manner.
We use five species of Asobara that span a range of environments and that are all cultured on Drosophila melanogaster. Two species are naturally adapted to dry climates, while the other three originate from wet and humid climatic conditions (Table 1). We hypothesize that the former are better adapted to lower humidity conditions than the latter. The con-ditions in our rearing jars show a steep gradient in humidity. Close to the medium at the bottom of the jar, conditions are much more moist than on the glass higher up. Thus, if our expectation is correct and if parasitoids are able to manipulate their host’s pupation behaviour, we expect spe-cies from the dry areas to pupate higher in the jars compared to larvae parasitized by wasps from wet areas. Therefore, we compare the pupa-tion behaviour of D. melanogaster larvae parasitized by different spe-cies of Asobara to that of unparasitized larvae. Finding such differences, we then ask whether these might be adaptive. In order to test this, we performed a series of translocation experiments in which hosts pupae were transferred from their selected (high or low in the jar) to the un-
22
Life-history evolution in hymenopteran parasitoids: the roles of host and climate
Chapter 2 Closely related parasitoids induce different pupation and foraging responses in Drosophila larvae
selected site. In the first experiment, we use unparasitized hosts only, to examine the adaptive significance of pupation site selection in individual larvae. This is important, since although we know that this behavioural trait has large consequences for survival (Sokolowski et al. 1986, Rodri-guez-del-Bosque and Smith 1996) there is no experimental evidence to show that individually selected sites are the sites which yield optimal sur-vival. In the second translocation experiment, we used parasitized hosts to assess the adaptive value of parasite-induced alterations in pupation behaviour. For parasitoid translocations we not only investigate the ef-fect of translocation on emergence, but also on diapause and total sur-vival (emergence + diapause). These translocations enable us to examine three possible sources of variation which may address survival variance:
different effect of pupation sites --> transferred from wall to wall (WW) ≠ bottom to bottom (BB).variation of individuals which is caused by differences between individuals in optimal pupation site --> WW > WB and/or BB > BW.pre-pupal stage determines the fitness --> BB = BW and / or WW = WB.
Finnaly, we try to touch upon the genetic mechanism underlying parasitoid-induced changes in host pupation behaviour. Foraging beha-viour is regulated through the foraging pathway, which is largely con-trolled by the for gene. Alleles at the for gene induce two behavioural phenotypes, known as ‘rovers’ and ‘sitters’. Rovers move more during for-aging and pupate higher compared to sitters (Graf and Sokolowski 1989, Sokolowski 1980). The pleiotropic effects of foraging on pupation behav-iour suggest that pupation behaviour is at least partly regulated through the for pathway (Sokolowski and Hansell 1983). Thus parasitoids could achieve changes in pupation site by influencing the expression level of the for gene which results in rover/sitter phenotypic behaviour. As the first step to test this hypothesis we did a short assay for rover/sitter phe-notype behaviour by observing foraging behaviour of parasitized versus unparasitized larvae.
Material and methods
Strain of parasitoids and hosts
Parasitoids and hostWe used the five species of Asobara described in Table 1. The host
used in all experiments was Drosophila melanogaster from a laboratory stock that has been maintained in our lab since 1966 at 20918C and 16:8 h day:night regime. This stock is polymorphic for the rover and sitter al-leles of the for gene.
1.
2.
3.
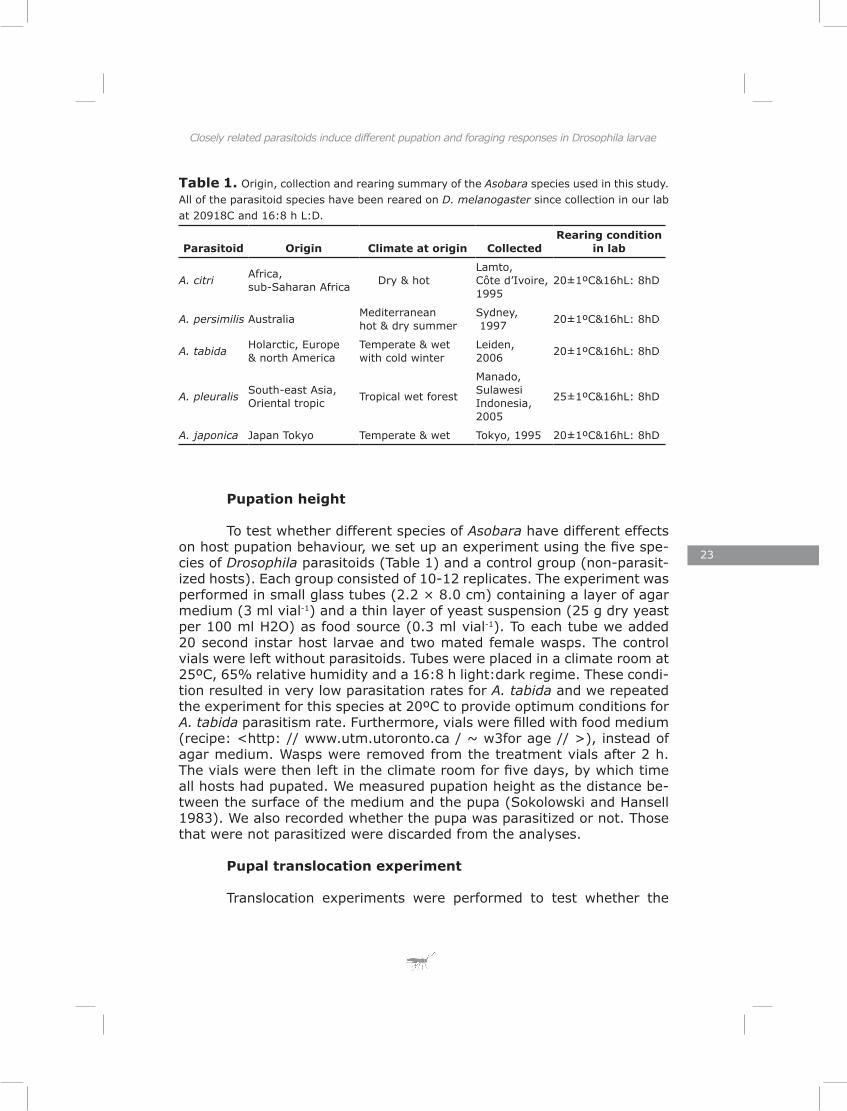
Table 1. Origin, collection and rearing summary of the Asobara species used in this study. All of the parasitoid species have been reared on D. melanogaster since collection in our lab at 20918C and 16:8 h L:D.
Parasitoid Origin Climate at origin CollectedRearing condition
in lab
A. citri Africa, sub-Saharan Africa Dry & hot
Lamto, Côte d’Ivoire, 1995
20±1ºC&16hL: 8hD
A. persimilis Australia Mediterranean hot & dry summer
Sydney, 1997 20±1ºC&16hL: 8hD
A. tabida Holarctic, Europe& north America
Temperate & wet with cold winter
Leiden, 2006 20±1ºC&16hL: 8hD
A. pleuralis South-east Asia,Oriental tropic Tropical wet forest
Manado, Sulawesi Indonesia, 2005
25±1ºC&16hL: 8hD
A. japonica Japan Tokyo Temperate & wet Tokyo, 1995 20±1ºC&16hL: 8hD
Pupation height
To test whether different species of Asobara have different effects on host pupation behaviour, we set up an experiment using the five spe-cies of Drosophila parasitoids (Table 1) and a control group (non-parasit-ized hosts). Each group consisted of 10-12 replicates. The experiment was performed in small glass tubes (2.2 × 8.0 cm) containing a layer of agar medium (3 ml vial-1) and a thin layer of yeast suspension (25 g dry yeast per 100 ml H2O) as food source (0.3 ml vial-1). To each tube we added 20 second instar host larvae and two mated female wasps. The control vials were left without parasitoids. Tubes were placed in a climate room at 25ºC, 65% relative humidity and a 16:8 h light:dark regime. These condi-tion resulted in very low parasitation rates for A. tabida and we repeated the experiment for this species at 20ºC to provide optimum conditions for A. tabida parasitism rate. Furthermore, vials were filled with food medium (recipe: <http: // www.utm.utoronto.ca / ~ w3for age // >), instead of agar medium. Wasps were removed from the treatment vials after 2 h. The vials were then left in the climate room for five days, by which time all hosts had pupated. We measured pupation height as the distance be-tween the surface of the medium and the pupa (Sokolowski and Hansell 1983). We also recorded whether the pupa was parasitized or not. Those that were not parasitized were discarded from the analyses.
Pupal translocation experiment
Translocation experiments were performed to test whether the
23
Closely related parasitoids induce different pupation and foraging responses in Drosophila larvae
Table 1. Origin, collection and rearing summary of the Asobara species used in this study. All of the parasitoid species have been reared on D. melanogaster since collection in our lab at 20918C and 16:8 h L:D.
Parasitoid Origin Climate at origin CollectedRearing condition
in lab
A. citri Africa, sub-Saharan Africa Dry & hot
Lamto, Côte d’Ivoire, 1995
20±1ºC&16hL: 8hD
A. persimilis Australia Mediterranean hot & dry summer
Sydney, 1997 20±1ºC&16hL: 8hD
A. tabida Holarctic, Europe& north America
Temperate & wet with cold winter
Leiden, 2006 20±1ºC&16hL: 8hD
A. pleuralis South-east Asia,Oriental tropic Tropical wet forest
Manado, Sulawesi Indonesia, 2005
25±1ºC&16hL: 8hD
A. japonica Japan Tokyo Temperate & wet Tokyo, 1995 20±1ºC&16hL: 8hD
Pupation height
To test whether different species of Asobara have different effects on host pupation behaviour, we set up an experiment using the five spe-cies of Drosophila parasitoids (Table 1) and a control group (non-parasit-ized hosts). Each group consisted of 10-12 replicates. The experiment was performed in small glass tubes (2.2 × 8.0 cm) containing a layer of agar medium (3 ml vial-1) and a thin layer of yeast suspension (25 g dry yeast per 100 ml H2O) as food source (0.3 ml vial-1). To each tube we added 20 second instar host larvae and two mated female wasps. The control vials were left without parasitoids. Tubes were placed in a climate room at 25ºC, 65% relative humidity and a 16:8 h light:dark regime. These condi-tion resulted in very low parasitation rates for A. tabida and we repeated the experiment for this species at 20ºC to provide optimum conditions for A. tabida parasitism rate. Furthermore, vials were filled with food medium (recipe: <http: // www.utm.utoronto.ca / ~ w3for age // >), instead of agar medium. Wasps were removed from the treatment vials after 2 h. The vials were then left in the climate room for five days, by which time all hosts had pupated. We measured pupation height as the distance be-tween the surface of the medium and the pupa (Sokolowski and Hansell 1983). We also recorded whether the pupa was parasitized or not. Those that were not parasitized were discarded from the analyses.
Pupal translocation experiment
Translocation experiments were performed to test whether the
24
Life-history evolution in hymenopteran parasitoids: the roles of host and climate
Chapter 2 Closely related parasitoids induce different pupation and foraging responses in Drosophila larvae
choice of pupation site affected fitness of D. melanogaster. Forty jars (3.5 × 8.5 cm) containing agar medium and one ml yeast suspension (32 g yeast per 100 ml water) were prepared. To each we added ~ 100 2nd instar host larvae. When the larvae had pupated, 40 pupae were collected from each jar: 20 from the medium on the bottom of the jar and 20 from the side of the jar. These pupae were then placed in new jars (10 pupae per jar) containing standard agar medium. Ten pupae that came from the side were placed back onto the side and ten pupae that came from the side were placed on the medium. Ten pupae from the medium were placed onto the side and ten back on the medium. After emergence, the number of flies per jar was scored. Per treatment group ten jars were prepared and the experiment was performed twice. The jars were kept at 20ºC.
A similar translocation experiment was performed for parasitized larvae. This time, 3 female parasitoids were added to the jars containing ~ 100 2nd instar host larvae. All five parasitoid species were used. Just after pupation, per species, twenty jars were prepared for translocation side (bottom - bottom, bottom - wall, wall - wall, wall - bottom). Jars were placed at 25ºC, apart from the A. tabida parasitized group, which was kept at 20ºC. After 4 - 5 weeks we scored the status for each translocated pupae: parasitized or unparasitized, and emerged, dead or in diapauze.
Foraging path length
The pupation height experiment revealed significant differences in pupation height of larvae parasitized by two out of the five species (A. tabida and A. citri; Results). To test whether these differences could be caused by effects of parasitism on expression of the for gene, as the first step to check the expression level of this gene we tested for differences in foraging path length by a short assay for rover / sitter behaviour, which is regulated by the same genetic pathway. As a control, we also measured path lengths of A. pleuralis parasitized larvae, where a change in pupation site was not significant in the pupation height experiment. The maximum individual variation in foraging behaviour of D. melanogaster larvae oc-curs at the mid-third instar larval stage (Sokolowski 1980, Sokolowski and Hansell 1983). At this stage the larvae leave a clear trail on the yeast which can be measured. This path length is routinely used as a measure of foraging intensity (Sokolowski 1980, Sokolowski and Hansell 1983). We measured foraging path lengths of parasitized larvae and compared them to those of unparasitized control larvae. In each experiment 30 mid-2nd instar larvae were placed in a jar (3.5 × 8.5 cm) with a layer of agar and 0.3 ml of yeast solution. To the groups in the parasitized treatment, we added two mated female parasitoids for two hours. Five jars per treat-ment (control vs parasitized) per parasitoid species were prepared for each experiment. Treatment and control jars of A. citri and A. pleuralis were kept in a climate room at 25ºC, while A. tabida and its control jars were reared at 20ºC. The immune reaction of parasitized larvae results in
25
Closely related parasitoids induce different pupation and foraging responses in Drosophila larvae
slightly slower growth rates and thus longer development time compared to control larvae (Wertheim et al. 2005). Therefore we designed a time table in such a way that the control jars for each treatment were started one day after those of the treatment larvae. This created mid-third instar larvae of both parasitized and control groups on the same day.
To measure foraging path length we used plastic petri dishes (Ø 8.5 cm and 1.4 cm high) containing a layer of agar on which we spread 1.5 ml of yeast solution (8.5 g per 25 ml) (Sokolowski 1980). Path lengths of six larvae per jar were measured individually by placing them in the centre of the petri dish and allowing them to forage for five minutes (So-kolowski 1980). The trail track was transferred onto a transparent sheet and its length was measured at a later time. For the parasitized group, larvae were dissected to determine whether they were parasitized or not or had encapsulated the parasitoid larvae. Encapsulation by aggregation of haemocytes around the parasitoid eggs is a common strategy in insects to escape parasitism (Nappi et al. 1975, Rizki and Rizki 1984). Host larvae in the parasitized group that contained no wasp larvae or contained an encapsulated parasitoid egg were excluded from the analyses.
Statistical analyses
Standard linear parametric models were unsuitable for the analy-sis of pupation height, as this measure is bounded below (the medium) as well as above (the bottom of the stopper sealing the glass vial). We ap-plied a Weibull parametric survival regression analysis in the free statisti-cal software R 2.5.1 to our data (Ihaka and Gentleman 1996, Therneau and Grambsch 2000). Since data distributions were similar in shape to Weiball. We included the random jar effect as frailty in this model.
The results of the translocation experiments were analysed using generalized linear models (GLM) with a quasibinomial distribution in R. For host we estimated probabilities of emergence. We then determined wheth-er translocation side contributed to variation in the number of emerged flies by comparing the full model to one from which translocation had been dropped using a χ²-test. We record the χ²-value and its associated p-value. Post-hoc t-tests from this model where used to indicate which of the four translocation sides (BB, BW, WW, WB) differ from each other in emergence rate. The statistical analyses concerning translocation experi-ments involving parasitized pupae was similar to that of the host experi-ment. However, three additional tests were added per parasitoid species. In addition to emergence rate, we analysed the number of parasites in diapause, the proportion of pupae surviving (emerged plus diapause) and the number of flies versus parasitoids picked from either the bottom or the wall at the start of the translocation experiment. The latter analyses was thus an independent repeat of the pupation height experiment.
Foraging pathlengths were analysed using generalized linear mixed effect models (LMEM, Pinheiro and Bates 2000), in the R-package nlme.
26
Life-history evolution in hymenopteran parasitoids: the roles of host and climate
Chapter 2 Closely related parasitoids induce different pupation and foraging responses in Drosophila larvae
Treatment (parasitized or control) was entered as a fixed effect while jar was entered as a random effect. The experiments for the three parasitoid species were not performed at the same time, and therefore analysed separately. In all three cases we searched for the minimum adequate model (Crawley 2005) by starting with the maximal model and then drop-ping the main factor (treatment) if non-significant. Comparing the simpler to the more complex model was done using a likelihood-ratio test. We recorded these likelihood-ratios and their associated p-value.
Results
Pupation height
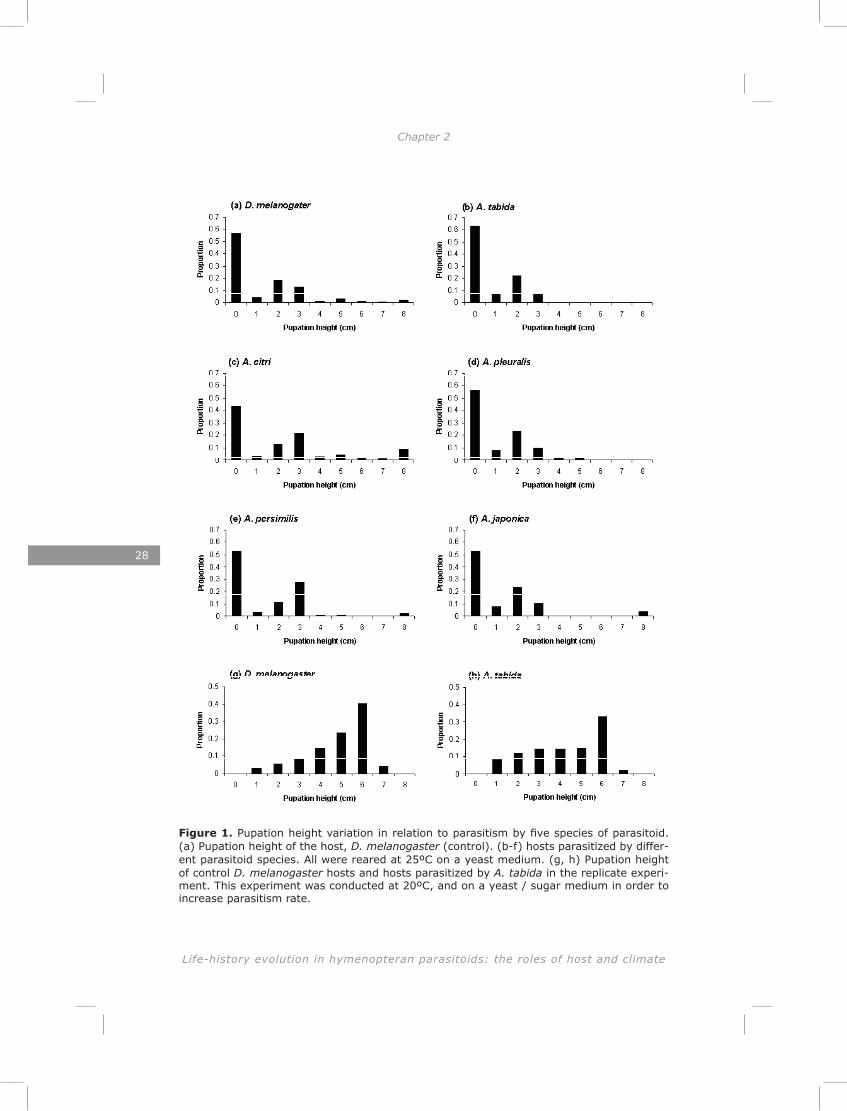
First we compared pupation heights of D. melanogaster larvae parasitized by five different Asobara species and those of control larvae. Pupation height of host larvae differed significantly after parasitism by different species (likelihood ratio test, χ² = 5.16, DF = 1, p = 0.005) (Fig. 1a-f). A post hoc z-test revealed that larvae parasitized by A. citri pupated significantly higher than control larvae (z = 2.52, p = 0.01) and larvae parasitized by A. tabida had a non-significant tendency to pupate lower than control larvae (z = 1.67, p = 0.09) Parameter estimates from this full model also showed that the direction of pupation height different between parasitoid species. We observed some similarities in distribution pattern of pupation site. A. citri and A. persimilis showed a similar pattern, which differed from A. tabida, A. pleuralis and A. japonica. (Fig. 1a-f). In the replicate experiment of A. tabida, performed at a lower temperature, parasitism induced a highly significant reduction in pupation height (Fig. 1g-h, likelihood ratio test, χ² = 7.34, DF = 1, p = 0.006).
Pupal translocation experiments
Host - emergence (survival) successEmergence success was significantly influenced by translocation
site in the case of unparasitized host pupae (Fig. 2a and 4a which are identical, DF = 3, χ² = 69.6, p < 0.001). Post-hoc t-tests (see complete overview of t- and p-values for all species in Appendix 1) revealed that wall to wall and wall to bottom transfers resulted in equally high emer-gence success, which was higher than bottom to bottom or bottom to wall transfers. Bottom to wall transfers resulted in even lower emergence rates compared to its control, the bottom to bottom transfers (Fig. 2a, 4a).
Parasitoids - number of flies versus waspsIn our pupation height experiment we found a significant increase
in pupation height for A. citri parasitized larvae and a reduction in A.
27
Closely related parasitoids induce different pupation and foraging responses in Drosophila larvae
tabida relative to control larvae. Furthermore, a similar distribution pat-tern to A. citri was observed in A. persimilis while distribution patterns of A. pleuralis and A. japonica more resembled those of A. tabida. Perhaps the effects of parasitoids on host pupation behaviour are small, but con-sistently present across experiments. If this is the case, we would find a different number of flies versus parasitoids between the wall and the bot-tom when picking pupae for the translocation experiment. For A. citri and A. persimilis we expect to find more parasitoids versus flies on the wall compared to the bottom, and vice versa for A. tabida, pleuralis and ja-ponica. Table 2 shows that these expectations are met, except for A. citri, where the number of flies was indeed lower on the wall compared to the bottom, but this difference was not significant. Perhaps this is due to the fact that in that case parasitisation success was very high which results in very low numbers of flies (Table 2).
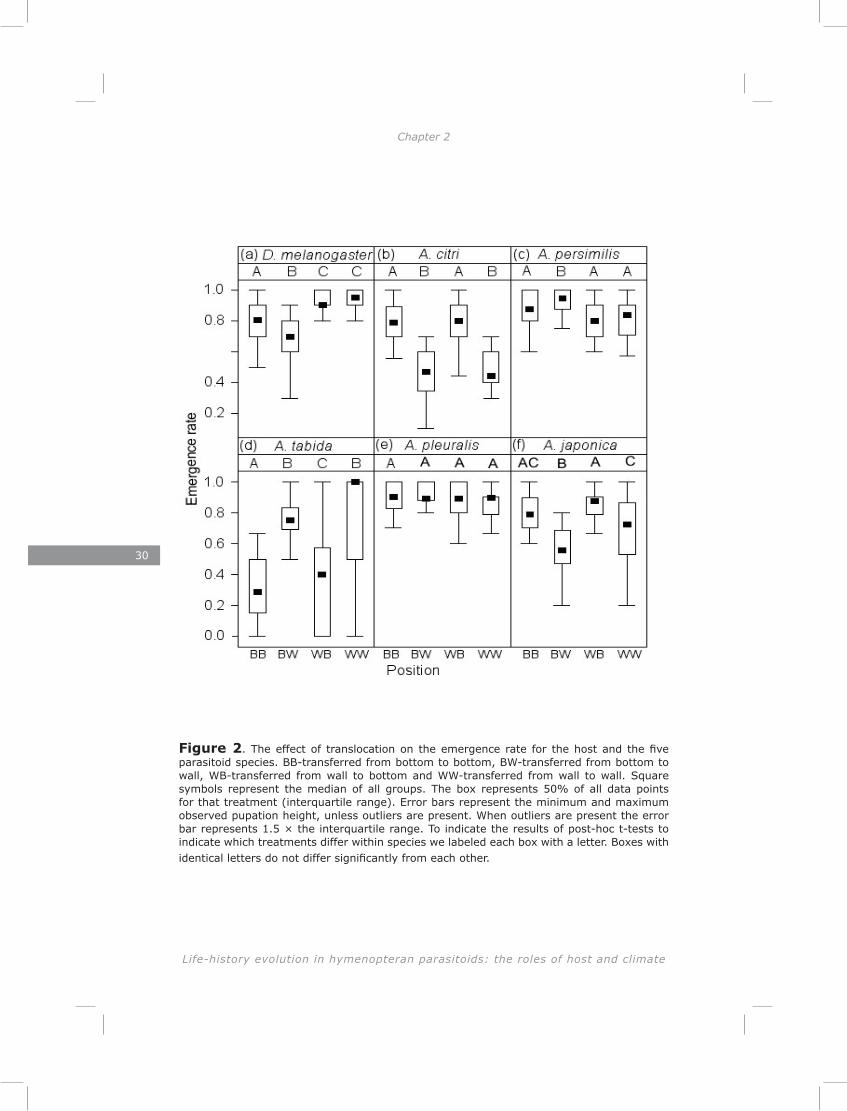
Parasitoids - emergence successEmergence success was significantly influenced by translocation
site for all but one species, namely A. pleuralis (Appendix 1, Table 3, Fig. 2). The optimal site to pupate at in terms of emergence success differed between parasitoid species. For A. citri most pupae emerged from the bottom location, regardless of whether this was the original site of pupa-tion (BB) or not (WB, Fig. 2b). For A. persimilis the highest emergence rate was obtained if bottom pupae were translocated to the wall (BW, Fig. 2c). A. tabida individuals emerged at the highest rate either when relocated back to the wall (WW) or transferred from bottom to wall (BW). Those transferred from the wall to the bottom (WB) performed better compared to those from the bottom to bottom group (BB; Fig. 2d). A. pleuralis emergence rate did not depend on translocation site, and was very high at all sites (Fig. 2e). In the case of A. japonica, as in A. citri, most pupae emerged from the bottom location (BB and WB; Fig. 2f). For this species, a wall to wall (WW) transfer resulted in intermediate emer-gence success, while a bottom to wall (BW) transfer led to the lowest emergence success.
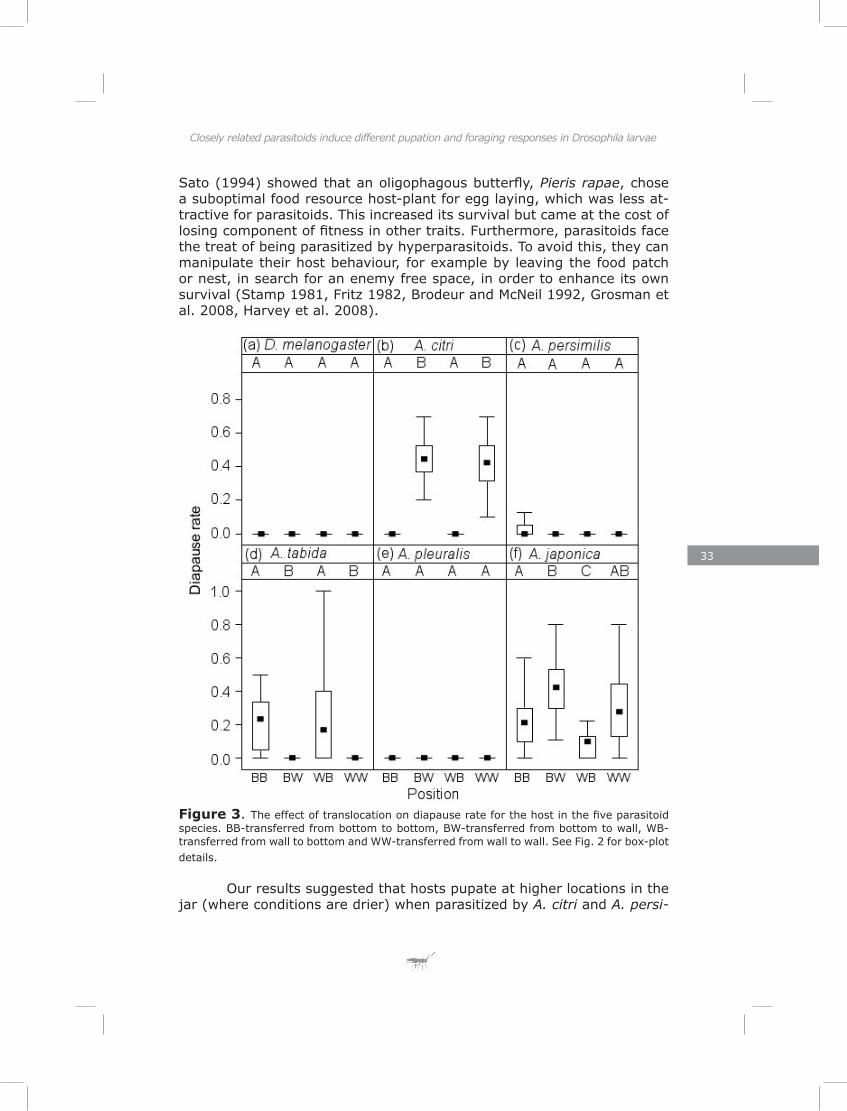
Parasitoids - diapause inductionDiapause initiation was significantly influenced by translocation in
three out of five species, namely A. citri, A. tabida and A. japonica (Ap-pendix 1, Table 3, Fig. 3). A high diapause induction was observed in A. citri at the wall position, either for those transferred from bottom or from wall to wall (Fig. 3b). Very rare cases of diapause were observed at the bottom site in this species (BB and WB; Fig. 3b). In contrast to A. citri we found a high proportion of wasps in diapause at the bottom for A. tabida (Fig. 3d). No cases of diapause were observed for this species at the wall site (WW and BW; Fig. 3d). Diapause in A. japonica occurred in both bottom and wall, while the frequency of diapause initiation was higher in the wall treatments (WW and BW; Fig. 3f). A few A. persimilis
28
Life-history evolution in hymenopteran parasitoids: the roles of host and climate
Chapter 2 Closely related parasitoids induce different pupation and foraging responses in Drosophila larvae
Figure 1. Pupation height variation in relation to parasitism by five species of parasitoid. (a) Pupation height of the host, D. melanogaster (control). (b-f) hosts parasitized by differ-ent parasitoid species. All were reared at 25ºC on a yeast medium. (g, h) Pupation height of control D. melanogaster hosts and hosts parasitized by A. tabida in the replicate experi-ment. This experiment was conducted at 20ºC, and on a yeast / sugar medium in order to increase parasitism rate.
29
Closely related parasitoids induce different pupation and foraging responses in Drosophila larvae
individuals went into diapause. Those that did, mainly came from the bot-tom to bottom treatment (BB; Fig. 3c). Diapause was not observed for A. pleuralis (Fig. 3e).
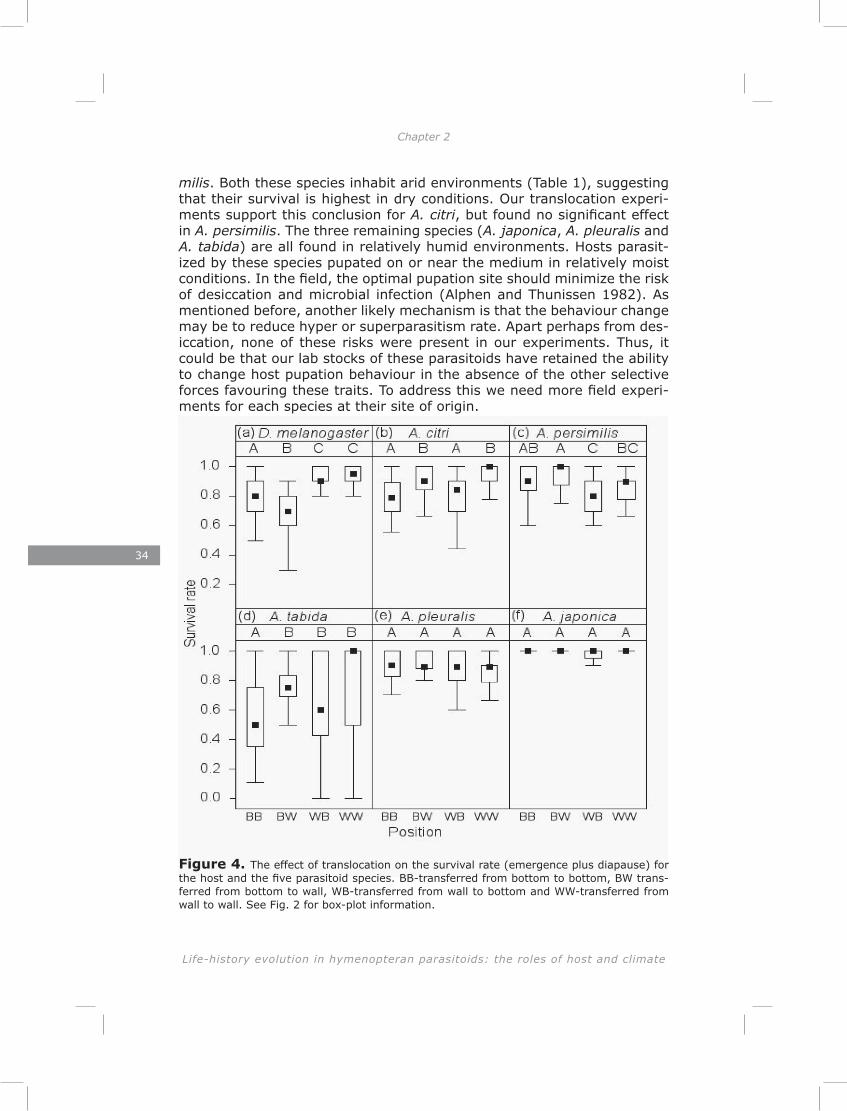
Parasitoids - survival (emergence - diapause)Survival was significantly influenced by translocation site for three
out of five species, namely A. citri, A. persimilis and A. tabida (Appendix 1, Table 3, Fig. 4). For A. citri, a higher number of surviving pupae was found on the wall compared to the bottom (Fig. 4b). This is in contrast to the number emerging, which was highest at the bottom. This difference can be attributed to the fact that a large proportion of the pupae that were transferred from either wall or bottom to wall went into diapause (Fig. 3b). No significant differences in survival were observed for A. persimilis (Fig 4c). In contrast to A. citri, A. tabida individuals mostly went into dia-pause at the bottom (BB and WB). As a result, survival was similar for wall to wall, wall to bottom and bottom to wall transfers. Bottom to bottom transfers still had significantly lower survival rates (Fig. 4d). For A. pleu-ralis emergence rate was high at all four sites, and no diapause events were observed, thus survival rate does not differ from emergence rate (Fig. 2e and 4e are identical). Diapause in A. japonica mostly occurred for the wall treatments (WW and BW), where emergence was relatively low compared to the bottom (Fig. 2f). This led to a very high survival rate for all four translocation treatments which eliminated the transfer effects seen in emergence rate (Fig. 4f).
Foraging path lengthIn the short assay for rover/sitter phenotypic behaviour the dis-
tance travelled while foraging did not differ between parasitized larvae and unparasitized larvae for A. citri and A. pleuralis (Fig. 5a-b: A. citri, likelihood-ratio test; χ² = 0.09, p = 0.76; A. pleuralis, χ² = 0.04, p = 0.84). Larvae parasitized by A. tabida travelled less while foraging com-pared to unparasitized larvae (Fig. 5c: χ² = 23.55, p < 0.001).
30
Life-history evolution in hymenopteran parasitoids: the roles of host and climate
Chapter 2 Closely related parasitoids induce different pupation and foraging responses in Drosophila larvae
Figure 2. The effect of translocation on the emergence rate for the host and the five parasitoid species. BB-transferred from bottom to bottom, BW-transferred from bottom to wall, WB-transferred from wall to bottom and WW-transferred from wall to wall. Square symbols represent the median of all groups. The box represents 50% of all data points for that treatment (interquartile range). Error bars represent the minimum and maximum observed pupation height, unless outliers are present. When outliers are present the error bar represents 1.5 × the interquartile range. To indicate the results of post-hoc t-tests to indicate which treatments differ within species we labeled each box with a letter. Boxes with identical letters do not differ significantly from each other.
31
Closely related parasitoids induce different pupation and foraging responses in Drosophila larvae
Figure 2. The effect of translocation on the emergence rate for the host and the five parasitoid species. BB-transferred from bottom to bottom, BW-transferred from bottom to wall, WB-transferred from wall to bottom and WW-transferred from wall to wall. Square symbols represent the median of all groups. The box represents 50% of all data points for that treatment (interquartile range). Error bars represent the minimum and maximum observed pupation height, unless outliers are present. When outliers are present the error bar represents 1.5 × the interquartile range. To indicate the results of post-hoc t-tests to indicate which treatments differ within species we labeled each box with a letter. Boxes with identical letters do not differ significantly from each other.
Discussion
The pupation height experiment showed that attack by five spe-cies of Asobara affected pupation height of D. melanogaster larvae in different directions. Pupation height changed significantly after attack by two out of five species of Asobara. For one species, A. tabida, first only a trend was observed. Due to low parasitism rate at high temperatures, we were not able to firmly state that parasitism changes pupation behaviour for this species. Therefore, for A. tabida we repeated the experiment at 20ºC resulting in a significant effect of parasitism on pupation height for this species too. Although at 25ºC the effect of A. tabida was not sig-nificant, the direction of induced change remained consistent with the change observed at 20ºC (Fig. 1b, 1h). A. tabida significantly reduced pupation height while A. citri increased pupation height. Further evidence for pupal site changes in response to parasitoid attack was found by col-lecting pupae from the wall and bottom at the start of the translocation experiment. Relatively more parasitoids compared to host pupae were found at the wall for A. persimilis, while for A. tabida, A. pleuralis and A. japonica, more parasitoids were found at the bottom. Pupal translocation experiments of the host showed that optimum pupation site differs be-tween individuals. Overall, individuals pupating on the wall survived bet-ter than those pupating on the bottom. However, bottom individuals did worse when translocated to the wall. Similar translocation experiments were performed for parasitized larvae to investigate whether the change in pupation behaviour is adaptive for the parasitoid under our laboratory conditions. The results of the translocation experiments are summarized in Table 4. Our results showed that diapause was induced at the preferred site for both A. citri and A. tabida, the species that showed significant change in pupation height. In terms of survival, the result obtained for A. citri was consistent with an adaptive explanation (Table 4). Hosts at-tacked by A. citri tended to pupate on the wall and transferring pupae to that location increased their survival rate. In contrast to our expectation, survival of A. tabida decreased at the selected pupation site. The analysis of foraging path lengths showed a significant reduction in foraging activity of larvae parasitized by A. tabida. As both foraging path length and pupa-tion height are to are large extent regulated by the for gene, this indicates that A. tabida may reduce the expression of this gene.
Pupation site in unparasitized Drosophila larvae is known to de-pend on moisture, temperature, density, phenotype / genotype (rover vs sitter) and species (Sameoto and Miller 1968, Barker 1971, Sokolowski et al. 1986, Schnebel and Grossfield 1992). The decision of where to pupate seems to be taken during the wandering stage which occurs a few hours before pupation (Riedl et al. 2007). During this stage, larvae move away from the food source and return to the food source many
32
Life-history evolution in hymenopteran parasitoids: the roles of host and climate
Chapter 2 Closely related parasitoids induce different pupation and foraging responses in Drosophila larvae
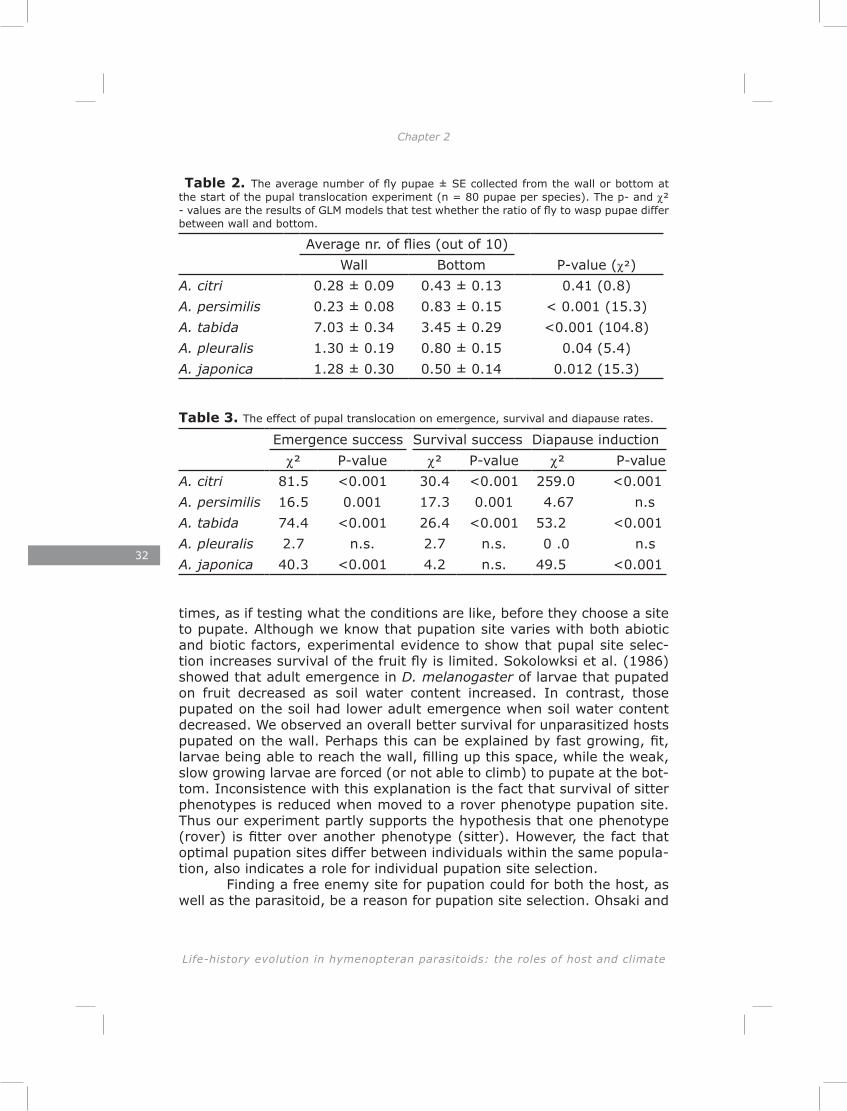
Table 2. The average number of fly pupae ± SE collected from the wall or bottom at the start of the pupal translocation experiment (n = 80 pupae per species). The p- and χ² - values are the results of GLM models that test whether the ratio of fly to wasp pupae differ between wall and bottom.
Average nr. of flies (out of 10)Wall Bottom P-value (χ²)
A. citri 0.28 ± 0.09 0.43 ± 0.13 0.41 (0.8)A. persimilis 0.23 ± 0.08 0.83 ± 0.15 < 0.001 (15.3)A. tabida 7.03 ± 0.34 3.45 ± 0.29 <0.001 (104.8)A. pleuralis 1.30 ± 0.19 0.80 ± 0.15 0.04 (5.4)A. japonica 1.28 ± 0.30 0.50 ± 0.14 0.012 (15.3)
Table 3. The effect of pupal translocation on emergence, survival and diapause rates.
Emergence success Survival success Diapause inductionχ² P-value χ² P-value χ² P-value
A. citri 81.5 <0.001 30.4 <0.001 259.0 <0.001 A. persimilis 16.5 0.001 17.3 0.001 4.67 n.sA. tabida 74.4 <0.001 26.4 <0.001 53.2 <0.001 A. pleuralis 2.7 n.s. 2.7 n.s. 0 .0 n.sA. japonica 40.3 <0.001 4.2 n.s. 49.5 <0.001
times, as if testing what the conditions are like, before they choose a site to pupate. Although we know that pupation site varies with both abiotic and biotic factors, experimental evidence to show that pupal site selec-tion increases survival of the fruit fly is limited. Sokolowksi et al. (1986) showed that adult emergence in D. melanogaster of larvae that pupated on fruit decreased as soil water content increased. In contrast, those pupated on the soil had lower adult emergence when soil water content decreased. We observed an overall better survival for unparasitized hosts pupated on the wall. Perhaps this can be explained by fast growing, fit, larvae being able to reach the wall, filling up this space, while the weak, slow growing larvae are forced (or not able to climb) to pupate at the bot-tom. Inconsistence with this explanation is the fact that survival of sitter phenotypes is reduced when moved to a rover phenotype pupation site. Thus our experiment partly supports the hypothesis that one phenotype (rover) is fitter over another phenotype (sitter). However, the fact that optimal pupation sites differ between individuals within the same popula-tion, also indicates a role for individual pupation site selection.
Finding a free enemy site for pupation could for both the host, as well as the parasitoid, be a reason for pupation site selection. Ohsaki and
Sato (1994) showed that an oligophagous butterfly, Pieris rapae, chose a suboptimal food resource host-plant for egg laying, which was less at-tractive for parasitoids. This increased its survival but came at the cost of losing component of fitness in other traits. Furthermore, parasitoids face the treat of being parasitized by hyperparasitoids. To avoid this, they can manipulate their host behaviour, for example by leaving the food patch or nest, in search for an enemy free space, in order to enhance its own survival (Stamp 1981, Fritz 1982, Brodeur and McNeil 1992, Grosman et al. 2008, Harvey et al. 2008).
Figure 3. The effect of translocation on diapause rate for the host in the five parasitoid species. BB-transferred from bottom to bottom, BW-transferred from bottom to wall, WB-transferred from wall to bottom and WW-transferred from wall to wall. See Fig. 2 for box-plot details.
Our results suggested that hosts pupate at higher locations in the jar (where conditions are drier) when parasitized by A. citri and A. persi-
33
Closely related parasitoids induce different pupation and foraging responses in Drosophila larvae
Sato (1994) showed that an oligophagous butterfly, Pieris rapae, chose a suboptimal food resource host-plant for egg laying, which was less at-tractive for parasitoids. This increased its survival but came at the cost of losing component of fitness in other traits. Furthermore, parasitoids face the treat of being parasitized by hyperparasitoids. To avoid this, they can manipulate their host behaviour, for example by leaving the food patch or nest, in search for an enemy free space, in order to enhance its own survival (Stamp 1981, Fritz 1982, Brodeur and McNeil 1992, Grosman et al. 2008, Harvey et al. 2008).
Figure 3. The effect of translocation on diapause rate for the host in the five parasitoid species. BB-transferred from bottom to bottom, BW-transferred from bottom to wall, WB-transferred from wall to bottom and WW-transferred from wall to wall. See Fig. 2 for box-plot details.
Our results suggested that hosts pupate at higher locations in the jar (where conditions are drier) when parasitized by A. citri and A. persi-
34
Life-history evolution in hymenopteran parasitoids: the roles of host and climate
Chapter 2 Closely related parasitoids induce different pupation and foraging responses in Drosophila larvae
milis. Both these species inhabit arid environments (Table 1), suggesting that their survival is highest in dry conditions. Our translocation experi-ments support this conclusion for A. citri, but found no significant effect in A. persimilis. The three remaining species (A. japonica, A. pleuralis and A. tabida) are all found in relatively humid environments. Hosts parasit-ized by these species pupated on or near the medium in relatively moist conditions. In the field, the optimal pupation site should minimize the risk of desiccation and microbial infection (Alphen and Thunissen 1982). As mentioned before, another likely mechanism is that the behaviour change may be to reduce hyper or superparasitism rate. Apart perhaps from des-iccation, none of these risks were present in our experiments. Thus, it could be that our lab stocks of these parasitoids have retained the ability to change host pupation behaviour in the absence of the other selective forces favouring these traits. To address this we need more field experi-ments for each species at their site of origin.
Unexpectedly, we found that pupation site affected the probabil-ity of entering diapause in three out of five species of parasitoids. Such conditional diapause has not previously been demonstrated in Drosophila parasitoids. Diapause in insects can be induced by cold, heat and desic-cation stress (Danks 1987, Denliger 2007) and is generally viewed as an adaptation to survive periods of unfavourable conditions (Masaki 2002). In A. japonica, diapause occurs at the wall, and this may be seen as a stress response to unfavourable conditions at this site. In contrast, in A. citri and A. tabida, diapause was most frequent at the site where the hosts tended to pupate after parasitism (wall and bottom, respectively). Perhaps natural selection favours high rates of diapause in these spe-cies, for example because successful reproduction is unlikely after normal development time. Suitable humid conditions may be short-lived in the arid environments inhabited by A. citri, while the habitat of A. tabida is strongly seasonal.
Figure 5. Foraging path lengths (distance travelled) of D. melanogaster larvae parasit-ized by three species of parasitoids. Cont-unparasitized control larvae, par-parasitized lar-vae. See Fig. 2 for boxplot information.
If diapause in our lab stocks is a genetic relic from their natural past, it is remarkable that it has been retained. Some of these species have been in culture in our lab for 13 years. During this time we certainly
Figure 4. The effect of translocation on the survival rate (emergence plus diapause) for the host and the five parasitoid species. BB-transferred from bottom to bottom, BW trans-ferred from bottom to wall, WB-transferred from wall to bottom and WW-transferred from wall to wall. See Fig. 2 for box-plot information.
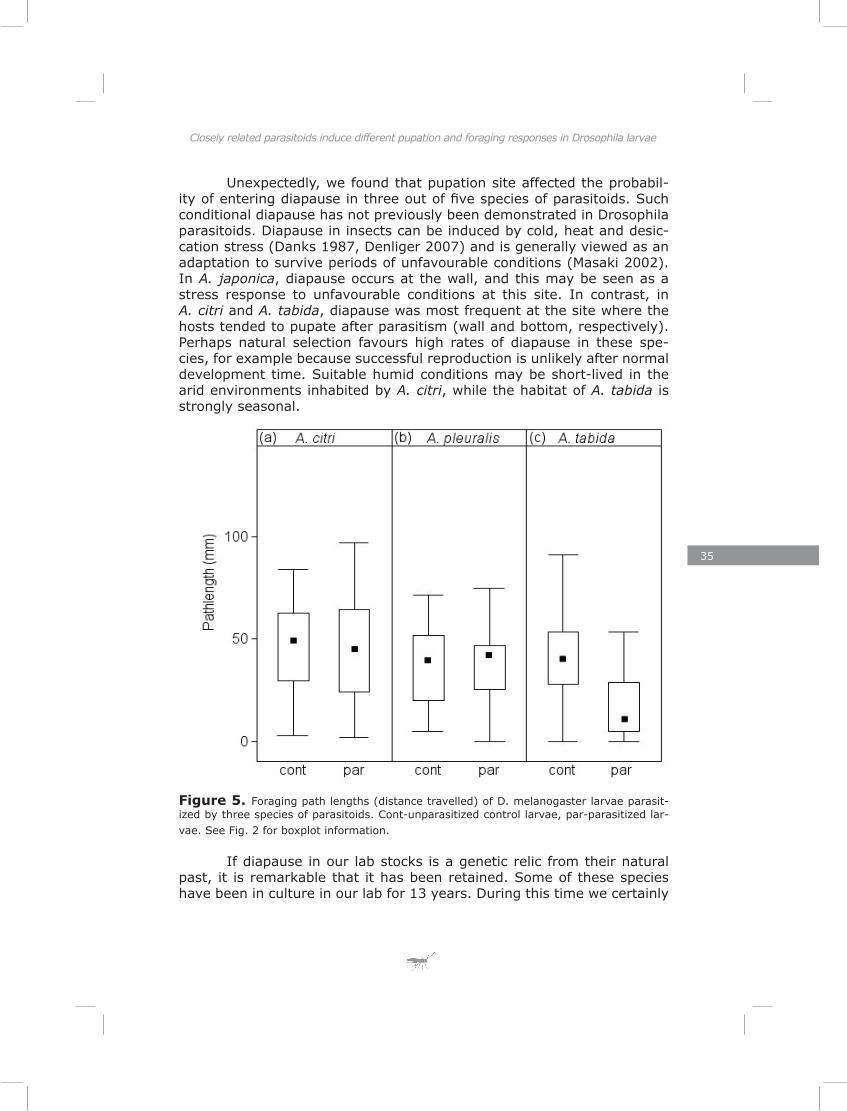
35
Closely related parasitoids induce different pupation and foraging responses in Drosophila larvae
milis. Both these species inhabit arid environments (Table 1), suggesting that their survival is highest in dry conditions. Our translocation experi-ments support this conclusion for A. citri, but found no significant effect in A. persimilis. The three remaining species (A. japonica, A. pleuralis and A. tabida) are all found in relatively humid environments. Hosts parasit-ized by these species pupated on or near the medium in relatively moist conditions. In the field, the optimal pupation site should minimize the risk of desiccation and microbial infection (Alphen and Thunissen 1982). As mentioned before, another likely mechanism is that the behaviour change may be to reduce hyper or superparasitism rate. Apart perhaps from des-iccation, none of these risks were present in our experiments. Thus, it could be that our lab stocks of these parasitoids have retained the ability to change host pupation behaviour in the absence of the other selective forces favouring these traits. To address this we need more field experi-ments for each species at their site of origin.
Unexpectedly, we found that pupation site affected the probabil-ity of entering diapause in three out of five species of parasitoids. Such conditional diapause has not previously been demonstrated in Drosophila parasitoids. Diapause in insects can be induced by cold, heat and desic-cation stress (Danks 1987, Denliger 2007) and is generally viewed as an adaptation to survive periods of unfavourable conditions (Masaki 2002). In A. japonica, diapause occurs at the wall, and this may be seen as a stress response to unfavourable conditions at this site. In contrast, in A. citri and A. tabida, diapause was most frequent at the site where the hosts tended to pupate after parasitism (wall and bottom, respectively). Perhaps natural selection favours high rates of diapause in these spe-cies, for example because successful reproduction is unlikely after normal development time. Suitable humid conditions may be short-lived in the arid environments inhabited by A. citri, while the habitat of A. tabida is strongly seasonal.
Figure 5. Foraging path lengths (distance travelled) of D. melanogaster larvae parasit-ized by three species of parasitoids. Cont-unparasitized control larvae, par-parasitized lar-vae. See Fig. 2 for boxplot information.
If diapause in our lab stocks is a genetic relic from their natural past, it is remarkable that it has been retained. Some of these species have been in culture in our lab for 13 years. During this time we certainly
36
Life-history evolution in hymenopteran parasitoids: the roles of host and climate
Chapter 2 Closely related parasitoids induce different pupation and foraging responses in Drosophila larvae
selected against diapausing individuals. After a maximum of four weeks, when all non-diapausing individuals have emerged, rearing jars are dis-carded, along with any diapausing individuals. The genetic basis of adult diapause induction is relatively well understood in Drosophila melanogas-ter. An allele of the gene timeless known to induce diapause has recently spread through D. melanogaster populations in Europe, where diapause enhances winter survival (Tauber et al. 2007). This example shows that diapause alleles can become fixed in a population rapidly.
A potential mechanism behind the change in host pupation beha-viour in response to parasitoid attack is a parasitoid-induced change in the expression of the for gene. This gene regulates foraging behaviour in the host, D. melanogaster (Sokolowski 1985). Rover phenotypes move more during foraging and pupate further from the food source than sitter phenotypes (Sokolowski and Hansell 1983, Graf and Sokolowski 1989). A. citri could simply alter their host’s pupation site by stimulating for ex-pression, while A. tabida could achieve pupation close to the food source by decreasing for expression For A. tabida it is known that alongside the egg, also venom is injected. This venom induces a reduction in behav-ioural activity of the larvae for the first 24 h after parasitism (Moreau et al. 2002). For A. citri, such venom injection is not known to occur (Pre-vost et al. 2005). Thus, perhaps this venom reduces activity in A. tabida right up until the time to pupation. To test this hypothesis, we measured path lengths of foraging D. melanogaster larvae that were parasitized by A. citri, A. tabida or A. pleuralis (as a control). Our results revealed no correlation between pupation and foraging behaviour by A. citri and A. pleuralis and hence for was not responsible for the change in pupation behaviour observed in A. citri. Many genes besides for contribute to the determination of pupation site (Riedl et al. 2007). Our result indicates that the change in pupation behaviour after attack by A. citri is regu-lated via genes other than foraging related genes. In contrast, we found a significant reduction in foraging path length of larvae parasitized by A. tabida compared to unparasitized control larvae. Therefore, the result for A. tabida is consistent with our hypothesis that parasitoids can alter host behaviour by altering the expression of the for gene. In order to confirm this observation, a more detailed study of host gene expression of the for gene and genes in this pathway in response to parasitism is underway. Checking the expression level of the other candidate genes for pupation height in the parasitized larvae by A. citri may provide evidence of other host gene expression manipulation in this species.
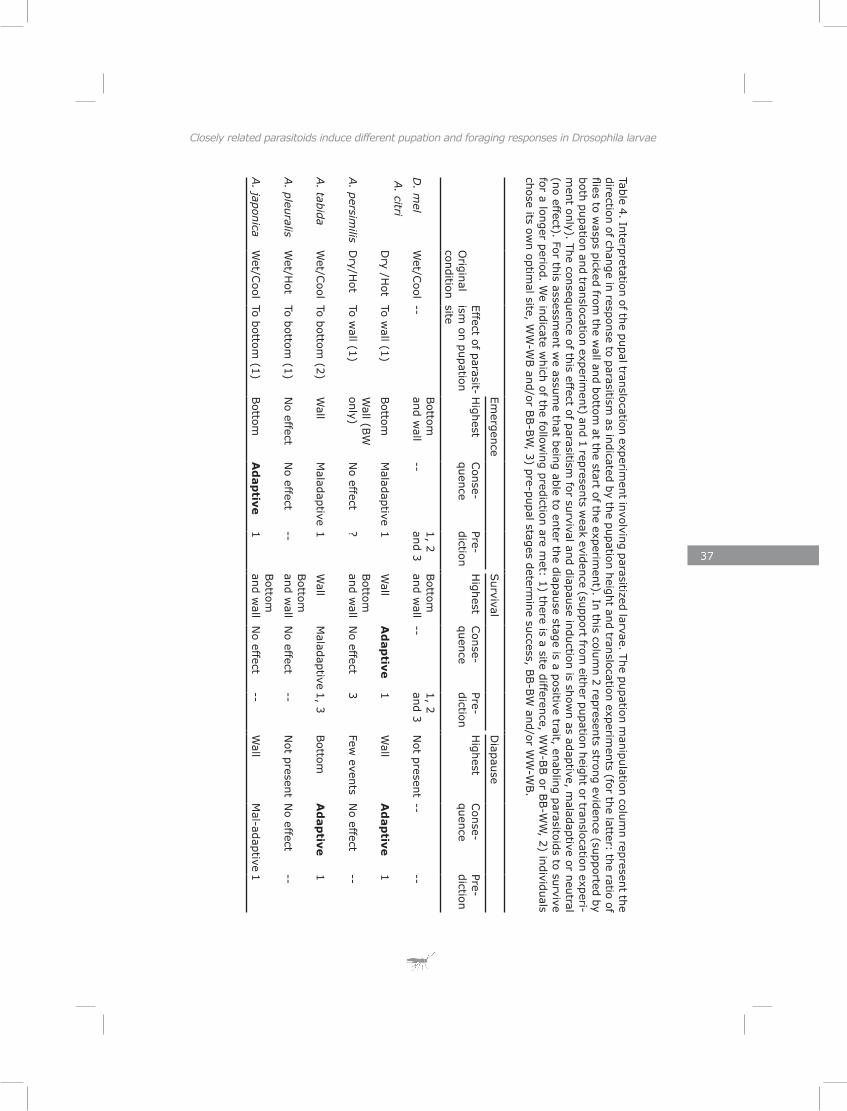
37
Closely related parasitoids induce different pupation and foraging responses in Drosophila larvae
Table 4. Interpretation of the pupal translocation experiment involving parasitized larvae. The pupation m
anipulation column represent the
direction of change in response to parasitism as indicated by the pupation height and translocation experim
ents (for the latter: the ratio of flies to w
asps picked from the w
all and bottom at the start of the experim
ent). In this column 2 represents strong evidence (supported by
both pupation and translocation experiment) and 1 represents w
eak evidence (support from either pupation height or translocation experi-
ment only). The consequence of this effect of parasitism
for survival and diapause induction is shown as adaptive, m
aladaptive or neutral (no effect). For this assessm
ent we assum
e that being able to enter the diapause stage is a positive trait, enabling parasitoids to survive for a longer period. W
e indicate which of the follow
ing prediction are met: 1) there is a site difference, W
W-B
B or B
B-W
W, 2) individuals
chose its own optim
al site, WW
-WB and/or B
B-B
W, 3) pre-pupal stages determ
ine success, BB-B
W and/or W
W-W
B.
Emergence
Survival
Diapause
Original
condition
Effect of parasit-ism
on pupation site
Highest
Conse-
quencePre-diction
Highest
Conse-
quencePre-diction
Highest
Conse-
quencePre-diction
D. m
elW
et/Cool
--Bottom
and w
all--
1, 2 and 3
Bottom
and w
all--
1, 2 and 3
Not present
----
A. citri
Dry /H
otTo w
all (1)Bottom
Maladaptive
1W
allA
dap
tive1
Wall
Ad
ap
tive1
A. persim
ilisD
ry/Hot
To wall (1)
Wall (B
W
only)N
o effect?
Bottom
and w
allN
o effect3
Few events
No effect
--
A. tabida
Wet/C
oolTo bottom
(2)W
allM
aladaptive1
Wall
Maladaptive
1, 3Bottom
Ad
ap
tive1
A. pleuralis
Wet/H
otTo bottom
(1)N
o effectN
o effect--
Bottom
and w
allN
o effect--
Not present
No effect
--
A. japonica
Wet/C
oolTo bottom
(1)Bottom
Ad
ap
tive1
Bottom
and w
allN
o effect--
Wall
Mal-adaptive
1
38
Life-history evolution in hymenopteran parasitoids: the roles of host and climate
Chapter 2
In conclusion, we have shown that D. melanogaster larvae alter their pupation behaviour after attack by Asobara parasitoids. The pat-terns are species-specific and may relate to the environmental conditions under which these species live in nature. While we show that individual pupation-site selection by D. melanogaster larvae increases survival, we were not able to show that parasitoid-induced changes were consistently adaptive. Last, the mechanistic processes underlying the change in pupa-tion behaviour appear to differ between species. While we are currently still a long way removed from a coherent explanation for these patterns, their study will certainly enhance our understanding of the way in which parasites influence their host’s behaviours.
Acknowledgements We would like to thank Prof. M. B. Sokolowski and Dr K. D. Wil-
liams from the Univ. of Toronto at Mississauga, Canada, for their support in terms of lab use and valuable comments related to pupation height experiments.
39
C h a p t e r 3
A lack of correlation between developmental time and adult life span in parasitoids: the role of metabolic rate and fat reserves
Abstract
Developmental time and body size correlate with lifespan in a wide range of taxa, but not in insect parasitoids. To explain this, we suggest that interspecific variation in intrinsic adult metabolic rates and differences in allocation of lipids to longevity and reproduction result in variation of adult lifespan, independent of development time. When the rate of development is independent of adult metabolic rate, adult lifespan is free to adapt to the adult environment. To test these ideas, we measured metabolic rate, lipid content and egg load at eclosion, developmental time, and lifespan of females with and without carbohydrate food in five species of Asobara, parasitoids of Drosophila. No relation between development time and adult longevity was found. As predicted, metabolic rates varied between species and appeared to trade off with adult longevity. We found no clear link between initial egg load and the longevity of a species, suggesting that lipid allocation may be less important in determining adult lifespan. Our results indicate that differences in metabolic rate have an important effect on adult lifespan, without affecting developmental rate in parasitoids.
Introduction
Quantifying traits affecting the fitness of organisms is one of the greatest challenges of evolutionary biology (Harvey 2005). Among these traits, special attention has been paid to those related to lifetime reproductive success as it seems the closest approximation to total fitness (Stearns 1989; Godfray 1994; Roff 1992). The transition from juvenile to adult is a crucial step in the life history of most organisms. This transition can be characterized either by the age or size of the organisms at which this transition occurs. Age at maturity influences lifetime reproductive
40
Life-history evolution in hymenopteran parasitoids: the roles of host and climate
Chapter 3 A lack of correlation between developmental time and adult life span in parasitoids
success and fecundity increases exponentially with body size in a wide range of animals (Stearns1992). Both body size and age at maturity have been predicted to correlate positively with lifespan (Stearns 1992). Comparative studies have confirmed such relationships in a broad range of taxa for age (Stearns & Crandel 1981; Charnov & Berrigan 1990; de Magalhaes et al. 2007) and for size (Roff 1992; Purvis and Harvey 1995). However, a comparative study of hymenopteran parasitoids revealed that the correlations between developmental time with either body size or adult life span are absent in this group (Blackburn 1991). Parasitoids thus appear to be an exception to the general rule. Eijs and van Alphen (1999) studied whether this lack of correlation could be explained by constraints imposed by the host. They measured developmental time, life span and body size in five species of Leptopilina, larval parasitoids of Drosophila, reared on different host species. Consistent with aforementioned studies they found no correlation between life span and developmental time of parasitoids. These traits also did not correlate with host developmental time. They suggested two mechanisms for this lack of relationship. First, stochasticity of the environment could select for delayed emergence and thus slower development. Second, developmental rate could be host specific. Here, we suggest a third hypothesis, i.e. that species differ in adult metabolic rate and that this causes variation in adult lifespan independent of developmental rate.
Parasitoids rely on resources obtained from a single host for their entire development. At least part of these resources must also be allocated to reproductive output and adult survival. Since solitary species often grow only marginally smaller than their host, host size may limit parasitoid body size (Sequeira and Mackauer 1992, Harvey and Strand 2002, Harvey et al. 2004). Adult parasitoids are further constrained by their lack of lipogenesis (Ellers 1996; Olson et al. 2000; Rivero and West 2002; Giron and Casas 2003; Lee et al. 2004; Visser and Ellers 2008). As a consequence, parasitoids should be strongly selected for optimal uptake and allocation of resources (Slansky 1986; Sequeira and Mackauer 1993; Jervis, et al.2008). Harvey (2005) argued that mortality risk at the developmental stage should influence the developmental strategy of parasitoids. Parasitoids in environments with high risk of larval mortality would be selected for higher growth rates and shorter developmental times compared to parasitoids in low-risk environments. Likewise, parasitoids in growing populations are under selection for faster development and shorter generation times. However, this would come at a cost to either lifespan or reproduction. Efficient uptake during the short developmental time may help to reduce this cost. Also, availability of resources rich in carbohydrate - which parasitoids can utilize as adults - may compensate for effects of faster development on longevity in nature.
Metabolic rate may influence life span in parasitoids. Metabolic
41
A lack of correlation between developmental time and adult life span in parasitoids
rate represents the rate of resource consumption by organisms. Fast consumption of any essential resource may result in shortened lifespan if it is not replenished from their diet. Another reason for a shorter adult lifespan in organisms with high metabolic rate is provided by Harman’s (1956) theory of the role of reactive oxygen species (ROS) in ageing. As the result of respiration, free radicals are generated in the mitochondria of organisms. The ROS destroy macromolecules and so contribute to aging. Thus higher metabolic rate in parasitoids may result in shorter life span by either exhausting lipid supplies or as a side effect of ROS.
Selection in different environments could have resulted in adaptive differences in resource allocation between related parasitoid species and explain why congeneric parasitoids developing on the same host and receiving the same amount of resources, exhibit enormous variation in life-history traits. Here we test the hypothesis that variation in adult metabolic rate and in lipid allocation affect lifespan in parasitoids independently from developmental rate. We predict that (1) interspecific variation in intrinsic adult metabolic rates and (2) interspecific differences in the allocation of lipid resources to longevity and reproduction result in interspecific variation of adult lifespan.
We also suggest that variation in developmental rate in parasitoids is adaptive and uncoupled from metabolic rate in adults. We measured metabolic rate, lipid reserves, weight, egg load, developmental time and life span (with and without carbohydrate resource) of newly emerged fe-males of five closely related species of Asobara, parasitoids of Drosophila larvae. Theses species originated from different environments, but were cultured on a common host (Drosophila melanogaster) under standardi-zed laboratory conditions.
Material and methods
Parasitoids and host
Five species of Drosophila parasitoids of the genus Asobara (Ichneumonoidea: Braconidae) were used in this study (Table 1). The species originated from different climatic and geographic regions in the world. All are koinobiont endoparasitoids, which parasitize their host by laying a single egg into the host body. The larvae allow the host to reach pupation before they kill it. Parasitoids were cultured at a 20 ± 1ºC and 16:8 h day/night regime on a laboratory strain of Drosophila melanogaster (WW), that has been maintained in the laboratory since 1966 at 25±1ºC and 16/8 h day/night regime.
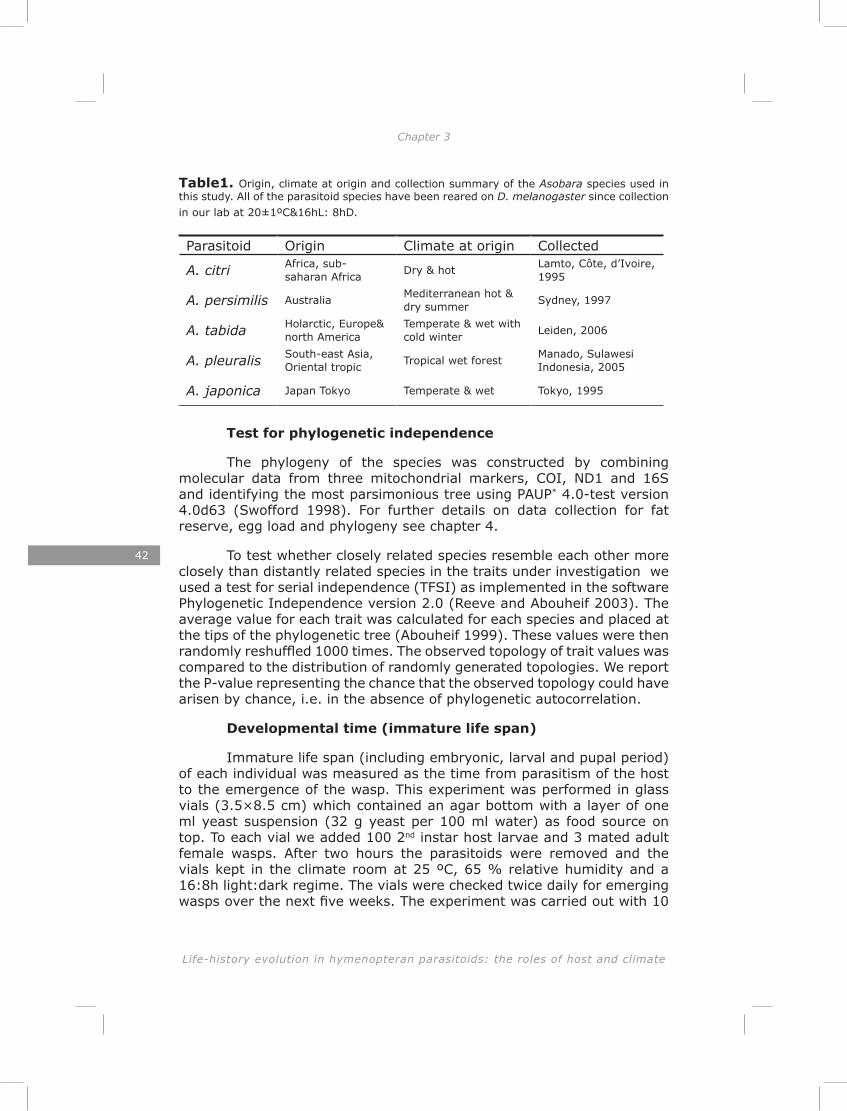
42
Life-history evolution in hymenopteran parasitoids: the roles of host and climate
Chapter 3 A lack of correlation between developmental time and adult life span in parasitoids
Table1. Origin, climate at origin and collection summary of the Asobara species used in this study. All of the parasitoid species have been reared on D. melanogaster since collection in our lab at 20±1ºC&16hL: 8hD.
Parasitoid Origin Climate at origin Collected
A. citri Africa, sub- saharan Africa Dry & hot Lamto, Côte, d’Ivoire,
1995
A. persimilis Australia Mediterranean hot & dry summer Sydney, 1997
A. tabida Holarctic, Europe& north America
Temperate & wet with cold winter Leiden, 2006
A. pleuralis South-east Asia, Oriental tropic Tropical wet forest Manado, Sulawesi
Indonesia, 2005
A. japonica Japan Tokyo Temperate & wet Tokyo, 1995
Test for phylogenetic independence
The phylogeny of the species was constructed by combining molecular data from three mitochondrial markers, COI, ND1 and 16S and identifying the most parsimonious tree using PAUP* 4.0-test version 4.0d63 (Swofford 1998). For further details on data collection for fat reserve, egg load and phylogeny see chapter 4.
To test whether closely related species resemble each other more closely than distantly related species in the traits under investigation we used a test for serial independence (TFSI) as implemented in the software Phylogenetic Independence version 2.0 (Reeve and Abouheif 2003). The average value for each trait was calculated for each species and placed at the tips of the phylogenetic tree (Abouheif 1999). These values were then randomly reshuffled 1000 times. The observed topology of trait values was compared to the distribution of randomly generated topologies. We report the P-value representing the chance that the observed topology could have arisen by chance, i.e. in the absence of phylogenetic autocorrelation.
Developmental time (immature life span)
Immature life span (including embryonic, larval and pupal period) of each individual was measured as the time from parasitism of the host to the emergence of the wasp. This experiment was performed in glass vials (3.5×8.5 cm) which contained an agar bottom with a layer of one ml yeast suspension (32 g yeast per 100 ml water) as food source on top. To each vial we added 100 2nd instar host larvae and 3 mated adult female wasps. After two hours the parasitoids were removed and the vials kept in the climate room at 25 ºC, 65 % relative humidity and a 16:8h light:dark regime. The vials were checked twice daily for emerging wasps over the next five weeks. The experiment was carried out with 10
43
A lack of correlation between developmental time and adult life span in parasitoids
replicates and repeated once, giving a total of 20 replicates per species.
Longevity (adult life span) with and without food
Longevity was measured for 80 newly emerged virgin female wasps per species in each treatment. The wasps were kept in groups of four in small glass tubes (2.2×8.0 cm). To avoid desiccation, a layer of agar was added to the bottom of each tube. The 20 tubes per species were divided in two groups. A drop of honey was added as a food source to the underside of the sponge lid of 10 of the tubes, while the other 10 tubes were left without honey. The vials were checked for dead wasps twice per day for the next five weeks. This experiment was carried out in a climate room at 25 ºC, 65 % relative humidity and a 16:8h light:dark regime.
Metabolic rate
For each replicate, virgin female wasps were assayed for CO2 production at 25ºC. The wasps were harvested within five hours after eclosion, isolated and kept at 4ºC. The day after emergence the wasps were anesthetized on ice and transferred to cylindrical glass tubes. The wasps were then assayed in a 16-channel respirometer (Li-Cor 6251 infrared CO2 detector; Sable System International, www.sablesys.com ). As the amount of CO2 produced by a single wasp was too low to be detected by this respirometer, the wasps were pooled in groups of 20 individuals per container. To avoid interaction of the wasps, which may cause increased activity and consequently higher metabolic rate, the experiment was carried out in complete darkness. To reduce the effect of time of day, we performed the experiment according to a time schedule in which we measured three replicates of each species simultaneously twice per day. All of the measurements were performed in the mornings. In total, the experiment consisted of 24 replicates per species and lasted 4 days. The data were collected with ExpeDataTM software (Sable System International, www.sablesys.com ) and exported to an excel data sheet for further analysis.
Fat reserve and egg load
Egg load and fat content were measured on virgin female wasps harvested within five hours of eclosion. For each species 35 individuals were randomly chosen from 15 rearing jars, isolated and stored at -80ºC until further analysis. To measure egg load wasps were dissected and ovarioles opened in a drop of demineralized water. The number of eggs was counted on a photograph of whole egg batches made under a stereo-microscope. Fat reserve was measured by ether extraction (David et al. 1975, Ellers 1996).
44
Life-history evolution in hymenopteran parasitoids: the roles of host and climate
Chapter 3 A lack of correlation between developmental time and adult life span in parasitoids
Statistic analysis
Developmental time and longevity of females of each species were analyzed by applying a Weibull parametric survival regression in the free statistical software R 2.5.1 (Ihaka & Gentleman 1996; Therneau & Grambsch 2000). We included the random jar effect as frailty in this model. The results of the metabolic rate and fat reserves were compared between species using analysis of covariance (ANCOVA) in which dry weight was added as covariate to the models to represent body size. In the analysis of metabolic rate we first log transformed metabolic rate (the amount of CO2 produced by the wasps per hour). In each case we searched for the minimum adequate model by starting with the maximal model, then dropping the interaction term and then main factors from the model if non-significant.
Results
Phylogenetic independence
None of the traits under investigation showed significant phylogenetic autocorrelation (tests for serial independence: developmental time P = 0.32; life span with food P = 0.09; life span without food P = 0.17; fat content P = 0.19; egg load P = 0.09, metabolic rate P = 0.15). We therefore did not correct for phylogenetic effects.
Developmental time
Developmental time differed significantly among the five species of Asobara (Likelihood ratio test, χ² = 3254.0, d.f. = 4, P < 0.001). Post-hoc z-test revealed that developmental time was shortest in A. pleuralis and significantly different from all other species. A. tabida had the longest developmental time (Fig 1, Table 2). A. citri also had a long developmental time, although significantly shorter than that of A. tabida (Fig.1, table 2, Appendix 2). A. persimilis showed intermediate developmental time significantly different from the other species except from A. japonica (Appendix 2).
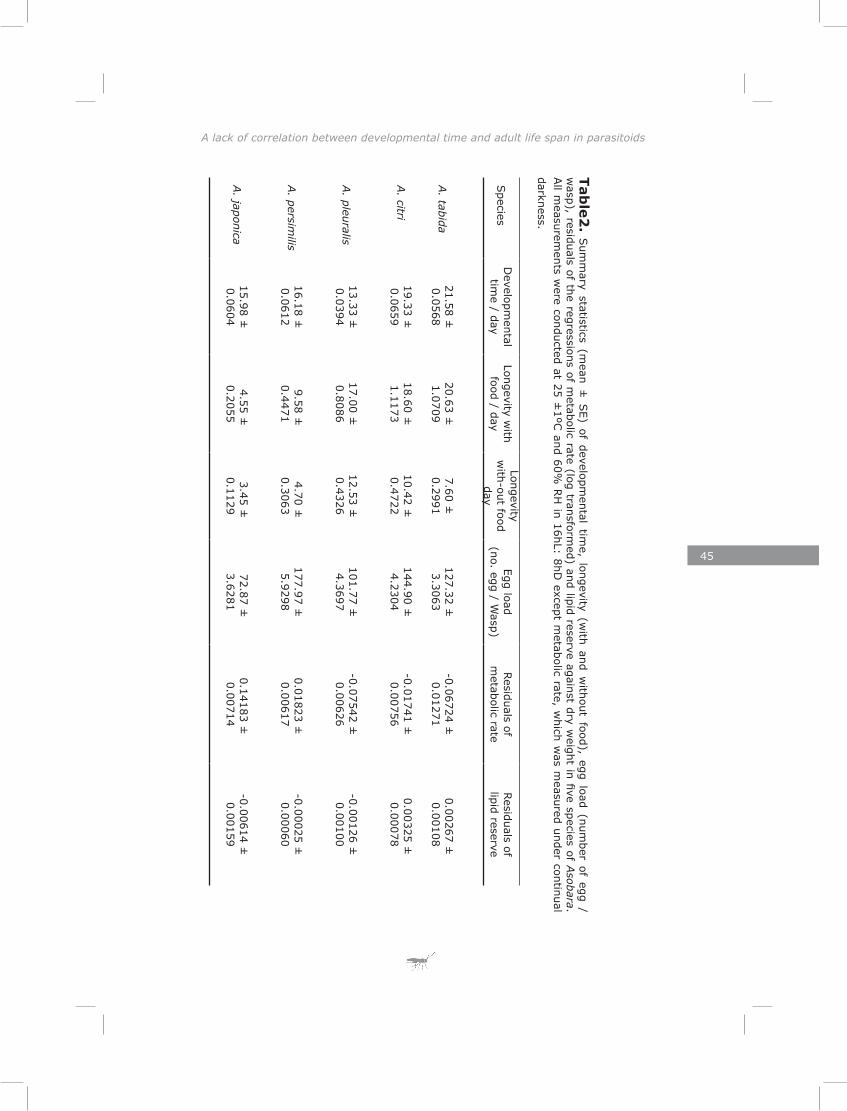
45
A lack of correlation between developmental time and adult life span in parasitoids
Tab
le2
. Sum
mary statistics (m
ean ± S
E) of developmental tim
e, longevity (with and w
ithout food), egg load (number of egg /
wasp), residuals of the regressions of m
etabolic rate (log transformed) and lipid reserve against dry w
eight in five species of Asobara.
All m
easurements w
ere conducted at 25 ±1ºC
and 60% R
H in 16hL: 8hD
except metabolic rate, w
hich was m
easured under continual darkness.
Species
Developm
ental tim
e / dayLongevity w
ith food / day
Longevity w
ith-out food day
Egg load (no. egg / W
asp)Residuals of
metabolic rate
Residuals of
lipid reserve
A. tabida
21.58 ±
0.056820.63 ±
1.0709
7.60 ±
0.2991127.32 ±
3.3063
-0.06724 ±
0.01271 0.00267 ±
0.00108
A. citri
19.33 ±
0.065918.60 ±
1.1173
10.42 ±
0.4722144.90 ±
4.2304
-0.01741 ±
0.00756 0.00325 ±
0.00078
A. pleuralis
13.33 ±
0.039417.00 ±
0.8086
12.53 ±
0.4326101.77 ±
4.3697
-0.07542 ±
0.00626-0.00126 ±
0.00100
A. persim
ilis16.18 ±
0.0612
9.58 ±
0.4471 4.70 ±
0.3063
177.97 ±
5.9298 0.01823 ±
0.00617
-0.00025 ±
0.00060
A. japonica
15.98 ±
0.0604 4.55 ±
0.2055
3.45 ±
0.1129 72.87 ±
3.6281
0.14183 ±
0.00714-0.00614 ±
0.00159
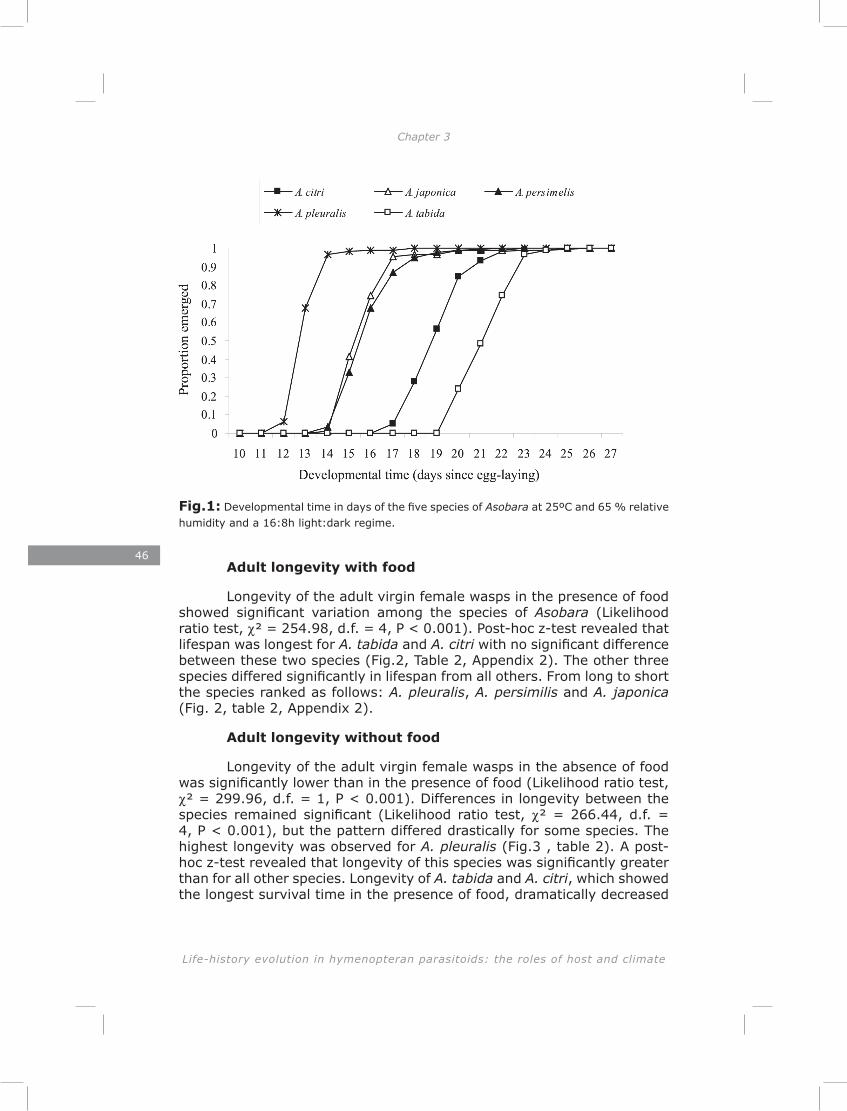
46
Life-history evolution in hymenopteran parasitoids: the roles of host and climate
Chapter 3 A lack of correlation between developmental time and adult life span in parasitoids
Fig.1: Developmental time in days of the five species of Asobara at 25ºC and 65 % relative humidity and a 16:8h light:dark regime.
Adult longevity with food
Longevity of the adult virgin female wasps in the presence of food showed significant variation among the species of Asobara (Likelihood ratio test, χ² = 254.98, d.f. = 4, P < 0.001). Post-hoc z-test revealed that lifespan was longest for A. tabida and A. citri with no significant difference between these two species (Fig.2, Table 2, Appendix 2). The other three species differed significantly in lifespan from all others. From long to short the species ranked as follows: A. pleuralis, A. persimilis and A. japonica (Fig. 2, table 2, Appendix 2).
Adult longevity without food
Longevity of the adult virgin female wasps in the absence of food was significantly lower than in the presence of food (Likelihood ratio test, χ² = 299.96, d.f. = 1, P < 0.001). Differences in longevity between the species remained significant (Likelihood ratio test, χ² = 266.44, d.f. = 4, P < 0.001), but the pattern differed drastically for some species. The highest longevity was observed for A. pleuralis (Fig.3 , table 2). A post-hoc z-test revealed that longevity of this species was significantly greater than for all other species. Longevity of A. tabida and A. citri, which showed the longest survival time in the presence of food, dramatically decreased
when adults were kept without food. The decrease in longevity of A. tabida was greater than for A. citri. (Fig.3, table 2, Appendix 2). The remaining two species showed the same order for longevity without food as in the presence of food (Appendix 2).
Fig.2: Longevity of adult female wasps with food (carbohydrate resource) in the five species of Asobara at 25ºC and 65 % relative humidity and a 16:8h light:dark regime.
Fig.3: Longevity of adult female wasps without food ( carbohydrate resource) in the five species of Asobara at 25ºC and 65 % relative humidity and a 16:8h light:dark regime.
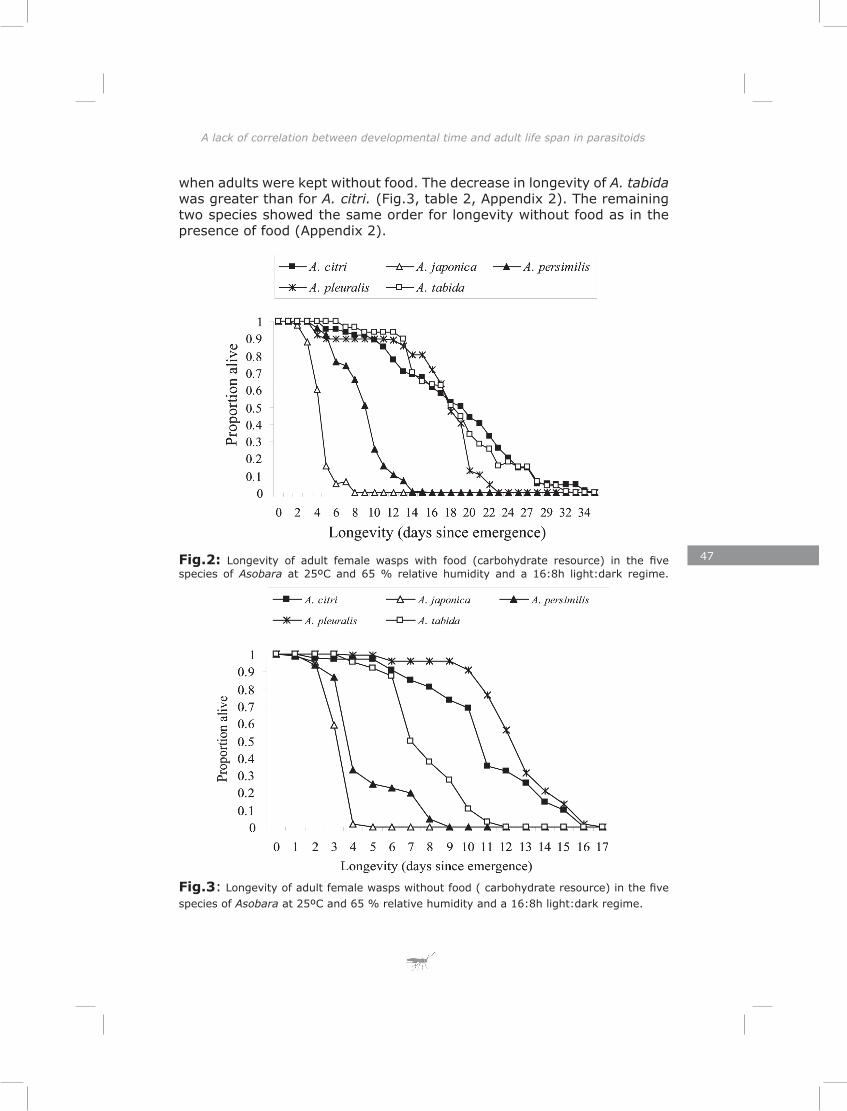
47
A lack of correlation between developmental time and adult life span in parasitoids
Fig.1: Developmental time in days of the five species of Asobara at 25ºC and 65 % relative humidity and a 16:8h light:dark regime.
Adult longevity with food
Longevity of the adult virgin female wasps in the presence of food showed significant variation among the species of Asobara (Likelihood ratio test, χ² = 254.98, d.f. = 4, P < 0.001). Post-hoc z-test revealed that lifespan was longest for A. tabida and A. citri with no significant difference between these two species (Fig.2, Table 2, Appendix 2). The other three species differed significantly in lifespan from all others. From long to short the species ranked as follows: A. pleuralis, A. persimilis and A. japonica (Fig. 2, table 2, Appendix 2).
Adult longevity without food
Longevity of the adult virgin female wasps in the absence of food was significantly lower than in the presence of food (Likelihood ratio test, χ² = 299.96, d.f. = 1, P < 0.001). Differences in longevity between the species remained significant (Likelihood ratio test, χ² = 266.44, d.f. = 4, P < 0.001), but the pattern differed drastically for some species. The highest longevity was observed for A. pleuralis (Fig.3 , table 2). A post-hoc z-test revealed that longevity of this species was significantly greater than for all other species. Longevity of A. tabida and A. citri, which showed the longest survival time in the presence of food, dramatically decreased
when adults were kept without food. The decrease in longevity of A. tabida was greater than for A. citri. (Fig.3, table 2, Appendix 2). The remaining two species showed the same order for longevity without food as in the presence of food (Appendix 2).
Fig.2: Longevity of adult female wasps with food (carbohydrate resource) in the five species of Asobara at 25ºC and 65 % relative humidity and a 16:8h light:dark regime.
Fig.3: Longevity of adult female wasps without food ( carbohydrate resource) in the five species of Asobara at 25ºC and 65 % relative humidity and a 16:8h light:dark regime.
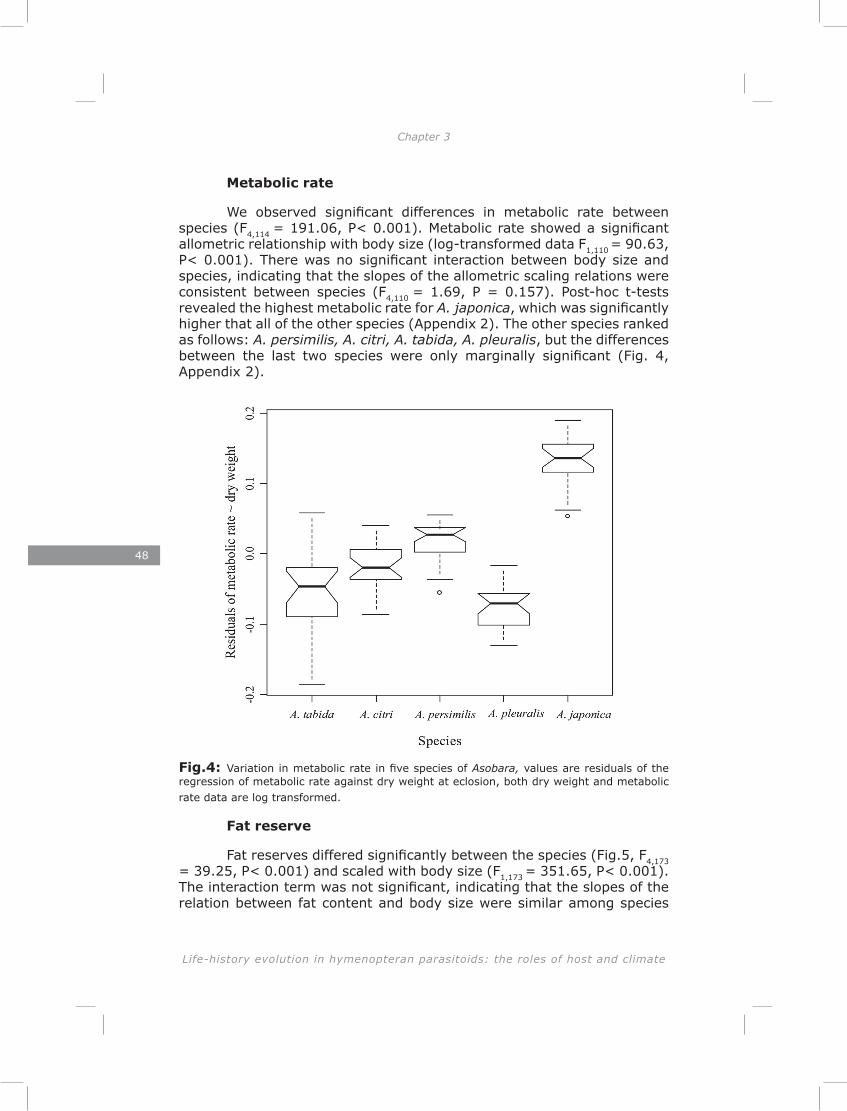
48
Life-history evolution in hymenopteran parasitoids: the roles of host and climate
Chapter 3 A lack of correlation between developmental time and adult life span in parasitoids
Metabolic rate
We observed significant differences in metabolic rate between species (F4,114
= 191.06, P< 0.001). Metabolic rate showed a significant allometric relationship with body size (log-transformed data F1,110
= 90.63, P< 0.001). There was no significant interaction between body size and species, indicating that the slopes of the allometric scaling relations were consistent between species (F4,110
= 1.69, P = 0.157). Post-hoc t-tests revealed the highest metabolic rate for A. japonica, which was significantly higher that all of the other species (Appendix 2). The other species ranked as follows: A. persimilis, A. citri, A. tabida, A. pleuralis, but the differences between the last two species were only marginally significant (Fig. 4, Appendix 2).
Fig.4: Variation in metabolic rate in five species of Asobara, values are residuals of the regression of metabolic rate against dry weight at eclosion, both dry weight and metabolic rate data are log transformed.
Fat reserve
Fat reserves differed significantly between the species (Fig.5, F4,173
= 39.25, P< 0.001) and scaled with body size (F1,173 = 351.65, P< 0.001).
The interaction term was not significant, indicating that the slopes of the relation between fat content and body size were similar among species
(F1,173 = 1.11, P = 0.35). Post-hoc t-tests revealed the following ranking of
the five species: A. tabida/A. citri, A. persimilis, A. pleuralis, A. japonica (Fig.5, Appendix 2).
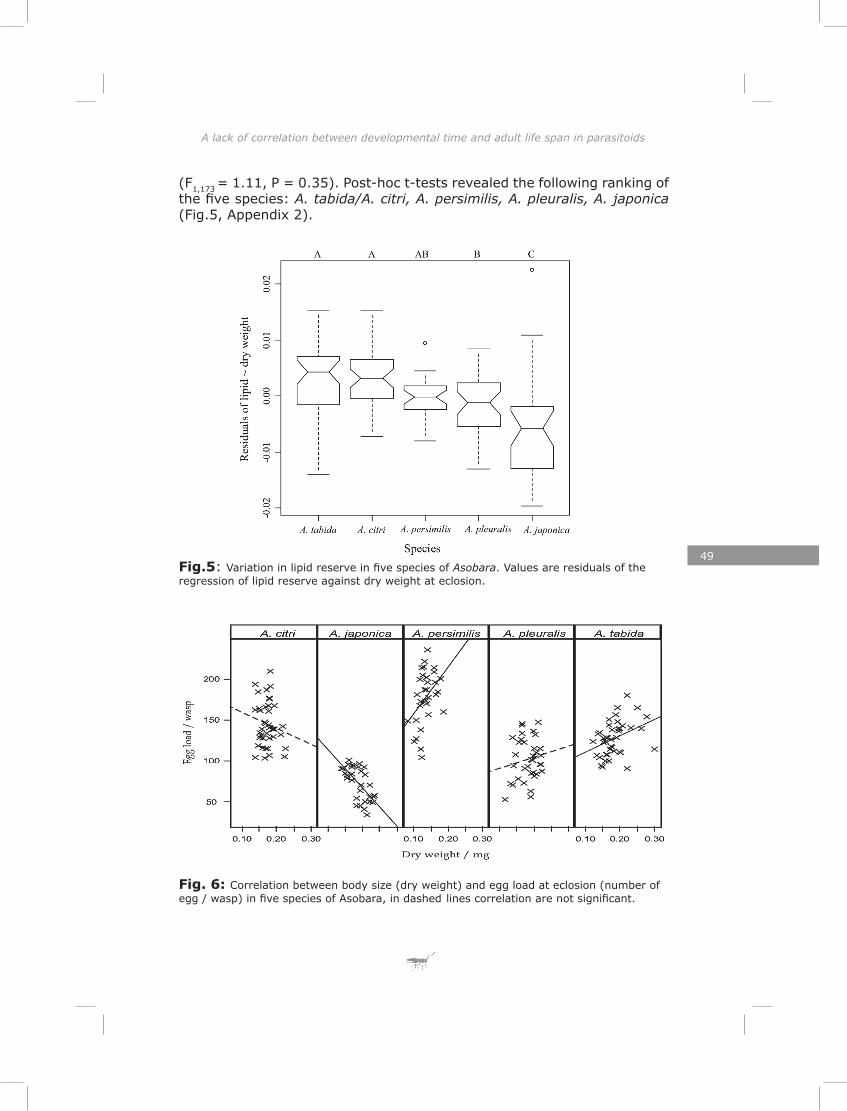
49
A lack of correlation between developmental time and adult life span in parasitoids
(F1,173 = 1.11, P = 0.35). Post-hoc t-tests revealed the following ranking of
the five species: A. tabida/A. citri, A. persimilis, A. pleuralis, A. japonica (Fig.5, Appendix 2).
Fig.5: Variation in lipid reserve in five species of Asobara. Values are residuals of the regression of lipid reserve against dry weight at eclosion.
Fig. 6: Correlation between body size (dry weight) and egg load at eclosion (number of egg / wasp) in five species of Asobara, in dashed lines correlation are not significant.
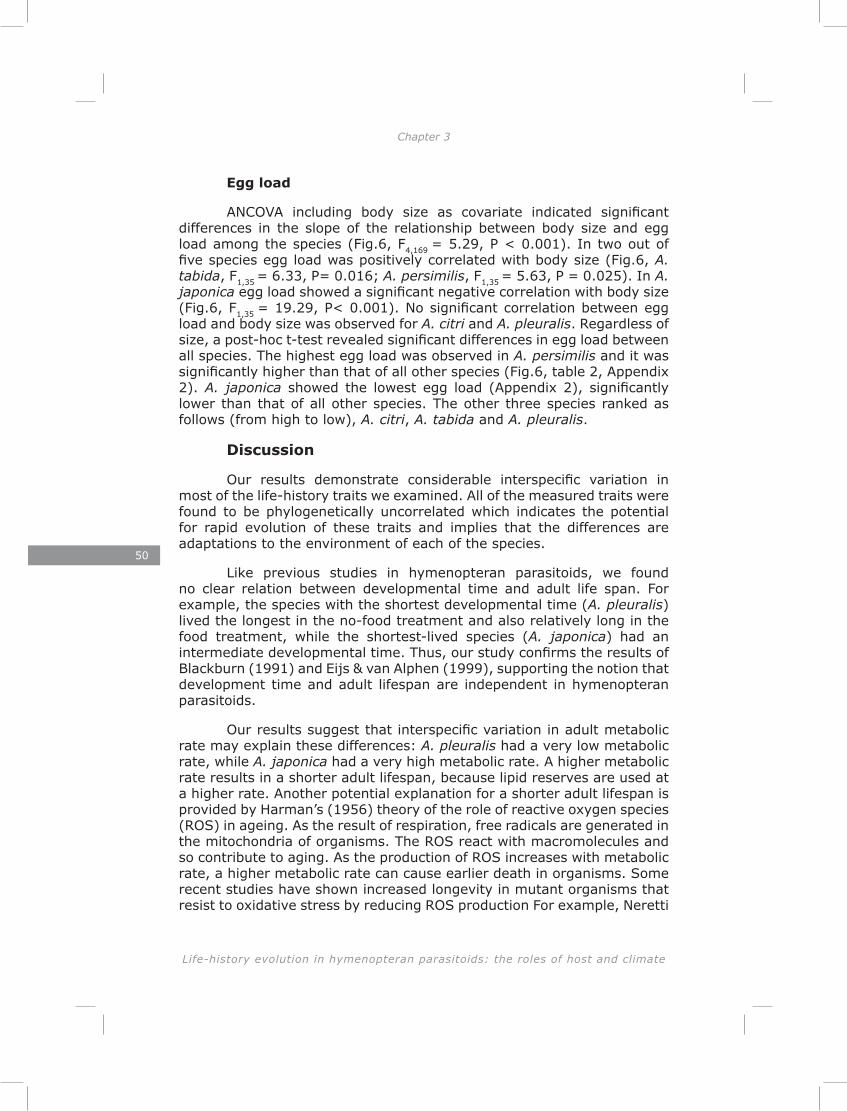
50
Life-history evolution in hymenopteran parasitoids: the roles of host and climate
Chapter 3 A lack of correlation between developmental time and adult life span in parasitoids
Egg load
ANCOVA including body size as covariate indicated significant differences in the slope of the relationship between body size and egg load among the species (Fig.6, F4,169
= 5.29, P < 0.001). In two out of five species egg load was positively correlated with body size (Fig.6, A. tabida, F1,35
= 6.33, P= 0.016; A. persimilis, F1,35 = 5.63, P = 0.025). In A.
japonica egg load showed a significant negative correlation with body size (Fig.6, F1,35
= 19.29, P< 0.001). No significant correlation between egg load and body size was observed for A. citri and A. pleuralis. Regardless of size, a post-hoc t-test revealed significant differences in egg load between all species. The highest egg load was observed in A. persimilis and it was significantly higher than that of all other species (Fig.6, table 2, Appendix 2). A. japonica showed the lowest egg load (Appendix 2), significantly lower than that of all other species. The other three species ranked as follows (from high to low), A. citri, A. tabida and A. pleuralis.
Discussion
Our results demonstrate considerable interspecific variation in most of the life-history traits we examined. All of the measured traits were found to be phylogenetically uncorrelated which indicates the potential for rapid evolution of these traits and implies that the differences are adaptations to the environment of each of the species.
Like previous studies in hymenopteran parasitoids, we found no clear relation between developmental time and adult life span. For example, the species with the shortest developmental time (A. pleuralis) lived the longest in the no-food treatment and also relatively long in the food treatment, while the shortest-lived species (A. japonica) had an intermediate developmental time. Thus, our study confirms the results of Blackburn (1991) and Eijs & van Alphen (1999), supporting the notion that development time and adult lifespan are independent in hymenopteran parasitoids.
Our results suggest that interspecific variation in adult metabolic rate may explain these differences: A. pleuralis had a very low metabolic rate, while A. japonica had a very high metabolic rate. A higher metabolic rate results in a shorter adult lifespan, because lipid reserves are used at a higher rate. Another potential explanation for a shorter adult lifespan is provided by Harman’s (1956) theory of the role of reactive oxygen species (ROS) in ageing. As the result of respiration, free radicals are generated in the mitochondria of organisms. The ROS react with macromolecules and so contribute to aging. As the production of ROS increases with metabolic rate, a higher metabolic rate can cause earlier death in organisms. Some recent studies have shown increased longevity in mutant organisms that resist to oxidative stress by reducing ROS production For example, Neretti
51
A lack of correlation between developmental time and adult life span in parasitoids
(2009) showed significant reduction in ROS and protein damage in long lived mutant Drosophila in comparison with control flies. Although a recent study suggests that natural selection may favour long lived species to reduce mtDNA mutation rates caused by ROS accumulation (Galtier et al. 2009), metabolic rate generally plays a crucial role in aging. Consistent with these studies our results showed a negative relationship between longevity and metabolic rate in Asobara.
Providing adult wasps with a carbohydrate food source significantly improved their survival. However, the strength of the effect differed between species. Two species A. persimilis and A. tabida were more dependent on supplementary carbohydrate food than others and showed a sharp decline in longevity when deprived from food whereas the reduction in longevity of A. pleuralis and A. citri in absence of food was substantially lower. A. japonica lived very short in both food and no food treatments. Extended longevity in time-limited parasitoids is likely to be important as it allows them to exhaust their egg supply during their lifetime (Rosenheim 1996). The effect of supplementary food sources and the ability to digest different polysaccharides by adult parasitoids has been documented (Jones and Jackson 1990; Jervis et al. 1996;Williams and Roane 2007). Longevity of a hymenopteran egg parasitoid, Anaphes jole, which was limited in the absence of food to a maximum of 3 days, exceeded 10 days when honey was provided as food (Jones and Jackson 1990). Williams and Roane (2007), in a comparison of the effect of different carbohydrates on survivorship of A. jole, demonstrated that the largest effect on longevity was found for three main sugars in nectar: sucrose, glucose and fructose. Our finding that adult feeding enhanced longevity in some species was thus consistent with previous studies. Lipid acquired during development can be used to either survive longer or to increase egg production (Ellers 1996). Differences in allocation of lipids to survival and reproduction may explain why species differ in their dependency on supplementary food as adults.
We expected to find a trade-off between longevity and initial allocation to reproduction. However, our results showed no relation between initial egg load and longevity in experiments either with or without food. Initial egg load in synovigenic species, therefore, should not be used to estimate lifetime fecundity and total allocation of resources to reproduction. A better estimate may be the ovigeny index (OI), which is the ratio of the number of mature egg at eclosion to potential lifetime egg production (Jervis et al.2001). It is a measure for the timing of reproduction from early life to later in life and may provide an indication of how much lipid will be used in future reproduction. In chapter 4, we establish that the different species of Asobara differ in ovigeny index. We showed relatively low OI for both A. tabida (0.64 ± 0.01) and A. pleuralis (0.53 ± 0.02) in comparison with species with high OI like A.persimilis (0.80 ± 0.02).
52
Life-history evolution in hymenopteran parasitoids: the roles of host and climate
Chapter 3 A lack of correlation between developmental time and adult life span in parasitoids
The reason why the two species, A. pleuralis and A. tabida with higher numbers of immature eggs behaved differently in absence of food, could be their different strategies in using the lipids for the maturation of eggs. Egg maturation comes at the cost of a decline in adult life span in the absence of food. Ellers (1996) showed a rapid decline in lipid reserves of A. tabida a few days after eclosion in both food and no food treatments, which shows that this species uses lipids to mature eggs early during adult life. Converting more lipids into eggs in early life could result in early death due to the exhaustion of resources. This may explain the short life span of A. tabida in the no food treatment, despite its high level of stored fat at emergence. In contrast to A. tabida, A. pleuralis had a long lifespan in the no food treatment and low lipid reserves. This species most likely postpones egg maturation until later in life, and would thus be able to use its lipid reserves to live longer when food is not available. In addition, the lower metabolic rate of A. pleuralis enables this species to live relatively long on low fat reserves.
Few studies on the fitness effects of developmental time are available for parasitoids. Godfray (1994) suggested that female wasps emerging early in spring may have easier access to unexploited hosts than later emerging conspecifics. Fast development may also be selected for in growing populations, where shorter generation times increase fitness. Fast development may further benefit parasitoids when they are suffering high pre-adult mortality due to natural enemies (Harvey and Strands 2002). The short developmental time we observed for A. pleuralis may partially be explained by high mortality risk during development in the tropical rain forest, due to vertebrate scavengers eating fermenting fruits from the forest floor, resulting in the death of all host larvae. The short generation time in this species would also allow its populations to recover, after crashes of the Drosophila populations during the dry season. However, studies of the population dynamics of these parasitoids and their natural enemies in the field are needed to assess larval mortality rates in different species and to assess the relative importance of these sources of selection.
Parasitoids are well known to manipulate their hosts to increase their own fitness (Stamp 1981; Fritz 1982, Brodeur and McNeil 1992, Grosman et al. 2008, Harvey et al. 2008). Our study on pupation site selection of the same five species of Asobara disclosed host manipulation by two species with relatively long development times, A. tabida and A. citri, but not by the other three species (chapter 2). It is likely that these parasitoids are able to reduce pupal mortality rate by manipulating the host’s pupation site instead of reducing developmental time. By considering the fact that changing pupation site may result in less predation and mortality rate of parasitoids during developmental stages it is expected that these two species are less subjected to a high selection pressure for
53
A lack of correlation between developmental time and adult life span in parasitoids
shorter developmental time which is consistent with our findings.
Although resource uptake efficiency is a fitness related trait for all parasitoid species, this trait seems to be traded off with other traits and also varies in fitness value according to habitat. The five species of hymenopteran parasitoid used in this study differed in their resource uptake efficiency during development. For example, the fastest developing species - A. pleuralis - had relatively high lipid reserves compared to the two species with intermediate development times, A. persimilis and A. japonica. Fast resource uptake has been documented in other endoparasitoids (Slansky 1986; Sequeira and Mackauer 1993; Harvey 2005).
To conclude we suggest that lifespan and developmental time in parasitoids are genetically and physiologically uncoupled.

55
C h a p t e r 4
Adult size and early investment in reproduction in five species of Asobara parasitoid wasps
Abstract
Adult parasitoid wasps are unable to synthesize lipids and are thus dependent on lipids obtained from their host during larval development. These insects therefore face a trade-off between the investment of lipids in eggs (reproduction) or in the maintenance of soma (survival). A theoretical study by Ellers & Jervis, 2003 predicted that resource allocation should depend on body size in parasitoids and reflect environmental selection pressures. We asked how body size should affect the timing of egg production in parasitoids. We measured the body size, lipid reserves, and reproductive investment (number of eggs, ovigeny index (OI) and egg size) at eclosion in five closely related species of Asobara, parasitoids of Drosophila larvae, originating from different geographic and climatic environments. Our results show significant interspecific variation in all these traits. A diagnostic test for phylogenetic independence revealed that closely related species did not resemble each other more closely than expected by chance for all traits measured. Lipid reserves scaled positively with body size both between and within species. In agreement with theoretical studies OI correlated negatively with body size both between and within species. Egg mass correlated negatively with lipid reserves both between and within species. This indicates the presence of a trade-off between allocation of lipids to reproduction and survival. With the exception of the most extreme pro-ovigenic species, A. persimilis we found that this strategy is compensated by small egg size. We discuss the potential role of habitat characteristics in shaping the interspecific variation in resource allocation strategies.
Introduction
Insect parasitoids seem unable to synthesize lipids as adults and thus depend on the limited lipid resources they obtain from their host
56
Life-history evolution in hymenopteran parasitoids: the roles of host and climate
Chapter 4 Adult size and early investment in reproduction in five species of Asobara parasitoid wasps
during larval development (Slansky 1986; Ellers, 1996; Rivero & Casas, 1999 ; Olson et al., 2000; Rivero & West, 2002; Casas et al., 2003; Giron & Casas, 2003; Lee et al., 2004 ; Visser & Ellers 2008). Lipids are needed both for the maintenance of the soma and for egg production, creating a trade-off between reproduction and survival (Roff 1992). Optimization of lipid allocation to these two components of fitness is thus a vital life-history decision (Ellers and Jervis 2003; Ellers et al. 2000b; Harvey et al. 2001; Jervis et al. 2008; Jervis et al. 2003; Jervis et al. 2001; Jervis and Ferns 2004; Thorne et al. 2006). Given that different reproductive rates are optimal in different environments, we expect resource allocation strategies to differ between environments.
Based on the timing of egg maturation, two modes of reproduction in parasitoids were recognized by early students of parasitoid life history, namely pro-ovigeny and synovigeny (Flander 1950). Pro-ovigenic parasitoids mature all of their eggs during pre-adult life and eclose with all eggs mature, while synovigenic parasitoids mature part or all of their eggs during adult lifetime. However, a wide range of variation in the number of mature or immature egg at emergence has been documented in synovigenic parasitoids (Quicke 1997). This variation can be described by the ovigeny index (OI), which is defined as the ratio of mature eggs at female eclosion to potential lifetime egg production (Jervis et al. 2001). Jervis et al. (2001) used the OI to describe inter- and intraspecific variation in the timing of reproduction. Jervis and Ferns (2004) argued that OI is a more useful and informative criterion for such comparisons than initial egg load, as the latter does not provide information on lifetime fecundity.
Various features of the habitat exert strong selection on fecundity and OI in parasitoids. These include host abundance and variance in the spatial distribution of hosts among patches. In a theoretical model Ellers et al. (2000b) showed that at low host densities, increasing variance in the numbers of hosts per patch and in the inter-patch distances selects for increased investment in early reproduction and hence in higher OI values. In rich habitats with low variance in the numbers of hosts per patch, lower OI values are favoured. This predicts that species occupying different habitats should show differences in OI that correspond to habitat quality and predictability.
A number of key life-history traits covary with body size (West et al. 1999). Body size should also affect the timing of egg production in insects. One reason for this is that smaller females have shorter expected life times and should therefore concentrate reproductive effort early in adult life (Ellers and Jervis 2003). If so, OI is predicted to covary negatively with body size in hymenopteran parasitoids. Later on Jervis and Ferns (2004) provided comparative empirical evidence for this prediction at the interspecific level. Another study also showed a negative correlation
57
Adult size and early investment in reproduction in five species of Asobara parasitoid wasps
between OI and body size within species (Thorne et al. 2006). However, fecundity is expected to increase with body size, simply because larger females should be able to produce more and/or bigger eggs. This would result in a positive correlation between body size and egg size (Berrigan 1991; Jervis et al 2001). In koinobiont parasitoids with hydropic eggs (i.e. eggs that absorb nutrients from the host hemolymph for embryonic growth) there is no clear relation between egg size and offspring survival. However, low OI has been documented for species with bigger and yolk richer, anhydropic egg (Jervis et al 2001). Variation in egg size may also cause substantial variation in initial egg load (IEL) in parasitoids with similar OI and body size. For example, Jervis and Ferns (2004) showed high variation in IEL of two Braconidae species, Biosteres arisanus (IEL = 180) and Cotesia plutella (IEL= 50) which have almost the same OI (0.3) and body size, but differ in egg size.
Here, we compare the resource allocation strategies of five closely related species of Asobara, synovigenic parasitoids of Drosophila. We investigate lipid reserves, egg size, egg load, OI and their relationships at both inter- and intraspecific levels. By reconstructing the phylogeny of these five species we were able to test for phylogenetic independence of the different life history traits measured.
Material and methods
Parasitoid and host
We used five closely related species of Drosophila parasitoids of the genus Asobara (Table 1). All species were cultured on Drosophila melanogaster from a laboratory stock that has been maintained in our lab since 1966 at 20 ± 1ºC and 16:8 h light:dark regime. These species originated from different climatic regions of the world (Table 1). Three species, A. pleuralis, A. tabida, and A. japonica, originated from wet forests (tropical for A. pleuralis and temperate for the other two). These represent habitats in which hosts are available throughout the season of adult activity of the parasitoids. The parasitoids produce successive generations throughout the season. For the other two species, A. persimilis and A. citri, host availability is periodically halted due to hot and dry conditions, during which Drosophila populations crash.
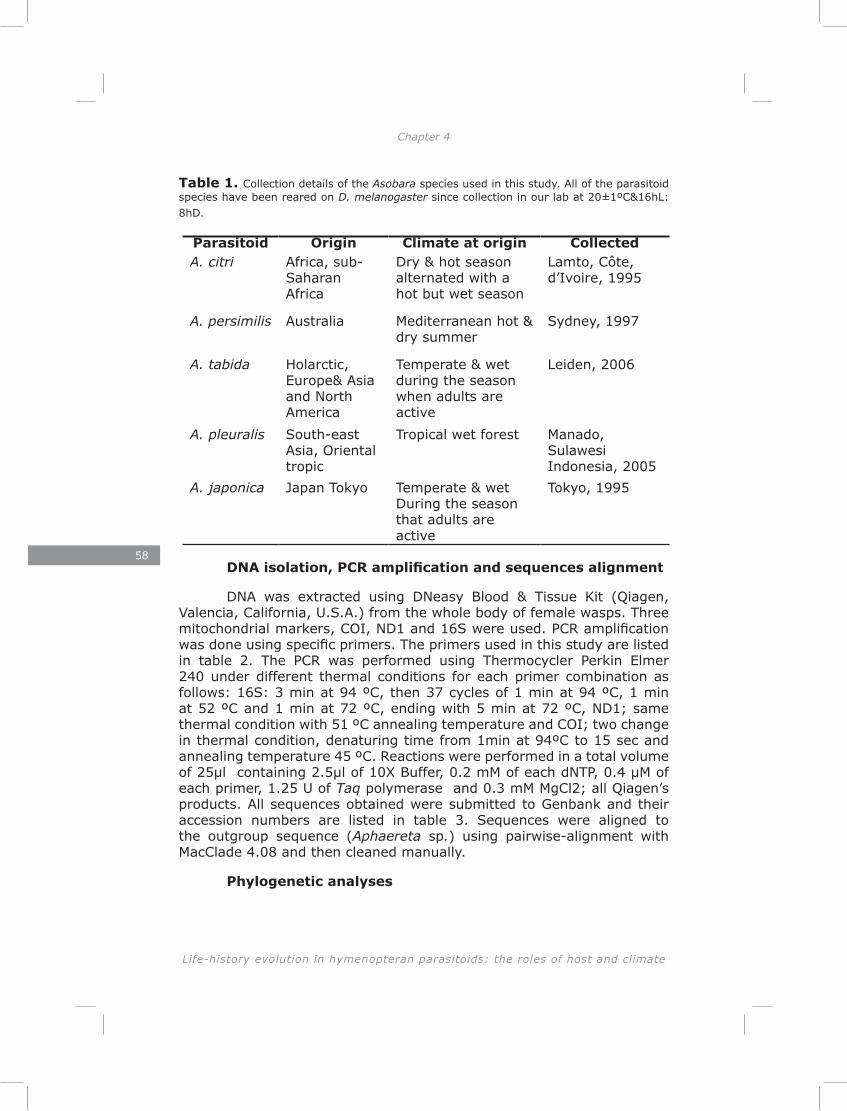
58
Life-history evolution in hymenopteran parasitoids: the roles of host and climate
Chapter 4 Adult size and early investment in reproduction in five species of Asobara parasitoid wasps
Table 1. Collection details of the Asobara species used in this study. All of the parasitoid species have been reared on D. melanogaster since collection in our lab at 20±1ºC&16hL: 8hD.
Parasitoid Origin Climate at origin CollectedA. citri Africa, sub-
Saharan Africa
Dry & hot season alternated with a hot but wet season
Lamto, Côte, d’Ivoire, 1995
A. persimilis Australia Mediterranean hot & dry summer
Sydney, 1997
A. tabida Holarctic, Europe& Asia and North America
Temperate & wet during the season when adults are active
Leiden, 2006
A. pleuralis South-east Asia, Oriental tropic
Tropical wet forest Manado, Sulawesi Indonesia, 2005
A. japonica Japan Tokyo Temperate & wet During the season that adults are active
Tokyo, 1995
DNA isolation, PCR amplification and sequences alignment
DNA was extracted using DNeasy Blood & Tissue Kit (Qiagen, Valencia, California, U.S.A.) from the whole body of female wasps. Three mitochondrial markers, COI, ND1 and 16S were used. PCR amplification was done using specific primers. The primers used in this study are listed in table 2. The PCR was performed using Thermocycler Perkin Elmer 240 under different thermal conditions for each primer combination as follows: 16S: 3 min at 94 ºC, then 37 cycles of 1 min at 94 ºC, 1 min at 52 ºC and 1 min at 72 ºC, ending with 5 min at 72 ºC, ND1; same thermal condition with 51 ºC annealing temperature and COI; two change in thermal condition, denaturing time from 1min at 94ºC to 15 sec and annealing temperature 45 ºC. Reactions were performed in a total volume of 25µl containing 2.5µl of 10X Buffer, 0.2 mM of each dNTP, 0.4 µM of each primer, 1.25 U of Taq polymerase and 0.3 mM MgCl2; all Qiagen’s products. All sequences obtained were submitted to Genbank and their accession numbers are listed in table 3. Sequences were aligned to the outgroup sequence (Aphaereta sp.) using pairwise-alignment with MacClade 4.08 and then cleaned manually.
Phylogenetic analyses
59
Adult size and early investment in reproduction in five species of Asobara parasitoid wasps
Table 1. Collection details of the Asobara species used in this study. All of the parasitoid species have been reared on D. melanogaster since collection in our lab at 20±1ºC&16hL: 8hD.
Parasitoid Origin Climate at origin CollectedA. citri Africa, sub-
Saharan Africa
Dry & hot season alternated with a hot but wet season
Lamto, Côte, d’Ivoire, 1995
A. persimilis Australia Mediterranean hot & dry summer
Sydney, 1997
A. tabida Holarctic, Europe& Asia and North America
Temperate & wet during the season when adults are active
Leiden, 2006
A. pleuralis South-east Asia, Oriental tropic
Tropical wet forest Manado, Sulawesi Indonesia, 2005
A. japonica Japan Tokyo Temperate & wet During the season that adults are active
Tokyo, 1995
DNA isolation, PCR amplification and sequences alignment
DNA was extracted using DNeasy Blood & Tissue Kit (Qiagen, Valencia, California, U.S.A.) from the whole body of female wasps. Three mitochondrial markers, COI, ND1 and 16S were used. PCR amplification was done using specific primers. The primers used in this study are listed in table 2. The PCR was performed using Thermocycler Perkin Elmer 240 under different thermal conditions for each primer combination as follows: 16S: 3 min at 94 ºC, then 37 cycles of 1 min at 94 ºC, 1 min at 52 ºC and 1 min at 72 ºC, ending with 5 min at 72 ºC, ND1; same thermal condition with 51 ºC annealing temperature and COI; two change in thermal condition, denaturing time from 1min at 94ºC to 15 sec and annealing temperature 45 ºC. Reactions were performed in a total volume of 25µl containing 2.5µl of 10X Buffer, 0.2 mM of each dNTP, 0.4 µM of each primer, 1.25 U of Taq polymerase and 0.3 mM MgCl2; all Qiagen’s products. All sequences obtained were submitted to Genbank and their accession numbers are listed in table 3. Sequences were aligned to the outgroup sequence (Aphaereta sp.) using pairwise-alignment with MacClade 4.08 and then cleaned manually.
Phylogenetic analyses
PAUP* 4.0-test version 4.0d63 (Swofford 1998) was used to ob-tain the most parsimonious tree(s) (MP). We employed a heuristic par-simony search (Hillis et al. 1996) with 100 replicates of random addition sequences, and including the TBR (tree bisection reconnection) option for branch swapping. A bootstrap analysis with 100 replications was used to estimate statistical support (Felsenstein 1985). For the Bayesian analysis (BI) (Yang & Rannala 1997; Huelsenbeck et al. 2001), two Markov Chain Monte Carlo (MCMC) runs were conducted simultaneously with MRBAYES 3.0B4 (Huelsenbeck & Ronquist 2001). Each run was carried out for 10,000 generations with a sample frequency of 10 generations. The first 2,500 generations (250 trees) were discarded as burn-in. The best-fit mo-del GTR+G was selected by Alike Information Center (AIC) criteria using MrModeltest version 2.2 (Posada & Crandall 1998). MP was analyzed on individual as well as the combined datasets, while BI was only conducted on the combined dataset. The Incongruence Length Different test (ILD) was performed before combining the datasets (Farris et al. 1994; Cun-ningham 1997; Posada and Buckley 2004).
Egg load, egg size, fat reserves and dry weight
Egg load, egg size, fat content and dry weight were measured on virgin female wasps harvested within five hours of eclosion. For each species 35 individuals were randomly chosen from 15 rearing jars, isolated and stored at -80ºC until further analysis. All four measurements were taken for each individual, as follows. Wasps were dissected on a cover glass, which had been weighed prior to dissection. The ovarioles were transferred to a small drop of demineralised water, opened and the eggs separated until they did not overlap (Ellers 1996). Two digital photographs were taken from each dissection, one containing all eggs to count the number of mature eggs (egg load) and one from a randomly chosen group of 20 eggs together with a small scale (to measure egg size). Egg size was calculated as the average surface area of 20 eggs per individual, measured relative to the scale, using Image-J image analysis software (Rasband, 1997-2005). Thecover glass containing the whole body including ovarioles and eggs was then dried at 80ºC for three days. The cover glass was then weighed again to determine the dry weight. After that, fat was extracted by submerging the cover glass in 3ml ether in a sealed glass tube for 24 hours (David et al. 1975, Ellers 1996). The ether containing the fat was then discarded and the cover glass washed again with fresh ether and dried again at 80ºC for three days. The fat contents of each individual were calculated by subtracting the dry weight before and after extraction of the fat reserves. We used egg mass (egg load × egg size) as our measure of the initial reproductive effort.
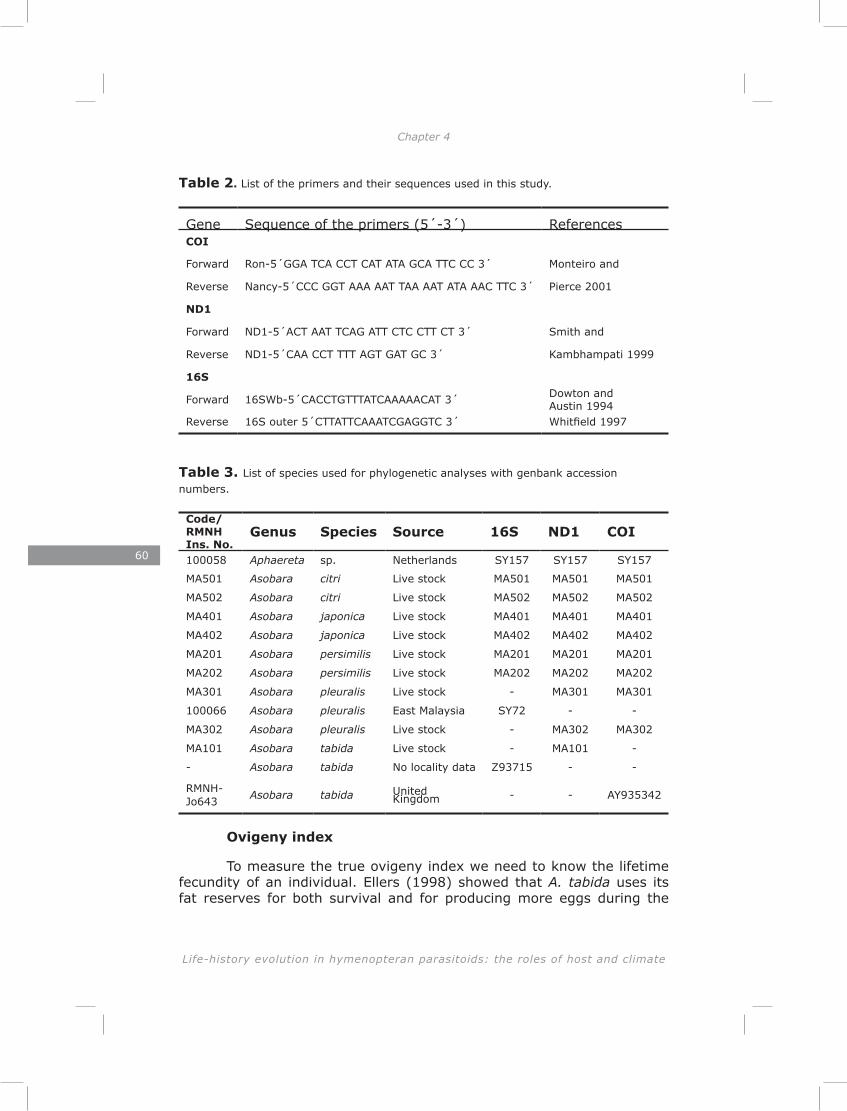
60
Life-history evolution in hymenopteran parasitoids: the roles of host and climate
Chapter 4 Adult size and early investment in reproduction in five species of Asobara parasitoid wasps
Table 2. List of the primers and their sequences used in this study.
Gene Sequence of the primers (5´-3´) ReferencesCOI
Forward Ron-5´GGA TCA CCT CAT ATA GCA TTC CC 3´ Monteiro and
Reverse Nancy-5´CCC GGT AAA AAT TAA AAT ATA AAC TTC 3´ Pierce 2001
ND1
Forward ND1-5´ACT AAT TCAG ATT CTC CTT CT 3´ Smith and
Reverse ND1-5´CAA CCT TTT AGT GAT GC 3´ Kambhampati 1999
16S
Forward 16SWb-5´CACCTGTTTATCAAAAACAT 3´ Dowton and Austin 1994
Reverse 16S outer 5´CTTATTCAAATCGAGGTC 3´ Whitfield 1997
Table 3. List of species used for phylogenetic analyses with genbank accession numbers.
Code/RMNH Ins. No.
Genus Species Source 16S ND1 COI
100058 Aphaereta sp. Netherlands SY157 SY157 SY157
MA501 Asobara citri Live stock MA501 MA501 MA501
MA502 Asobara citri Live stock MA502 MA502 MA502
MA401 Asobara japonica Live stock MA401 MA401 MA401
MA402 Asobara japonica Live stock MA402 MA402 MA402
MA201 Asobara persimilis Live stock MA201 MA201 MA201
MA202 Asobara persimilis Live stock MA202 MA202 MA202
MA301 Asobara pleuralis Live stock - MA301 MA301
100066 Asobara pleuralis East Malaysia SY72 - -
MA302 Asobara pleuralis Live stock - MA302 MA302
MA101 Asobara tabida Live stock - MA101 -
- Asobara tabida No locality data Z93715 - -
RMNH-Jo643 Asobara tabida United
Kingdom - - AY935342
Ovigeny index
To measure the true ovigeny index we need to know the lifetime fecundity of an individual. Ellers (1998) showed that A. tabida uses its fat reserves for both survival and for producing more eggs during the
61
Adult size and early investment in reproduction in five species of Asobara parasitoid wasps
Table 2. List of the primers and their sequences used in this study.
Gene Sequence of the primers (5´-3´) ReferencesCOI
Forward Ron-5´GGA TCA CCT CAT ATA GCA TTC CC 3´ Monteiro and
Reverse Nancy-5´CCC GGT AAA AAT TAA AAT ATA AAC TTC 3´ Pierce 2001
ND1
Forward ND1-5´ACT AAT TCAG ATT CTC CTT CT 3´ Smith and
Reverse ND1-5´CAA CCT TTT AGT GAT GC 3´ Kambhampati 1999
16S
Forward 16SWb-5´CACCTGTTTATCAAAAACAT 3´ Dowton and Austin 1994
Reverse 16S outer 5´CTTATTCAAATCGAGGTC 3´ Whitfield 1997
Table 3. List of species used for phylogenetic analyses with genbank accession numbers.
Code/RMNH Ins. No.
Genus Species Source 16S ND1 COI
100058 Aphaereta sp. Netherlands SY157 SY157 SY157
MA501 Asobara citri Live stock MA501 MA501 MA501
MA502 Asobara citri Live stock MA502 MA502 MA502
MA401 Asobara japonica Live stock MA401 MA401 MA401
MA402 Asobara japonica Live stock MA402 MA402 MA402
MA201 Asobara persimilis Live stock MA201 MA201 MA201
MA202 Asobara persimilis Live stock MA202 MA202 MA202
MA301 Asobara pleuralis Live stock - MA301 MA301
100066 Asobara pleuralis East Malaysia SY72 - -
MA302 Asobara pleuralis Live stock - MA302 MA302
MA101 Asobara tabida Live stock - MA101 -
- Asobara tabida No locality data Z93715 - -
RMNH-Jo643 Asobara tabida United
Kingdom - - AY935342
Ovigeny index
To measure the true ovigeny index we need to know the lifetime fecundity of an individual. Ellers (1998) showed that A. tabida uses its fat reserves for both survival and for producing more eggs during the
first week of its adult life. To measure both the fat reserve at emergence and the ovigeny index on the same individual females, we approximated ovigeny index as the ratio of mature eggs over total number of eggs at emergence of the wasp. Immature eggs, including the smallest visible oo-cytes, were counted on the same photographs used to count the number of mature eggs by increasing the magnification.
Test for phylogenetic independence
Closely related species may resemble each other in any trait because of their shared ancestry, rather than because of adaptation (Harvey & Pagel 1991). We assessed whether closely related species were more similar than distantly related species for the traits we measured using the test for serial independence (TFSI) as implemented in the software Phylogenetic Independence version 2.0 (Reeve and Abouheif 2003). TSFI is a parametric test to detect self-similarity among the adjacent observation and reveal phylogenetic autocorrelation (Abouheif 1999). The average value for each trait was calculated for each species and placed at the tips of the phylogenic tree. These values were then randomly reshuffled 1000 times. The observed topology of trait values was then compared to the generated distribution of random topologies. We report the P-value representing the chance that the observed topology could have arisen by chance, i.e. in the absence of phylogenetic autocorrelation.
Statistical analysis
We first examined between-species variation in dry weight using analysis of variance (ANOVA). Fat reserve, ovigeny index, egg size and egg load were compared between species using analysis of covariance (ANCOVA) in which dry weight was added as a covariate to represent body size. In each case we searched for the minimum adequate model by starting with the maximal model, then dropping the interaction term and then main factors from the model if non-significant. The simpler model was compared to the more complex model using an F-test. Traits were compared between species using post-hoc t-tests. In the cases where the correlation between body size and the trait of interest differed in sign between species, we dropped dry weight from the model and analysed between-species variation in the trait of interest using ANOVA.
Within-species correlations between traits were examined using Pearson correlations. We calculated both classical (rc) and robust (rr) cor-relations using the R package Mvoutlier (Gschwandtner and Filzmoser 2007). Robust correlation ignores outliers. For visualizing the results that included body size as the covariate we removed the effect of body size by regressing each trait on dry weight and plotting the residuals. All statisti-cal analyses were conducted in the free statistical software R 2.5.1 (Ihaka & Gentleman, 1996).
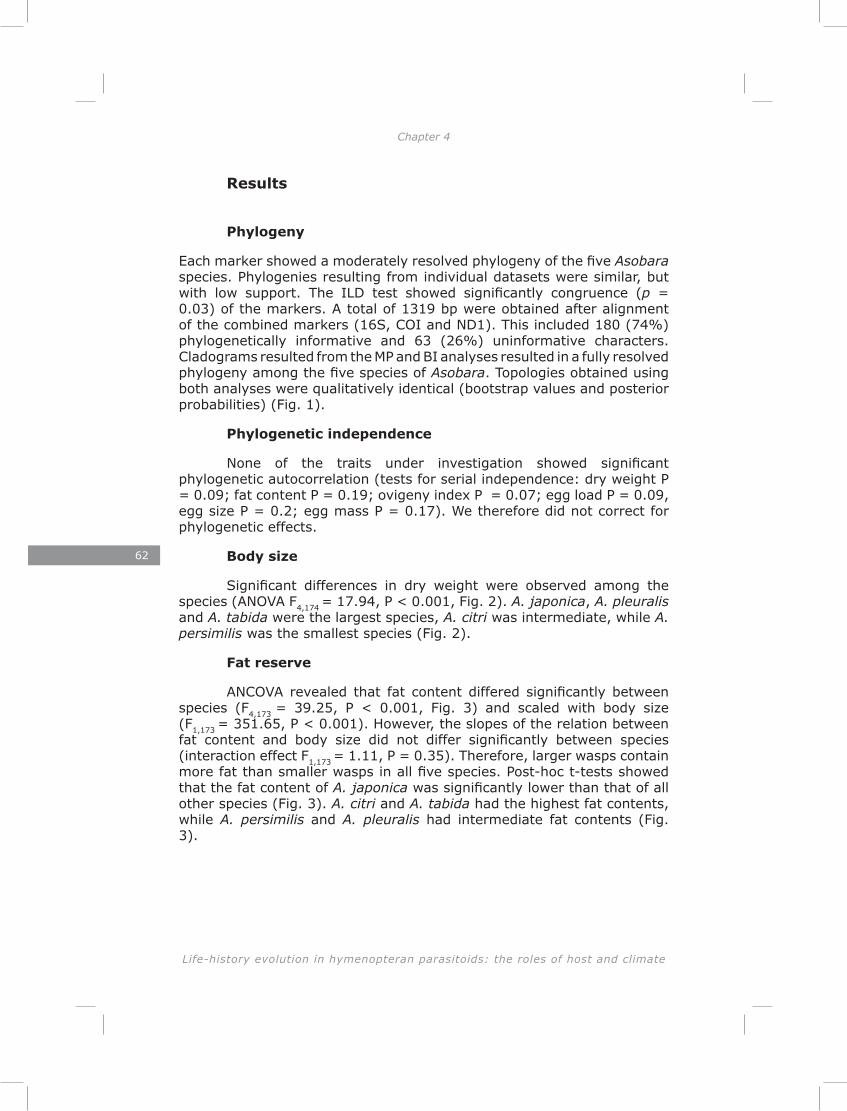
62
Life-history evolution in hymenopteran parasitoids: the roles of host and climate
Chapter 4 Adult size and early investment in reproduction in five species of Asobara parasitoid wasps
Results
Phylogeny
Each marker showed a moderately resolved phylogeny of the five Asobara species. Phylogenies resulting from individual datasets were similar, but with low support. The ILD test showed significantly congruence (p = 0.03) of the markers. A total of 1319 bp were obtained after alignment of the combined markers (16S, COI and ND1). This included 180 (74%) phylogenetically informative and 63 (26%) uninformative characters. Cladograms resulted from the MP and BI analyses resulted in a fully resolved phylogeny among the five species of Asobara. Topologies obtained using both analyses were qualitatively identical (bootstrap values and posterior probabilities) (Fig. 1).
Phylogenetic independence
None of the traits under investigation showed significant phylogenetic autocorrelation (tests for serial independence: dry weight P = 0.09; fat content P = 0.19; ovigeny index P = 0.07; egg load P = 0.09, egg size P = 0.2; egg mass P = 0.17). We therefore did not correct for phylogenetic effects.
Body size
Significant differences in dry weight were observed among the species (ANOVA F4,174
= 17.94, P < 0.001, Fig. 2). A. japonica, A. pleuralis and A. tabida were the largest species, A. citri was intermediate, while A. persimilis was the smallest species (Fig. 2).
Fat reserve
ANCOVA revealed that fat content differed significantly between species (F4,173
= 39.25, P < 0.001, Fig. 3) and scaled with body size (F1,173
= 351.65, P < 0.001). However, the slopes of the relation between fat content and body size did not differ significantly between species (interaction effect F1,173
= 1.11, P = 0.35). Therefore, larger wasps contain more fat than smaller wasps in all five species. Post-hoc t-tests showed that the fat content of A. japonica was significantly lower than that of all other species (Fig. 3). A. citri and A. tabida had the highest fat contents, while A. persimilis and A. pleuralis had intermediate fat contents (Fig. 3).
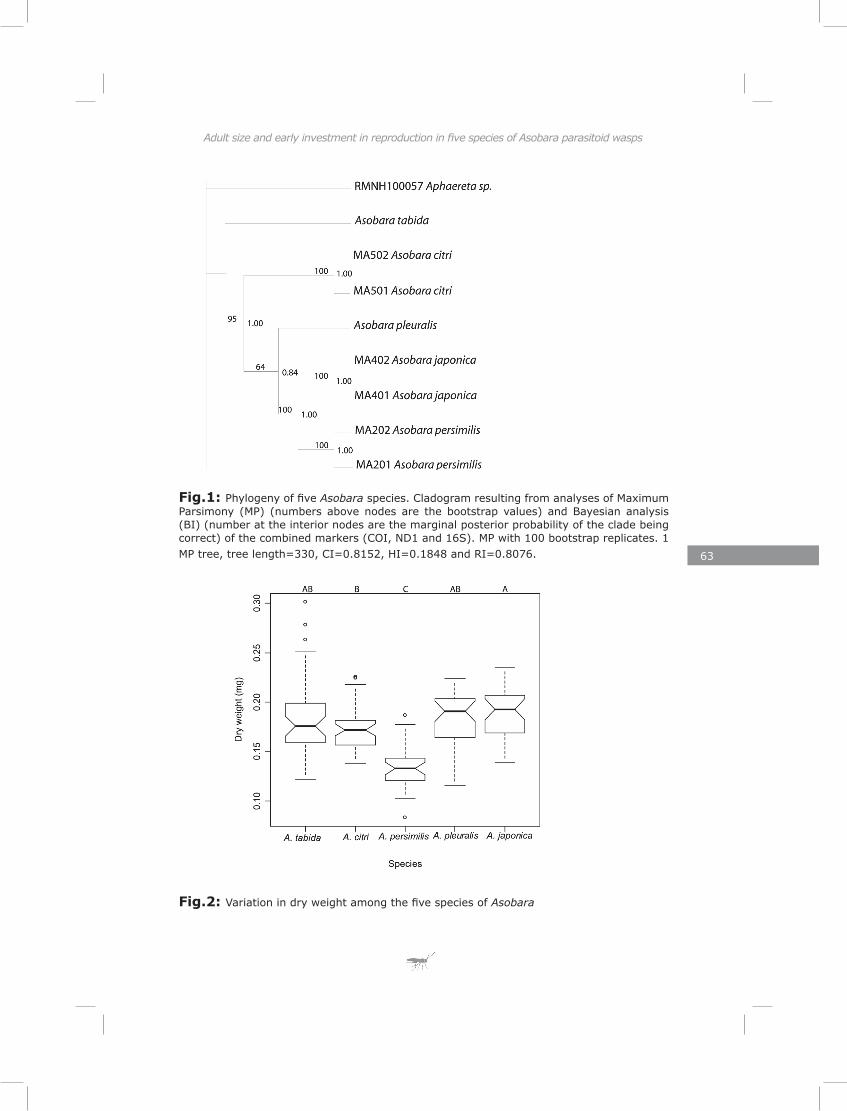
63
Adult size and early investment in reproduction in five species of Asobara parasitoid wasps
Fig.1: Phylogeny of five Asobara species. Cladogram resulting from analyses of Maximum Parsimony (MP) (numbers above nodes are the bootstrap values) and Bayesian analysis (BI) (number at the interior nodes are the marginal posterior probability of the clade being correct) of the combined markers (COI, ND1 and 16S). MP with 100 bootstrap replicates. 1 MP tree, tree length=330, CI=0.8152, HI=0.1848 and RI=0.8076.
Fig.2: Variation in dry weight among the five species of Asobara
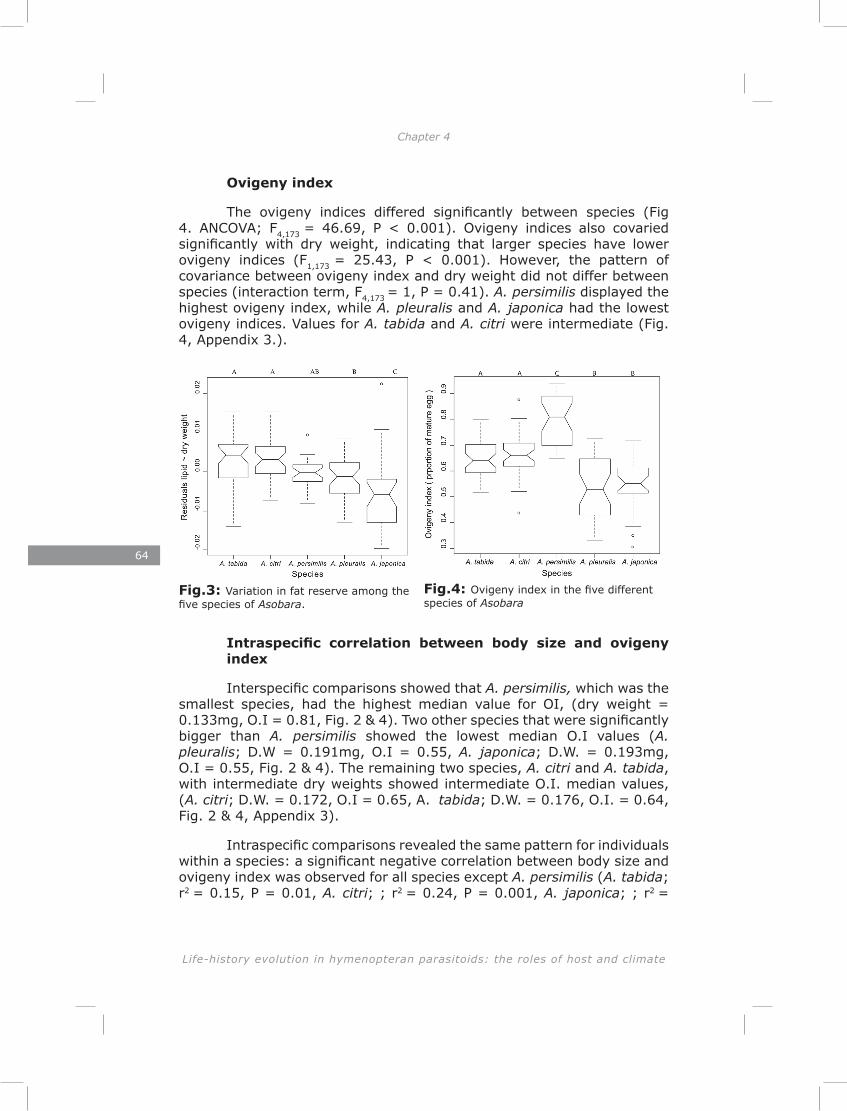
64
Life-history evolution in hymenopteran parasitoids: the roles of host and climate
Chapter 4 Adult size and early investment in reproduction in five species of Asobara parasitoid wasps
Ovigeny index
The ovigeny indices differed significantly between species (Fig 4. ANCOVA; F4,173
= 46.69, P < 0.001). Ovigeny indices also covaried significantly with dry weight, indicating that larger species have lower ovigeny indices (F1,173
= 25.43, P < 0.001). However, the pattern of covariance between ovigeny index and dry weight did not differ between species (interaction term, F4,173
= 1, P = 0.41). A. persimilis displayed the highest ovigeny index, while A. pleuralis and A. japonica had the lowest ovigeny indices. Values for A. tabida and A. citri were intermediate (Fig. 4, Appendix 3.).
Intraspecific correlation between body size and ovigeny index
Interspecific comparisons showed that A. persimilis, which was the smallest species, had the highest median value for OI, (dry weight = 0.133mg, O.I = 0.81, Fig. 2 & 4). Two other species that were significantly bigger than A. persimilis showed the lowest median O.I values (A. pleuralis; D.W = 0.191mg, O.I = 0.55, A. japonica; D.W. = 0.193mg, O.I = 0.55, Fig. 2 & 4). The remaining two species, A. citri and A. tabida, with intermediate dry weights showed intermediate O.I. median values, (A. citri; D.W. = 0.172, O.I = 0.65, A. tabida; D.W. = 0.176, O.I. = 0.64, Fig. 2 & 4, Appendix 3).
Intraspecific comparisons revealed the same pattern for individuals within a species: a significant negative correlation between body size and ovigeny index was observed for all species except A. persimilis (A. tabida; r2 = 0.15, P = 0.01, A. citri; ; r2 = 0.24, P = 0.001, A. japonica; ; r2 =
0.19, P = 0.01, A. pleuralis; ; r2 = 0.12, P = 0.04, A. persimilis; r2 = 0.06, P = 0.18). We found very similar robust and significant correlations within three species (Fig 5, A. tabida; rclassical = -0.38, rrobust = -0.34, A. citri; rc = -0.49, rr = -0.45, A. pleuralis; rc = 0.35, rr = 0.37). Robust correlation was stronger than classical correlation in A. japonica rc = -0.43, rr = -0.73). In A. persimilis no significant correlations were observed (A. persimilis; rc = -0.25, rr = -0.08, Fig. 5).
Fig.5: Within-species correlations between dry weight and ovigeny index in five species of Asobara. Solid lines: robust correlation (R.cor). Dashed lines: classical correlation (C.cor).
Egg size
ANCOVA revealed a significant interaction between the effects of dry weight and species on egg size (ANCOVA; F4,173
= 12.27, P = 0.01). This indicates that the slopes of the relation between egg size and dry weight varied between species. We therefore examined the correlation between dry weight and egg size in the different species separately (Fig. 6). In two out of five species we found no significant correlation between egg size and body size (A. tabida; r2 = 0.05, P = 0.14, A. pleuralis; r2
Fig.3: Variation in fat reserve among the five species of Asobara.
Fig.4: Ovigeny index in the five different species of Asobara
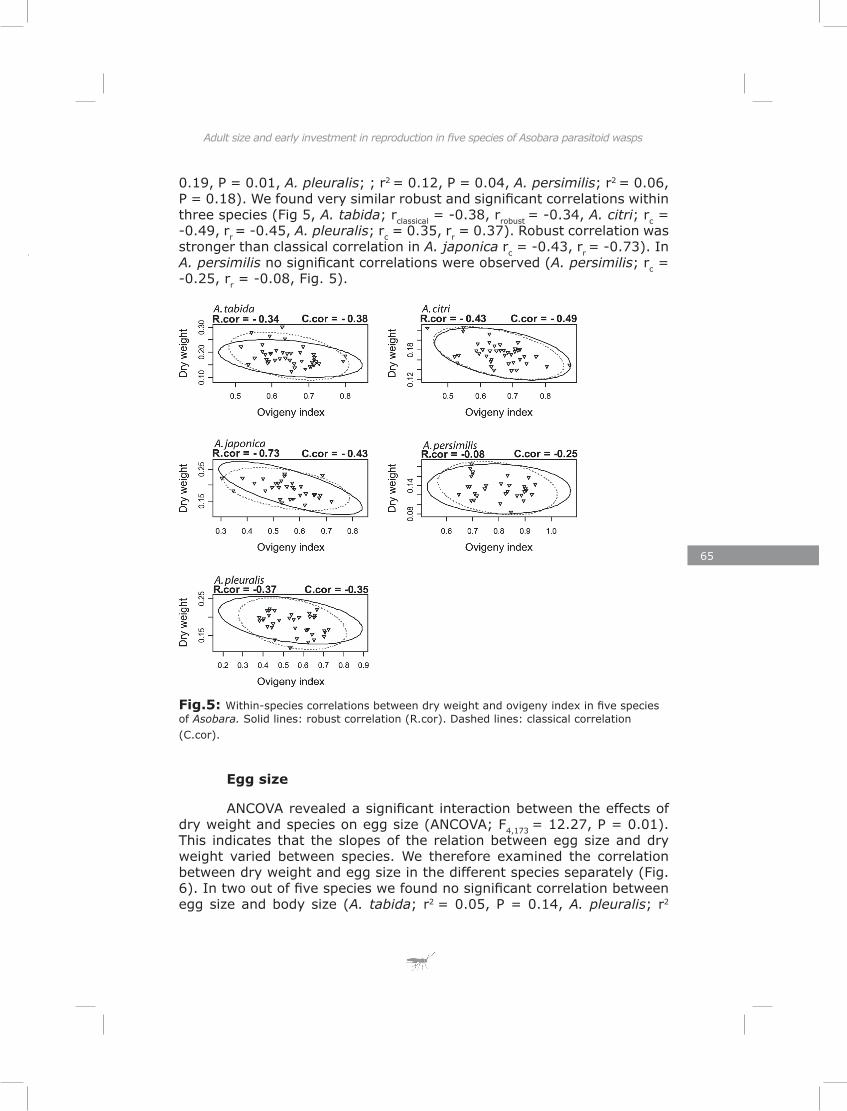
65
Adult size and early investment in reproduction in five species of Asobara parasitoid wasps
Ovigeny index
The ovigeny indices differed significantly between species (Fig 4. ANCOVA; F4,173
= 46.69, P < 0.001). Ovigeny indices also covaried significantly with dry weight, indicating that larger species have lower ovigeny indices (F1,173
= 25.43, P < 0.001). However, the pattern of covariance between ovigeny index and dry weight did not differ between species (interaction term, F4,173
= 1, P = 0.41). A. persimilis displayed the highest ovigeny index, while A. pleuralis and A. japonica had the lowest ovigeny indices. Values for A. tabida and A. citri were intermediate (Fig. 4, Appendix 3.).
Intraspecific correlation between body size and ovigeny index
Interspecific comparisons showed that A. persimilis, which was the smallest species, had the highest median value for OI, (dry weight = 0.133mg, O.I = 0.81, Fig. 2 & 4). Two other species that were significantly bigger than A. persimilis showed the lowest median O.I values (A. pleuralis; D.W = 0.191mg, O.I = 0.55, A. japonica; D.W. = 0.193mg, O.I = 0.55, Fig. 2 & 4). The remaining two species, A. citri and A. tabida, with intermediate dry weights showed intermediate O.I. median values, (A. citri; D.W. = 0.172, O.I = 0.65, A. tabida; D.W. = 0.176, O.I. = 0.64, Fig. 2 & 4, Appendix 3).
Intraspecific comparisons revealed the same pattern for individuals within a species: a significant negative correlation between body size and ovigeny index was observed for all species except A. persimilis (A. tabida; r2 = 0.15, P = 0.01, A. citri; ; r2 = 0.24, P = 0.001, A. japonica; ; r2 =
0.19, P = 0.01, A. pleuralis; ; r2 = 0.12, P = 0.04, A. persimilis; r2 = 0.06, P = 0.18). We found very similar robust and significant correlations within three species (Fig 5, A. tabida; rclassical = -0.38, rrobust = -0.34, A. citri; rc = -0.49, rr = -0.45, A. pleuralis; rc = 0.35, rr = 0.37). Robust correlation was stronger than classical correlation in A. japonica rc = -0.43, rr = -0.73). In A. persimilis no significant correlations were observed (A. persimilis; rc = -0.25, rr = -0.08, Fig. 5).
Fig.5: Within-species correlations between dry weight and ovigeny index in five species of Asobara. Solid lines: robust correlation (R.cor). Dashed lines: classical correlation (C.cor).
Egg size
ANCOVA revealed a significant interaction between the effects of dry weight and species on egg size (ANCOVA; F4,173
= 12.27, P = 0.01). This indicates that the slopes of the relation between egg size and dry weight varied between species. We therefore examined the correlation between dry weight and egg size in the different species separately (Fig. 6). In two out of five species we found no significant correlation between egg size and body size (A. tabida; r2 = 0.05, P = 0.14, A. pleuralis; r2
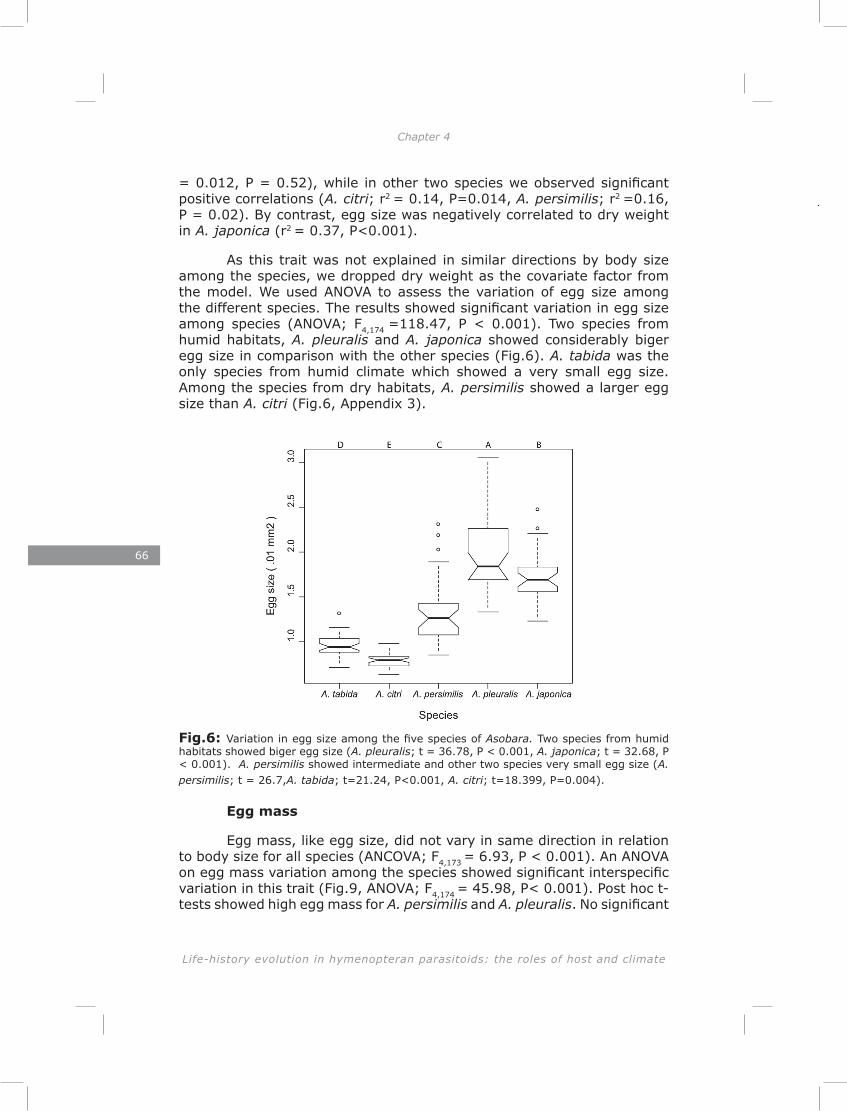
66
Life-history evolution in hymenopteran parasitoids: the roles of host and climate
Chapter 4 Adult size and early investment in reproduction in five species of Asobara parasitoid wasps
= 0.012, P = 0.52), while in other two species we observed significant positive correlations (A. citri; r2 = 0.14, P=0.014, A. persimilis; r2 =0.16, P = 0.02). By contrast, egg size was negatively correlated to dry weight in A. japonica (r2 = 0.37, P<0.001).
As this trait was not explained in similar directions by body size among the species, we dropped dry weight as the covariate factor from the model. We used ANOVA to assess the variation of egg size among the different species. The results showed significant variation in egg size among species (ANOVA; F4,174 =118.47, P < 0.001). Two species from humid habitats, A. pleuralis and A. japonica showed considerably biger egg size in comparison with the other species (Fig.6). A. tabida was the only species from humid climate which showed a very small egg size. Among the species from dry habitats, A. persimilis showed a larger egg size than A. citri (Fig.6, Appendix 3).
Fig.6: Variation in egg size among the five species of Asobara. Two species from humid habitats showed biger egg size (A. pleuralis; t = 36.78, P < 0.001, A. japonica; t = 32.68, P < 0.001). A. persimilis showed intermediate and other two species very small egg size (A. persimilis; t = 26.7,A. tabida; t=21.24, P<0.001, A. citri; t=18.399, P=0.004).
Egg mass
Egg mass, like egg size, did not vary in same direction in relation to body size for all species (ANCOVA; F4,173
= 6.93, P < 0.001). An ANOVA on egg mass variation among the species showed significant interspecific variation in this trait (Fig.9, ANOVA; F4,174
= 45.98, P< 0.001). Post hoc t-tests showed high egg mass for A. persimilis and A. pleuralis. No significant
differences in egg mass were observed between A. tabida, A. citri and A. japonica. (Fig.7, Appenix 3).
Fig.7: Variation in egg mass among the five species of Asobara. A biger egg mass was observed for two species, A. persimilis and A. pleuralis (t = 27.75, P < 0.001, t = 24.55, P < 0.001). No significant differences in egg mass were observed between A. tabida, A. citri and A. japonica. (t = 17.65, t = 16.78, t = 18.01).
Intraspecific correlations between egg size, egg load and egg mass
By using bivariate correlation plots in which each trait was corrected for body size, we found that A. persimilis was the only species with a strong positive correlation between egg size and egg mass (Fig.8, rc = 0.82, rr = 0.84). Weaker positive correlations were observed in two species (Fig.8, A. tabida; rc = 0.54, rr = 0.48, A. pleuralis; rc = 0.66, rr = 0.46). In two other species we found either a negative or no correlation (Fig.8, A.japonica; rc = 0.25, rr = -0.45, A. citri; rc = -0.05, rr = -0.21). All species except A. persimilis showed a strong correlation between egg mass and egg number (Fig.9, A. tabida; rc = 0.77, rr = 0.84, A. citri; rc = 0.9, rr = 0.9, A. japonica; rc = 0.84, rr = 0.95, A. persimilis; rc = 0.31, rr = 0.45, A. pleuralis; rc = 0.66, rr = 0.82). Thus egg number is the main determinant of total investment in eggs, except in A. persimilis, in which egg size is more important.
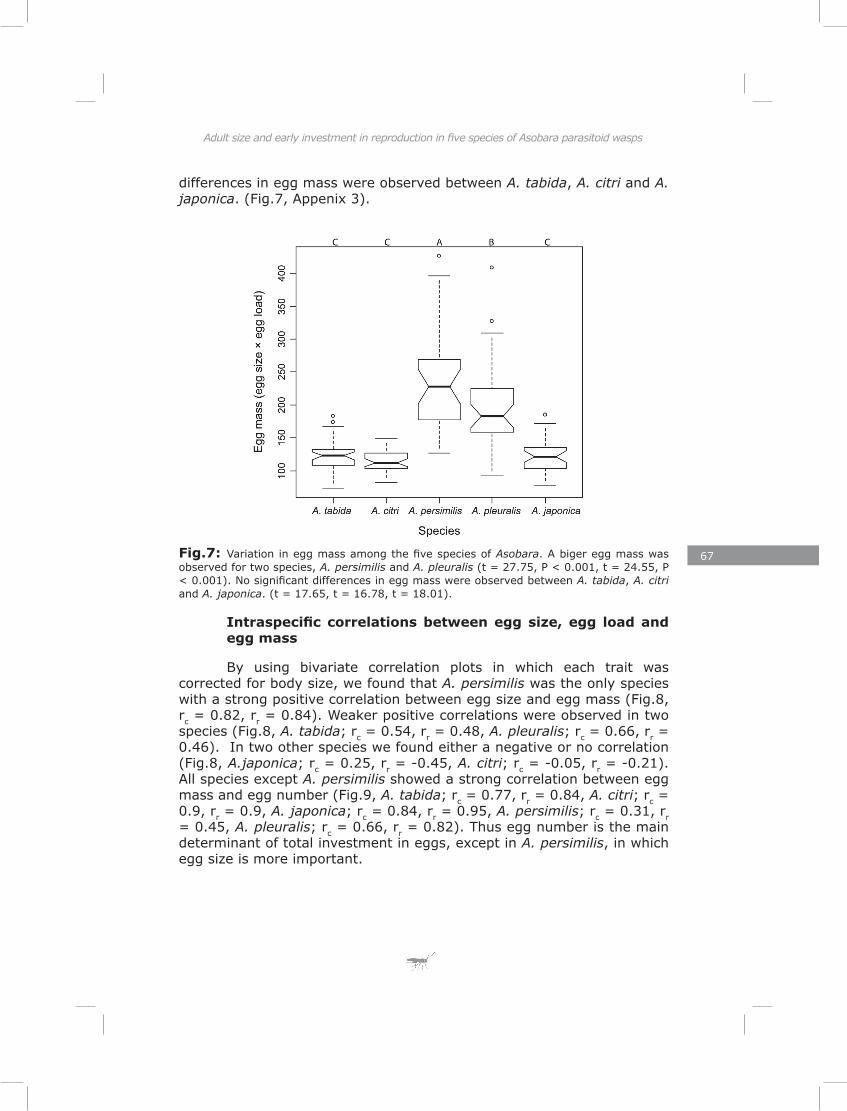
67
Adult size and early investment in reproduction in five species of Asobara parasitoid wasps
differences in egg mass were observed between A. tabida, A. citri and A. japonica. (Fig.7, Appenix 3).
Fig.7: Variation in egg mass among the five species of Asobara. A biger egg mass was observed for two species, A. persimilis and A. pleuralis (t = 27.75, P < 0.001, t = 24.55, P < 0.001). No significant differences in egg mass were observed between A. tabida, A. citri and A. japonica. (t = 17.65, t = 16.78, t = 18.01).
Intraspecific correlations between egg size, egg load and egg mass
By using bivariate correlation plots in which each trait was corrected for body size, we found that A. persimilis was the only species with a strong positive correlation between egg size and egg mass (Fig.8, rc = 0.82, rr = 0.84). Weaker positive correlations were observed in two species (Fig.8, A. tabida; rc = 0.54, rr = 0.48, A. pleuralis; rc = 0.66, rr = 0.46). In two other species we found either a negative or no correlation (Fig.8, A.japonica; rc = 0.25, rr = -0.45, A. citri; rc = -0.05, rr = -0.21). All species except A. persimilis showed a strong correlation between egg mass and egg number (Fig.9, A. tabida; rc = 0.77, rr = 0.84, A. citri; rc = 0.9, rr = 0.9, A. japonica; rc = 0.84, rr = 0.95, A. persimilis; rc = 0.31, rr = 0.45, A. pleuralis; rc = 0.66, rr = 0.82). Thus egg number is the main determinant of total investment in eggs, except in A. persimilis, in which egg size is more important.
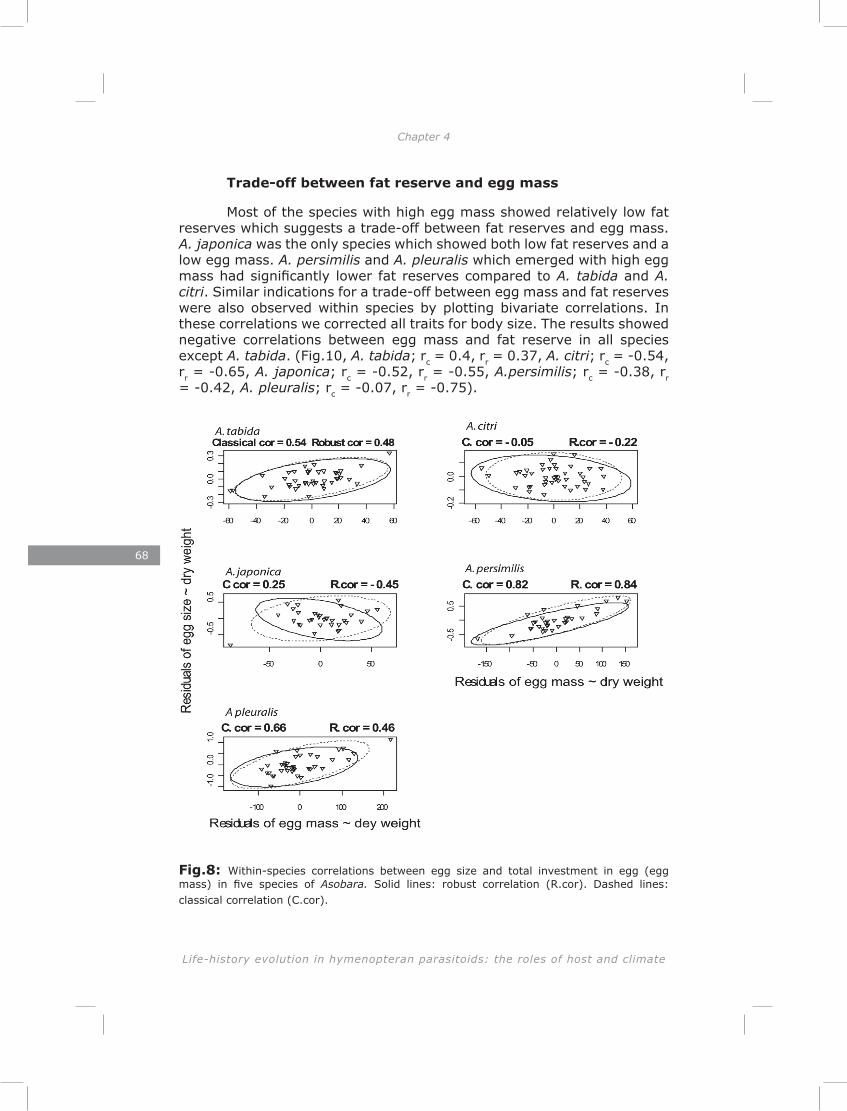
68
Life-history evolution in hymenopteran parasitoids: the roles of host and climate
Chapter 4 Adult size and early investment in reproduction in five species of Asobara parasitoid wasps
Trade-off between fat reserve and egg mass
Most of the species with high egg mass showed relatively low fat reserves which suggests a trade-off between fat reserves and egg mass. A. japonica was the only species which showed both low fat reserves and a low egg mass. A. persimilis and A. pleuralis which emerged with high egg mass had significantly lower fat reserves compared to A. tabida and A. citri. Similar indications for a trade-off between egg mass and fat reserves were also observed within species by plotting bivariate correlations. In these correlations we corrected all traits for body size. The results showed negative correlations between egg mass and fat reserve in all species except A. tabida. (Fig.10, A. tabida; rc = 0.4, rr = 0.37, A. citri; rc = -0.54, rr = -0.65, A. japonica; rc = -0.52, rr = -0.55, A.persimilis; rc = -0.38, rr = -0.42, A. pleuralis; rc = -0.07, rr = -0.75).
Fig.8: Within-species correlations between egg size and total investment in egg (egg mass) in five species of Asobara. Solid lines: robust correlation (R.cor). Dashed lines: classical correlation (C.cor).
Fig.9: Within-species correlations between egg load and total investment in egg (egg mass) in five species of Asobara. Solid lines: robust correlation (R.cor). Dashed lines: classical correlation (C.cor).
Fig.10: Within-species correlations between fat reserve and total investment in egg (egg mass) in five species of Asobara. Solid lines: robust correlation (R.cor). Dashed lines: classical correlation (C.cor).
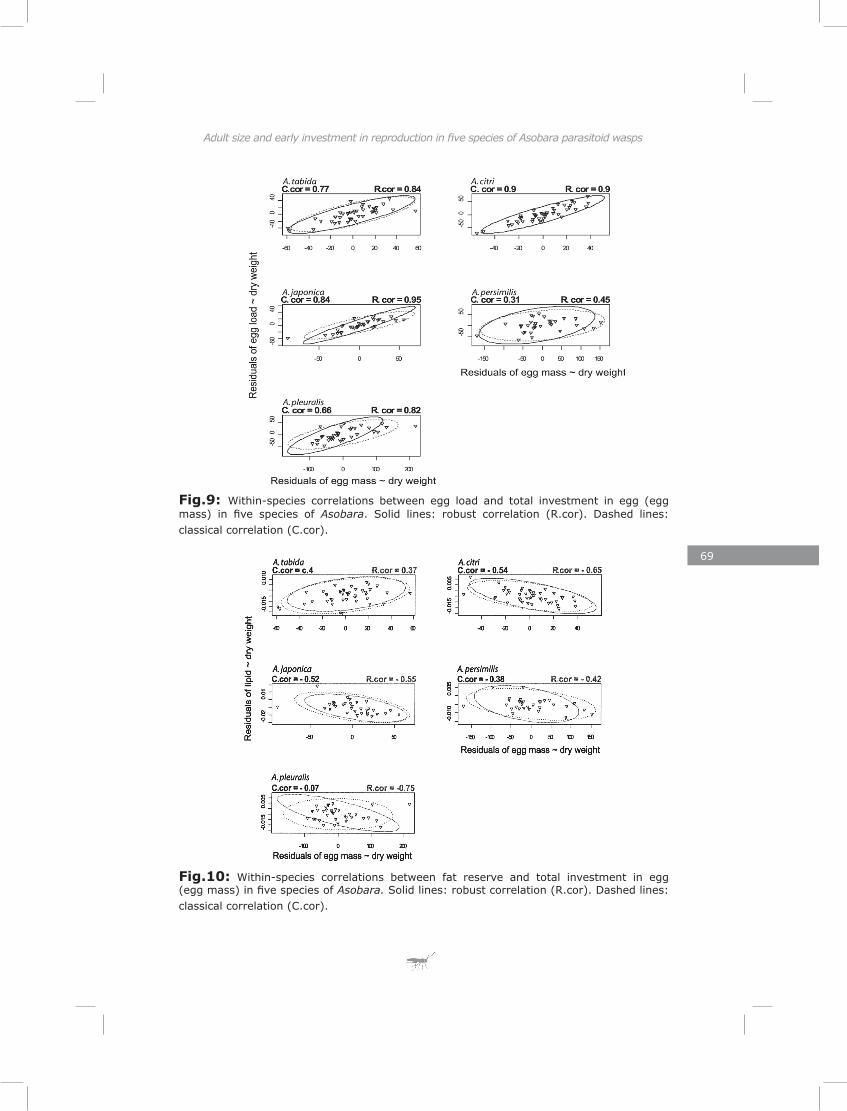
69
Adult size and early investment in reproduction in five species of Asobara parasitoid wasps
Fig.9: Within-species correlations between egg load and total investment in egg (egg mass) in five species of Asobara. Solid lines: robust correlation (R.cor). Dashed lines: classical correlation (C.cor).
Fig.10: Within-species correlations between fat reserve and total investment in egg (egg mass) in five species of Asobara. Solid lines: robust correlation (R.cor). Dashed lines: classical correlation (C.cor).
70
Life-history evolution in hymenopteran parasitoids: the roles of host and climate
Chapter 4 Adult size and early investment in reproduction in five species of Asobara parasitoid wasps
Discussion
Our results demonstrate significant variation in resource allocation strategies among five closely related species of Asobara. All traits we measured (body size, fat reserves, ovigeny index (OI), egg size and initial reproductive effort (egg mass) showed considerable variation, both within and between species. We showed that each the life history traits under investigation was independent from its phylogenetic history. This indicates rapid evolution of reproductive traits and thus potentially rapid adaptation of each species to its own environment.
The number of mature eggs at eclosion and the total number of eggs which can be produced during adult lifetime varies widely in synovigenic parasitoids (Quick 1997) sugesting that allocation of resources to reproduction or survival is under strong selective pressure (Ellers at al 2000b). Jervis et al (2001) in a comparative study of 368 species of both pro-ovigenic and synovigenic hymenopteran parasitoids showed a wide range of variation in OI. Our finding of variation in OI among the five Asobara species provides the possibility to compare this variation both inter- and intraspecifically. Egg limitation is unlikely to play an important role in Asobara species (Ellers et al. 2000b, Jervis and Ferns 2004) as only a small fraction of the females in the populations of these parasitoids will be able to deplete all their eggs before the end of their adult life. Ellers et al (1998) showed, by comparing wild-caught and laboratory raised A. tabida that only 7% of the wild females were able to lay all of their eggs before dying.
OI measures how the energy budget is divided between reproduction and soma in synovegic parasitoids. Ellers and Jervis (2003) predicted a negative correlation between body size and OI in parasitoids. In a review, Jervis and Frens (2004) provided comparative evidence for these predictions. Our results are in agreement with these studies, as we found negative correlations between body size and OI both inter- and intraspecifically. A. persimilis, a species with a small body size and little variation in body size, was the only species in which we could not find this relationship. Within species, small females are unlikely to survive for long and should thus concentrate on early reproduction. Between species, the negative correlation between body size and OI indicates that certain habitats select for investment in early reproduction instead of survival and large body size. Habitat quality, defined as the host abundance and variance in the spatial distribution of the host can drive selection on resource allocation in parasitoid insects. In a theoretical study Ellers et al (2000b) showed that parasitoids in rich habitats with low variance in host distribution over patches are selected to carry fewer mature egg at the start of adult life and mature a larger proportion of their eggs during adult life (low OI) in comparison with parasitoids from poor habitats with
71
Adult size and early investment in reproduction in five species of Asobara parasitoid wasps
high variance in the spatial distribution of hosts. These predictions are supported by our study: A. pleuralis and A. japonica from humid habitats rich in fruits, showed low OI. By contrast, A. citri and A. persimilis from dry habitats where host densities are low during at least part of the season, had a high OI. Dry environments are apparently unfavorable for survival of adult parasitoids and select instead for investment in early reproduction. A.tabida, a species from temperate humid habitats had a high OI, and we think this exception could be explained by the spatial distribution of hosts in western Europe which is relatively unpredictable and patchily distributed (Ellers et al. 2001).
Egg size has rarely been studied in resource allocation studies of parasitoids. Jervis et al (2001) in a comparative study, showed a link between yolk-deficient hydropic eggs and pro-ovigeny. Thus, smaller eggs are expected for pro-ovigenic species and larger eggs for synovigenic species. Strong variation in initial reproductive effort of species with same OI also has been explained by variation in investment per egg (Jervis and Ferns 2004). Jervis and Kidd (1986) mention that hydropic eggs of koinobiont endoparasitoids are able to absorb and utilize protein from the host hemolymph for embryogenesis. If parasitoids were able to rely on host resources during the egg stage, the adults would be able to invest less in egg size and produce more and smaller eggs. Thus, it is unlikely that egg size will affect adult size in endoparasitoids with hydropic eggs and we expect no direct relation between egg size and fitness as has been found in other insects, e.g. butterflies (Boggs 1986). We found considerable variation in egg size for Asobara species which suggests different selection on egg size in different habitats. Species from humid and supposedly rich habitats (A. pleuralis and A. japonica) had larger eggs than the other species. Why larger eggs are advantageous in such habitats remains to be studied, but a possible explanation is that intraspecific competition by superparasitism is more frequent in such habitats, and that large eggs provide a competitive edge over smaller eggs. Of the species from habitats with a distinct dry season, A. persimilis showed relatively large variance in egg size compared to A. citri, which has very small eggs. The variation in egg size in A. persimilis was strongly correlated to variation in total egg mass. The observation that A.persimilis increases egg size with total investment in reproduction suggests that having large eggs is adaptive for this species. As the population density of A. persimilis becomes quite high in orchards during the autumn flush of Drosophila, it is possible that a higher incidence of competition in superparasitized hosts occurs during this part of the season (Price, 1976) and that thus may large egg size reward in A. persimilis.
The other species each showed a significant correlation between egg mass and egg load suggesting that they do not trade-off egg size against numbers of eggs, but egg number against lipid reserves. Fat reserves
72
Life-history evolution in hymenopteran parasitoids: the roles of host and climate
Chapter 4
in parasitoids may contribute to both egg production and survival. The role of lipid in somatic maintenance has been demonstrated by showing a positive correlation between lipid quantity and lifespan within several parasitoid species (Ellers 1996, Rivero and West 2005). Evidence for the role of lipids in egg production has also been demonstrated by Ellers at al (1998) for A. tabida, who showed that replenishment of the egg load drastically reduced fat reserves. Our study suggests that this trade-off holds both between and within species. Interspecific comparisons showed high fat reserves and low egg masses for A. tabida and A. citri, while the inverse was found for A. persimilis or/and A. pleuralis. A. japonica showed both low egg mass and low fat reserves. The very short life span for A. japonica both in the presence and in the absence of food (female A. japonica had an average life span < 4.5 days, while the other species varied from 10 to 20 days, see chapter 3) could be attributed to their low fat reserves, but possibly also to a higher basic metabolic rate and/or higher activity level (A. japonica showed significant higher metabolic rate than the other species see chapter 3).
In intraspecific comparisons, we found evidence for this trade-off in negative correlations between egg mass and fat reserves for all species except for A. tabida. The latter species showed a positive correlation in our data. However, Ellers and van Alphen (1997) demonstrated the presence of the trade-off in A.tabida using experimental manipulations. Our results are phenotypic correlations, and positive correlations can be caused by other variables and are not proof for the absence of a trade-off. Possibly the large variation in body size which is correlated with variation in OI (Ellers and Jervis 2003) may have caused the positive correlation found in our study for A. tabida.
In summary, our results showed enormous variation in life history traits in relation to body size directly linked to reproductive success in parasitoids. Functional models show that at least some of this variation is likely to be adaptive. Jervis et al (2008) in a review of resource allocation and reproductive strategies in parasitoids showed that additive genetic variation exist in traits related to reproductive success. This variation provides the potential to respond quickly to natural selection. Our finding that all of the measured traits are independent of the phylogeny of the species also suggests that the differences between them are due to selection and adaptation. We suggest that differences in the spatial and temporal distribution of the hosts, in addition to climatic differences are the selective forces driving the divergence in life history traits in these five species of Asobara.
73
C h a p t e r 5
Genetic structure of Leptopilina boulardi populations from different climatic zones of Iran
Abstract
The genetic structure of populations can be influenced by geographical isolation (including physical distance) and ecology. We examined these effects in Leptopilina boulardi, a cosmopolitan parasitoid of Drosophila of African origin and widely distributed over temperate and (sub) tropical climates. We sampled 11 populations of L. boulardi from five climatic zones in Iran. The nuclear genetic variation among these populations was compared using amplified fragment length polymorphism (AFLP). To assess whether these populations had also diverged in their mtDNA, we sequenced part of the cytochrome oxidase (COI) gene. Genetic distances were calculated using Nei and Li’s index (Nei & Li, 1979) and analysed using UPGMA cluster analysis and Principal Coordinates analysis (PCO). The AFLP results demonstrated clear-cut genetic differentiation between populations collected from the central part of Iran and those from north, which are separated by a desert. Both UPGMA and PCO analysis further separated two populations from the very humid western Caspian Sea coast (zone 3) from other northern populations from the temperate Caspian Sea coastal plain (zone 2) which are connected by rain forest. One population from the Caspian coast, Astaneh, was found to be genetically highly diverged from all other populations. An intermediate genetic structure between zone 2 and 3 was found for Nour from zone 2 which indicates some gene flow between these two populations. In all analyses a mountain population, Sorkhabad, was found to be genetically identical to those from the coastal plain (zone 2), which indicates high gene flow between these populations due to short geographical distance. A Mantel test showed a highly significant positive correlation between genetic and geographic distances (r = 0.47, P < 0.001). The COI gene was found highly conserved among all populations. Our results suggest that both geographic distances and physical barriers contribute to the formation of
74
Life-history evolution in hymenopteran parasitoids: the roles of host and climate
Chapter 5 Genetic structure of Leptopilina boulardi populations from different climatic zones of Iran
genetically distinct populations of L. boulardi. Transfer of fruits containing Drosophila larvae parasitized by L. boulardi may have caused unexpected gene flow and changed the genetic pattern of populations, particularly in urban areas.
Introduction
Insect parasitoids have been a favorite model in ecology and evolutionary biology (Godfray and Shimada, 1999). Drosophila parasitoids have played a major role in these studies, because of their ease of maintenance in the laboratory, the enormous biological and genetic information on their Drosophila host which has been used as model organism for almost a century (Irving et al. 2004) and because of their diversity which allows comparative studies (Chapters 2 &3). One way to study adaptation in changing environments is to compare populations of a widely distributed organism across contrasting climates. Understanding the genetic structure of the insect populations is an important first step in the study of local adaptation (Mopper and Strauss 1998). Understanding the genetic structure of populations can provide essentional insights to interpret the results of ecological studies. Studying genetic population structure of insects is thus essential for comparative studies of behaviour and ecology and evolution of populations (Roderick, 1996). DNA markers provide powerful and efficient tools to study genetic diversity at both inter- and intraspecific level in insects’ populations (Avise, 1994). A wide range of molecular markers has been successfully used to measure genetic diversity of insects, including RFLPs, RAPDs, SSRs and AFLP’s. Among these techniques, Amplified Fragment Length Polymorphism (AFLP) is a useful DNA fingerprinting technique to study genetic diversity within a species (McMichael and Prowel, 1999; Hawthorne, 2001; Wu et al. 2006 and Tao et al. 2009). AFLP is a powerful technique, which is able to detect genetic variation of organisms based on DNA from any source and complexity without prior knowledge of the gene structure or sequences (Vost et al. 1995). In comparison to other methods, AFLP can provide higher resolution whilst needing less DNA (Tao et al. 2009). AFLP has been successfully used to study genetic diversity of insect populations from different geographic regions and belonging to different orders and families (Reineke et al., 1999; Ravel et al., 2001; Lu et al., 2002; Pannebakker et al. 2004; Samara et al. 2008; Alamalakala et al. 2009; Tao et al. 2009).
One of the main constraints on local genetic differentiation and adaptation is extensive gene flow between populations. Reduced dispersal of populations can thus accelerate the adaptation process and may lead to genetic subdivision of populations (Slatkin 1987). Environmental or physical barriers may promote isolation of populations. These include geographic distance and physical barriers like mountains, rivers and stretches of unsuitable habitat (Peterson and Denno 1998). AFLP markers
75
Genetic structure of Leptopilina boulardi populations from different climatic zones of Iran
have been used to infer the role of geographical distance and barriers to gene flow in shaping the genetic structure of population in a variety of organisms (e.g. Salvato et al. 2002; Irwin et al. 2005; Clark et al. 2007). In the present study we used AFLP to investigate the role of geographical distance in shaping genetic variation in Iranian L. boulardi populations. Leptopilina boulardi (Hymenoptera: Figitidae) is a larval parasitoid of Drosophila of African origin (Allemand et al, 2003) which is widely distributed over tropical and warm temperate regions.
Mitochondrial markers have also been used in population genetic studies of insects (e.g. Crozier et al.1997; Olav et al. 2003; Smith 2005). For example, in the ant Leptothorax rugatulus (Olav et al.2003) a mitochondrial marker was found to be more informative than microsatellites and discriminated significantly better between populations due to maternal divergence resulting from reduced dispersal of females. Sequencing part of the cytochrome oxidase I gene successfully discriminated between two species of Homalodisca, a cicadellid leafhopper and demonstrated genetic differences between H. coagulate populations based on haplotype (Smith 2005). Using mitochondrial markers may provide valuable information on the migration of females between populations, because mitochondria are maternally inherited. Being able to trace back migration of female populations could provide crucial information in some insect parasitoids that have established asexual populations after infection with parthenogenesis-inducing Wolbachia (Stouthamer et al. 1999).
In this study, we used both AFLP and COI gene sequencing to study the genetic structure among 11 populations of Leptopilina boulardi collected from five contrasting climate zones in Iran. The zones were cho-sen to represent five distinct climates varying in precipitation, length of season and minimum and maximum temperatures. Many studies have combined genetic studies with experimental studies to measure the adap-tive value of traits (Roderick, 1996; Kaltz and Shykoff 1998; Mopper and Strauss 1998; Lively 1999; Anderson et al. 2004). The main goal of this study was to describe the genetic structure of these populations, to be used later in a study of local adaptation in life history traits of these po-pulations (chapter 6).
Material and methods
Field sampling
Leptopilina boulardi populations were sampled along a climatic cline stretching from the northern to the central regions of the Islamic Republic of Iran in July 2006. The transect covered five climatic zones
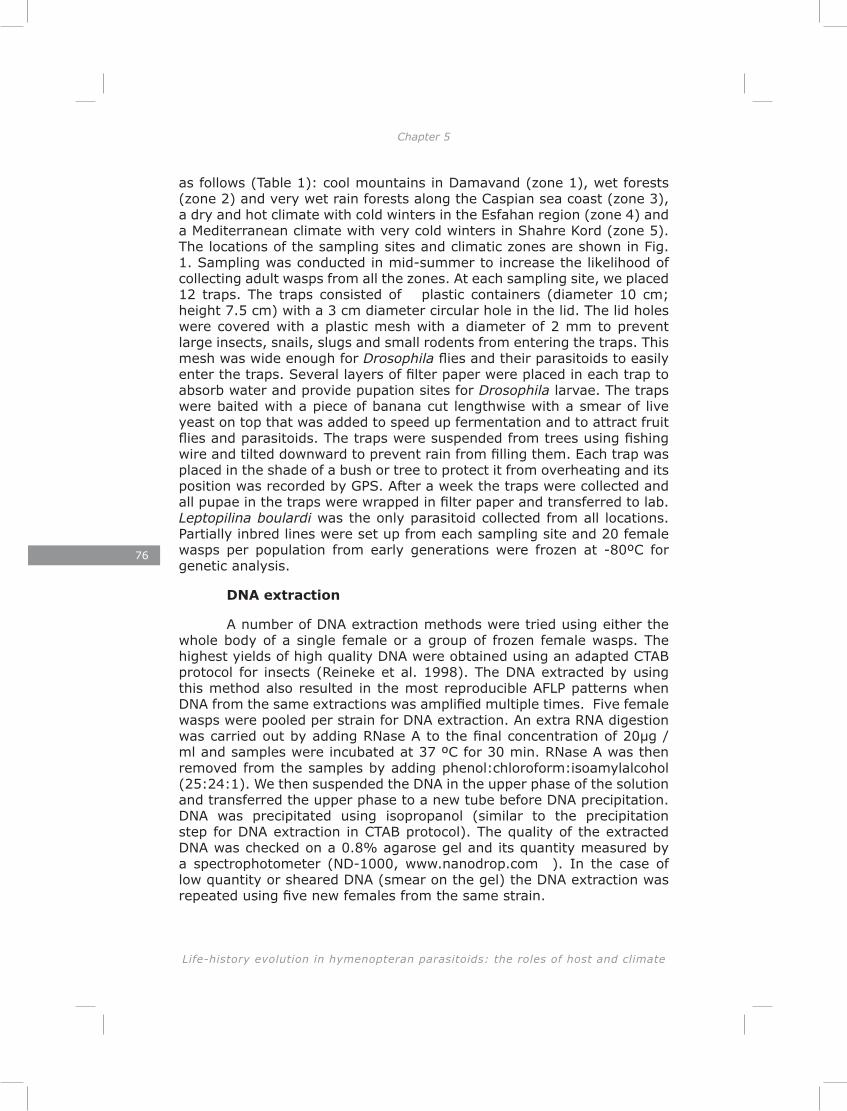
76
Life-history evolution in hymenopteran parasitoids: the roles of host and climate
Chapter 5 Genetic structure of Leptopilina boulardi populations from different climatic zones of Iran
as follows (Table 1): cool mountains in Damavand (zone 1), wet forests (zone 2) and very wet rain forests along the Caspian sea coast (zone 3), a dry and hot climate with cold winters in the Esfahan region (zone 4) and a Mediterranean climate with very cold winters in Shahre Kord (zone 5). The locations of the sampling sites and climatic zones are shown in Fig. 1. Sampling was conducted in mid-summer to increase the likelihood of collecting adult wasps from all the zones. At each sampling site, we placed 12 traps. The traps consisted of plastic containers (diameter 10 cm; height 7.5 cm) with a 3 cm diameter circular hole in the lid. The lid holes were covered with a plastic mesh with a diameter of 2 mm to prevent large insects, snails, slugs and small rodents from entering the traps. This mesh was wide enough for Drosophila flies and their parasitoids to easily enter the traps. Several layers of filter paper were placed in each trap to absorb water and provide pupation sites for Drosophila larvae. The traps were baited with a piece of banana cut lengthwise with a smear of live yeast on top that was added to speed up fermentation and to attract fruit flies and parasitoids. The traps were suspended from trees using fishing wire and tilted downward to prevent rain from filling them. Each trap was placed in the shade of a bush or tree to protect it from overheating and its position was recorded by GPS. After a week the traps were collected and all pupae in the traps were wrapped in filter paper and transferred to lab. Leptopilina boulardi was the only parasitoid collected from all locations. Partially inbred lines were set up from each sampling site and 20 female wasps per population from early generations were frozen at -80ºC for genetic analysis.
DNA extraction
A number of DNA extraction methods were tried using either the whole body of a single female or a group of frozen female wasps. The highest yields of high quality DNA were obtained using an adapted CTAB protocol for insects (Reineke et al. 1998). The DNA extracted by using this method also resulted in the most reproducible AFLP patterns when DNA from the same extractions was amplified multiple times. Five female wasps were pooled per strain for DNA extraction. An extra RNA digestion was carried out by adding RNase A to the final concentration of 20µg / ml and samples were incubated at 37 ºC for 30 min. RNase A was then removed from the samples by adding phenol:chloroform:isoamylalcohol (25:24:1). We then suspended the DNA in the upper phase of the solution and transferred the upper phase to a new tube before DNA precipitation. DNA was precipitated using isopropanol (similar to the precipitation step for DNA extraction in CTAB protocol). The quality of the extracted DNA was checked on a 0.8% agarose gel and its quantity measured by a spectrophotometer (ND-1000, www.nanodrop.com ). In the case of low quantity or sheared DNA (smear on the gel) the DNA extraction was repeated using five new females from the same strain.

77
Genetic structure of Leptopilina boulardi populations from different climatic zones of Iran
Tab
le 1
: Description of the trapping locations of the populations including clim
ate, vegetation and elevation
Zo
ne
Po
pu
latio
n
IDC
limate
Descrip
tion
of th
e lo
catio
nV
eg
eta
tion
Ele
vatio
n
(m)
1Sorkhabad
Mountain
In the northern slope of the Dam
avand m
ountain, toward M
azandaran provinceTree and bushes along the river
1975
2Q
aemshahr 1
Temperate w
et forestIn M
azandaran province, coastal Caspian sea
Forest76
2Q
aemshahr 2
Temperate w
et forestIn M
azandaran province in coastal Caspian sea
Forest75
2N
ourTem
perate wet forest
In Mazandaran province in coastal C
aspian seaN
atural park20
2Chalus
Temperate w
et forestIn M
azandaran province in coastal Caspian sea
Forest76
3Astaneh
Temperate very w
et forest
In Gilan province in coastal C
aspian seaW
indbreak of rice field, close to city
8.5
3Seyahkal
Temperate very w
et forest
In Gilan province in coastal C
aspian seaVery dense forest
378
3Lunak
Temperate very w
et forest
In Gilan province in coastal C
aspian seaVery dense forest
485
4D
orcheh Sem
i dry desert with
cold winter
Close to Esfahan along the Z
ayandehrod river O
rchard along the river
1625
4Khairabad
Sem
i dry desert with
cold winter
Close to Esfahan along the Z
ayandehrod riverO
rchard and field along the river
1605
5Zam
ankhanM
editerranean with very
cold winter
Close to S
hahrekord and along Zayandehrod
riverO
rchard and field along the river
1873
78
Life-history evolution in hymenopteran parasitoids: the roles of host and climate
Chapter 5 Genetic structure of Leptopilina boulardi populations from different climatic zones of Iran
Fig 1: Map of the Islamic republic of Iran with climate zones indicated in shades of grey. Sampling points are indicated by the ID name of population, see table 1.
AFLP analysis
To asses the genetic diversity of the L. boulardi populations we employed the amplified fragment length polymorphism (AFLP) technique (Vos et al. 1995) with a slight modification to the standard procedure. The AFLP procedure consisted of four steps. Restriction and ligation were carried out separately overnight. Step1 restriction digestion: 7 µl containing approximately 500ng of genomic DNA was incubated with EcoRI and MseI enzymes at 37 ºC overnight. Each reaction contained 5U EcoRI, 5U MseI , 4 µl of 10X restriction buffer (react 4) and 10 µg of BSA (bovine serum albumin), all from New England Biolabs (www.neb.com). The total volume was adjusted to 40 µl with autoclaved nanopure water. Step 2, restriction ligation: to each tube containing 40 µl of sample from step1, 10 µl of adaptor-ligation mix was added, which contained 5 µl EcoRI / MseI adaptor mix (one part 10µM Eco-adaptor and 9 parts 10µM Mse-adaptor; Table 1), 1 µl of 10 mM ATP, 1 µl 10X restriction buffer (react 4), 2U T4 ligase and 2.67 µl autoclaved nanopure water. The restriction-ligation reactions were incubated at 37 ºC overnight. Step 3, preamplification: this was the first
of two selection rounds of the fragments aimed at reducing background noise and nonspecific bands (Vos et al., 1995). Two primers, EcoRI and MseI with one base extension (Table 2) were used in the master mix of 16.7 µl per sample. Each reaction contained, 0.2 µl EcoRI+A primer (20 µM), 1.5 µl of Mse+C primer (20 µM), 15 µl AFLP Coremix (Applied bisystem, www.appliedbiosystems.com), and 4 µl of diluted restriction-ligation mix (concentration: 1 part restriction-ligation: 2.5 parts H2O) as DNA template. A touchdown profile amplification was used to increase the optimal primer selectivity in this step. The thermal cycling started with 2 min at 72 ºC to allow the polymerase to repair the nick caused by ligation of adaptors. This was followed by two cycles of 30 sec at 94 ºC, 30 sec at 65 ºC, 1 min 72 ºC, then 12 touchdown cycles during which the annealing temperature was dropped by 0.7 ºC in each cycle, then 23 cycles of 30 sec at 94 ºC, 30 sec at 56 ºC, 1 min 72 ºC and ended with 30 min at 60 ºC. This last step can promote addition of A (adenine) at the 3´ end of the strands by taq polymerase.
Table2: List of primers and adaptor used for the AFLP analysis
Type Name Sequence 5´-3´
Adaptor
EcoRI adaptor/F CTCGTAGACTGCGTACC
EcoRI adaptor/R AATTGGTACGCAGTCTAC
MseI adaptor/F GACGATGAGTCCTGAG
MseI adaptor/R TACTCAGGACTCAT
Primer, pre select. amp.
EcoRI Preamp. GAC TGCGTACCAATTCA*
MseI Preamp. GATGAGTCCTGAGTAAC*
Primer, select. amp.EcoRI Select. GACTGCGTACCAATTCANN *
MseI Select. GATGAGTCCTGAGTAACN **Nucleotides in bold are the fixed extended base in the 3´ end of the primers and N are the variable extension to provide different primer combination, see above.
The quality of amplified product was checked by loading 4 µl of PCR product on a 0.8% agarose gel prior to next step. Step 4, selective amplification: this last selection step was performed using one of three EcoRI primers (fluorescently labeled) and one of three MseI with three and two base extensions in each primer respectively. Different combinations of these primers resulted in 9 useful primer combinations (Table 3). Each PCR reaction contained 0.25 µl MseI C+X (20µM), 1.0 µl EcoRI A+XX (1 µM), 15 µl AFLP Coremix, 0.75 µl of autoclaved nanopure water, and 3 µl of PCR product from step 3 (diluted 1/10) in a total of 20 µl. Thermal cycling conditions were identical to those used in the preamplification, except that it started with 1 min at 94 ºC instead of 2 min at 72 ºC.
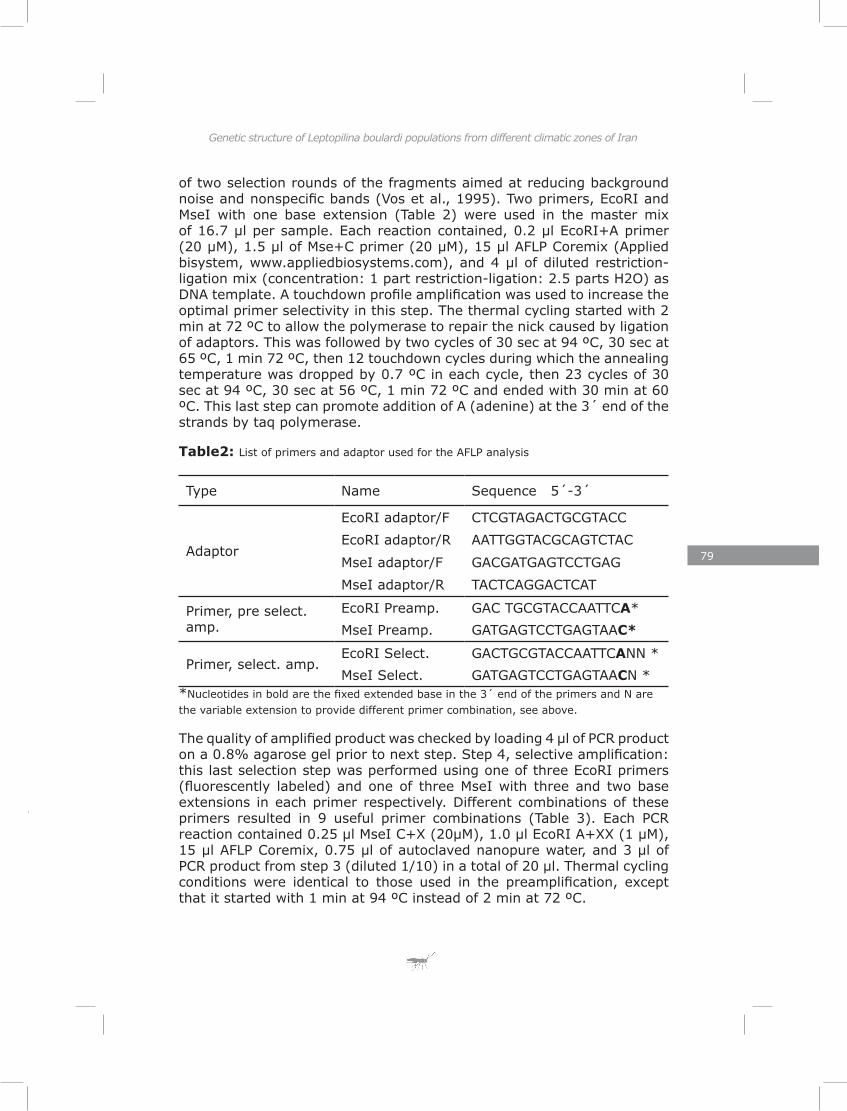
79
Genetic structure of Leptopilina boulardi populations from different climatic zones of Iran
Fig 1: Map of the Islamic republic of Iran with climate zones indicated in shades of grey. Sampling points are indicated by the ID name of population, see table 1.
AFLP analysis
To asses the genetic diversity of the L. boulardi populations we employed the amplified fragment length polymorphism (AFLP) technique (Vos et al. 1995) with a slight modification to the standard procedure. The AFLP procedure consisted of four steps. Restriction and ligation were carried out separately overnight. Step1 restriction digestion: 7 µl containing approximately 500ng of genomic DNA was incubated with EcoRI and MseI enzymes at 37 ºC overnight. Each reaction contained 5U EcoRI, 5U MseI , 4 µl of 10X restriction buffer (react 4) and 10 µg of BSA (bovine serum albumin), all from New England Biolabs (www.neb.com). The total volume was adjusted to 40 µl with autoclaved nanopure water. Step 2, restriction ligation: to each tube containing 40 µl of sample from step1, 10 µl of adaptor-ligation mix was added, which contained 5 µl EcoRI / MseI adaptor mix (one part 10µM Eco-adaptor and 9 parts 10µM Mse-adaptor; Table 1), 1 µl of 10 mM ATP, 1 µl 10X restriction buffer (react 4), 2U T4 ligase and 2.67 µl autoclaved nanopure water. The restriction-ligation reactions were incubated at 37 ºC overnight. Step 3, preamplification: this was the first
of two selection rounds of the fragments aimed at reducing background noise and nonspecific bands (Vos et al., 1995). Two primers, EcoRI and MseI with one base extension (Table 2) were used in the master mix of 16.7 µl per sample. Each reaction contained, 0.2 µl EcoRI+A primer (20 µM), 1.5 µl of Mse+C primer (20 µM), 15 µl AFLP Coremix (Applied bisystem, www.appliedbiosystems.com), and 4 µl of diluted restriction-ligation mix (concentration: 1 part restriction-ligation: 2.5 parts H2O) as DNA template. A touchdown profile amplification was used to increase the optimal primer selectivity in this step. The thermal cycling started with 2 min at 72 ºC to allow the polymerase to repair the nick caused by ligation of adaptors. This was followed by two cycles of 30 sec at 94 ºC, 30 sec at 65 ºC, 1 min 72 ºC, then 12 touchdown cycles during which the annealing temperature was dropped by 0.7 ºC in each cycle, then 23 cycles of 30 sec at 94 ºC, 30 sec at 56 ºC, 1 min 72 ºC and ended with 30 min at 60 ºC. This last step can promote addition of A (adenine) at the 3´ end of the strands by taq polymerase.
Table2: List of primers and adaptor used for the AFLP analysis
Type Name Sequence 5´-3´
Adaptor
EcoRI adaptor/F CTCGTAGACTGCGTACC
EcoRI adaptor/R AATTGGTACGCAGTCTAC
MseI adaptor/F GACGATGAGTCCTGAG
MseI adaptor/R TACTCAGGACTCAT
Primer, pre select. amp.
EcoRI Preamp. GAC TGCGTACCAATTCA*
MseI Preamp. GATGAGTCCTGAGTAAC*
Primer, select. amp.EcoRI Select. GACTGCGTACCAATTCANN *
MseI Select. GATGAGTCCTGAGTAACN **Nucleotides in bold are the fixed extended base in the 3´ end of the primers and N are the variable extension to provide different primer combination, see above.
The quality of amplified product was checked by loading 4 µl of PCR product on a 0.8% agarose gel prior to next step. Step 4, selective amplification: this last selection step was performed using one of three EcoRI primers (fluorescently labeled) and one of three MseI with three and two base extensions in each primer respectively. Different combinations of these primers resulted in 9 useful primer combinations (Table 3). Each PCR reaction contained 0.25 µl MseI C+X (20µM), 1.0 µl EcoRI A+XX (1 µM), 15 µl AFLP Coremix, 0.75 µl of autoclaved nanopure water, and 3 µl of PCR product from step 3 (diluted 1/10) in a total of 20 µl. Thermal cycling conditions were identical to those used in the preamplification, except that it started with 1 min at 94 ºC instead of 2 min at 72 ºC.
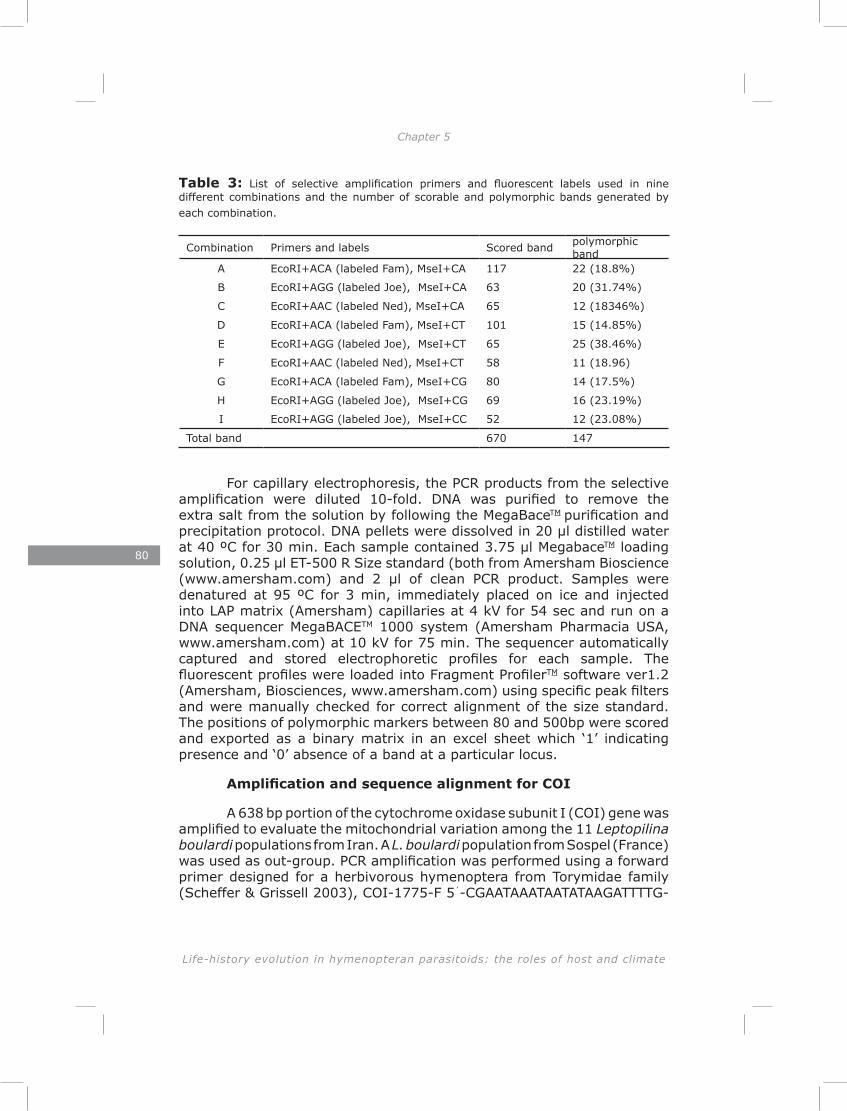
80
Life-history evolution in hymenopteran parasitoids: the roles of host and climate
Chapter 5 Genetic structure of Leptopilina boulardi populations from different climatic zones of Iran
Table 3: List of selective amplification primers and fluorescent labels used in nine different combinations and the number of scorable and polymorphic bands generated by each combination.
Combination Primers and labels Scored band polymorphic band
A EcoRI+ACA (labeled Fam), MseI+CA 117 22 (18.8%)
B EcoRI+AGG (labeled Joe), MseI+CA 63 20 (31.74%)
C EcoRI+AAC (labeled Ned), MseI+CA 65 12 (18346%)
D EcoRI+ACA (labeled Fam), MseI+CT 101 15 (14.85%)
E EcoRI+AGG (labeled Joe), MseI+CT 65 25 (38.46%)
F EcoRI+AAC (labeled Ned), MseI+CT 58 11 (18.96)
G EcoRI+ACA (labeled Fam), MseI+CG 80 14 (17.5%)
H EcoRI+AGG (labeled Joe), MseI+CG 69 16 (23.19%)
I EcoRI+AGG (labeled Joe), MseI+CC 52 12 (23.08%)
Total band 670 147
For capillary electrophoresis, the PCR products from the selective amplification were diluted 10-fold. DNA was purified to remove the extra salt from the solution by following the MegaBaceTM purification and precipitation protocol. DNA pellets were dissolved in 20 µl distilled water at 40 ºC for 30 min. Each sample contained 3.75 µl MegabaceTM loading solution, 0.25 µl ET-500 R Size standard (both from Amersham Bioscience (www.amersham.com) and 2 µl of clean PCR product. Samples were denatured at 95 ºC for 3 min, immediately placed on ice and injected into LAP matrix (Amersham) capillaries at 4 kV for 54 sec and run on a DNA sequencer MegaBACETM 1000 system (Amersham Pharmacia USA, www.amersham.com) at 10 kV for 75 min. The sequencer automatically captured and stored electrophoretic profiles for each sample. The fluorescent profiles were loaded into Fragment ProfilerTM software ver1.2 (Amersham, Biosciences, www.amersham.com) using specific peak filters and were manually checked for correct alignment of the size standard. The positions of polymorphic markers between 80 and 500bp were scored and exported as a binary matrix in an excel sheet which ‘1’ indicating presence and ‘0’ absence of a band at a particular locus.
Amplification and sequence alignment for COI
A 638 bp portion of the cytochrome oxidase subunit I (COI) gene was amplified to evaluate the mitochondrial variation among the 11 Leptopilina boulardi populations from Iran. A L. boulardi population from Sospel (France) was used as out-group. PCR amplification was performed using a forward primer designed for a herbivorous hymenoptera from Torymidae family (Scheffer & Grissell 2003), COI-1775-F 5´-CGAATAAATAATATAAGATTTTG-
81
Genetic structure of Leptopilina boulardi populations from different climatic zones of Iran
Table 3: List of selective amplification primers and fluorescent labels used in nine different combinations and the number of scorable and polymorphic bands generated by each combination.
Combination Primers and labels Scored band polymorphic band
A EcoRI+ACA (labeled Fam), MseI+CA 117 22 (18.8%)
B EcoRI+AGG (labeled Joe), MseI+CA 63 20 (31.74%)
C EcoRI+AAC (labeled Ned), MseI+CA 65 12 (18346%)
D EcoRI+ACA (labeled Fam), MseI+CT 101 15 (14.85%)
E EcoRI+AGG (labeled Joe), MseI+CT 65 25 (38.46%)
F EcoRI+AAC (labeled Ned), MseI+CT 58 11 (18.96)
G EcoRI+ACA (labeled Fam), MseI+CG 80 14 (17.5%)
H EcoRI+AGG (labeled Joe), MseI+CG 69 16 (23.19%)
I EcoRI+AGG (labeled Joe), MseI+CC 52 12 (23.08%)
Total band 670 147
For capillary electrophoresis, the PCR products from the selective amplification were diluted 10-fold. DNA was purified to remove the extra salt from the solution by following the MegaBaceTM purification and precipitation protocol. DNA pellets were dissolved in 20 µl distilled water at 40 ºC for 30 min. Each sample contained 3.75 µl MegabaceTM loading solution, 0.25 µl ET-500 R Size standard (both from Amersham Bioscience (www.amersham.com) and 2 µl of clean PCR product. Samples were denatured at 95 ºC for 3 min, immediately placed on ice and injected into LAP matrix (Amersham) capillaries at 4 kV for 54 sec and run on a DNA sequencer MegaBACETM 1000 system (Amersham Pharmacia USA, www.amersham.com) at 10 kV for 75 min. The sequencer automatically captured and stored electrophoretic profiles for each sample. The fluorescent profiles were loaded into Fragment ProfilerTM software ver1.2 (Amersham, Biosciences, www.amersham.com) using specific peak filters and were manually checked for correct alignment of the size standard. The positions of polymorphic markers between 80 and 500bp were scored and exported as a binary matrix in an excel sheet which ‘1’ indicating presence and ‘0’ absence of a band at a particular locus.
Amplification and sequence alignment for COI
A 638 bp portion of the cytochrome oxidase subunit I (COI) gene was amplified to evaluate the mitochondrial variation among the 11 Leptopilina boulardi populations from Iran. A L. boulardi population from Sospel (France) was used as out-group. PCR amplification was performed using a forward primer designed for a herbivorous hymenoptera from Torymidae family (Scheffer & Grissell 2003), COI-1775-F 5´-CGAATAAATAATATAAGATTTTG-
3´ and a reverse primer designed for Leptopilina clavipes, another species of the same genus (K. Kraaijeveld, unpublished), COI-2413-R, 5´-TCATCTAAAAATTTTAATCCCAGT-3´. The amplification was carried out on a Thermocycler PTC-2000 using the following thermal cycles: denaturing for 3 min at 92ºC followed by a touchdown with one degree drop in annealing temperature per cycle from 53-40 ºC (10 sec at 92 ºC ,10 sec at 53-40 ºC and 2 min at 72 ºC), then 25 cycles of 10 sec at 92 ºC,10 sec at 40 ºC and 2 min at 72 ºC, and ended with 5 min extension at 72 ºC. Each PCR reaction contained 1.2µl of 2.5mM DNTPs, 0.5µl of 10 µM of each primer, 0.15µl of Taq DNA polymerase(5 U), 1.5µl of 10X Buffer and 0.45µl of 15mM MgCl2 µl; all Qiagen products and was adjusted to 15µl with autoclaved nanopure water. The PCR products were purified using Wizard SV Gel and PCR Clean-Up System (Promega, www.promega.com) following the manufacturer’s protocol. The amplified bands were sequenced both forward and reverse on MegaBACETM 1000 sequencer. The Sequencer software Version 4.2 (Gene Codes Corp.) was used to assemble the contigs and obtain consensus sequences. The sequences were aligned using pairwise-alignment in MacClade 4.08 (Maddison and Maddison 2005) and edited manually.
Data analysis
Pair-wise genetic distances between populations were calculated from the AFLP data using Nei and Li’s index (Nei & Li, 1979) in Treecon version 1.3b for windows (van de Peer and de Wachter, 1994). UPGMA cluster analysis (Sokal and Michener, 1958) with 1000 replications of bootstraps was performed in Treecon and genetic distances were visualized in a dendrogram format. The geographic distances between collecting sites were calculated from their GPS locations and combined with the genetic distance values into a pair-wise genetic and geographic distance matrix. Isolation by distance was investigated with a Mantel test (Mantel, 1967) using the web-based program Isolation by distance web service (IBDWS) version 3.16 (Jensen et al. 2005). The combined binary AFLP data matrix was used to perform Principal Coordinate analysis (PCO) with GenAlex 6 (Peakall and Smouse, 2006) using Nei and Li’s coefficient (Nei & Li, 1979) for calculating similarities, three first coordinates were used to graphically depict genetic variation among populations.
Results
AFLP analysis
The 9 primer combinations yielded 670 scorable bands of which 147 (21.94%) were polymorphic. UPGMA tree and bootstrap analysis indicated that the three populations from the central part of Iran (Dorcheh, Khairabad and Zamankhan) clustered together, but were differentiated from the northern populations sampled along the Caspian
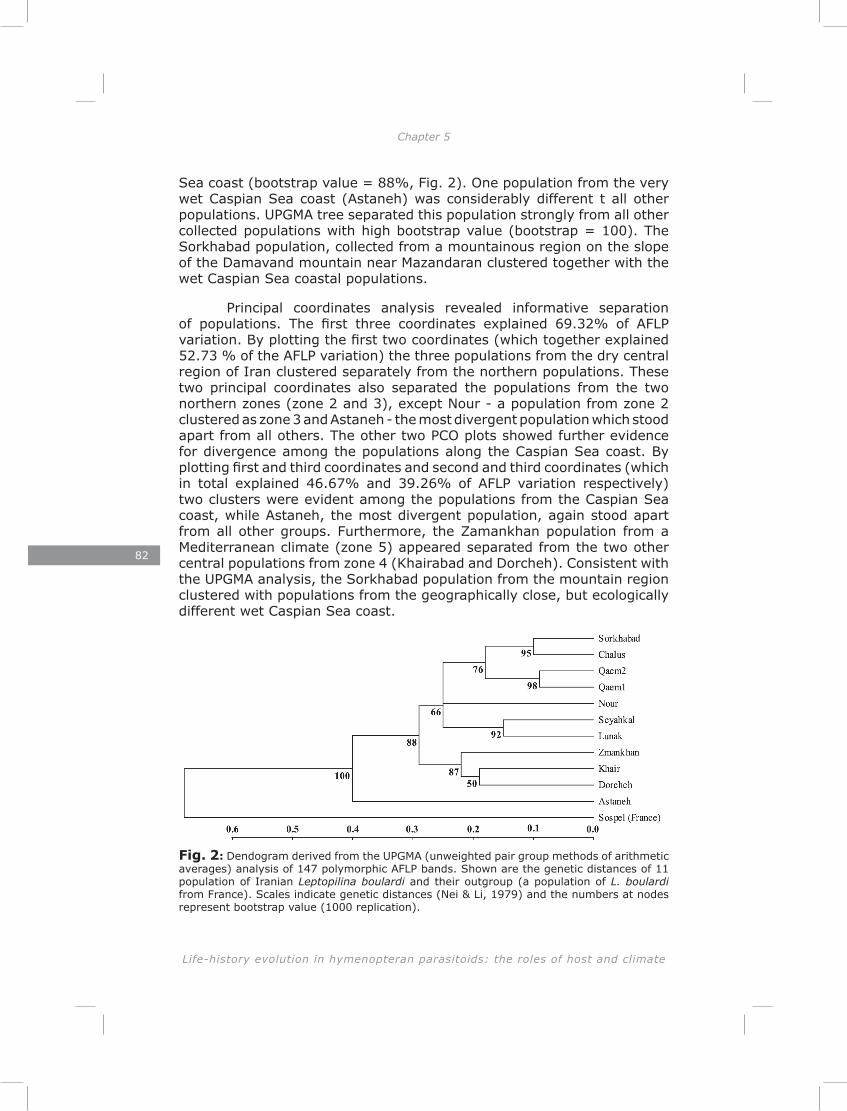
82
Life-history evolution in hymenopteran parasitoids: the roles of host and climate
Chapter 5 Genetic structure of Leptopilina boulardi populations from different climatic zones of Iran
Sea coast (bootstrap value = 88%, Fig. 2). One population from the very wet Caspian Sea coast (Astaneh) was considerably different t all other populations. UPGMA tree separated this population strongly from all other collected populations with high bootstrap value (bootstrap = 100). The Sorkhabad population, collected from a mountainous region on the slope of the Damavand mountain near Mazandaran clustered together with the wet Caspian Sea coastal populations.
Principal coordinates analysis revealed informative separation of populations. The first three coordinates explained 69.32% of AFLP variation. By plotting the first two coordinates (which together explained 52.73 % of the AFLP variation) the three populations from the dry central region of Iran clustered separately from the northern populations. These two principal coordinates also separated the populations from the two northern zones (zone 2 and 3), except Nour - a population from zone 2 clustered as zone 3 and Astaneh - the most divergent population which stood apart from all others. The other two PCO plots showed further evidence for divergence among the populations along the Caspian Sea coast. By plotting first and third coordinates and second and third coordinates (which in total explained 46.67% and 39.26% of AFLP variation respectively) two clusters were evident among the populations from the Caspian Sea coast, while Astaneh, the most divergent population, again stood apart from all other groups. Furthermore, the Zamankhan population from a Mediterranean climate (zone 5) appeared separated from the two other central populations from zone 4 (Khairabad and Dorcheh). Consistent with the UPGMA analysis, the Sorkhabad population from the mountain region clustered with populations from the geographically close, but ecologically different wet Caspian Sea coast.
Isolation of populations by distance
A significant positive correlation between genetic and geographic distance was observed among the L. boulardi populations (Mantel test; r = 0.47, P < 0.001, Fig. 4a). The result of this test showed that a considerable part of the genetic variation was explained by geographic distance and supported the UPGMA and Principal Coordinate analyses since all geographically-close populations resembled each other. The only exception was the population from Astaneh, which was highly distinct from all others populations, even from those collected from a distance of less than 15 km. By excluding the Astaneh population from the Mantel test, the correlation coefficient increased substantially (mantel test; r = 0.73, P < 0.001, Fig. 4b).
Variation in cytochrome oxidase I (COI)
COI sequence was found to be highly conserved among the Iranian L. boulardi populations. Only two bases were found to be different in two Caspian Sea coast populations and four insertions and one replacement were found in the out-group compared to the Iranian populations (Table 4).
Table 4: Polymorphic site of the COI gene in 638 bp sequenced for 11 Iranian Leptopilina boulardi aligned with their out-group, Sospel - a population of L. boulardi from France.
PopulationPosition
10 60 131 321 338 440 459Sospel - G C G A A C
Zamankhan - - C - - G -
Qaemshahr1 - - C - - G -
Qaemshahr2 - - C - - G -
Khairabad - - C - - G -
Dorche - - A - - G -
Nour - - C - - G -
Astaneh - - C - - G -
Seyahkal - - C - - G -
Lunak - - C - - G -
Sorkhabad - - C - - G -
Chalus C - C - - G -Fig. 2: Dendogram derived from the UPGMA (unweighted pair group methods of arithmetic averages) analysis of 147 polymorphic AFLP bands. Shown are the genetic distances of 11 population of Iranian Leptopilina boulardi and their outgroup (a population of L. boulardi from France). Scales indicate genetic distances (Nei & Li, 1979) and the numbers at nodes represent bootstrap value (1000 replication).
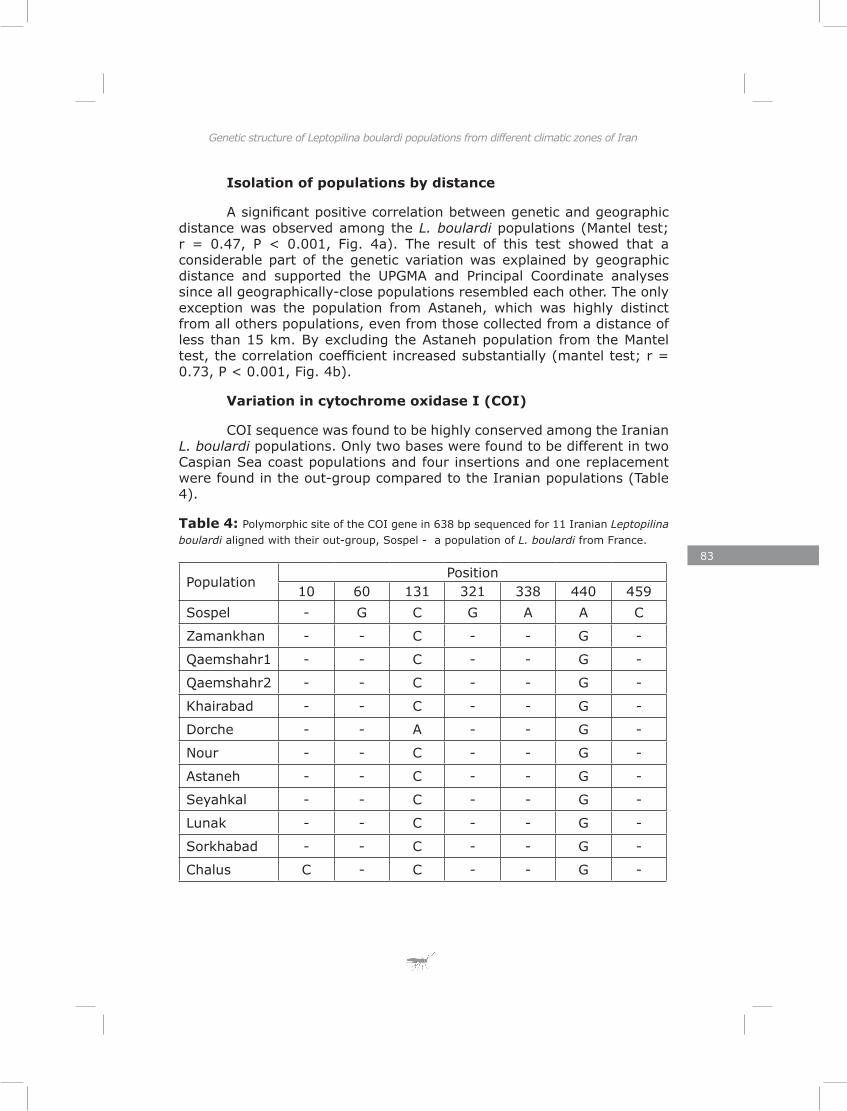
83
Genetic structure of Leptopilina boulardi populations from different climatic zones of Iran
Isolation of populations by distance
A significant positive correlation between genetic and geographic distance was observed among the L. boulardi populations (Mantel test; r = 0.47, P < 0.001, Fig. 4a). The result of this test showed that a considerable part of the genetic variation was explained by geographic distance and supported the UPGMA and Principal Coordinate analyses since all geographically-close populations resembled each other. The only exception was the population from Astaneh, which was highly distinct from all others populations, even from those collected from a distance of less than 15 km. By excluding the Astaneh population from the Mantel test, the correlation coefficient increased substantially (mantel test; r = 0.73, P < 0.001, Fig. 4b).
Variation in cytochrome oxidase I (COI)
COI sequence was found to be highly conserved among the Iranian L. boulardi populations. Only two bases were found to be different in two Caspian Sea coast populations and four insertions and one replacement were found in the out-group compared to the Iranian populations (Table 4).
Table 4: Polymorphic site of the COI gene in 638 bp sequenced for 11 Iranian Leptopilina boulardi aligned with their out-group, Sospel - a population of L. boulardi from France.
PopulationPosition
10 60 131 321 338 440 459Sospel - G C G A A C
Zamankhan - - C - - G -
Qaemshahr1 - - C - - G -
Qaemshahr2 - - C - - G -
Khairabad - - C - - G -
Dorche - - A - - G -
Nour - - C - - G -
Astaneh - - C - - G -
Seyahkal - - C - - G -
Lunak - - C - - G -
Sorkhabad - - C - - G -
Chalus C - C - - G -
84
Life-history evolution in hymenopteran parasitoids: the roles of host and climate
Chapter 5 Genetic structure of Leptopilina boulardi populations from different climatic zones of Iran
Discussion
The AFLP analysis provided 147 polymorphic loci out of 670 reproducible and scorable bands in nine primer combinations. This provided enough information to allow a clear distinction among L. boulardi populations originating from different climatic zones in Iran. One of the main challenges in AFLP analysis for insects is generating enough reproducible and scorable bands and this is highly dependent on the quality of DNA (Reineke et al. 1998). In population genetic studies, pooling a number of individuals instead of extracting DNA from a single organism is a possibility to get enough DNA from small organisms and this solution has been suggested in previous studies (Pannebakker et al. 2004). A CTAB protocol modified for insects resulted in high quality DNA with highly reproducible bands in AFLP analyses in comparison with other extractions methods (Reineke et al. 1998). Pooling a number of female wasps and using the CTAB protocol modified for insects in the present study resulted in highly reproducible and scorable bands. The number of polymorphic bands among the populations depends on the primer combination and the genetic divergence between populations and can vary from very high to relatively low (e.g. high; Samara et al. 2008; Tao et al. 2009 and low; Najimi et al.2002; Pannebakker et al. 2004). Similar to the results of a previous study on genetic diversity in a different Leptopilina species, L. clavipes (Pannebakker et al. 2004) we found a relatively low number of polymorphic bands per primer combination (21.94% in total). By increasing the number of primer combinations (nine combinations) we obtained a high number of polymorphic bands (147 scorable polymorphic bands), providing highly informative data on the genetic structure of these populations. Similar to other AFLP studies, the consistency of scorable bands over all populations, the reproducibility of results and the presence of polymorphisms were the three criteria to choose the proper primer combination (Samara et al. 2008; Clark et al. 2007). As AFLP markers are dominant, the main assumption in the analysis is presence or absence of identical fragments (which are considered as homologous). To calculate the genetic distance between populations with Nei and Li’s index (Nei & Li, 1979) only shared-presence bands were used. AFLP results showed the lowest distance values for two populations (Qaemshar1 and Qaemshar 2) collected at short range from each other (1.5 km) which was expected because of the high probability of gene flow and in agreement with a population genetic study using AFLP in a hymenopteran parasitoid (Samara et al. 2008). Excluding the Astaneh population, which was the most divergent population in both the UPGMA cluster analysis and the Principal coordinate Analysis (PCO), other northern populations clustered close together in two clades, with relatively high bootstrap value (76%). Nour, a population from zone 2 remained as an unresolved branch in UPGMA cluster-analysis between two northern populations (zone 2 and 3). PCO analysis provided a similar
85
Genetic structure of Leptopilina boulardi populations from different climatic zones of Iran
pattern and supports the results of the UPGMA cluster-analysis. Based on PCO analysis, Nour grouped with populations from zone 3, based on the first two coordinates plot. By plotting the first and third coordinates in PCO, this population separated from all other northern populations and in plotting second and third coordinates of PCO, Nour grouped with populations from zone 2, the zone it originated from. The different results obtained with different plotting options in PCO analysis supported the unresolved position of this population found in the UPGMA cluster analysis. Genetically, it is intermediate between populations from zone 2 and 3. A clear distinction between northern and central populations resulted from both analyses (UPGMA; bootstrap value = 88%). A distinct difference between Zamankhan, a Mediterranean population, and the other two dry region populations, Khairabad and Dorche (zone 4) was also observed in UPGMA (bootstrap = 85%) and partially supported by PCO. Sorkhabad, the mountain population was almost identical to the populations from the Caspian coastal plain (zone 2) in both analyses. Both analyses resulted in strong separation of the Astaneh population, which was divergent from all other populations (UPGMA; bootstrap = 100 %).
Isolation of insect populations by distance or physical barriers has been shown in several studies (Salvato et al. 2002; Kerdelhue et al. 2006; Clark et al. 2007). Spatial distribution of organisms may prevent genetic differentiation of populations e.g. by massive gene flow between populations (Slatkin 1987). When suitable habitat connects distant sites, Drosophila parasitoids may be able to disperse over long distances. Barriers of unsuitable habitat or limited dispersal capabilities of parasitoids may hamper gene flow and cause the formation of divergent populations. Parasitized fruit flies may be transported with fruits and give rise to populations dissimilar from the neighbouring ones, in particular in urban areas. We found unexpected genetic divergence in two northern populations Astaneh (which was highly divergent from the neighbouring) and Nour (which showed intermediate structure between tow Caspian Coast zones). Both populations originated from urban areas and could have arrived with fruit transports.
Apart from these exceptions, our results demonstrate a highly positive correlation between genetic and geographic distance, which explained a large part of the genetic variation among populations in this study. To our knowledge studies on the genetic structure of Drosophila parasitoid populations are rare. A comparison of L. clavipes populations in western Europe found distinct genetic differentiation between sexual and asexual populations, but no correlation between geographic and genetic distances (Pannebakker et al. 2004). The positive correlation between genetic and geographic distances in our study is consistent with several other genetic structure studies on insect populations (Salvato et al. 2002; Kerdelhue et al. 2006; Clark et al. 2007).
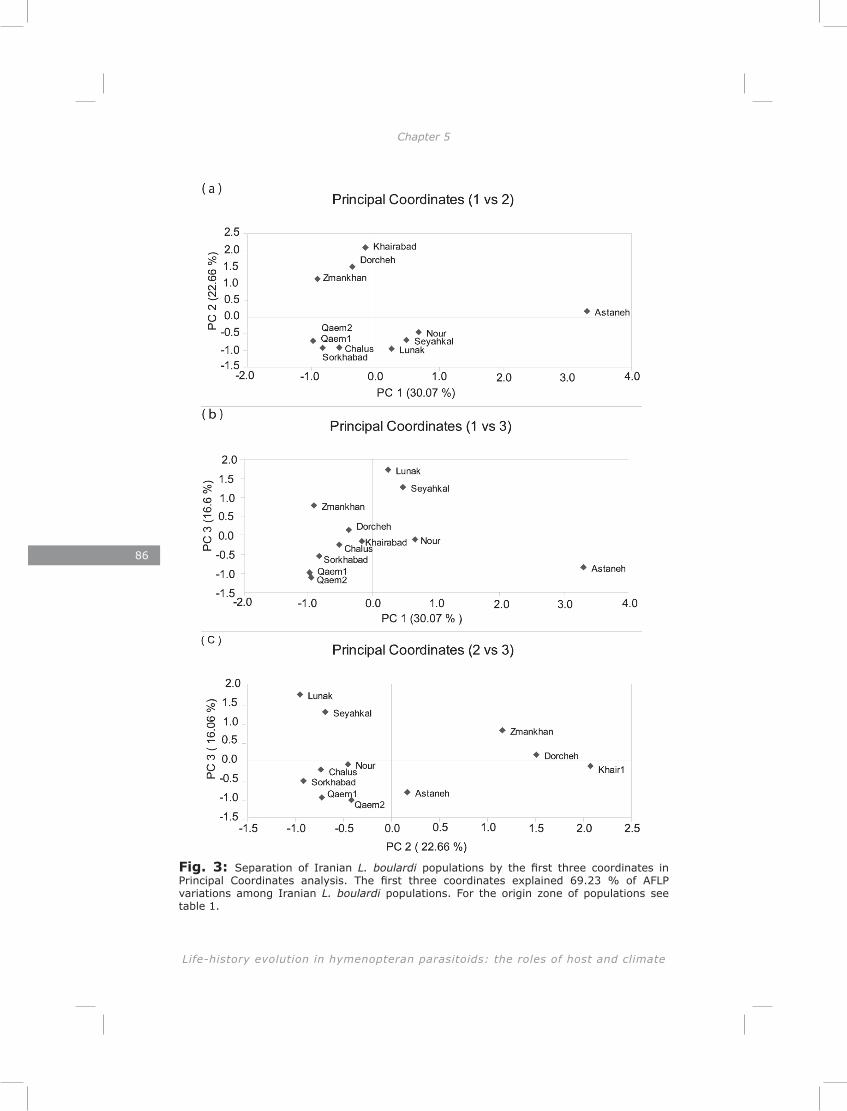
86
Life-history evolution in hymenopteran parasitoids: the roles of host and climate
Chapter 5 Genetic structure of Leptopilina boulardi populations from different climatic zones of Iran
The high genetic divergence over relatively short geographic distance between central populations than northern populations implies the role of a geographic barrier formed by unsuitable habitat (dry desert). Populations in the central part of Iran are from isolated locations surrounded by dry desert.
Sequence data on the cytochrome oxidase I gene were less informative in our study than ALFPs. Mitochondrial markers are potentially informative markers in genetic studies of insect populations (Crozier et al.1997; Olav et al. 2003; Smith 2005), sensitive to differences in the rates of male and female migration (Olav et al. 2003). However, most studies using CO I and II as molecular markers in insects have used them in phylogenetic and taxonomic contexts to discriminate between higher taxa than populations (Lunt et al. 1996; Caterino and Sperling 1999; Zaldivar-Riverón et al. 2006). Our results demonstrate a highly conserved pattern for COI among L. boulardi populations, as expected for sexually reproducing populations.
Our study adds to the evidence that AFLPs are convenient markers to study genetic diversity of populations within species (Yan et al., 1999; Sharbel et al., 2000; Schneider at al., 2002; Alamalakala et al., 2009) and can be used successfully for population genetic studies on hymenopteran parasitoids (e.g. Schneider et al. 2002; Pannebakker et al. 2004; Samara et al. 2008).
Fig. 3: Separation of Iranian L. boulardi populations by the first three coordinates in Principal Coordinates analysis. The first three coordinates explained 69.23 % of AFLP variations among Iranian L. boulardi populations. For the origin zone of populations see table 1.
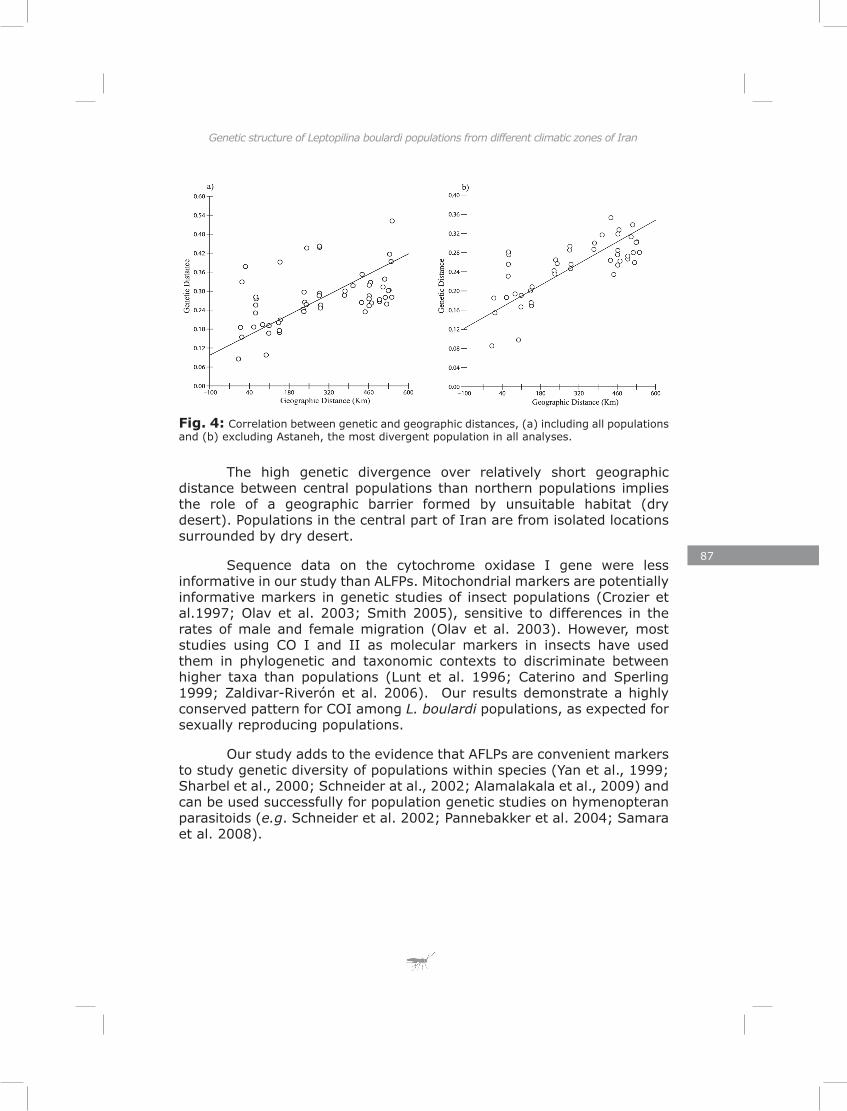
87
Genetic structure of Leptopilina boulardi populations from different climatic zones of Iran
The high genetic divergence over relatively short geographic distance between central populations than northern populations implies the role of a geographic barrier formed by unsuitable habitat (dry desert). Populations in the central part of Iran are from isolated locations surrounded by dry desert.
Sequence data on the cytochrome oxidase I gene were less informative in our study than ALFPs. Mitochondrial markers are potentially informative markers in genetic studies of insect populations (Crozier et al.1997; Olav et al. 2003; Smith 2005), sensitive to differences in the rates of male and female migration (Olav et al. 2003). However, most studies using CO I and II as molecular markers in insects have used them in phylogenetic and taxonomic contexts to discriminate between higher taxa than populations (Lunt et al. 1996; Caterino and Sperling 1999; Zaldivar-Riverón et al. 2006). Our results demonstrate a highly conserved pattern for COI among L. boulardi populations, as expected for sexually reproducing populations.
Our study adds to the evidence that AFLPs are convenient markers to study genetic diversity of populations within species (Yan et al., 1999; Sharbel et al., 2000; Schneider at al., 2002; Alamalakala et al., 2009) and can be used successfully for population genetic studies on hymenopteran parasitoids (e.g. Schneider et al. 2002; Pannebakker et al. 2004; Samara et al. 2008).
Fig. 4: Correlation between genetic and geographic distances, (a) including all populations and (b) excluding Astaneh, the most divergent population in all analyses.

89
C h a p t e r 6
Local adaptation in life history traits of Leptopilina boulardi populations from different climate zones of Iran
Abstract
Populations of parasitoids may vary in key life history traits due to differences in selection regimes that have resulted in local adaptation. Climate is one source of selection that may affect life history traits of pa-rasitoids. We compared eleven populations of Leptopilina boulardi origina-ting from different climatic zones in Iran to assess the effect of climate on several life history traits. We checked for Wolbachia infection and for phy-logenetic autocorrelation of the life history traits, which might interfere with climate-induced patterns. None of the populations was infected with Wolbachia. Only egg-size showed evidence for phylogenetic non-indepen-dence. Measures for energy reserves (lipid, glycogen and sugar contents), as well as initial reproductive effort (egg load) showed significant diver-gence between climatic zones. Of the various factors that define climatic zones, two were especially powerful in explaining life history variation. These were the number of frost days per year and the number of rainy days per year. Lipid reserves were positively correlated with the number of rainy days per year, with the highest lipid contents found in very wet and mild climate, intermediate ones in dry regions with cold winters and low lipid reserves in temperate areas. Both glycogen and sugar reserves showed negative correlations with the number of frost days per year. The lowest glycogen and sugar reserves were found in regions that were extremely cold during winter and the highest glycogen and sugar were found in humid temperate regions with mild winters. Glycogen, thus, also showed a positive correlation with precipitation. The highest egg loads were observed in regions with only cold winters (and hot dry summers), while the lowest egg loads were observed in temperate areas with mild winters. Egg size did not correlate with any climatic factor. A trade-off between reproductive effort (egg load) and glycogen reserves is sugge-sted by the negative correlation between the two. A positive phenotypic
90
Life-history evolution in hymenopteran parasitoids: the roles of host and climate
Chapter 6 Local adaptation in life history traits of Leptopilina boulardi
correlation was found between egg load and lipid contents. We conclude that life history traits of parasitoid insects evolve quickly in response to climate, with the apparent exception of egg size.
Introduction
Local adaption in life history traits can occur through genetic change in response to local geographical selection pressures. Natural selection results in genetic change if phenotypic variation in a fitness-related trait is heritable (Endler, 1986). Different biotic and abiotic factors, such as the spatial and temporal distribution of resources, interactions with other species, or climate and geographical barriers may contribute to selection and divergence of geographically isolated populations (Schluter, 2001). Parasitoids are insect that lay their egg on or inside the body of pre-imaginal stages of other insects (eggs, larvae or pupae) and complete their development by consuming the host tissue and killing their host (Godfray 1994, Quicke 1997). The strong dependence of immature parasitoids on their hosts, and the arms race between parasitoids and hosts make parasitoids an interesting model system to study different aspects of ecology and evolution (Godfray and Shimada 1999).
Several recent studies consider the effects of climate on life history traits (e.g., Stenseth and Mysterud, 2002, Stenseth et al. 2002; Winkler et al. 2002; Stenseth and Mysterud, 2005). Apart from the fact that parasitoid life histories may be under direct selection by climate factors, host abundance and the spatial and temporal distribution of hosts are also important sources of selection on key life history traits in parasitoids (Ellers et al. 2000b). Host abundance and distribution are highly dependent on temperature and precipitation, and thus depend on climate (Ellers et al. 2000b; Ellers and Jervis 2003). Hence, climate may affect life history traits of parasitoids directly or indirectly (i.e., by changing host distribution pattern). Variation in host distribution patterns has been linked to intraspecific variation in foraging traits of several parasitoids, including Cotesia glomerata (Vos and Vet, 2004), Asobara tabida (Kraaijeveld & van der Wel, 1994; Kraaijeveld et al., 1995), and Leptopilina boulardi (Dubuffet et al., 2006). Hoffman et al. (2007) showed antagonistic selection between thorax and wing size in Drosophila melanogaster which resulted from resource distribution patterns. Populations that need to travel long distances between resource patches were selected for longer wings and shorter thorax than sedentary populations.
Differences in selection regimes due to variation in climate, have also been shown to play an important role in shaping life history traits of many other organisms. The effect of climate on life history traits is dictated by relative strength of natural selection and gene flow (Endler 1986). A wide range of climatic factors including temperature, precipitation, light
91
Local adaptation in life history traits of Leptopilina boulardi
regime and seasonal length may all shape life history traits. Of these, temperature is generally regarded as the most influential factor in insect life history traits (Johnston and Benneth, 1996; Dahlgaard et al. 2001; Clarke, 2006). Insect life history traits may respond to temperature variation by phenotypic plasticity. Examples include the metabolic rate of a cricket, Cratomelus armatus (Nespolo et al. 2007), the number of eggs in the butterfly Bicyclus anynana (Steigenga and Fischer 2007) and fat and protein content of the butterfly Lycaena tityrus (Karl and Fischer, 2008). Inverse relationships between body size (Bazzocchi at al. 2003; Karl and Fishcher, 2008), longevity (Nilssen 1997; Dhileepan at al., 2005; Colinet at al. 2007) and egg size (Fischer et al. 2003) with temperature have also been documented for insects. In addition to phenotypic plasticity, variation in temperature may also result in local adaptation of insect populations. This may contribute to population differentiation and speciation. Ohtsu et al. (1999) studied life history trait adaptation of six different Drosophila species from three different climate zones, sampling two species from within each zone. The species varied in cold resistance and showed differences in the ratio of saturated to unsaturated fatty acids, and also differences in the composition and quality of unsaturated fatty acids in the cold tolerant species (Ohtsu e al. 1999). While we are still a long way from understanding the biochemical mechanism of cold tolerance in insects, some studies have shown that cold-tolerant populations show different energy reserve strategies compared to less tolerant populations. Often, these populations accumulate cryoprotectants such as glycerol, sorbitol, inositol or trehalose which provide colligative resistance against freezing (Lee et al. 1987; Masahiko, 2001). A comparative study of different populations of D. buzzatii collected along an altitudinal gradient with large climate variation revealed thermal adaptation in heat resistance, desiccation resistance and Hsp70 gene expression (Sørensen et al. 2005).
Other climate factors have also been shown to affect life history traits of insects. In an experiment investigating the effect of photoperiod on the phenotypic plasticity of life history traits of Drosophila melanogaster, a prolonged day/night cycle resulted in prolongation of developmental time on pupae and longer lifespan in male flies (Vaiserman et al 2008). Furthermore, humidity and precipitation have been reported to affect life history patterns of insects. In the hymenopteran parasitoid Anisopteromalus calandrae increased humidity resulted in significantly decreased developmental time and increased population growth rate (Smith, 1993). In Drosophila melanogaster, increased humidity resulted in increased survival of both eggs and pupae (Al-Saffar, et al. 1995).
The effect of single climate factors, as measured in the laboratory, cannot easily be used to predict changes in life history patterns of organisms in nature because of interactions between different climate factors.
92
Life-history evolution in hymenopteran parasitoids: the roles of host and climate
Chapter 6 Local adaptation in life history traits of Leptopilina boulardi
Comparing life history traits of populations of organisms originating from different climatic regions, (e.g. clinal variation studies; Sørensen et al. 2005), can provide more information how climate affects life history, but does not easily allow one to disentangle the effects of the different climatic factors on particular life-history traits. Local adaptation in life history in response to climate has been demonstrated in several insect species. For example, individuals of the antlion, Myrmeleon hyalinus originating from a Mediterranean climate showed significant differences in body size and life span compared to those originating from a desert population (Schraf et al. 2008). D. buzzatii populations from highlands showed heritable differences in activity pattern from those of populations from lowland sites (Dahlgaard et al. 2001). Allele frequencies of genes that are potentially important for adaptation to environmental stress were shown to exhibit clinal variation (Bettencourt et al., 2002; Frydenberg et al., 2003). Most clinal variation studies revealed variation between populations over broad geographical scales. Latitudinal clines have less often been studied but may show similar patterns: Griffiths et al. (2005) showed an increase in starvation resistance with increasing latitude along a narrow geographical cline for Drosophila birchii populations from rainforests in Queensland, Australia (Griffiths et al. 2005). Variation in trade-offs between different life history traits (e.g., between reproductive and survival related traits; Roff, 1992) may also show clinal patterns. An example of clinal variation of two traits resulting in a trade-off relationship was observed for D. buzzatii where an increase in early reproduction with altitude was accompanied by shorter life span (Norry et al. 2006).
Here we tested the prediction that climate variation can result in adaptive differences in resource allocation of parasitoid populations. We measured life history traits of 11 populations of Leptopilina boulardi originating from five contrasting climate zones in the Islamic republic of Iran. Field sampling was conducted along a cline from very wet rain forest in the north to dry and hot desert in the centre of the country. In an earlier study we described the genetic structure of these populations (Chapter 4). We showed genetic differences between some of the local populations, indicating the potential for local adaptation to climate.
Material and methods
Parasitoids populations
We used 11 population of Leptopilina boulardi from five climatic zones of Iran (Table 1). The five different climate zones can be described briefly as follow: Zone 1: mountains with low vegetation along the valleys. A relatively dry climate with a long and cold winter. Most precipitation occurs as snow in winter. Zone 2: forest along the temperate Caspian coastal plain. A mild climate with high precipitation which is uniformly

93
Local adaptation in life history traits of Leptopilina boulardi
distributed over the year. Winters are mild, with few freezing days, and periods of drought seldom occur. Zone 3: a very wet and cold region on the Caspian coast. It has a climate with the highest precipitation and cold winters with substantial snow and many freezing days. Most part of this region is covered with high dense deciduous forest and some rice fields. Zone 4: a dry region where vegetation is mostly limited to cultivated areas and orchards. It has dry and hot summers while the winters are cold and long with a high number of freezing days. This climate has the lowest precipitation of Iran. The variation in temperature between day and night is large in this region. Zone 5: a Mediterranean type climate in which most of the vegetation is limited to orchards and with some natural vegetation along the river. Summers are relatively dry, but there is substantial snow in winter. The amplitude in temperature (differences in day and night temperature) is also high in this climate.
The genetic structure of these populations has been characterized in a previous study (Chapter 4). The populations from the Caspian Sea coast were sampled from rain forests, except the ones from Astaneh and Nour. The Sorkhabad population originated from a mountain region and was collected on the northern slope of Damavand along a river which leads to forest in Mzandaran province near the Caspian Sea coast. Popu-lations from the semi dry and Mediterranean region of central Iran were all collected along the Zayandehrod river between Esfahan and Shahre-kord. All samples were collected in July 2006 and subsequently cultured on Drosophila melanogaster in our lab at 25 ± 1ºC and 16/8 h day/night regime.
Test for Wolbachia infection
All Iranian Leptopilina boulardi populations were checked for Wol-bachia infection by amplifying the Wolbachia-specific wsp gene using for-ward primer wsp81F, 5´-TGG TCC AAT AAG TGA TGA AGA AAC-3´ and reverse primer wsp691R, 5´-AAA AAT TAA ACG CTA CTC CA-3´ (Braig et al. 1998, Zhou et al. 1998). DNA was extracted from a single female wasp randomly chosen from the each strain using the DNeasy Blood & Tissue Kit (Qiagen, Valencia, California, U.S.A.). A DNA sample of Wolbachia-in-fected Asobara japonica was included as a positive control in all series of amplification. The PCR amplification was performed in a final volume of 20µl containing 1.0 μl DNA template, 2.0 μl 10x PCR-buffer , 0.25 mM of each dNTP, 0.25 μM each primer, 1.0 U of Taq polymerase; all Qiagen’s products. The amplification was carried out on an MJ DNA Engine PTC-200 (BioRad, Mississaugua) with the following thermal cycles: 3 min at 94 ºC, then 35 cycles of 1 min at 94 ºC, 1 min at 55 ºC and 1 min at 72 ºC, ending with 5 min at 72 ºC. To visualize any possible amplified band a volume of 4µl of the PCR product were loaded and run on a 1 % agarose gel and stained with ethidum bromide.

94
Life-history evolution in hymenopteran parasitoids: the roles of host and climate
Chapter 6 Local adaptation in life history traits of Leptopilina boulardi
Tab
le 1
: Th
e or
igin
and
clim
ate
zone
des
crip
tion
of
11 p
opul
atio
n of
Ira
nian
Lep
topi
lina
boul
ardi
.
Zon
eD
escr
iption
Loca
tion
Elev
atio
n
(m)
Prec
ip.
mm
&
days
/yea
rAve
. RH
Dai
ly
tem
p.M
ax.
Tem
pM
in.
Tem
pFr
eezi
ng d
ay
/ ye
ar
1Col
d m
ount
ain
Sor
khab
ad
(Mou
ntai
n)19
7528
2 m
m
70 d
ays
518.
816
.41.
216
0
2Te
mpe
rate
coa
stal
Cas
pian
sea
Qae
msh
ahr
1
fore
st76
898
mm
106
days
8217
20.8
13.1
7.5
2Te
mpe
rate
coa
stal
Cas
pian
sea
Qae
msh
ahr
2
fore
st75
““
““
““
2Te
mpe
rate
coa
stal
Cas
pian
sea
Nou
r
recr
eation
par
k20
““
““
““
2Te
mpe
rate
coa
stal
Cas
pian
sea
Cha
lus
fore
st76
““
““
““
3Ve
ry w
et c
oast
al
Cas
pian
sea
Ast
aneh
rice
fiel
d 8.
513
59 m
m
138
days
8215
.920
.611
.324
.9
3Ve
ry w
et c
oast
al
Cas
pian
sea
Luna
k
mou
ntai
n fo
rest
485
““
““
““
3Ve
ry w
et c
oast
al
Cas
pian
sea
Sey
ahka
l mou
ntai
n fo
rest
378
““
““
““
4D
ry a
nd h
otw
ith
cold
win
ter
Kha
irab
ad (
bush
es
and
tree
)16
0512
2.8
mm
44.5
day
s40
16.2
24.5
9.1
73
4D
ry a
nd h
otw
ith
cold
win
ter
Dor
cheh
(bu
shes
and
tr
ee)
1625
““
““
““
5M
editer
rane
an w
ith
very
col
d w
inte
rZam
ankh
an (
bush
es
and
tree
)18
7331
7 m
m
54 d
ays
4611
.820
.23.
512
4
95
Local adaptation in life history traits of Leptopilina boulardi
Test for phylogenetic independence
Closely related populations may resemble each other in life history traits because of their shared ancestry, rather than because of local adaptation (Harvey & Pagel 1991). We assessed whether closely related populations were more similar than distantly related ones for the traits we measured using the test for serial independence (TFSI) as implemented in the software Phylogenetic Independence version 2.0 (Reeve and Abouheif 2003). TSFI is a parametric test to detect self-similarity among the adjacent observations and reveal phylogenetic autocorrelation (Abouheif 1999). To apply TFSI we used a phylogenetic tree based on AFLP genotypes for these populations (see chapter 4). The average value for each trait was calculated for each population and placed at the tips of the phylogenetic tree. These values were then randomly reshuffled 1000 times. The observed topology of trait values was then compared to the generated distribution of random topologies. We report the P-values representing the likelihood that the observed topology could have arisen by chance, i.e. in the absence of phylogenetic autocorrelation.
Life history trait measurements
Collecting individual samples
All life history traits were measured on virgin female wasps harvested from the lab cultures within five hours of eclosion. We used 25 individuals from each location, except for the two climatic zones 1 & 5 (Sorkhabad and Zamankhan) with only one sampling point. In the latter case we used 40 individuals. Wasps were chosen randomly from 10 rearing jars, isolated and stored at -80ºC to halt all metabolic processes until further analysis. All measurements were taken for each individual. A photometric method was used to measure the egg load and egg size and the same dissected bodies were used for energy reserve measurements.
Egg load and egg size
Wasps were dissected on a cover glass and the ovarioles transferred to a small drop of demineralised water. The ovarioles were then opened and the eggs separated until they did not overlap (Ellers 1996). Two digital photographs were taken from each dissection, one containing all eggs to count the number of eggs (egg load) and the other from a randomly chosen group of 20 eggs together with a scale (to measure egg size). In all populations hardly any immature eggs were found. We decided therefore to classify all eggs as being mature. Egg size was calculated by
96
Life-history evolution in hymenopteran parasitoids: the roles of host and climate
Chapter 6 Local adaptation in life history traits of Leptopilina boulardi
measuring the average area of 20 eggs per individual relative to the scale using Image-J image analysis software (Rasband, 1997-2005). The cover glass containing the whole body including ovarioles and eggs was washed into an eppendorf tube for further analysis (see below).
Lipid, sugar and glycogen analysis
To measure the lipid, glycogen and sugar contents of each individual we adopted a colorimetric analysis protocol (van Handel 1985a, b; van Handel and Day 1988). After dissection of the ovaries (see above) the wasps (including eggs) were individually washed in eppendorf tubes containing 80 µl of 2% sodium sulfate solution and grinded in the solution by a plastic pestle. 600 µl choloroform-methanol (1:2) was then added to tubes after which they were stored overnight at 4ºC. The next day, the tubes were vortexed for one minute and centrifuged for 15 minute at 1400 rpm. The supernatant was divided into two parts of 300 µl each in separated tubes. These were used for lipid and sugar assays respectively and the precipitant was used for the glycogen assay.
Lipid assay
The first series of tubes with 300 µl of supernatant was put on an aluminum heat block at 90 ºC under a fume hood until the solution had evaporated completely. Then 40 µl of 98% sulphuric acid was added to the tubes which were then heated for 2 minutes at 90 ºC and subsequently cooled down on ice. A volume of 960 µl of Vanillin reagent (premixed: 300mg vanillin, 200ml phosphoric acid 85% and 50ml distilled water) was added to the tubes and they were left for 15 minute at ambient temperature. The absorbance was read at 525 nm by a spectrophotometer (Unicam UV 1, Unicam Ltd, Cambridge, UK).
Sugar
The second series of tubes with 300 µl of supernatant were evaporated at ambient temperature using a Speed Vac plus SC110A (Fisher Scientific Bioblock, Illkirch, France). The samples were watched to avoid complete evaporation. A volume of 1 ml of Anthorone reagent (premixed: 125mg Anthrone, 63 ml sulphuric acid 98% and 25ml water) was added to the tubes, which were then put at 90 ºC for 10 minutes. After cooling on ice, the absorbances of the sample were read at 960 nm in a spectrophotometer (Unicam UV 1).
Glycogen
To each tube containing precipitant 400 µl of 80% methanol was added. These were mixed by vortexing for one minute and centrifuged for 5 minutes at 1400 rpm. The supernatant was discarded to eliminate
97
Local adaptation in life history traits of Leptopilina boulardi
the sugar trace from the samples. One ml Anthrone reagent was added to each tube, which were then incubated at 90 ºC for 15 minutes and cooled down on ice. To eliminate protein fragments from the solution they were filtered through a membrane (PVDF 0.45µm; Millipore). The absorbance of the samples was read at 625 nm in a spectrophotometer (Unicam UV 1). As a control a blank tube without wasp was added to each set of samples and in each trial the absorbance of the blank was set at zero to correct the possible change in the strength of reagent over time. Reagents were stored at 4 ºC and they were refreshed every three days during the course of the experiment. The amounts of lipid, sugar or glycogen were calculated using the calibration curve made for each assay by measuring a serial dilution soybean (for lipid) or glucose (for sugar and glycogen).
Statistic analysis
All measurements of energy reserves (lipid, sugar and glycogen) and investment in reproduction (egg load and egg size) were compared between populations using analysis of covariance (ANCOVA) in which tibia length was added as a covariate to represent body size. We calculated egg mass as the number of eggs at eclosion times the egg size and used this value as total reproductive effort and to calculate total energy reserves we added the weights of lipids glycogen and sugars. In each case we searched for the minimum adequate model by starting with the maximal model, then dropping the interaction term and then main factors from the model if non-significant. The simpler model was compared to the more complex model using an F-test. Traits were compared between populations using post-hoc t-tests. For visualizing the size-corrected results in graphs we plotted residuals of the linear model of each trait against tibia size. To investigate possible trade-off between reproductive effort and stored energy within populations first we corrected all traits for tibia length and then tested correlations between egg load and related traits in linear models. If correlations were found to be significant we then examined both classical (rc) and robust (rr) Pearson correlations using the R package Mvoutlier (Gschwandtner and Filzmoser 2007). Robust correlation ignores outliers. The effect of climatic factor on life history traits was studied using linear models. All statistical analyses were conducted in the free statistical software R 2.5.1 (Ihaka & Gentleman, 1996).
Results
Wolbachia infection
No bands were observed on the agarose gels containing the PCR products of the wsp gene except in positive control. Therefore all 11 populations of Leptopilina boulardi were free of Wolbachia.
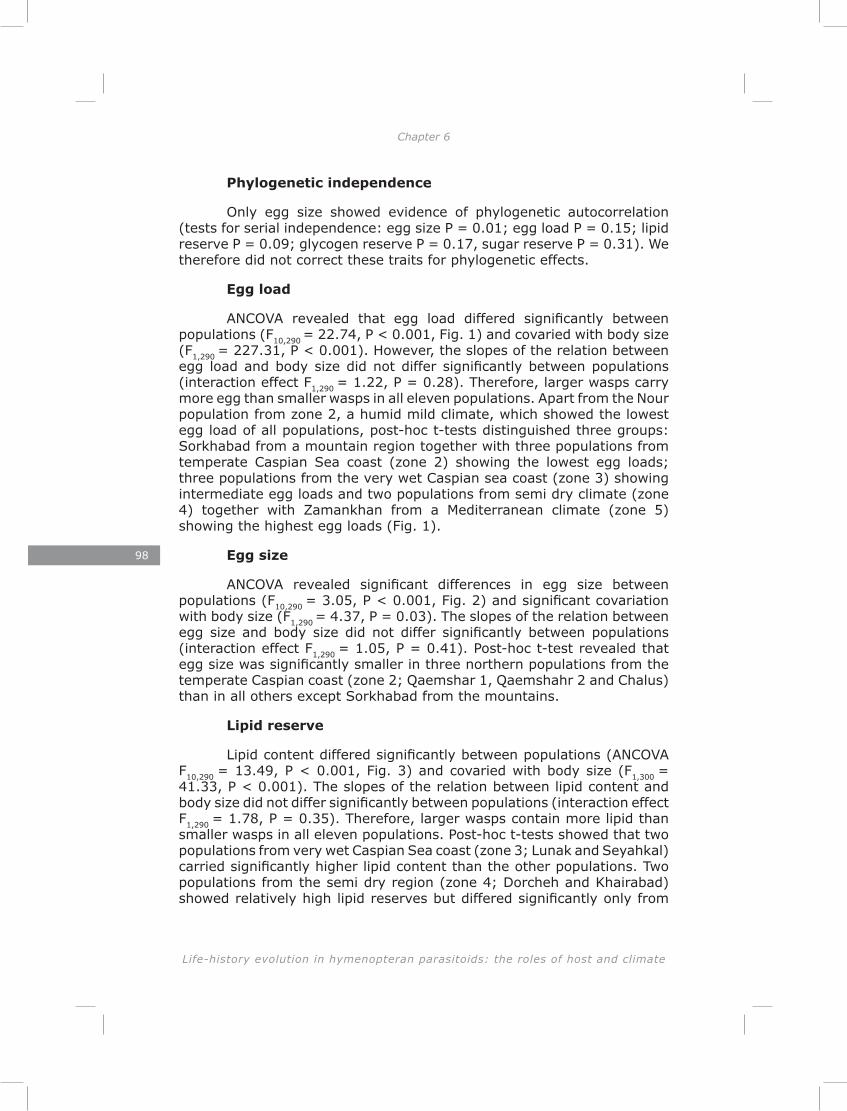
98
Life-history evolution in hymenopteran parasitoids: the roles of host and climate
Chapter 6 Local adaptation in life history traits of Leptopilina boulardi
Phylogenetic independence
Only egg size showed evidence of phylogenetic autocorrelation (tests for serial independence: egg size P = 0.01; egg load P = 0.15; lipid reserve P = 0.09; glycogen reserve P = 0.17, sugar reserve P = 0.31). We therefore did not correct these traits for phylogenetic effects.
Egg load
ANCOVA revealed that egg load differed significantly between populations (F10,290
= 22.74, P < 0.001, Fig. 1) and covaried with body size (F1,290
= 227.31, P < 0.001). However, the slopes of the relation between egg load and body size did not differ significantly between populations (interaction effect F1,290
= 1.22, P = 0.28). Therefore, larger wasps carry more egg than smaller wasps in all eleven populations. Apart from the Nour population from zone 2, a humid mild climate, which showed the lowest egg load of all populations, post-hoc t-tests distinguished three groups: Sorkhabad from a mountain region together with three populations from temperate Caspian Sea coast (zone 2) showing the lowest egg loads; three populations from the very wet Caspian sea coast (zone 3) showing intermediate egg loads and two populations from semi dry climate (zone 4) together with Zamankhan from a Mediterranean climate (zone 5) showing the highest egg loads (Fig. 1).
Egg size
ANCOVA revealed significant differences in egg size between populations (F10,290
= 3.05, P < 0.001, Fig. 2) and significant covariation with body size (F1,290
= 4.37, P = 0.03). The slopes of the relation between egg size and body size did not differ significantly between populations (interaction effect F1,290
= 1.05, P = 0.41). Post-hoc t-test revealed that egg size was significantly smaller in three northern populations from the temperate Caspian coast (zone 2; Qaemshar 1, Qaemshahr 2 and Chalus) than in all others except Sorkhabad from the mountains.
Lipid reserve
Lipid content differed significantly between populations (ANCOVA F10,290
= 13.49, P < 0.001, Fig. 3) and covaried with body size (F1,300 =
41.33, P < 0.001). The slopes of the relation between lipid content and body size did not differ significantly between populations (interaction effect F1,290
= 1.78, P = 0.35). Therefore, larger wasps contain more lipid than smaller wasps in all eleven populations. Post-hoc t-tests showed that two populations from very wet Caspian Sea coast (zone 3; Lunak and Seyahkal) carried significantly higher lipid content than the other populations. Two populations from the semi dry region (zone 4; Dorcheh and Khairabad) showed relatively high lipid reserves but differed significantly only from
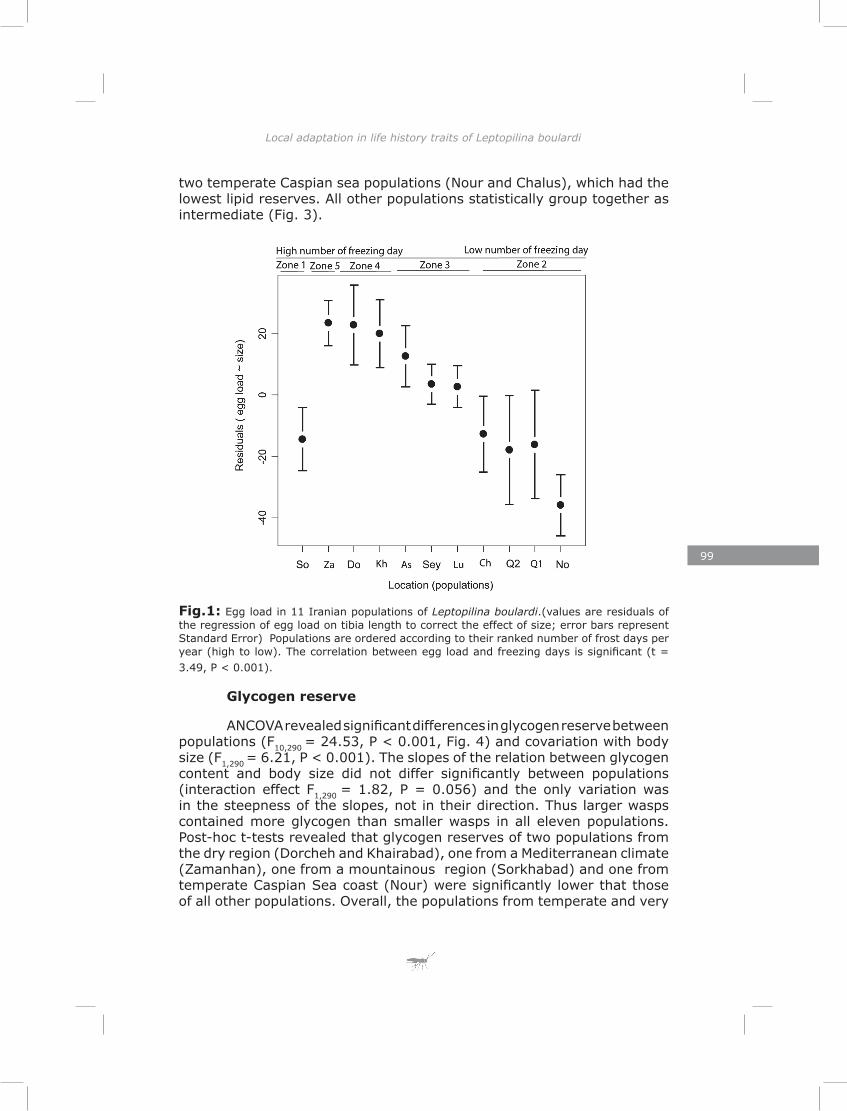
99
Local adaptation in life history traits of Leptopilina boulardi
two temperate Caspian sea populations (Nour and Chalus), which had the lowest lipid reserves. All other populations statistically group together as intermediate (Fig. 3).
Glycogen reserve
ANCOVA revealed significant differences in glycogen reserve between populations (F10,290
= 24.53, P < 0.001, Fig. 4) and covariation with body size (F1,290
= 6.21, P < 0.001). The slopes of the relation between glycogen content and body size did not differ significantly between populations (interaction effect F1,290
= 1.82, P = 0.056) and the only variation was in the steepness of the slopes, not in their direction. Thus larger wasps contained more glycogen than smaller wasps in all eleven populations. Post-hoc t-tests revealed that glycogen reserves of two populations from the dry region (Dorcheh and Khairabad), one from a Mediterranean climate (Zamanhan), one from a mountainous region (Sorkhabad) and one from temperate Caspian Sea coast (Nour) were significantly lower that those of all other populations. Overall, the populations from temperate and very
Fig.1: Egg load in 11 Iranian populations of Leptopilina boulardi.(values are residuals of the regression of egg load on tibia length to correct the effect of size; error bars represent Standard Error) Populations are ordered according to their ranked number of frost days per year (high to low). The correlation between egg load and freezing days is significant (t = 3.49, P < 0.001).
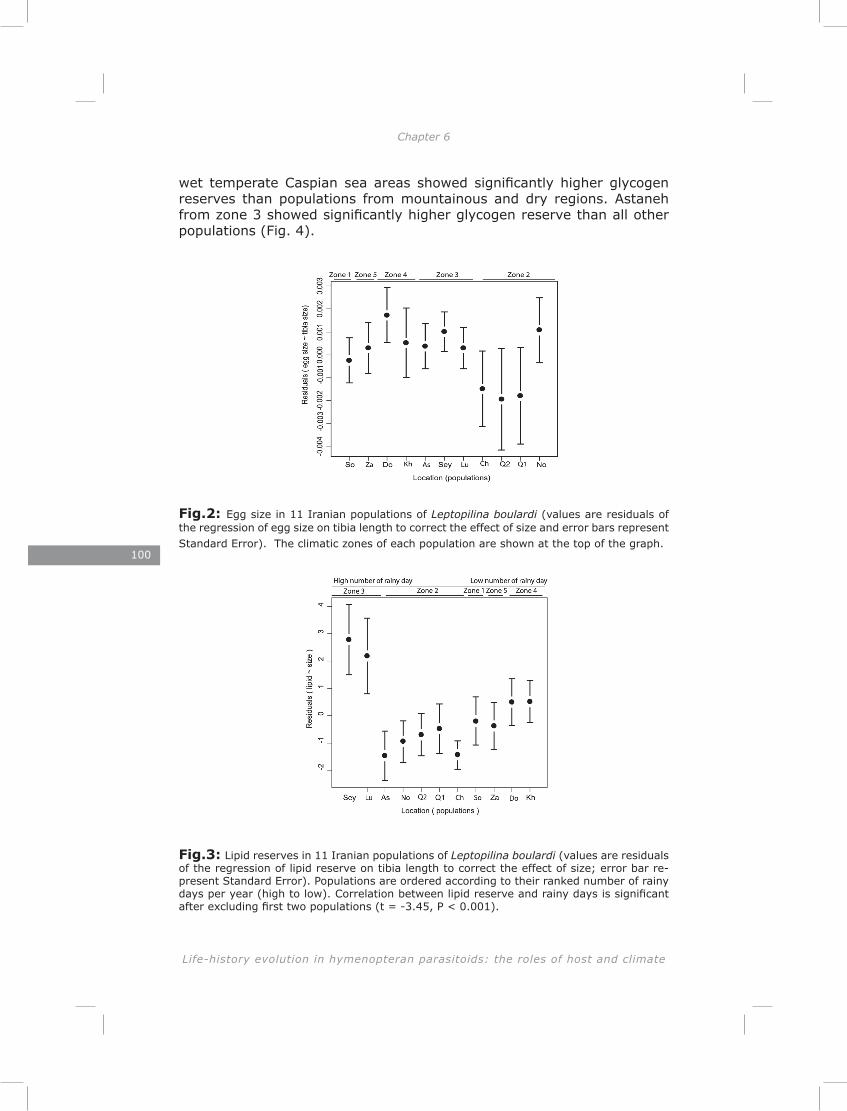
100
Life-history evolution in hymenopteran parasitoids: the roles of host and climate
Chapter 6 Local adaptation in life history traits of Leptopilina boulardi
wet temperate Caspian sea areas showed significantly higher glycogen reserves than populations from mountainous and dry regions. Astaneh from zone 3 showed significantly higher glycogen reserve than all other populations (Fig. 4).
Fig.2: Egg size in 11 Iranian populations of Leptopilina boulardi (values are residuals of the regression of egg size on tibia length to correct the effect of size and error bars represent Standard Error). The climatic zones of each population are shown at the top of the graph.
Fig.3: Lipid reserves in 11 Iranian populations of Leptopilina boulardi (values are residuals of the regression of lipid reserve on tibia length to correct the effect of size; error bar re-present Standard Error). Populations are ordered according to their ranked number of rainy days per year (high to low). Correlation between lipid reserve and rainy days is significant after excluding first two populations (t = -3.45, P < 0.001).
Fig.4: Glycogen reserves in 11 Iranian population of Leptopilina boulardi (values are residuals of the regression of glycogen reserve on tibia length to correct the effect of size and error bars represent Standard Error). Populations are ordered according to their ranked number of frost days per year (left panel: high to low) and their ranked number of rainy days per year (right panel: high to low). Both correlations between glycogen reserve and freezing days and rainy days per year are significant (Freezing days; t = - 8.17, P < 0.001, rainy days; t = 9.66, P < 0.001).
Fig.5: Sugar reserves in 11 Iranian populations of Leptopilina boulardi (values are residuals of the regression of sugar reserve on tibia length to correct the effect of size and error bars represent Standard Error). Populations are ordered according to their ranked number of frost days per year (high to low). The correlation between sugar reserve and freezing days is significant (t = -3.77, P < 0.001).
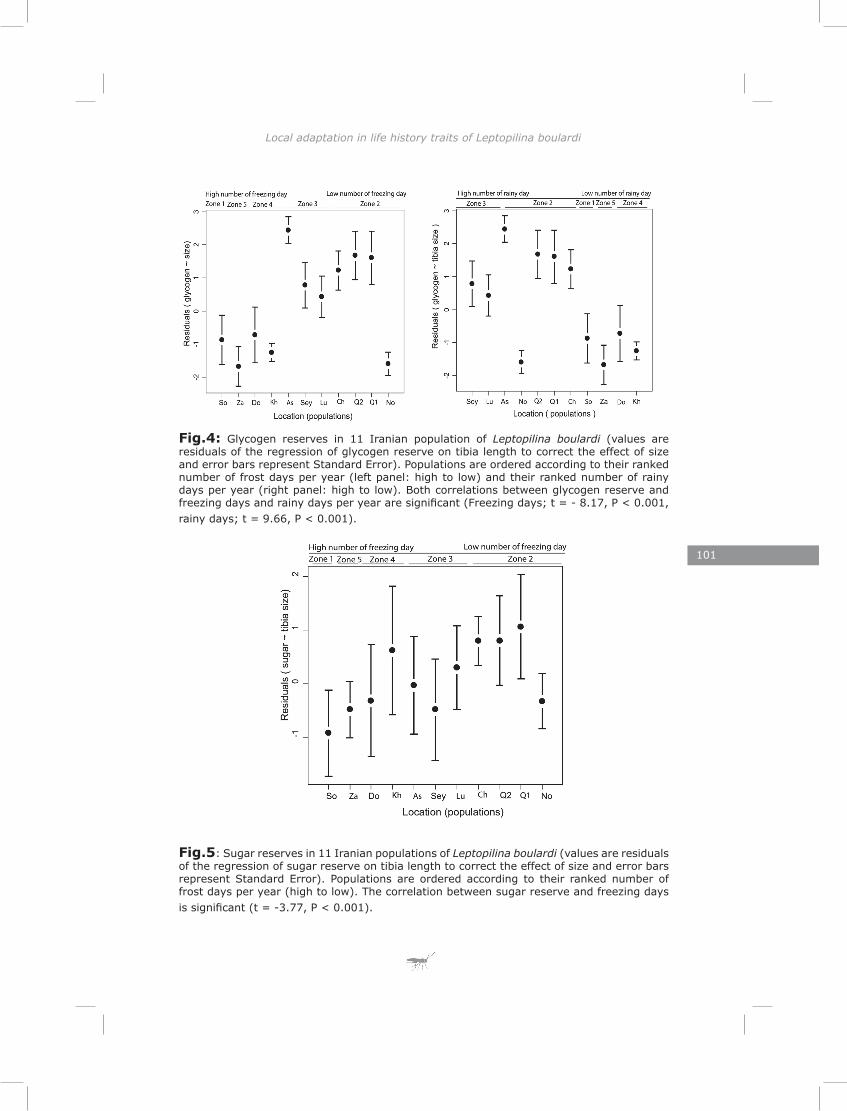
101
Local adaptation in life history traits of Leptopilina boulardi
Fig.4: Glycogen reserves in 11 Iranian population of Leptopilina boulardi (values are residuals of the regression of glycogen reserve on tibia length to correct the effect of size and error bars represent Standard Error). Populations are ordered according to their ranked number of frost days per year (left panel: high to low) and their ranked number of rainy days per year (right panel: high to low). Both correlations between glycogen reserve and freezing days and rainy days per year are significant (Freezing days; t = - 8.17, P < 0.001, rainy days; t = 9.66, P < 0.001).
Fig.5: Sugar reserves in 11 Iranian populations of Leptopilina boulardi (values are residuals of the regression of sugar reserve on tibia length to correct the effect of size and error bars represent Standard Error). Populations are ordered according to their ranked number of frost days per year (high to low). The correlation between sugar reserve and freezing days is significant (t = -3.77, P < 0.001).
102
Life-history evolution in hymenopteran parasitoids: the roles of host and climate
Chapter 6 Local adaptation in life history traits of Leptopilina boulardi
Sugar reserve
Sugar reserves differed significantly between populations (F10,290
= 5.94, P < 0.001, Fig. 5) and covaried with body size (F1,290 = 5.95, P
= 0.015). The slopes of the relation between sugar content and body size did not differ significantly between populations (interaction effect F1,290
= 1.08, P = 0.38). Therefore, larger wasps contained more sugar than smaller wasps in all populations. Post-hoc t-tests revealed higher sugar reserves for populations originating from two Caspian coastal zones in comparison with populations from drier regions including Sorkhabad from the mountains (Fig. 5). A slightly lower sugar reserve was also observed for two northern populations (Seyahkal and Lunak) from zone 3 in comparison with other northern populations, but these differences were only significant in one case (Fig. 5). One population from zone 2 (Nour) and one population from zone 3 (Astaneh) showed intermediate sugar reserves.
Interaction between climate and life history traits
We tested the effects of several climatic factors (average daily temperature, average maximum and minimum temperature, thermal amplitude, number of frost and rainy days per year) on life history traits. Two factors, the number of frost days per year and the number of rainy days per year showed significant correlations with certain life history traits. Egg load was correlated with the number of frost days (Fig. 1) and lipid reserves with the number of rainy days rainy days. For lipid reserve, two populations from the very wet Caspian coast showed a pattern different from the rest. Excluding these two populations yielded a significant negative correlation between the number of rainy day per year and lipid reserves (Fig. 3). Glycogen reserves were correlated with both the number of frost days and the number of rainy days per year (Fig. 4). Sugar reserves correlated with the number of frost days per year (Fig. 5).
Trade-off between energy reserves and reproductive effort
When all data from the 11 populations was pooled, lipid reserves correlated positively with egg loads (reproduction effort; r = 0.19, P < 0.001, Fig. 6). Glycogen was the only stored resource which showed a negative correlation with egg load (Glycogen; r = -0.16, P = 0.004, Fig. 6), suggesting a trade-off. A negative correlation between sugar reserves and egg load was not significant (r = -0.11, P = 0.06). These patterns were even stronger when analyzed using robust correlation (Fig 6, Glycogen; rr = -0.35, Lipid; rr = 0.3).
Egg mass and energy reserves
Both egg mass and energy reserves differed significantly among populations (ANCOVA egg mass; F10,290
= 8.57, P < 0.001, energy reserve; F10,290
= 13.31, P < 0.001 Fig. 7) and covaried with body size (egg mass; F1,300
= 70.35, P < 0.001; energy reserve; F1,300 = 35.29, P < 0.001 ).
The slopes of the relation between either egg mass or energy reserve and body size did not differ significantly between populations (interaction effect, egg mass; F1,290
= 0.68, P = 0.74, energy reserve; F1,290 = 1.47, P
= 0.14 ). Therefore, larger wasps contain more or larger eggs and more energy than smaller wasps in all eleven populations. Post-hoc t-tests showed that all populations from the temperate Caspian Sea coast (zone 2) together with the mountain population, Sorkhabad, had significantly lower egg masses than other populations. The wet coastal Caspian populations (zone 3) had intermediate egg masses and populations from dry zones (zones 4 and 5) had the highest egg masses but the values were not significantly higher than for those of the wet coastal Caspian populations. All populations from the Caspian coastal zone (zones 2 and 3) showed significantly higher energy reserves than those from central Iran and mountains. With the exception of the Sorkhabad population and one population from the temperate Caspian coastal plain, Nour, both of which had low energy reserves and relatively low egg masses, the occurrence of a higher egg mass comes at the cost of lower energy reserves (Fig. 7).
Fig.6: Classical and robust correlations between size-corrected egg load and size-corrected glycogen and fat reserves in Iranian Leptopilina boulardi. The data from the 11 populations have been pooled. Solid lines showed robust and dotted line classical correlation.
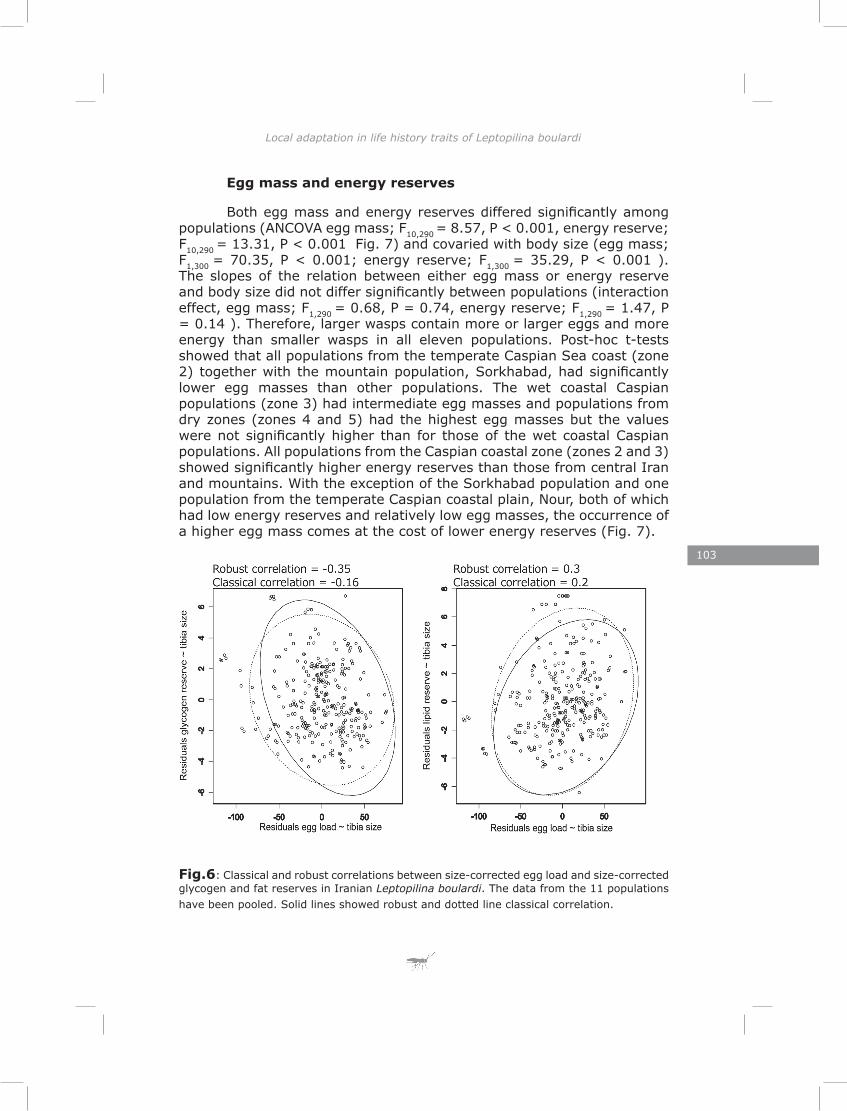
103
Local adaptation in life history traits of Leptopilina boulardi
Egg mass and energy reserves
Both egg mass and energy reserves differed significantly among populations (ANCOVA egg mass; F10,290
= 8.57, P < 0.001, energy reserve; F10,290
= 13.31, P < 0.001 Fig. 7) and covaried with body size (egg mass; F1,300
= 70.35, P < 0.001; energy reserve; F1,300 = 35.29, P < 0.001 ).
The slopes of the relation between either egg mass or energy reserve and body size did not differ significantly between populations (interaction effect, egg mass; F1,290
= 0.68, P = 0.74, energy reserve; F1,290 = 1.47, P
= 0.14 ). Therefore, larger wasps contain more or larger eggs and more energy than smaller wasps in all eleven populations. Post-hoc t-tests showed that all populations from the temperate Caspian Sea coast (zone 2) together with the mountain population, Sorkhabad, had significantly lower egg masses than other populations. The wet coastal Caspian populations (zone 3) had intermediate egg masses and populations from dry zones (zones 4 and 5) had the highest egg masses but the values were not significantly higher than for those of the wet coastal Caspian populations. All populations from the Caspian coastal zone (zones 2 and 3) showed significantly higher energy reserves than those from central Iran and mountains. With the exception of the Sorkhabad population and one population from the temperate Caspian coastal plain, Nour, both of which had low energy reserves and relatively low egg masses, the occurrence of a higher egg mass comes at the cost of lower energy reserves (Fig. 7).
Fig.6: Classical and robust correlations between size-corrected egg load and size-corrected glycogen and fat reserves in Iranian Leptopilina boulardi. The data from the 11 populations have been pooled. Solid lines showed robust and dotted line classical correlation.
104
Life-history evolution in hymenopteran parasitoids: the roles of host and climate
Chapter 6 Local adaptation in life history traits of Leptopilina boulardi
Discussion
Our results demonstrate substantial variation in most of the life history traits we studied. Four out of the five traits showed no phylogenetic autocorrelation which indicates the potential adaptive value of trait variation. Egg size, the only trait with significant phylogenetic autocorrelation, was also found to be the most conserved trait in all populations.
Direct effects of climate
Consistent with the idea that climate can influence life history traits, our results demonstrate a strong correlation between life history traits and two components of climate, namely the frequency of frost and rain per year. As L. boulardi spends the winter season in pre-pupal diapause inside the host’s puparium, a direct effect of the number of frost days on life history traits of adult L. boulardi females seems unlikely. However, the number of frost days may itself be correlated with other important aspects of climate, e.g., the length of the reproductive season for L. boulardi. Moreover, sudden and unexpected drought can make zone 4 and 5 unpredictable. In contrast to these zones, the climate data for zone 2 show a relatively stable pattern with almost no frost in spring and autumn, few freezing days during winter and almost no periods of drought during summer. Population crashes due to droughts, and the lack of such crashes in more stable climatic regions could be important as sources of selection on life history traits. Climate also affects life history traits indirectly, by shaping the biotic environment and with it the spatial and temporal patterns of host distribution.
Climate and host availability
Ellers et al. (2000b), in a theoretical study on optimal resource allocation strategy in parasitoid wasps, revealed a crucial role of abundance and variation in the spatial distribution of hosts on the evolution of initial egg load. This study predicted that parasitoids in habitats where host abundance is low and variance in the spatial distribution of hosts is high, should invest relatively more in early egg production than parasitoids in an environment with similar host abundance but low variance in the spatial distribution of hosts. In synovigenic parasitoids, which are able to mature egg during their adult lifespan, the optimal timing of egg maturation depends thus on the spatial variation in host distribution, but also on body size (Ellers and Jervis 2003). The L. boulardi populations that we studied seem to be pro-ovigenic and unable to mature eggs during adult life. According to the predictions of the Ellers et al. (2000b) model, they should also have higher egg loads at eclosion with increasing variance in the spatial distribution of hosts when average host abundance is low.
105
Local adaptation in life history traits of Leptopilina boulardi
However, other theories concerning egg load predict that it should also increase with average host abundance and with increased mortality risk of immature parasitoids to balance mortality (Price, 1974). Lack of detailed data on the spatial distribution of hosts and on the population dynamics of the populations we studied, makes it hard to predict the evolution of egg loads and to explain differences observed between populations. However, for the populations collected along the Zayandehrod river between Esfahan and Shahrekord, the habitat consisted of a small strip of irrigated soils along the river, otherwise surrounded by arid desert country. In the irrigated zone along the river orchards producing fruits of a variety of species are scattered among vegetable fields. Females from these populations have to move between different fruit crops during successive generations, and will often need to disperse to find suitable reproductive habitat. However, once arrived in an orchard with ripe fruits they can easily find a large number of hosts. We predict therefore that these wasps have high egg loads and lower lipids and carbohydrate reserves in comparison with other populations, and this is indeed what we found. The coastal plain along the Caspian sea is mainly used as a rice growing area, and orchards and fruit trees are scarce. Although the long season and the high frequency of summer rains provides a stable climate and prevents that host populations crash due to droughts, parasitoids must travel long distances between sites with fruits. We thus expected egg loads to be lower in females from populations in this region and expected them to have higher energy reserves at the start of adult life. We predicted the populations collected on the mountain slopes facing the Caspian Coast (Lunak and Seyakhal) to have egg loads intermediate between those of the populations collected along the Zayandehrod river and those from the coastal plain, because there are more fruit trees in this region than on the coastal plain, but in densities much lower than along the Zayandehrod river. As this is confirmed by our data, we suggest that abundance of suitable host habitat (fruits) is an important factor in the egg load evolution, and that climate affects the evolution of egg load only indirectly by shaping the biotic aspects of the parasitoid’s habitat.
Egg size adjustment in parasitoids
Egg size showed the least divergence between populations. Only the three populations from zone two (the wet Caspian coastal region), had smaller egg sizes compared to other populations. In other insects, egg size is positively related to offspring fitness. In koinobiont parasitoids with hydropic eggs there is no clear relation between egg size and offspring survival. In idiobiont parasitoids with anhydropic eggs, on the other hand, egg size may affect the success in larval competition. Collier et al. (2002) studying two Encarsia species, showed that E. pergandiella with smaller eggs performed better in interspecific competition than E. formosa which has larger eggs. In coleopteran parasitoids a positive correlation between
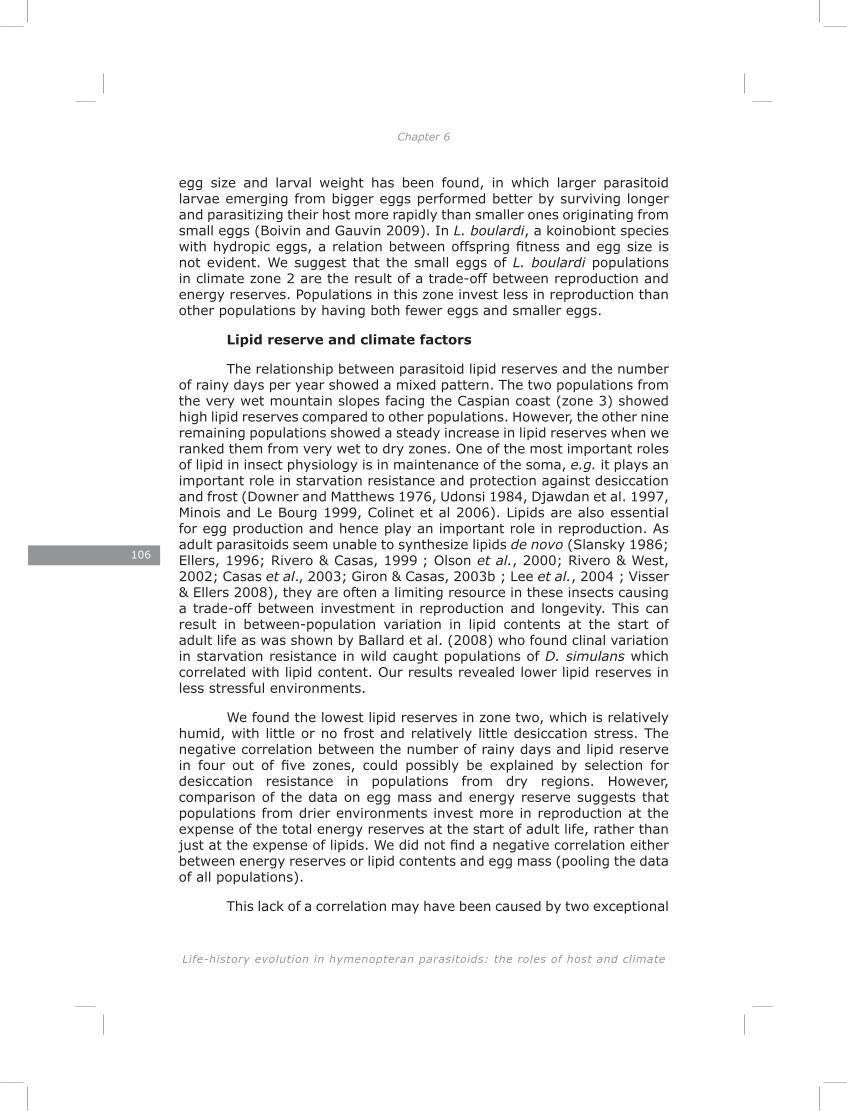
106
Life-history evolution in hymenopteran parasitoids: the roles of host and climate
Chapter 6 Local adaptation in life history traits of Leptopilina boulardi
egg size and larval weight has been found, in which larger parasitoid larvae emerging from bigger eggs performed better by surviving longer and parasitizing their host more rapidly than smaller ones originating from small eggs (Boivin and Gauvin 2009). In L. boulardi, a koinobiont species with hydropic eggs, a relation between offspring fitness and egg size is not evident. We suggest that the small eggs of L. boulardi populations in climate zone 2 are the result of a trade-off between reproduction and energy reserves. Populations in this zone invest less in reproduction than other populations by having both fewer eggs and smaller eggs.
Lipid reserve and climate factors
The relationship between parasitoid lipid reserves and the number of rainy days per year showed a mixed pattern. The two populations from the very wet mountain slopes facing the Caspian coast (zone 3) showed high lipid reserves compared to other populations. However, the other nine remaining populations showed a steady increase in lipid reserves when we ranked them from very wet to dry zones. One of the most important roles of lipid in insect physiology is in maintenance of the soma, e.g. it plays an important role in starvation resistance and protection against desiccation and frost (Downer and Matthews 1976, Udonsi 1984, Djawdan et al. 1997, Minois and Le Bourg 1999, Colinet et al 2006). Lipids are also essential for egg production and hence play an important role in reproduction. As adult parasitoids seem unable to synthesize lipids de novo (Slansky 1986; Ellers, 1996; Rivero & Casas, 1999 ; Olson et al., 2000; Rivero & West, 2002; Casas et al., 2003; Giron & Casas, 2003b ; Lee et al., 2004 ; Visser & Ellers 2008), they are often a limiting resource in these insects causing a trade-off between investment in reproduction and longevity. This can result in between-population variation in lipid contents at the start of adult life as was shown by Ballard et al. (2008) who found clinal variation in starvation resistance in wild caught populations of D. simulans which correlated with lipid content. Our results revealed lower lipid reserves in less stressful environments.
We found the lowest lipid reserves in zone two, which is relatively humid, with little or no frost and relatively little desiccation stress. The negative correlation between the number of rainy days and lipid reserve in four out of five zones, could possibly be explained by selection for desiccation resistance in populations from dry regions. However, comparison of the data on egg mass and energy reserve suggests that populations from drier environments invest more in reproduction at the expense of the total energy reserves at the start of adult life, rather than just at the expense of lipids. We did not find a negative correlation either between energy reserves or lipid contents and egg mass (pooling the data of all populations).
This lack of a correlation may have been caused by two exceptional
populations, Nour and Sorkhabad, which showed relatively low egg masses
Fig.7: Egg mass and total energy reserve in 11 Iranian populations of Leptopilina boulardi (values are residuals of the regression of egg mass and total energy reserve on tibia length to correct the effect of size and error bars represent Standard Error).
and very low energy reserves. Another possibility is that reproduction in these populations is traded off against other investments of energy that we did not measure, e.g. in flight muscles. The climate in zone 3 contrasts with that of other areas sampled on the Caspian coast by its cool summer weather and long cold winters. This results in a relatively short season for L. boulardi, and the presence of extended natural forests and low human population density result in fruit being relatively scarce (not a good habitat for D. melanogaster and D. simulans, the hosts of L. boulardi). We think that large lipid reserves in the Seyahkal and Lunak populations may have been selected for by the long distance between resources, while we have argued earlier that the Astaneh population is an exception which may have been founded by flies transported via fruit from elsewhere (Chapter 4).
Carbohydrate reserves and climate factors
Beside lipids, carbohydrates play a key role as energy source in insect life. Carbohydrates can be mobilized more quickly than lipids and may thus display different environmental patterns (Schmidt and Mathur 1967). We found the highest glycogen and sugar levels in wasps from the wet and mild Caspian Coastal plain (zone two). Glycogen correlated negatively with the number of frost days per year and correlated positively with precipitation. Like lipids, glycogen has been suggested to provide stress resistance in insects (Djawdan et al. 1997, Graves et al. 1992, Marron et al. 2003, Zwaan et al. 1991, but see Sharmila Bharathi et al. 2003, Kostal et al. 2001). However, our results do not indicate a role for glycogen in desiccation and cold stress resistance in these populations. Instead, the pattern of glycogen storage may be explained by differences in dispersal behaviour, as the main flight fuel used by hymenopteran parasitoids are carbohydrates, in particularly glycogen (Vogt et al. 2000; Suarez et al. 2005). Only parasitoids that need to make very long
107
Local adaptation in life history traits of Leptopilina boulardi
populations, Nour and Sorkhabad, which showed relatively low egg masses
Fig.7: Egg mass and total energy reserve in 11 Iranian populations of Leptopilina boulardi (values are residuals of the regression of egg mass and total energy reserve on tibia length to correct the effect of size and error bars represent Standard Error).
and very low energy reserves. Another possibility is that reproduction in these populations is traded off against other investments of energy that we did not measure, e.g. in flight muscles. The climate in zone 3 contrasts with that of other areas sampled on the Caspian coast by its cool summer weather and long cold winters. This results in a relatively short season for L. boulardi, and the presence of extended natural forests and low human population density result in fruit being relatively scarce (not a good habitat for D. melanogaster and D. simulans, the hosts of L. boulardi). We think that large lipid reserves in the Seyahkal and Lunak populations may have been selected for by the long distance between resources, while we have argued earlier that the Astaneh population is an exception which may have been founded by flies transported via fruit from elsewhere (Chapter 4).
Carbohydrate reserves and climate factors
Beside lipids, carbohydrates play a key role as energy source in insect life. Carbohydrates can be mobilized more quickly than lipids and may thus display different environmental patterns (Schmidt and Mathur 1967). We found the highest glycogen and sugar levels in wasps from the wet and mild Caspian Coastal plain (zone two). Glycogen correlated negatively with the number of frost days per year and correlated positively with precipitation. Like lipids, glycogen has been suggested to provide stress resistance in insects (Djawdan et al. 1997, Graves et al. 1992, Marron et al. 2003, Zwaan et al. 1991, but see Sharmila Bharathi et al. 2003, Kostal et al. 2001). However, our results do not indicate a role for glycogen in desiccation and cold stress resistance in these populations. Instead, the pattern of glycogen storage may be explained by differences in dispersal behaviour, as the main flight fuel used by hymenopteran parasitoids are carbohydrates, in particularly glycogen (Vogt et al. 2000; Suarez et al. 2005). Only parasitoids that need to make very long
108
Life-history evolution in hymenopteran parasitoids: the roles of host and climate
Chapter 6 Local adaptation in life history traits of Leptopilina boulardi
distance flights should preferentially store their energy reserves as lipids, as they can store more energy in the form of lipids in a limited space than as carbohydrates. Insects living in a more fine-grained habitat, where they can restore energy reserves more frequently, should store there energy reserves preferably as sugars and glycogen, and benefit from the fact that these can be mobilized quickly when needed. We have argued above that populations collected in zone 2 need long dispersal flights to find hosts, because the extended rice fields are unsuitable as habitat. Interestingly, Pelosse et al (2007) found a similar difference in glycogen allocation strategy in two populations of Venturia canescens, Arrhenotokous populations which live in natural habitats with scattered hosts and travel regularly between host patches stored more glycogen than thelytokous population which live in anthropogenic environments with aggregated hosts and no need to travel between host patches.
Trade-off between energy reserve and reproduction
Given that hymenopteran parasitoids lack the ability to synthesize lipids in adult life (Ellers 1996; Rivero and West 2002; Giron and Casas 2003; Visser and Ellers 2008), it has been suggested that they face a trade-off between allocating resources to reproduction or survival (Ellers 1996; Ellers et al. 2000a; Jervis et al. 2003; Jervis et al. 2008). In many cases this trade off may be masked by other factors, such as replenishing resources through host feeding (Rivero and West 2005; Ferracini, et al. 2006) or using resources to overcome habitat stress (Minois and Le Bourg, 1999; Colinet et al 2006; Ballard et al. 2008). We attempted to find support for this trade-off by pooling the data of all 11 populations and checking for a correlation between egg load and lipid and carbohydrate stores. Our results did not show a negative correlation between lipid reserve and egg load.
However, we did find a negative correlation between glycogen reserves and egg load. It should be noted however, that the only valid evidence of a trade-off is a negative causal relation between traits (e.g., negative pleiotropy, or different allocation of a limiting resource to different functions). Our data are phenotypic correlations that can neither prove, nor disprove the existence of a trade-off. To demonstrate trade-offs, either experimental manipulation of phenotypic traits, or artificial selection experiments should be done. Our results demonstrate both high lipid reserves and egg-loads for parasitoids from the dry regions in zone 4 and 5 and also from two populations from cool wet Caspian mountain forests (climate zone 3). In these climate zones, we expect high variance in inter-patch travel times and thus selection for high initial fecundity (Ellers et al. 2000b).
To conclude, we have shown that large interpopulation variation exists in key life history traits between populations from different climatic
109
Local adaptation in life history traits of Leptopilina boulardi
zones. We suggest that host distribution pattern, host abundance, length of the season and sources of a-biotic stress all have played a role in sha-ping the life history traits of these populations. We advocate the develop-ment of theories to predict the evolution of life-history trade-offs, which combine spatial and temporal patterns of host distributions and climate factors as sources of selection.


111
R e f e r e n c e s
112
Life-history evolution in hymenopteran parasitoids: the roles of host and climate
References
References:
Abouheif, E. 1999. A method for testing the assumption of phylogenetic independence in comparative data. Evol. Ecol. Res. 1: 895-909.
Ackerman, J. T. and Eadie, J. M. 2003. Parental investment decisions in mallards: a clutch manipulation experiment. Behav. Ecol. Sociobiol. 54: 264-273.
Alamalakala, L., et al. 2009. Amplified fragment length polymorphism used for inter- and intraspecific differentiation of screwworms (Diptera: Calliphoridae). Bull. Entomol. Res. 99:139-149.
Allemand, R. et al. 2003. Phylogeny of six African Leptopilina species (Hymenoptera: Cynipoidea, Figitidae), parasitoids of Drosophila, with descriptions of three new species. Ann. Soc. Entomol. Fr. 38: 319-332.
Alphen, J. J. M. van and Thunissen, I. 1982. Host selection and sex allocation by Pachycrepoideus vindemiae Rondani (Pteromalidae) as a facultative hyperparasitoid of Asobara tabida Nees (Braconidae: Alysiinae) and Leptopilina heterotoma (Cynipidae: Eucoilidae). Neth. J. Zool. 33: 497-514.
Alphen, J. J. M. van and Visser, M. E. 1990. Superparasitism as an adaptive strategy for insect parasitoids. Annu. Rev. Entomol. 35: 59-79.
Al-Saffar, Z. Y., et al.1995. Influence of constant and changing temperature and humidity on the development and survival of the eggs and pupae of Drosophila melanogaster (Meigen). J Therm Biol 20:389–397.
Anderson B, et al. 2004. Comparative population genetic structures and local adaptation of two mutualists. Evolution 58:1730-1747.
Avise, J.C. 1994. Molecular markers, natural history and evolution. 511 pp. New York, Chapman & Hall.
Ballard, J.W.O., et al. 2008. Starvation resistance is positively correlated with body lipid proportion in five wild caught Drosophila simulans populations. J. Insect Physiol. 54: 1371-1376.
Barker, J. S. F. 1971. Ecological differences and competitive interaction between Drosophila melanogaster and Drosophila simulans in small laboratory populations. Oecologia 8: 139-156.
Bazzocchi G. G., et al. 2003. Effects of temperature and host on the pre-imaginal development of the parasitoid Diglyphus isaea (Hymenoptera: Eulophidae). Biol. Cont. 26:74–82.
113
References
Belshaw, R. and Quicke D.L.J. 1997 A Molecular Phylogeny of the Aphidiinae (Hymenoptera: Braconidae). Mol. Phylogenet. Evol. 7:281-293.
Berrigan, D. 1991. The Allometry of Egg Size and Number in Insects. Oikos 60:313-321.
Bettencourt, B.R., et al. 2002. Response to natural and laboratory selection at the Drosophila hsp70 genes. Evolution 56: 1796–1801.
Blackburn, T. M. 1991. A comparative examination of life-span and fecundity in parasitoid hymenoptera. J. Anim. Ecol. 60: 151-164.
Block, M., Stoks, R. 2004. Life-history variation in relation to time constraints in a damselfly. Oecologia 140:68-75.
Boggs, C.L. 1986. Reproductive strategies of female butterflies: variation in and constraints on fecundity. Ecol. Entomol. 11:7-15.
Boggs, C. L. 1992. Resource allocation: exploring connections between foraging and life-history. Funct. Ecol. 6: 508-518.
Boivin, G. and M. J. Gauvin, 2009. Egg size affects larval performance in a coleopteran parasitoid. Ecol. Entomol. 34 (2): 240-245.
Brodeur, J. and McNeil, J. N. 1992. Host behavior modification by the endoparasitoid Aphidius nigripes - a strategy to reduce hyperparasitism. Ecol. Entomol. 17: 97-104.
Brodeur, J. and Vet, L. E. M. 1994. Usurpation of host behaviour by a parasitic wasp. Anim. Behav. 48: 187-192.
Brown, L. 1993. The new shorter Oxford English dictionary. Clarendon press. Oxford UK.
Burger, J. M. S., et al. 2004. Host feeding in insect parasitoids: why destructively feed upon a host that excretes an alternative? Entomol. Exp. Appl.112: 207-215.
Caldow, R. W. G., et al. 1999. Individual variation in the competitive ability of interference-prone foragers: the relative importance of foraging efficiency and susceptibility to Interference. J. Anim. Ecol. 68: 869-878.
Campbell, B.C. et al.1993. Phylogeny of the Nasonia species complex (Hymenoptera: Pteromalidae) inferred from an internal transcribed spacer (ITS2) and 28S rDNA sequences. Insect Mol. Biol. 2:225-237.
Carton, Y. et al. 1986. The Drosophila parasitic wasps. - In: Ashburner,
114
Life-history evolution in hymenopteran parasitoids: the roles of host and climate
References
M. et al. (eds), The genetics and biology of Drosophila. Vol. 3e. Academic Press, pp. 347-394.
Casas J, et al. 2005. Lifetime nutrient dynamics reveal simultaneous capital and income breeding in a parasitoid. Ecology 86:545–54.
Caterino, M. S. and Sperling, F. A. H. 1999. Papilio Phylogeny Based on Mitochondrial Cytochrome Oxidase I and II Genes. Mol. Phylogenet. Evol. 11:122-137.
Charnov, E. L. and Berrigan, D. 1990. Dimension less numbers and life history evolution: age at maturity versus adult life span. Evol. Ecol., 4, 273-275.
Charnov, E. L. and Berrigan, D. 1991. Evolution of life history parameters in animals with indeterminate growth, particularly fish. Evol. Ecol. 5: 63-8.
Clark, R. G. and Shutler, D.1999. Avian Habitat Selection: Pattern from Process in Nest-Site Use by Ducks? Ecology 80: 272-287.
Clark, P. L. et al. 2007. Population Variation of the Fall Armyworm, Spodoptera frugiperda, in the Western Hemisphere. J. Insect Sci. 7:1-10.
Clarke, A. 2006. Temperature and the metabolic theory of ecology. Funct. Ecol. 20:405–412.
Collier, T., et al. 2002. Egg size, intrinsic competition, and lethal interference in the parasitoids Encarsia pergandiella and Encarsia formosa. Biol. Control 23, 254–261.
Colinet, H., et al. 2006. Water relations, fat reserves, survival, and longevity of a cold-exposed parasitic wasp Aphidius colemani (Hymenoptera: Aphidiinae). Environ. Entomol. 35: 228-236.
Colinet, H., et al. 2007. Manipulation of parasitoid size using the temperature-size rule: fitness consequences. Oecologia 152: 425-433.
Combes, C. 1991. Ethological aspects of parasite transmission. Am. Nat. 138: 866-880.
Combes, C. 1998. Parasitism: the ecology and evolution of intimate interactions. Chicago Univ. Press.
Cooper, W. E. 2005. Ecomorphological variation in foraging behaviour by Puerto Rican Anolis lizards. J. Zool. 265: 133-139.
115
References
Crawley, M. J. 2005. An Introduction using R. John Wiley & Sons, Ltd.
Cronin, J. T. and Strong, D. R. 1996. Genetics of oviposition success of a thelytokous fairyfly parasitoid, Anagrus delicatus. Heredity 76:43–54.
Crozier, R. H., et al. 1997. Molecular advances in understanding social insect population structure. Electrophoresis 18:1672-1675.
Cunningham, C.W.1997. Can three incongruence tests predict when data should be combined? Mol. Biol. Evol. 14:733-740.
Daan, S. and Tinbergen, J. 1997. Adaptation of life histories. In: Behavioural ecology: an evolutionary approach (Eds. J. R. Krebs and N. B. Davies), Blackwell Science, 4th Edition, Chapter 13: 311-333.
Dahlgaard, J., et al. 2001. Behavioral differentiation in oviposition activity in Drosophila buzzatii from highland and lowland populations in Argentina: Plasticity or thermal adaptation? Evolution 55: 738-747.
Danks, H. V.1987. Insect dormancy: an ecological perspective. Biol. Survey of Canada (Terrestrial Arthropods), Ottawa.
David, J., et al.1975. Physiologie de l’inanition et utilisation de reserves chez les adultes de Drosophila melanogaster. Arch. Zool. exp. gen. 116: 579-590.
Dawkins, R. 1982. The Extended Phenotype: The long reach of the gene. Oxford University Press.
de Jong, G., and van Noordwijk, A. J. 1992. Acquisition and allocation of resources: genetic (co)variances, selection and life histories. Am. Nat. 139:749–770.
de Magalhaes, J. P., Costa, J. and Church, G. M. 2007. An analysis of the relationship between metabolism, developmental schedules, and longevity using phylogenetic independent contrasts. J. Gerontol. A-Biol. 62:149-160.
Denliger, D. L. 2007. Shutting down insect development: diapause and cold storage. Entomol. Res. 37: A15-A23.
Dhileepan, K., et. al. 2005. Effectof temperature on the survival of Aconophora compressa Walker (Hemiptera: Membracidae): implications for weed biocontrol. Aust. J. Entomol. 44: 457–462.
Dieckmann, U., et al. 2000. The geometry of ecological interactions: simplifying complexity. Cambridge: Cambridge University Press.
116
Life-history evolution in hymenopteran parasitoids: the roles of host and climate
References
Djawdan, M., et al. 1997. Does selection for stress resistance lower metabolic rate? Ecology 78: 828–837.
Donnell, D. M. and M. S. Hunter. 2002. Developmental rates of two congeneric parasitoids, Encarsia formosa and E. pergandiella (Hymenoptera: Aphelinidae), utilizing different egg provisioning strategies. Journal of Insect physiology 48 (4): 487-493.
Downer, R. G. H. and Matthews, J. R. 1976. Patterns of lipid distribution and utilisation in insects. Amer. Zool. 16: 733-745.
Dowton, M. and Austin, A.D. 1994. Molecular phylogeny of the insect order Hymenoptera: apocritan relationships. P. Natl Acad. Sci. USA 91:9911-9915
Dubuffet, A., et al. 2006. Do parasitoid preferences for different host species match virulence? Physiol. Entomol. 31: 170-177.
Eijs, I. E. M. and van Alphen, J. J. M. 1999. Life history correlations: why are hymenopterans parasitoids an exception? Ecol. Lett. 2:27-35.
Ellers, J. 1996. Fat and eggs: an alternative method to measure the trade-off between survival and reproduction in insect parasitoids. Neth. J. Zool. 46:227–35.
Ellers, J. 1998. life-history evolution in the parasitoid Asobara tabida: on the tradeoff between reproduction and survival. PhD thesis. Univ. of Leiden, the Netherlands.
Ellers J. and van Alphen, J. J. M. 1997. Life history evolution in Asobara tabida: plasticity in allocation of fat reserves to survival and reproduction. J. Evol. Biol. 10:771–85.
Ellers J, et al. 1998. A field study of size-fitness relationships in the parasitoid Asobara tabida. J. Anim. Ecol. 67:318–24.
Ellers, J.,et al. 2000a. The shape of the trade-off function between egg production and life span in the parasitoid Asobara tabida. Neth. J. Zool. 50:29–36.
Ellers, J., et al. 2000b. Egg load evolution in Parasitoids. Am. Nat. 156:650-665.
Ellers, J. et al. 2001. Seasonal changes in female size and its relation to reproduction in the parasitoid Asobara tabida. Oikos 92: 309 –314.
Ellers, J. and Jervis, M. A. 2003. Body size and the timing of egg production in parasitoid wasps. Oikos 102: 164-172.
117
References
Ellers, J. and Jervis, M. A. 2004.Why are so few parasitoid wasp species pro-ovigenic? Evol. Ecol. Res. 6: 993–1002.
Endler, J. A. 1986. Natural Selection in the wild. monographs in population biology. 21; Princeton University Press, 336pp.
Engen, S., and B. E. Saether. 1994. Optimal allocation of resources to growth and reproduction. Theor. Popul. Biol. 46:232–248.
Farris, J. S., et al. 1994. Testing significance of incongruence. Cladistics 10: 3 15-319.
Fenster, C. B., Galloway, L. F. 2000. Population differentiation in an annual legume: genetic architecture. Evolution 54:1157– 1172.
Ferracini, C., et al. 2006. Costs and benefits of host feeding in the parasitoid wasp Trichogramma turkestanica Entomol. Exp. Appl. 121: 229-234.
Fischer, K., et al. 2003. Plasticity in butterfly egg size: Why larger offspring at lower temperatures? Ecology 84: 3138-3147.
Fisher, R. A. 1930. The genetical theory of natural selection. Oxford: Clarendon.
Flanders, S.E. 1950. Regulation of ovulation and egg disposal in the parasitic Hymenoptera. Can. Entomol. 82: 134–140.
Fleury F, et al. 2004. Ecological and genetic interactions in Drosophila parasitoids communities: a case study with D. melanogaster, D. simulans and their common Leptopilina parasitoids in south-eastern France. Genetica 120: 181-194.
Fox, C. W. and Wolf J. B. 2006. Evolutionary Genetics: concepts and case studies. Oxford University Press, New York.
Fritz, R. S. 1982. Selection for host modification by insect parasitoids. Evolution 36: 283-288.
Frydenberg, J. et al. 2003. DNA sequence variation and latitudinal associations in hsp23, hsp26 and hsp27 from natural populations of Drosophila melanogaster. Mol. Ecol. 12: 2025–2032.
Galtier, N., et al. 2009. Mitochondrial whims: metabolic rate, longevity and the rate of molecular evolution. Biol. Letters. (doi:10.1098//rbsl.2008.0662).
Giron, D. and Casas, J. 2003. Lipogenesis in an adult parasitic wasp. J.
118
Life-history evolution in hymenopteran parasitoids: the roles of host and climate
References
Insect Physiol. 49: 141-147.
Godfray, H. C. J. 1987. The evolution of clutch size in parasitic wasps. Am. Nat. 129: 221-233.
Godfray, H. C. J. 1994. Parasitoids: Behavioural and evolutionary ecology. Princeton Univ. Press, Princeton, NJ.
Godfray, H. C. J. and Shimada, M. 1999. Parasitoids: a model system to answer questions in behavioral, evolutionary and population ecology. Res Popul Ecol 41:3–10.
Gorshkov, V. G. and Makarieva, A. M., 2002. Greenhouse effect dependence on atmospheric concentrations of greenhouse substances and the nature of climate stability on Earth. Atmos. Chem. Phys. Dis. 2: 289–337.
Graf, S. A. and Sokolowski, M. B. 1989. Rover / sitter Drosophila melanogaster larval foraging polymorphism as a function of larval development, food-patch quality, and starvation. J. Insect Behav. 2: 301-313.
Graves, J. L., et al.1992. Desiccation, flight, glycogen, and postponed senescence in Drosophila melanogaster. Physiol. Zool. 65, 268-286.
Gray, D. R. and Hodgson, A. N. 1997. Temporal variation in foraging behaviour of Patella granularis (Patellogastropoda) and Siphonaria concinna (Basommatophora) on a south African shore. J. Molluscan Stud. 63: 121-130.
Griffiths, J.A., et al. 2005. Clinal variation and laboratory adaptation in the rainforest species Drosophila birchii for stress resistance, wing size, wing shape and development time. J. Evol. Biol. 18: 213-222.
Grosman, A. H., et al. 2008. Parasitoid increases survival of its pupae by inducing hosts to fight predators. PLoS One 3: e2276.
Gschwandtner, M. and Filzmoser, P. 2007) Mvoutlier: Multivariate outlier detection based on robust methods. R package version 1.3. http://www.statistik.tuwien.ac.at/public/filz/
Gustafsson, L., and Sutherland W. J. 1988. The costs of reproduction in the Collared Flycatcher (Ficedula albicollis). Nature 335: 813–815.
Hadiprakarsa, Y. Y. and Kinnaird, M. F. 2004. Foraging characteristics of an assemblage of four Sumatran hornbill species. Bird Conserv. Int. 14: S53-S62.
119
References
Hagley, E. A. C. and Barber, D. R. 1992. Effect of food sources on the longevity and fecundity of Pholetesor ornigis (Weed) (Hymenoptera: Braconidae). Can. Entomol. 124: 341–346.
Harman, D. 1957. Aging: a theory based on free radical and radiation chemistry. J Gerontol 2: 298–300.
Harvey, J. A. 2005. Factors affecting the evolution of development strategies in parasitoid wasps: the importance of functional constraints and incorporating complexity. Entomologia Experimentalis et Applicata 117: 1-13.
Harvey, J. 2008. Comparing and contrasting development and reproductive strategies in the pupal hyperparasitoids Lysibia nana and Gelis agilis (Hymenoptera: Ichneumonidae). Evol. Ecol. 22: 153-166.
Harvey, P. H., and Pagel M. D. 1991. The Comparative Method in Evolutionary Biology. Oxford Series in Ecology and Evolution. Oxford University Press, Oxford. 239 pp.
Harvey, J. A. and Strand, M. R. 2002. The developmental strategies of endoparasitoid wasps vary with host feeding ecology. Ecology 83:2439-2451.
Harvey, J.A. et al. 2001. Lifetime Reproductive Success in the Solitary Endoparasitoid, Venturia canescens. J. Insect Behav. 14: 573-593
Harvey, J. A., et al. 2004. Development of the solitary endoparasitoid Microplitis demolitor: host quality does not increase with host age and size. Ecol. Entomol. 29: 35-43.
Harvey, J. A. et al. 2008. Do parasitized caterpillars protect their parasitoids from hyperparasitoids? A test of the ‘usurpation hypothesis’. Anim. Behav. 76: 701-708.
Hawthorne, D. J. 2001. AFLP-based genetic linkage map of the Colorado potato beetle Leptinotarsa decemlineata: Sex chromosomes and a pyrethroid-resistance candidate gene. Genetics 158: 695–700.
Heimpel, G. E and Collier, T. R. 1996. The evolution of host-feeding behavior in insect parasitoids. Biol. Rev. Camb. Philos. Soc. 71:373–400.
Heimpel, G. E. and Rosenheim, J. A. 1998. Egg Limitation in Parasitoids: A Review of the Evidence and a Case Study. Biol. Control 11: 160-168
Heimpel, G. E., et al. 1998. Effects of time limitation and egg limitation on lifetime reproductive success of a parasitoid in the field. Am. Nat. 152: 273-289.
120
Life-history evolution in hymenopteran parasitoids: the roles of host and climate
References
Hoffmann, A. A., et al. 2007. Antagonistic selection between adult thorax and wing size in field released Drosophila melanogaster independent of thermal conditions. Journal of Evolutionary Biology 20: 2219 –2227
Holmstad, P.R., et al. 2006. Vector-borne parasites decrease host mobility: a field test of freeze or flee behaviour of willow ptarmigan. Int. J. Parasitol. 36: 735-740.
Huelsenbeck, J. P. and Ronquist, F. 2001. MRBAYES: Bayesian inference of phylogenetic trees. Bioinformatics 17: 754-755.
Ihaka, R. and Gentleman, R. 1996. R: a language for data analysis and graphics. J. Comput. Graph. Statist. 5: 299-314.
Inouye, D. W. 2000. The ecological and evolutionary significance of frost in the context of climate change. Ecol. Lett. 3: 457–463.
Irving, P., et al. 2004. Is innate enough? The innate immune response in Drosophila. C. R. Biol. 327: 557-570.
Irwin, D.E., et. al. 2005. Speciation by Distance in a Ring Species. Science 307:414-416.
Jensen, J.L., Bohonak, A.J., and Kelley, S.T. 2005. Isolation by distance, web service. BMC Genetics 6: 13. v.3.16 http://ibdws.sdsu.edu/(Mantel, 1967; Sokal & Rohlf, 1995).
Jervis, M. A. and Ferns, P. N. 2004. The timing of egg maturation in insects: ovigeny index and initial egg load as measures of fitness and of resource allocation. Oikos 107: 449-461.
Jervis, M. A and Kidd, N. A. C. 1986. Host-feeding strategies in hymenopteran parasitoids. Biol. Rev. Camb. Philos. Soc. 61:395–434.
Jervis, M. A., et al. 1996. Parasitoid adult feeding behaviour and biocontrol–a review. Biocontrol Newsletter and Information 17: 11-22.
Jervis, M. A,, et al. 2001. Life-history strategies in parasitoid wasps: a comparative analysis of ‘ovigeny’. J. Anim. Ecol. 70: 442–58.
Jervis, M. A., et al. 2003. Body size and the timing of egg production in parasitoid wasps: a comparative analysis. Funct. Ecol. 17: 375-383.
Jervis, M.A., et al. 2005. Egg maturation strategy and its associated trade-offs: a synthesis focusing on Lepidoptera. Ecol. Entomol. 30: 359-375.
Jervis, M. A. et al 2007. Egg maturation strategy and survival trade-offs
121
References
in holometabolous insects: a comparative approach. Biol. J. Linn. Soci. 90: 293-302.
Jervis, M.A., et al. 2008. Resource Acquisition, Allocation, and Utilization in Parasitoid Reproductive Strategies. Annu. Rev. Entomol. 53: 361-385.
Jia, F., et al. 2002. Genetic variation in foraging traits among inbred lines of a predatory mite. Heredity 89: 371-379.
Johnston, I. A., and Bennett A. F. 1996. Animals and temperature: phenotypic and evolutionary adaptation. Cambridge Univ. Press, Cambridge, U.K.
Jones, W.A. and Jackson, C.G., 1990. Mass production of Anaphes iole for augmentation against Lygus hesperus: effects of food on fecundity and longevity. The South western Entomologist 15, 463–468.
Kaltz, O., and J. A. Shykoff. 1998. Local adaptation in host-parasite systems. Heredity 81:361–370.
Karl, I. and Fischer, K. 2008. Why get big in the cold? Towards a solution to a life-history puzzle. Oecologia 155: 215-225.
Kerdelhue C, et al. 2006. Comparative population genetic study of two oligophagous insects associated with the same hosts. Heredity 97:38-45.
King, R. C. and Standsfield, W. D. 1990. A dictionary of genetic. Oxford University
Kostal, V., et al. 2001. Low-temperature storage and cold hardiness in two populations of the predatory midge Aphidoletes aphidimyza, differing in diapause intensity. Physiological Entomology, 26, 320–328.
Kraaijeveld, A. R. and van Alphen, J. J. M. 1994. Geographical variation in resistance of the parasitoid Asobara tabida against encapsulation by Drosophila melanogaster larvae: the mechanism explored. Physiol. Entomol. 19: 9-14.
Kraaijeveld, A. R. and van Alphen J. J. M. 1995. Geographic variation in encapsulation ability of Drosophila melanogaster larvae and evidence for parasitoid-specific components. Evol. Ecol. 9: 10-17.
Kraaijeveld, A. R. and van der Wel, N. N. 1994. Geographical variation in reproductive success of the parasitoid Asobara tabida in larvae of several Drosophila species. Ecol. Ent. 19: 221-229.
Kraaijeveld, A. R., et al. 1995. Adaptive variation in host selection
122
Life-history evolution in hymenopteran parasitoids: the roles of host and climate
References
behaviour of Asobara tabida , a parasitoid of Drosophila larvae. Funct. Ecol. 9: 113-118.
Lee, J. C., et al. 2004. Comparing floral nectar and aphid honeydew diets on the longevity and nutrient levels of a parasitoid wasp. Entomol. Exp. Appl. 111, 189-199.
Lee, R. E. Jr, et al. 1987. A rapid cold-hardening process in insects. Science 238: 1415–1417.
Lett, C., et al. 2003. Migration Frequency and the Persistence of Host-Parasitoid Interactions. J. Theor. Biol. 221: 639-654.
Lewis, W. J., et al. 1998. Understanding how parasitoids balance food and host needs: importance to biological control. Biol. Control 11: 175–183.
Lively, C. M. 1999. Migration, virulence, and the geographic mosaic of adaptation by parasites. Am. Nat. 153:S34–S47.
Liu, H., et al. 2009. Dynamics of a host-parasitoid model with Allee effect for the host and parasitoid aggregation. Ecol. Complex. 6: 337-345.
Lunt, D.H., et. al. 1996. The insect cytochrome oxidase I gene: evolutionary patterns and conserved primers for phylogenetic studies. Insect Mol. Biol. 5: 153-165.
Lively, C. M. 1999. Migration, virulence, and the geographic mosaic of adaptation by parasites. Am. Nat. 153: S34–S47.
Maddison, D.R., and W.P. Maddison. 2005. MacClade 4: Analysis of Phylogeny and Character Evolution. Version 4.08. Sinauer Associates, http://macclade.org Sunderland, Massachusetts.
Maeda, T. 2006. Genetic variation in foraging traits and life-history traits of the predatory mite Neoseiulus womersleyi (Acari: Phytoseiidae) among isofemale lines. J. Insect Behav. 19: 573-589.
Mantel N. 1967. The detection of disease clustering and a generalized regression approach. Cancer Research 27: 209–220.
Marron, M.T., et al. 2003. Effects of starvation and desiccation on energy metabolism in desert and mesic Drosophila. J. Insect Physiol. 49: 261–270.
Masahiko, W. 2001. Winter accumulation and its role of sugars and polyols in overwintering insects. Cryobiology and Cryotechnology. 47:
123
References
56-63.
Masaki, S. 2002. Ecophysiological consequences of variability in diapause intensity. Eur. J. Entomol. 99: 143-154.
Masoodian, S. A. 2003. Climatic Regions of Iran. Journal of Geography and development of Iran, 1: 50-20.
Mayhew, P. J. and Blackburn, T.M., 1999. Does development mode organize life-history traits in the parasitoid Hymenoptera? J. Anim. Ecol. 68: 906–916.
McMichael, M. and Prowell, D. P.1999. Differences in amplified fragment length polymorphisms in fall army worm (Lepidoptera: Noctudiae) host strains. Ann Entomol Soc Amer, 92:175–181.
Mills, C. A. 1988. The effect of extreme northerly climatic conditions on the life-history of the minnow Phoxinus phoxinus (L). J. Fish Biol. 33: 545-561.
Minois N, and Le Bourg E. 1999. Resistance to stress as a function of age in Drosophila melanogaster living in hypergravity. Mech. Ageing Dev. 109: 53-64.
Miura, O. et al. 2006. Parasites alter host phenotype and may create a new ecological niche for snail hosts. Proc. R. Soc. B 273: 1323-1328.
Monteiro, A. and Pierce, N.E. 2001. Phylogeny of Bicyclus (Lepidoptera: Nymphalidae) Inferred from COI, COII, and EF-1[alpha] Gene Sequences. Mol. Phylogenet. Evol. 18:264-281.
Moon, D. C., et al. 2000. The effects of abiotically induced changes in host plant quality (and morphology) on a salt marsh planthopper and its parasitoid. Ecol. Entomol. 25: 325–331.
Moore, J. 2002. Parasites and the behavior of animals. Oxford Univ. Press.
Moreau, S. J. M. et al. 2002. Effects of parasitism by Asobara tabida (Hymenoptera: Braconidae) on the development, survival and activity of Drosophila melanogaster larvae. J. Insect Physiol. 48: 337-347.
Moreau, J., et al. 2009. Host plant cultivar of the grapevine moth Lobesia botrana affects the life history traits of an egg parasitoid. Biol. Control 50: 117–122.
Mopper, S. and S. Y. Strauss .1998. Genetic structure and local adaptation in natural insect populations: effects of ecology, life history
124
Life-history evolution in hymenopteran parasitoids: the roles of host and climate
References
and behavior. Chapman and Hall, New York.
Nagy, E. S. 1997. Selection for native characters in hybrids between two locally adapted plant subspecies. Evolution 51: 1469–1480.
Nappi, A. J. et al. 1975. Parasite encapsulation in insects. In: Maramorosch, K. and Shope, R. E. (eds), Invertebrate immunity: mechanisms of invertebrate vector-parasite relations. Academic Press, pp. 293-326.
Nespolo, R. F., et al. 2007. Cyclic gas-exchange in the Chilean red cricket: inter-individual variation and thermal dependence. J. Exp. Biol. 210: 668-675.
Najimi, B., et al.2002. Amplified fragment length polymorphism (AFLP) analysis of markers associated with H5 and H22 Hessian fly resistance genes in bread wheat. Biotechnol. Agron. Soc. Environ. 6: 79–85.
Nei, M. and Li, W. H. 1979. Mathematical model for studying genetical variation in terms of restriction endonucleases. Proc. Natl Acad. Sci.U.S.A. 76: 5269-5273.
Neretti, N. et al. 2009. Long-lived Indy induces reduced mitochondrial reactive oxygen species production and oxidative damage. P. Natl Acad. USA 106: 2277-2282.
Nilssen, A. C. 1997. Effect of temperature on pupal development and eclosion dates in the reindeer oestrids Hypoderma tarandi and Cephenemyia trompe (Diptera: Oestridae). Environ. Entomol. 26: 296–306.
Norry, F.M., et al. 2006. Altitudinal patterns for longevity, fecundity and senescence in Drosophila buzzatii. Genetica 128: 81-93.
Ode, P. J. 2006. Plant chemistry and natural enemy fitness: effects on herbivore and natural enemy interactions. Annu. Rev. Entomol. 51: 163-185.
Ohsaki, N. and Sato, Y. 1994. Food plant choice of Pieris butterflies as a tradeoff between parasitoid avoidance and quality of plants. Ecology 75: 59-68.
Ohtsu, T., et al.., 1999. Biochemical aspects of climatic adaptations in Drosophila curviceps, D. immigrans, and D. albomicans (Diptera: Drosophilidae). Environ. Entomol. 28, 968–972.
Olav R, et al.2003. Mitochondrial markers in the ant Leptothorax rugatulus reveal the population genetic consequences of female
125
References
philopatry at different hierarchical levels. Mol. Ecol. 12: 795-801.
Olson, D. L. and Nechols, J. R. 1995. Effect of squash leaf trichome exudate and honey on adult feeding, survival, and fecundity of the squash bug (Heteroptera: Coreidae) egg parasitoid Gryon pennsylvanicum (Hymenoptera: Scelionidae). Environ. Entomol. 24: 454–458.
Olson, D. M., et al. 2000. Effect of sugar feeding on carbohydrate and lipid metabolism in a parasitoid wasp. Physiological Entomology 25, 17-26.
Orr, H. A. 2009. Fitness and its role in evolutionary genetics. Nat. Rev. Genet. 10: 531-539.
Pannebakker, B. A., et al. 2004. Genetic diversity and Wolbachia infection of the Drosophila parasitoid Leptopilina clavipes in western Europe. Mol. Ecol. 13: 1119-28.
Peakall, R., Smouse P.E. 2006. GENALEX 6: genetic analysis in Excel. Population genetic software for teaching and research. Molecular Ecology Notes 6: 288–295. Available for downloading at http://www.anu.edu.au/BoZo/GenAIEx/.
Pelosse, P., et al. 2007. Differential energy allocation as an adaptation to different habitats in the parasitic wasp Venturia canescens. Evol. Ecol. 21: 669-685.
Peterson, M. A. and Denno, R. F. 1998. The influence of dispersal and diet breadth on patterns of genetic isolation by distance in phytophagous insects. Am. Nat. 152: 428-446.
Pexton, J. J. and Mayhew, P. J. 2002. Siblicide and life-history evolution in parasitoids. Behav. Ecol. 13:690–95.
Pinheiro, J. C. and Bates, D. M. 2000. Mixed-effects models in S and S-PLUS, statistics and computing series. Springer.
Pivnick, K. A. 1993. Diapause initiation and pupation site selection of the Braconid parasitoid Microplitis mediator (Haliday) - a case of manipulation of host behaviour. _ Can. Entomol. 125: 825-830.
Poluin, R. 1998. Evolutionary ecology of parasites: from individuals to communities. Chapman and Hall.
Posada, D. and Crandall, K. A., 1998. MODELTEST: testing the model of DNA substitution. Bioinformatics 4: 817-818.
126
Life-history evolution in hymenopteran parasitoids: the roles of host and climate
References
Posada, D. and Buckley, T. R. 2004. Model selection and model averaging in phylogenetics: advantages of the AIC and Bayesian approaches over likelihood ratio tests. Systematic Biology 53: 793–808.
Prevost, G. et al. 2005. Asobara, braconid parasitoids of Drosophila larvae: unusual strategies to avoid encapsulation without VLPs. J. Insect Physiol. 51: 171-179.
Price, P. W. 1973. Parasitoid strategies and community organization. Environ. Entomol. 2: 623-626.
Price, P.W. 1974 Strategies for egg production. Evolution 28: 76-84.
Purvis, A. and Harvey, P. H. 1995. Mammal life-history evolution: comparative test of Charnov’s model. J. Zool. Lond. 237: 259-283.
Quicke, D.L.J. 1997. Parasitic wasps. Chapman & Hall, London.
Rasband, W.S. 1997-2005. Rasband, ImageJ, U. S. National Institutes of Health, Bethesda, Maryland, USA http://rsb.info.nih.gov/ij/.
Ravel, S., et al. 2001. A preliminary study of the population genetics of Aedes aegypti (Diptera: Culicidae) from Mexico using microsatellite and AFLP markers. Acta Tropica 78: 241-250.
Reeve, J. and Abouheif, E. 2003. Phylogenetic Independence. Version 2.0, Department of Biology, McGill University.
Reineke, A., et al. 1998. Preparation and purification of DNA from insects for AFLP analysis. Insect Mol. Biol. 7: 95-99.
Reineke, A., et al. 1999. Amplified fragment length polymorphism analysis of different geographic populations of the gypsy moth, Lymantria dispar (Lepidoptera: Lymantridae). Bull. Entomol. Res. 89: 79–88.
Riedl, C. A. L. et al. 2007. Genetic and behavioral analysis of natural variation in Drosophila melanogaster pupation position. Fly 1: 23-32.
Rivero, A. and West, S. A. 2002. The physiological costs of being small in a parasitic wasp. Evol. Ecol. Res. 4: 407-420.
Rivero, A. and West, S. A. 2005. The costs and benefits of host feeding in parasitoids. Anim. Behav. 69: 1293–301.
Rizki, R.M. and Rizki, T.m.1984. Selective Destruction of a host blood cell type by a parasitoid wasp. Proc. Natl. Acad. Sci. 81: 6154-6158.
127
References
Roderick, G.K. 1996. Geographic structure of insect populations: gene flow, phylogeography and their uses. Annu. Rev. Entomol. 41: 325–352.
Rodriguez-del-Bosque, L. A. and Smith Jr., J. W. 1996. Rearing and biology of Lydella jalisco (Diptera: Tachinidae), a parasite of Eoreuma loftini (Lepidoptera: Pyralidae) from Mexico. Ann. Entomol. Soc. Am. 89: 88-95.
Roff, D. A. 1981. On the being the right size. Am. Nat. 118: 405-422.
Roff, D. A. 1992. The evolution of life histories: Theory and analysis. New York, Chapman and Hall.
Roff, D. A. 2002. Life History Evolution. Sinauer Associates, Sunderland, MA.
Rosenheim, J. A. 1996. An evolutionary argument for egg limitation. Evolution 50: 2089-2094.
Samara, R., al.2008. Genetic divergence of Trichogramma aurosum Sugonjaev and Sorokina (Hymenoptera: Trichogrammatidae) individuals based on ITS2 and AFLP analysis. J. Appl. Entomol. 132: 230-238.
Sameoto, D. D. and Miller, R. S. 1968. Selection of pupation site by Drosophila melanogaster and D. simulans. Ecology 49: 177-180.
Sarfraz, M., et al. 2009. Host plant nutritional quality affects the performance of the parasitoid Diadegma insulare. Biol. Control 51: 34-41.
Sharmila Bharathi N., et al. 2003. Variation in adult life-history and stress resistance across five species of Drosophila. J. Genet. 82, 191–205.
Scharf, I., et al. 2008. A comparison between desert and Mediterranean antlion populations: differences in life history and morphology. J. Evol. Biol. 21: 162-172.
Scheffer, S. J. & Grissell, E. E. 2003. Tracing the geographical origin of Megastigmus transvaalensis (Hymenoptera: Torymidae): an African wasp feeding on a South American plant in North America. Mol. Ecol. 12: 415-421.
Schmidt, G. H. and M. Mathur, 1967. Changes in the carbohydrate content during the metamorphosis of different castes of Formica polyctena (Hymenoptera: Formicidae). Entomol. Exp. Appl. 10: 421-436.
Schnebel, E. M. and Grossfield, J. 1992. Temperature effects on
128
Life-history evolution in hymenopteran parasitoids: the roles of host and climate
References
pupation-height response in four Drosophila species group triads. J. Insect Physiol. 38: 727-732.
Schneider MV, et al. 2002. Geographical distribution and genetic relatedness of sympatrical thelytokous and arrhenotokous populations of the parasitoid Venturia canescens (Hymenoptera). J. Evol. Biol. 15: 191-200.
Schofield, P., et al. 2002. Mathematical modelling of host-parasitoid systems: effects of chemically mediated parasitoid foraging strategies on within- and between-generation spatio-temporal dynamics. J. theor. Biol. 214, 31–47.
Sequeira, R. and Mackauer, M. 1992. Nutritional ecology of an insect host parasitoid association – the pea aphid Aphidius ervisystem. Ecology 73, 183-189.
Sequeira, R. and Mackauer, M. 1993. The nutritional ecology of a parasitoid wasp, Ephedrus californicus Baker (Hymenoptera: Aphidiidae). Can. Entomol. 125: 423-430.
Shargal, E., et al. 2000. Population biology and spatial relationships of coexisting spiny mice (Acomys) in Israel. J. Mammal. 81: 1046–1052.
Sharbel, T. F., et al. 2000. Intraspecific genetic variation in Arabidopsis thaliana: biogeographical structure and the post-Pleistocene colonization of Europe. Mol. Ecol. 9: 2109–2118.
Slansky, F. 1986. Nutritional ecology of endoparasitic insects and their hosts- an overview. J. Insect Physiol. 32: 255-261.
Slatkin, M.1987. Gene flow and the geographic structure of natural populations. Science 236:787-792.
Smith, C. C. and Fretwell S. D. 1974. The optimal balance between size and number of offspring. Am. Nat. 108: 49-506.
Smith, L. 1993. Effect of humidity on life history characteristics of Anisopteraomalus calandrae (Hymenoptera: Pteromalidae) parasiting maize weevil (Coleoptera: Curculionidae). Envir. Em. 22, 618-624.
Smith, P. T. 2005. Mitochondrial DNA variation among populations of the glassy-winged sharpshooter, Homalodisca coagulata. J. Insect Sci. 41: 1-8.
Smith, P.T. and Kambhampati, S. 1999. Status of the Cotesia flavipes species complex (Braconidae : Microgastrinae) based on mitochondrial 16S rRNA and NADH 1 dehydrogenase gene sequence. J. Kansas
129
References
Entomol. Soc. 72:306-314
Sober, E. 2001. The two faces of fitness. In: Thinking about Evolution: Historical, Philosophical, and Political Perspectives (R. S. Singh, C. B. Krimbas, D. B. Paul and J. Beatty, eds.), Cambridge University Press, Vol. 2, pp. 309-321.
Sorensen, J.G., et al. 2005. Altitudinal variation for stress resistance traits and thermal adaptation in adult Drosophila buzzatii from the New World. J. Evolution. Biol. 18: 829-837.
Sokal, R.R. & Michener, C.D. 1958. A statistical method for evaluating systematic relationships. University of KansasScience Bulletin 38: 1409–1438.
Sokolowski, M. B. 1980. Foraging strategies of Drosophila melanogaster: a chromosomal analysis. Behav. Genet. 10: 291-302.
Sokolowski, M. B. 1985. Genetics and ecology of Drosophila melanogaster larval foraging and pupation behaviour. J. Insect Physiol. 31: 857-864.
Sokolowski, M. B. and Hansell, R. I. C. 1983. Elucidating the behavioral phenotype of Drosophila melanogaster larvae: correlations between larval foraging strategies and pupation height. Behav. Genet. 13: 267-280.
Sokolowski, M. B. et al. 1986. Ecological genetics and behaviour of Drosophila melanogaster larvae in nature. Anim. Behav. 34: 403-408.
Stamp, N. E. 1981. Behavior of parasitized aposematic caterpillars - advantageous to the parasitoid or the host. Am. Nat. 118: 715-725.
Stearns, S. C. 1989. Trade-off in life-history evolution. Func. Ecol. 3: 259-268.
Stearns, S. C. 1992. The evolution of life history. Oxford University Press, Oxford, UK.
Stearns, S. C. and Crandall, R. E. 1981. Quantitative predictions of delayed maturity. Evolution. 35: 455-463.
Steiner, U. K. and Pfeiffer, T. 2007. Optimizing time and resource allocation trade-Offs for investment into morphological and behavioral defense. Am. Nat. 169: 118-129.
Stelgenga, M.J. and Fischer, K. 2007. Within- and between-generation effects of temperature on life-history traits in a butterfly. J. therm. Boil.

130
Life-history evolution in hymenopteran parasitoids: the roles of host and climate
References
32: 496-405.
Stenseth, N. C. and Mysterud, A. 2002. Climate, changing phenology, and other life history traits: Non-linearity and match-mismatch to the environment. Proc. Natl. Acad. Sci. USA 99: 13379-13381.
Stenseth, N. C. and Mysterud, A. 2005. Weather packages: Finding the right scale and composition for climate in ecology. J. Anim. Ecol. 74: 1195-1198.
Stenseth, N. C., et al. 2002. Ecological effects of climate fluctuations. Science 297: 1292-1296.
Stenseth, N.C., et al. 2002. Ecological effects of climate fluctuations. Science 297: 1292-1296.
Stouthamer R, et al.1999. Wolbachia pipientis: microbial manipulator of arthropod reproduction. Annu. Rev. Microbiol. 53: 71–102.
Suarez R. K., et al. 2005. Energy metabolism in orchid bee flight muscles: carbohydrate fuels all. J. Exp. Biol 208: 3573-3579.
Tanaka, Y. 1996. How is life history variation generated from the genetic resource allocation? Res. Popul. Ecol. 38: 11–17.
Tanaka, S. and Ohsaki, N. 2006. Behavioral manipulation of host caterpillars by the primary parasitoid wasp Cotesia glomerata (L.) to construct defensive webs against hyperparasitism. Ecolo. Res. 21: 570-577.
Tao, J., et al. 2009. AFLP analysis of genetic variation of Hyphantria cunea (Drury) populations in Beijing and a nearby site. Forestry Studies in China 11: 14-19.
Tauber, E. et al. 2007. Natural selection favors a newly derived timeless allele in Drosophila melanogaster. Science 316: 1895-1898.
Tilman, D. and Kareiva, P. M. 1997. Spatial ecology. the role of space in population dynamics and interspecific interactions, vol. 30 of Monographs in Population Biology. Princeton University Press.
Therneau, T. M. and Grambsch, P. M. 2000. Modelling survival data: extending the cox model. series: statistics for biology and health. Springer.
Thorne, A. D. et al. 2006. Small body size in an insect shifts development, prior to adult eclosion, towards early reproduction. Proc. R. Soc. Lond. Ser. B 273: 1099–103.
131
References
Turchin, P. 1998. Quantitative analysis of movement: Measuring and modeling population redistribution in animals and plants. Sinauer Associates, Sunderland, Massachusetts, USA.
Urban, M. C. 2007. The growth-predation risk trade-off under a growing gape-limited predation threat. Ecology 88:2587-2597.
Urban, M. C. 2008. Salamander evolution across a latitudinal cline in gape-limited predation risk. Oikos 117:1037-1049.
Van de Peer, Y., De Wachter, Y. (1994) TREECON for Windows: a software package for the construction and drawing of evolutionary trees for the Microsoft Windows environment. Comput. Applic. Biosci. 10, 569-70.
Vos, P., et al. 1995. AFLP: a new technique for DNA fingerprinting. Nucleic Acids Res, 23: 4407–4414.
Varaldi, J. et al. 2003. Infectious behavior in a parasitoid. Science 302: 1930.
Vaiserman, M. A. et al. 2008.Life extension in Drosophila maintained under lengthened light/dark regime. Biogerontology 2008;9(5):345-50.
van Handel, E. 1985a. Rapid determination of total lipids in mosquitoes. J. Am. Mosq. Control Assoc. 1: 302–304.
van Handel, E. 1985b. Rapid determination of glycogen and sugars in mosquitoes. J. Am. Mosq. Control Assoc. 1: 299–301.
van Noordwijk, A. J. and de Jong G. 1986. Acquisition and allocation of resources: Their influence on variation in life history tactics. Am. Nat. 128:137–142.
Vet, L. E. M., et al. 1990. A variable-response model for parasitoid foraging behavior. J. Insect Behav. 3: 471-490.
Visser, B. and Ellers J. 2008. Lack of lipogenesis in parasitoids: a review of physiological mechanisms and evolutionary implications. J. insect physiol.. 54(9):1315-22.
Vogt J. T., et al. 2000. Flight energetics and dispersal capability of the fire ant, Solenoopsis invicta Buren. J. Insect physiol. 46: 697-707.
Vos, M. and Vet, L. E. M. 2004 Geographic variation in host acceptance by an insect parasitoid: genotype versus experience. Evol. Ecol. Res. 6: 1021–1035.
Voytek, S. B. and Joyce, G. F. 2009. Niche partitioning in the
132
Life-history evolution in hymenopteran parasitoids: the roles of host and climate
References
coevolution of 2 distinct RNA enzymes. Proc. Natl. Acad. Sci. USA 106: 7780-7785.
Weimerskirch, H., et al. 1997. Alternative foraging strategies and resource allocation by male and female wandering albatrosses. Ecology 78: 2051-2063.
Wertheim, B. 2005. Genome-wide gene expression in response to parasitoid attack in Drosophila. Genome Biol. 6: R94-1-20.
West, G.B. et al.1999. The Fourth Dimension of Life: Fractal Geometry and Allometric Scaling of Organisms. Science 284:1677-1679.
Whitfield, J.B. 1997. Molecular and morphological data suggest a single origin of the polydnaviruses among braconid wasps. Naturwissenschaften 84: 502-507.
Williams, G. C. 1966. Natural selection, the cost reproduction and a refinement of lack’s principle. Am. Nat. 100: 678-690.
Williams III, L. and Roane, T. M. 2007. Nutritional ecology of a parasitic wasp: Food source affects gustatory response, metabolic utilization and survivorship. J. Insect Physiol. 53:1262-1275.
Wilson, H. B. and Hassell, M. P. 1997. Host–parasitoid spatial models: the interplay of demographic stochasticity and dynamics. Proc. R. Soc. Lond. Ser. B 264: 1189 –1195.
Winkler, D. W., et al. 2002. Predicting the effects of climate change on avian life-history traits. Proc. Natl. Acad. Sci. USA 99: 13595–13599.
Worley, A. C., D. Houle, and Barrett, S. C. H. 2003. Consequences of hierarchical allocation for the evolution of life-history traits. Am. Nat. 161:153–167.
Wu, Y. Q., et al. 2006. Genetic diversity of sorghum accession resistant to green bugs as assessed with AFLP Markers. Genome 49: 143–149.
Yan, G., et. al.1999. Population genetics of the yellow fever mosquito in Trinidad: comparisons of amplified fragment length polymorphism (AFLP) and restriction fragment length polymorphism (RFLP) markers. Mol. Ecol. 8: 951–963.
Zaldivar-Riverón A, et. al.2006. Systematics of the cyclostome subfamilies of braconid parasitic wasps (Hymenoptera: Ichneumonoidea): A simultaneous molecular and morphological Bayesian approach. Mol. Phylogenet. Evol. 38: 130-145.

133
References
Zwaan, B. J., et al. 1991. On the developmental theory of ageing. 1. Starvation resistance and longevity in Drosophila melanogaster in rela-tion to pre-adult breeding conditions. Heredity 66:29–39.


135
A p p e n d i c e s
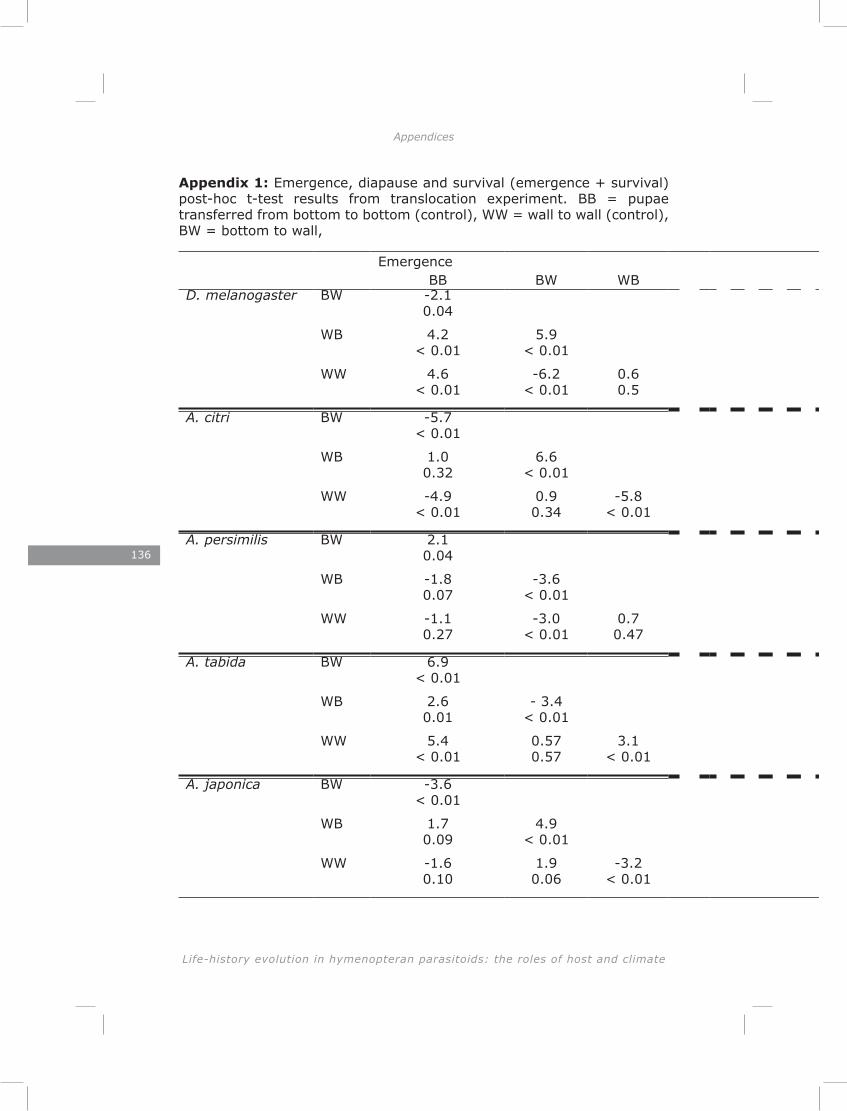
136
Life-history evolution in hymenopteran parasitoids: the roles of host and climate
Appendices Appendix 1
Emergence Diapause SurvivalBB BW WB BB BW WB BB BW WB
D. melanogaster BW -2.1 0.04
WB 4.2 < 0.01
5.9 < 0.01
WW 4.6 < 0.01
-6.2 < 0.01
0.6 0.5
A. citri BW -5.7 < 0.01
5.2 < 0.01
3.0 < 0.01
WB 1.0 0.32
6.6 < 0.01
0.6 0.6
-6.2 < 0.01
1.1 0.29
-2.0 0.04
WW -4.9 < 0.01
0.9 0.34
-5.8 < 0.01
5.2 < 0.01
-0.2 0.84
6.2 < 0.01
4.0 < 0.01
1.3 0.19
3.2 < 0.01
A. persimilis BW 2.1 0.04
NA 1.4 0.18
WB -1.8 0.07
-3.6 < 0.01
NA NA -2.5 0.01
-3.7 < 0.01
WW -1.1 0.27
-3.0 < 0.01
0.7 0.47
NA NA NA -1.5 0.13
-2.7 < 0.01
1.1 0.30
A. tabida BW 6.9 < 0.01
-7.2 < 0.01
4.0 < 0.01
WB 2.6 0.01
- 3.4 < 0.01
-2.6 0.01
-4.5 < 0.01
2.3 0.03
-1.0 0.32
WW 5.4 < 0.01
0.57 0.57
3.1 < 0.01
-7.2 < 0.01
0.0 1
-4.5 < 0.01
3.3 < 0.01
0.55 0.58
1.3 0.21
A. japonica BW -3.6 < 0.01
3.6 < 0.01
NA
WB 1.7 0.09
4.9 < 0.01
-2.0 0.05
-5.0 < 0.01
NA NA
WW -1.6 0.10
1.9 0.06
-3.2 < 0.01
1.8 0.07
-1.7 0.10
3.6 < 0.01
NA NA NA
Appendix 1: Emergence, diapause and survival (emergence + survival) post-hoc t-test results from translocation experiment. BB = pupae transferred from bottom to bottom (control), WW = wall to wall (control), BW = bottom to wall,

137
Appendix 1
Emergence Diapause SurvivalBB BW WB BB BW WB BB BW WB
D. melanogaster BW -2.1 0.04
WB 4.2 < 0.01
5.9 < 0.01
WW 4.6 < 0.01
-6.2 < 0.01
0.6 0.5
A. citri BW -5.7 < 0.01
5.2 < 0.01
3.0 < 0.01
WB 1.0 0.32
6.6 < 0.01
0.6 0.6
-6.2 < 0.01
1.1 0.29
-2.0 0.04
WW -4.9 < 0.01
0.9 0.34
-5.8 < 0.01
5.2 < 0.01
-0.2 0.84
6.2 < 0.01
4.0 < 0.01
1.3 0.19
3.2 < 0.01
A. persimilis BW 2.1 0.04
NA 1.4 0.18
WB -1.8 0.07
-3.6 < 0.01
NA NA -2.5 0.01
-3.7 < 0.01
WW -1.1 0.27
-3.0 < 0.01
0.7 0.47
NA NA NA -1.5 0.13
-2.7 < 0.01
1.1 0.30
A. tabida BW 6.9 < 0.01
-7.2 < 0.01
4.0 < 0.01
WB 2.6 0.01
- 3.4 < 0.01
-2.6 0.01
-4.5 < 0.01
2.3 0.03
-1.0 0.32
WW 5.4 < 0.01
0.57 0.57
3.1 < 0.01
-7.2 < 0.01
0.0 1
-4.5 < 0.01
3.3 < 0.01
0.55 0.58
1.3 0.21
A. japonica BW -3.6 < 0.01
3.6 < 0.01
NA
WB 1.7 0.09
4.9 < 0.01
-2.0 0.05
-5.0 < 0.01
NA NA
WW -1.6 0.10
1.9 0.06
-3.2 < 0.01
1.8 0.07
-1.7 0.10
3.6 < 0.01
NA NA NA
WB = wall to bottom, NA = not applicable (no significant treatment effect observerd). A. pleuralis is not depicted, because no significant treatment effects were observed for all three traits. Upper number = t-value, lower number = P-value.
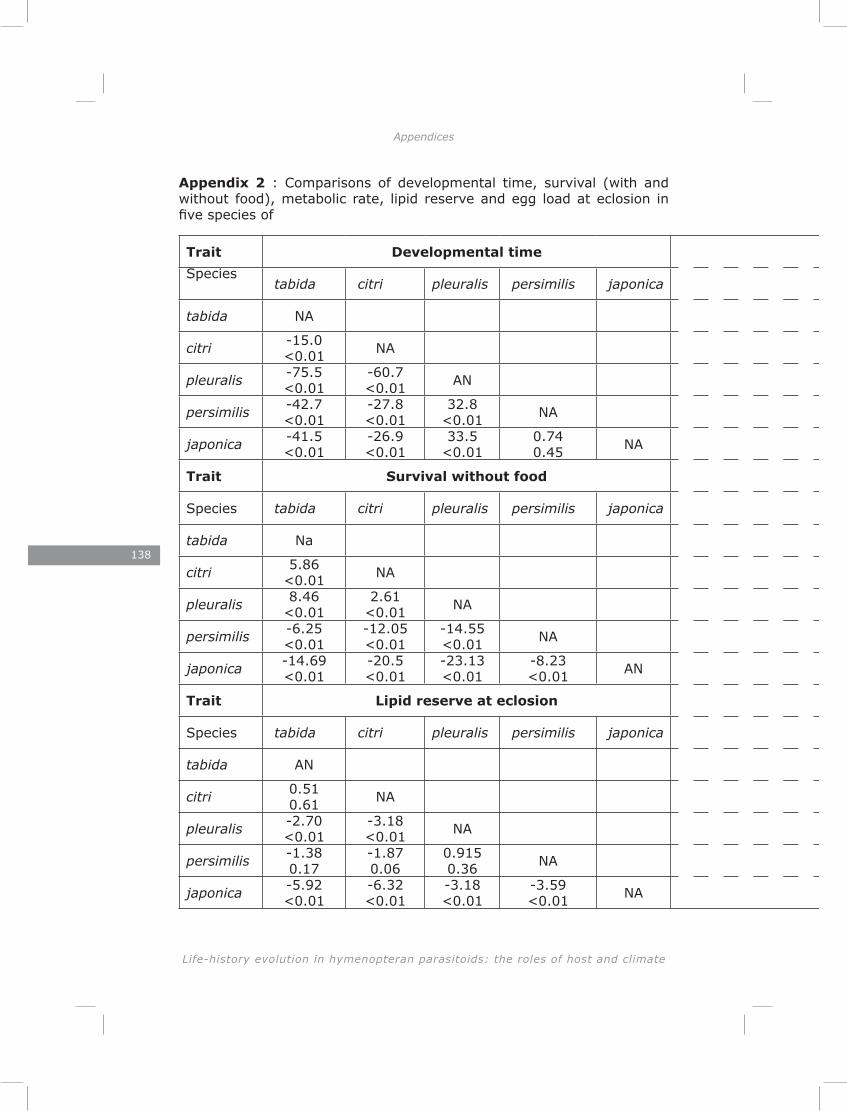
138
Life-history evolution in hymenopteran parasitoids: the roles of host and climate
Appendices Appendix 2
Trait Developmental time Survival with foodSpecies
tabida citri pleuralis persimilis japonica tabida citri pleuralis persimilis japonica
tabida NA NA
citri -15.0 <0.01 NA -1.09
0.27 NA
pleuralis -75.5 <0.01
-60.7 <0.01 AN -3.57
<0.01-2.14 0.013 NA
persimilis -42.7 <0.01
-27.8 <0.01
32.8 <0.01 NA -12.33
<0.01-11.23 <0.01
-8.74 <0.01 NA
japonica -41.5 <0.01
-26.9 <0.01
33.5 <0.01
0.74 0.45 NA -24.23
<0.01-23.11 <0.01
-20.65 <0.01
-11.9 <0.01 NA
Trait Survival without food Metabolic rate
Species tabida citri pleuralis persimilis japonica tabida citri pleuralis persimilis japonica
tabida Na NA
citri 5.86 <0.01 NA 8.66
<0.01 NA
pleuralis 8.46 <0.01
2.61 <0.01 NA -2.07
0.04-4.05 <0.01 NA
persimilis -6.25 <0.01
-12.05 <0.01
-14.55 <0.01 NA 6.01
<0.012.7
<0.015.71
<0.01 NA
japonica -14.69 <0.01
-20.5 <0.01
-23.13 <0.01
-8.23 <0.01 AN 9.85
<0.019.53
<0.0113.93 <0.01
7.91 <0.01 NA
Trait Lipid reserve at eclosion Egg load at eclosion
Species tabida citri pleuralis persimilis japonica tabida citri pleuralis persimilis japonica
tabida AN NA
citri 0.51 0.61 NA 3.09
<0.01 NA
pleuralis -2.70 <0.01
-3.18 <0.01 NA -4.32
<0.1-7.29 <0.01 NA
persimilis -1.38 0.17
-1.87 0.06
0.915 0.36 NA 8.28
<0.015.4
<0.0112.02 <0.01 NA
japonica -5.92 <0.01
-6.32 <0.01
-3.18 <0.01
-3.59 <0.01 NA -8.9
<0.01-11.7 <0.01
-4.56 <0.01
-16.09 <0.1 NA
Appendix 2 : Comparisons of developmental time, survival (with and without food), metabolic rate, lipid reserve and egg load at eclosion in five species of
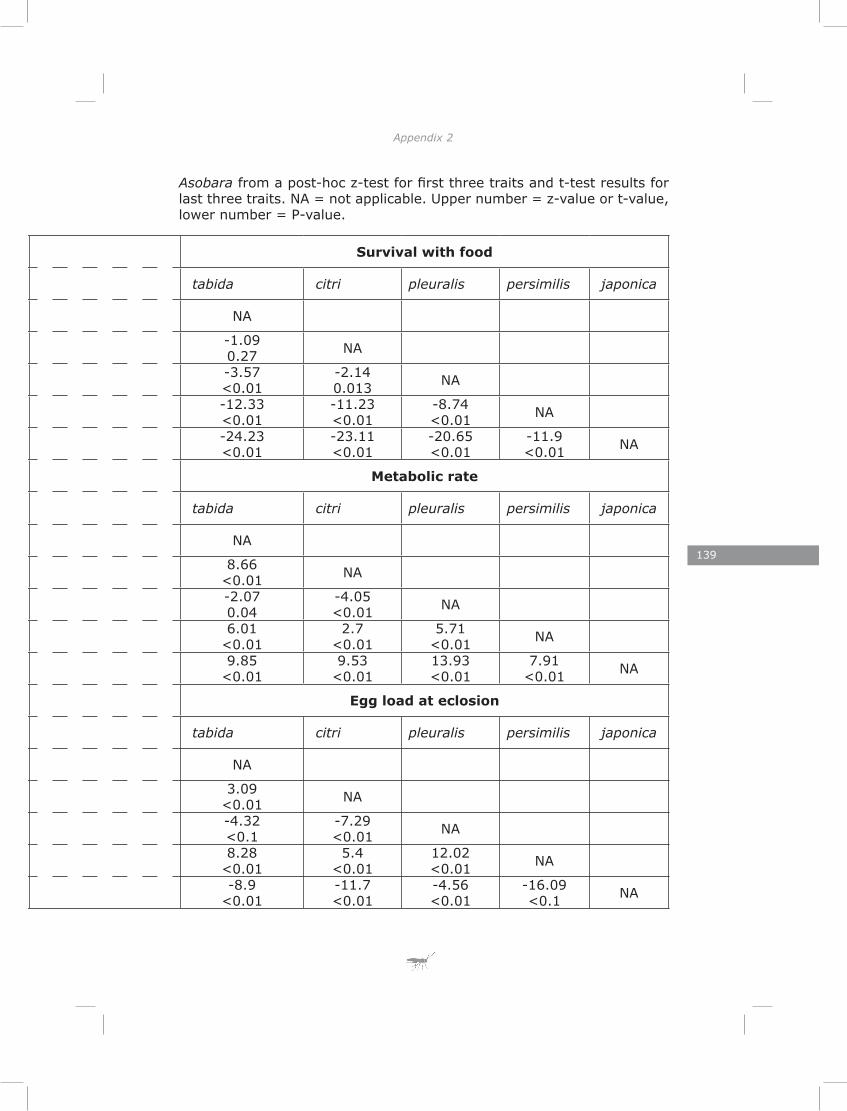
139
Appendix 2
Trait Developmental time Survival with foodSpecies
tabida citri pleuralis persimilis japonica tabida citri pleuralis persimilis japonica
tabida NA NA
citri -15.0 <0.01 NA -1.09
0.27 NA
pleuralis -75.5 <0.01
-60.7 <0.01 AN -3.57
<0.01-2.14 0.013 NA
persimilis -42.7 <0.01
-27.8 <0.01
32.8 <0.01 NA -12.33
<0.01-11.23 <0.01
-8.74 <0.01 NA
japonica -41.5 <0.01
-26.9 <0.01
33.5 <0.01
0.74 0.45 NA -24.23
<0.01-23.11 <0.01
-20.65 <0.01
-11.9 <0.01 NA
Trait Survival without food Metabolic rate
Species tabida citri pleuralis persimilis japonica tabida citri pleuralis persimilis japonica
tabida Na NA
citri 5.86 <0.01 NA 8.66
<0.01 NA
pleuralis 8.46 <0.01
2.61 <0.01 NA -2.07
0.04-4.05 <0.01 NA
persimilis -6.25 <0.01
-12.05 <0.01
-14.55 <0.01 NA 6.01
<0.012.7
<0.015.71
<0.01 NA
japonica -14.69 <0.01
-20.5 <0.01
-23.13 <0.01
-8.23 <0.01 AN 9.85
<0.019.53
<0.0113.93 <0.01
7.91 <0.01 NA
Trait Lipid reserve at eclosion Egg load at eclosion
Species tabida citri pleuralis persimilis japonica tabida citri pleuralis persimilis japonica
tabida AN NA
citri 0.51 0.61 NA 3.09
<0.01 NA
pleuralis -2.70 <0.01
-3.18 <0.01 NA -4.32
<0.1-7.29 <0.01 NA
persimilis -1.38 0.17
-1.87 0.06
0.915 0.36 NA 8.28
<0.015.4
<0.0112.02 <0.01 NA
japonica -5.92 <0.01
-6.32 <0.01
-3.18 <0.01
-3.59 <0.01 NA -8.9
<0.01-11.7 <0.01
-4.56 <0.01
-16.09 <0.1 NA
Asobara from a post-hoc z-test for first three traits and t-test results for last three traits. NA = not applicable. Upper number = z-value or t-value, lower number = P-value.
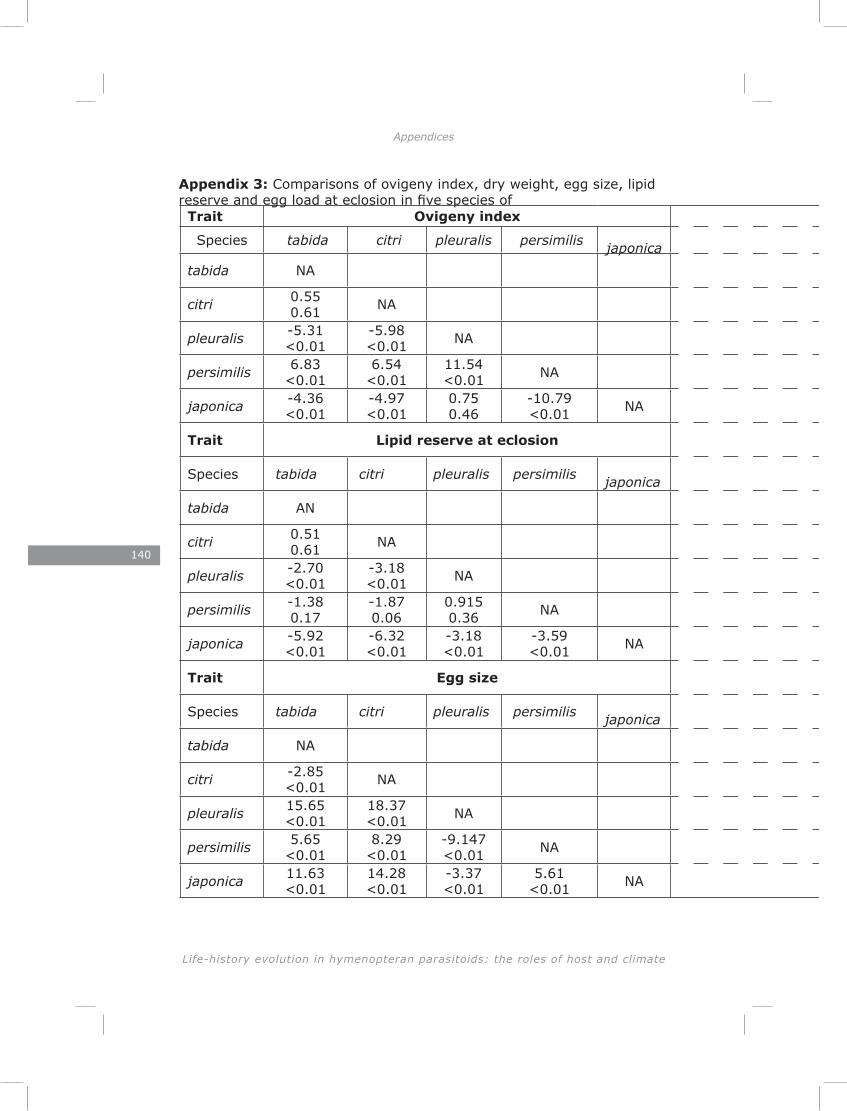
140
Life-history evolution in hymenopteran parasitoids: the roles of host and climate
Appendices Appendix 3
Trait Ovigeny index Dry weight
Species tabida citri pleuralis persimilis japonica tabida citri pleuralis persimilis japonica
tabida NA NA
citri 0.55 0.61 NA -1.68
0.09 NA
pleuralis -5.31 <0.01
-5.98 <0.01 NA -0.35
0.731.26 0.21 NA
persimilis 6.83 <0.01
6.54 <0.01
11.54 <0.01 NA -7.15
<0.01-5.59 <0.01
-6.57 <0.01 NA
japonica -4.36 <0.01
-4.97 <0.01
0.75 0.46
-10.79 <0.01 NA 0.62
0.542.18 0.03
0.93 0.35
7.28 <0.01 NA
Trait Lipid reserve at eclosion Egg load at eclosion
Species tabida citri pleuralis persimilis japonica tabida citri pleuralis persimilis japonica
tabida AN NA
citri 0.51 0.61 NA 3.09
<0.01 NA
pleuralis -2.70 <0.01
-3.18 <0.01 NA -4.32
<0.01-7.29 <0.01 NA
persimilis -1.38 0.17
-1.87 0.06
0.915 0.36 NA 8.28
<0.015.4
<0.0112.02 <0.01 NA
japonica -5.92 <0.01
-6.32 <0.01
-3.18 <0.01
-3.59 <0.01 NA -8.9
<0.01-11.7 <0.01
-4.56 <0.01
-16.09 <0.01 NA
Trait Egg size Egg mass
Species tabida citri pleuralis persimilis japonica tabida citri pleuralis persimilis japonica
tabida NA NA
citri -2.85 <0.01 NA -0.86
0.39 NA
pleuralis 15.65 <0.01
18.37 <0.01 NA 6.91
<0.017.73
<0.01 NA
persimilis 5.65 <0.01
8.29 <0.01
-9.147 <0.01 NA 10.0
<0.0110.79 <0.01
3.21 <0.01 NA
japonica 11.63 <0.01
14.28 <0.01
-3.37 <0.01
5.61 <0.01 NA -0.11
0.920.69 0.49
-6.54 <0.01
-9.47 <0.01 NA
Appendix 3: Comparisons of ovigeny index, dry weight, egg size, lipid reserve and egg load at eclosion in five species of
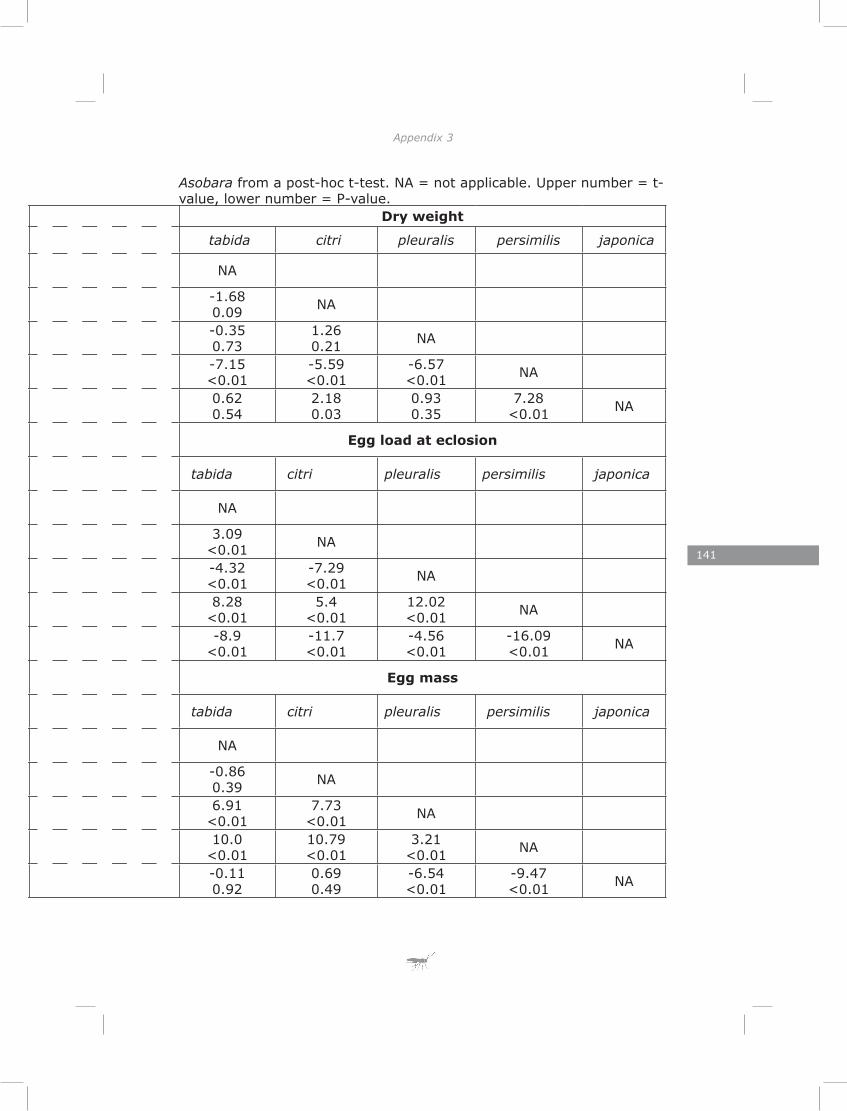
141
Appendix 3
Trait Ovigeny index Dry weight
Species tabida citri pleuralis persimilis japonica tabida citri pleuralis persimilis japonica
tabida NA NA
citri 0.55 0.61 NA -1.68
0.09 NA
pleuralis -5.31 <0.01
-5.98 <0.01 NA -0.35
0.731.26 0.21 NA
persimilis 6.83 <0.01
6.54 <0.01
11.54 <0.01 NA -7.15
<0.01-5.59 <0.01
-6.57 <0.01 NA
japonica -4.36 <0.01
-4.97 <0.01
0.75 0.46
-10.79 <0.01 NA 0.62
0.542.18 0.03
0.93 0.35
7.28 <0.01 NA
Trait Lipid reserve at eclosion Egg load at eclosion
Species tabida citri pleuralis persimilis japonica tabida citri pleuralis persimilis japonica
tabida AN NA
citri 0.51 0.61 NA 3.09
<0.01 NA
pleuralis -2.70 <0.01
-3.18 <0.01 NA -4.32
<0.01-7.29 <0.01 NA
persimilis -1.38 0.17
-1.87 0.06
0.915 0.36 NA 8.28
<0.015.4
<0.0112.02 <0.01 NA
japonica -5.92 <0.01
-6.32 <0.01
-3.18 <0.01
-3.59 <0.01 NA -8.9
<0.01-11.7 <0.01
-4.56 <0.01
-16.09 <0.01 NA
Trait Egg size Egg mass
Species tabida citri pleuralis persimilis japonica tabida citri pleuralis persimilis japonica
tabida NA NA
citri -2.85 <0.01 NA -0.86
0.39 NA
pleuralis 15.65 <0.01
18.37 <0.01 NA 6.91
<0.017.73
<0.01 NA
persimilis 5.65 <0.01
8.29 <0.01
-9.147 <0.01 NA 10.0
<0.0110.79 <0.01
3.21 <0.01 NA
japonica 11.63 <0.01
14.28 <0.01
-3.37 <0.01
5.61 <0.01 NA -0.11
0.920.69 0.49
-6.54 <0.01
-9.47 <0.01 NA
Asobara from a post-hoc t-test. NA = not applicable. Upper number = t-value, lower number = P-value.

143
C u r r i c u l u m V i t a e
Majeed Askari Seyahooei was born
on the 21st of January 1967 in Bandar
Abbas, Iran. He studied natural science and
finished his high school education at Ebne-
Sina high school in Bandar Abbas in June
1984. He started his university education
in September 1985 at Shiraz University and
finished an ASc in agricultural crop science
in Feb. 1988. He continued his study at
Shahid Chamran University and finished his
BSc in plant protection in July 1990 then
worked in the entomology lab in agricultural
research center of Hormozgan in south of
Iran. He started his MSc at Tarbiat Modares
University in Tehran and he finished his MSc
in June 1997. He worked as a researcher in
Agricultural Research Center of Hormozgan
as an entomologist for 6 years and two
years he served for two years as the head of
Agricultural Research Center in Hormozgan
province. Based on the virtue of his work
he was awarded with a grant to do his PhD
abroad in 2005 and he started his PhD in
Animal Ecology group in the Institute of
Biology in the Leiden University (IBL) in
October 2005.
