life expectancy and the environment
TRANSCRIPT

Life Expectancy and the Environment(In co-authorship with Fabio Mariani (UCL) and Natacha Raffin (Paris 1))
SALISES 11th Annual ConferencePort of Spain
Trinidad and TobagoMarch 24-26, 2010
Agustın Perez-Barahona
[email protected]://sites.google.com/site/agustinperezbarahona/
INRA and Ecole Polytechnique (France)

Motivation:
1.- Two-way causality between life expectancy and environmental quality:(John and Pecchenino (1994), Ono and Maeda (2001) and Jouvet et al. (2007)).
2.- Stylized facts:
Environmental quality : Environmental Performance Index (EPI) (YCELP (2006)).Life expectancy : Life expectancy at birth (2005) (UN (2007)).
Stylized 1 (SF1): Environmental quality is positively correlated with life expectancy.Correlation coef. 0.66 (statistically significant at the 1% level).
30 40 50 60 70
4050
6070
80
correlation
EPI
Life
exp
ecta
ncy
ALB
DZA
AGO
ARG
ARM
AUSAUT
AZE
BGD
BEL
BEN
BOL
BRABGR
BFA
BDI
KHM
CMR
CAN
CAF
TCD
CHL
CHN COL
COG
CRI
CIV
CUBCYP
CZE
COD
DNK
DOM
ECU
EGYSLV
ETH
FINFRA
GABGMB
GEO
DEU
GHA
GRC
GTM
GIN
GNB
HTI
HND
HUN
ISL
IND
IDN
IRN
IRLISR ITA
JAM
JPN
JOR
KAZ
KEN
KGZ
LAO
LBN
LBR
MDG
MWI
MYS
MLI
MRT
MEX
MDA
MNG
MAR
MOZ
MMR
NAM
NPL
NLD NZL
NIC
NERNGA
NOR
OMN
PAK
PAN
PNG
PRYPER PHL
POL
PRT
ROU
RUS
RWA
SAU
SEN
SLE
SVK
SVN
ZAF
KOR
ESP
LKA
SDN
SUR
SWZ
SWECHE
SYR
TJK
TZA
THA
TGO
TTO
TUN
TUR
TKM
UGA
UKR
ARE GBRUSA
UZB
VEN
VNM
YEM
ZMB ZWE
corr.coeff = 0.66
1

Stylized fact 2 (SF2): Environmental quality and life expectancy are bimodallydistributed. Hartigan’s dip test (Hartigan and Hartigan (1985)).
bandwidth=3.9EPI (2006)
Den
sity
30 40 50 60 70 80
0.00
00.
005
0.01
00.
015
0.02
00.
025
0.03
00.
035
bandwidth=4.3Life expectancy (2005)
Den
sity
30 40 50 60 70 80
0.00
0.01
0.02
0.03
0.04
Environmental trap: low life expectancy / low environmental quality.
Examples of environmental traps: linked with a reduction in life expectancy.
• Africa or ex-USSR: McMichael et al. (2004) and Patz et al. (2005).
• Easter Island: Diamond (2005) and de la Croix and Dottori (2008).
2
Benchmark model: theoretical framework (OLG) that allows us to reproduce SF1and SF2.
a) Two-way causality:
• Environmental conditions affect the survival probability: endogenous life ex-pectancy (π(et)).
• Agents invest in environmental quality depending on how much they expect tolive.
b) Environmental trap:
• Relationship between environmental quality and life expectancy: ecologicalthreshold effects (convex-concave π(et)).
– Natural sciences: Cakmak et al. (1999) and Scheffer et al. (2001).
– Economics: Baland and Platteau (1996) and Dasgupta and Maler (2003).
• Multiple steady state equilibria: initial conditions do matter.
3
1.- Preferences:
U(ct, et+1) = ln ct + πtγ ln et+1, with γ > 0 (1)
• πt = π(et), such that π′(et) > 0, limet→0 π(et) = π, limet→∞ π(et) = π and 0 < π <π ≤ 1 (medical and epidemiological literature).
2.- Budget constraint: wt is assumed to be exogenous (benchmark model).
wt = ct +mt (2)
3.- Law of motion of environmental quality: (John and Pecchenino (1994) andOno (2002)).
et+1 = (1− η)et + σmt − βct − λQt (3)
• β, σ, λ > 0 and 0 < η < 1. λQt > 0 (< 0): total impact of a harmful (beneficial)external effect (exogenous). et: inherited environmental quality.
• Agents cannot improve their own survival probability (crucial role of early lifehealth): Blackburn and Cipriani (2002), de la Croix and Licandro (2007), andCase and Paxson (2008).
4
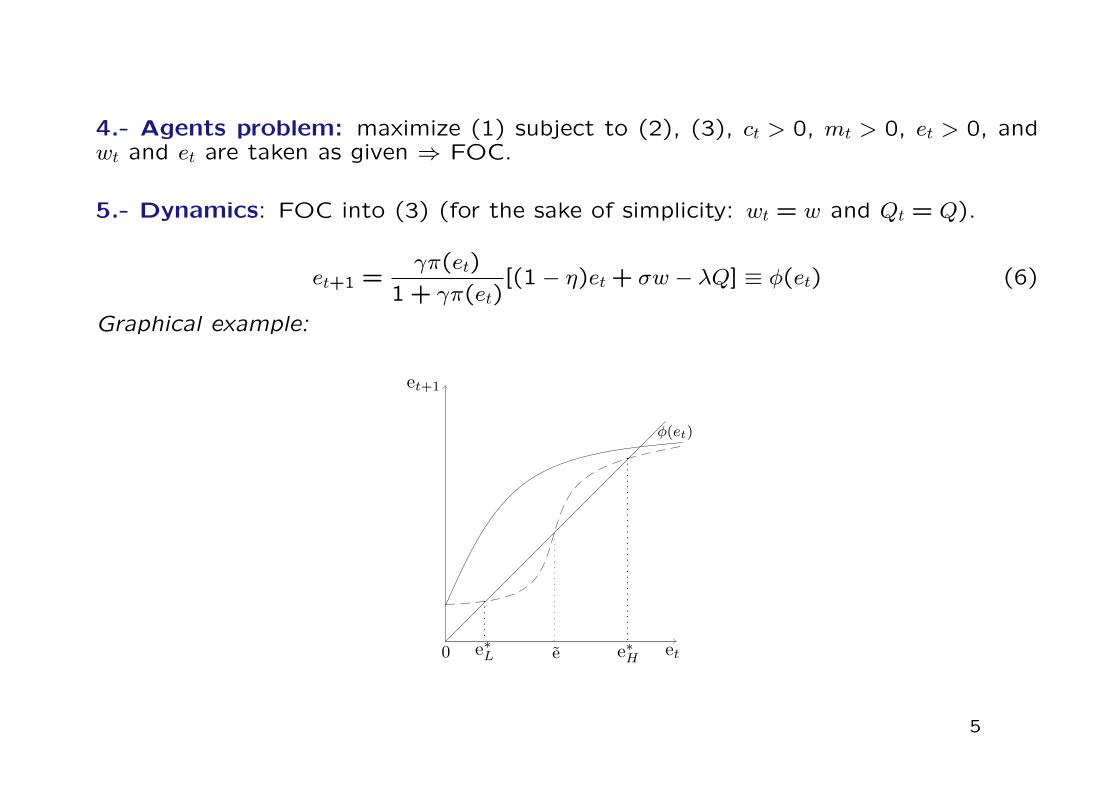
4.- Agents problem: maximize (1) subject to (2), (3), ct > 0, mt > 0, et > 0, andwt and et are taken as given ⇒ FOC.
5.- Dynamics: FOC into (3) (for the sake of simplicity: wt = w and Qt = Q).
et+1 =γπ(et)
1 + γπ(et)[(1− η)et + σw − λQ] ≡ φ(et) (6)
Graphical example:
0 et
et+1
e∗L e∗He
φ(et)
5

6.- Environmental trap: A convex-concave φ(et) might be generated by a convex-concave π(et) (Blackburn and Cipriani (2002)).
Analytical illustration: long term exposure to bad environmental conditions (Evansand Smith (2005).
π(et) =
{π if et < eπ if et ≥ e
(7)
et+1
et0
A
B
B′
φ(et) = et
e∗L e∗He
6

Main results: two-way causality between life exp. and env. quality + SF1 + SF2.
1.- Escaping the trap (1/2): medical technological progress: improvement inmedicine effectiveness (de la Croix and Sommacal (2008)).
– European Environment and Health Action Plan 2004-2010.
2.- Escaping the trap (2/2): reduction of harmful external effects on theenvironment (oil slicks, Chernobyl disaster, etc).
– Implementation of international agreements that promotes a worldwidereduction of pollution: Kyoto Protocol.
3.- Welfare analysis: environmental taxes:
– Inter-generational externality: external effects of agent choices on futuregenerations ⇒ (decentralized) economy is under-investing in environmentalmaintenance.
– Environmental taxes ⇒ optimal allocation (social planner solution).
– Social planner solution may imply the elimination of the environmental trap.
7

Conclusions:
1.- A model with: two-way causality between the life expectancy and the environ-mental quality + multiple equilibria.
2.- Environmental trap: convex-concave π(e)
• Benchmark model: low life expectancy / poor environmental quality.
• Model with physical or human (education) capital accumulation: de la Croixand Doepke (2003, 2004).
– Human capital: inter-generational altruism.
– Low life expectancy / poor environmental quality / low physical orhuman capital.
Extentions:
1.- Heterogeneous agents: environmental tastes.
2.- Demography: endogenous fertility and environmental quality.
3.- Fiscal policy: environmental taxes.
8