life cycle assessment of pilot-scale wood fibre production
TRANSCRIPT

PR
IFY
SG
OL
BA
NG
OR
/ B
AN
GO
R U
NIV
ER
SIT
Y
Life cycle assessment of pilot-scale wood fibre production usingmechanical disc refining at different pressuresSkinner, Campbell; Stefanowski, Bronia; Heathcote, Derek; Charlton, Adam;Ormondroyd, Graham
International Wood Products Journal
DOI:10.1080/20426445.2016.1200825
Published: 01/01/2016
Peer reviewed version
Cyswllt i'r cyhoeddiad / Link to publication
Dyfyniad o'r fersiwn a gyhoeddwyd / Citation for published version (APA):Skinner, C., Stefanowski, B., Heathcote, D., Charlton, A., & Ormondroyd, G. (2016). Life cycleassessment of pilot-scale wood fibre production using mechanical disc refining at differentpressures. International Wood Products Journal, 7(3), 149-155.https://doi.org/10.1080/20426445.2016.1200825
Hawliau Cyffredinol / General rightsCopyright and moral rights for the publications made accessible in the public portal are retained by the authors and/orother copyright owners and it is a condition of accessing publications that users recognise and abide by the legalrequirements associated with these rights.
• Users may download and print one copy of any publication from the public portal for the purpose of privatestudy or research. • You may not further distribute the material or use it for any profit-making activity or commercial gain • You may freely distribute the URL identifying the publication in the public portal ?
Take down policyIf you believe that this document breaches copyright please contact us providing details, and we will remove access tothe work immediately and investigate your claim.
01. Dec. 2021

Life Cycle Assessment of pilot scale wood fibre production using mechanical
disc refining at different pressures
Skinner Campbell1* Stefanowski Bronia K.1 Heathcote Derek1 Charlton Adam1
and Ormondroyd Graham A.1, 2
1 The BioComposites Centre, Bangor University, Bangor, LL57 2UW
2 Department of Architecture and Civil Engineering, University of Bath, Claverton Down,
Bath, BA2 7AY, UK
* Corresponding author [email protected], +44 (0) 1248 382605
Abstract
This paper assesses the environmental impact of pilot-scale wood fibre production
across a range of refining pressures using energy monitoring at an individual
component level. Under optimal refining conditions (8 bar refining pressure; 15µm
plate gap width), electricity use accounted for 88% of GHG emissions associated with
the fibre production, and was the dominant input in almost all other impact categories.
At an individual component level, the refiner, dryer fan and hot oil burner were the
most significant parts of the process (representing 30%, 20% and 16% of cradle-to-gate
GHGs respectively), while ancillary processes such as the air compressor (6.9%) and
dust extraction (6.3%) also made notable contributions. The analysis suggests that
energy efficiencies made with these key components may offer the best potential gains
in terms of the environmental profile of pressurised refining, as long as these can be
achieved without compromising yield or quality of the fibre produced.
Key words
Wood fibre, mechanical disc refining, pressurised refining, MDF, life cycle assessment,
LCA, energy use

1 Introduction
1.1 Pressurised mechanical disc refining
The mechanical disc refining of wood fibres at different pressures has been the subject
of research for many years, but this has primarily focused on the panel products
industry and the effect of the refiner pressures on the final board quality (Snell et al.,
2001; Krug and Kehr, 2001; Kelley et al., 2005; Xing et al., 2006; Källbom, et al., 2014;
Ormondroyd et al., 2016). Krug and Kehr (2001) suggested that increasing the steam
pressure results in shorter fibre lengths and lower strength and elastic properties while
improving long term swelling properties of the resulting boards. Roffael et al. (2001)
found that high pulping temperature results in lower thickness swelling and water
absorption with MDF panels. Xing et al. (2006) noted that the refining of juvenile tops of
black spruce (Picea mariana) at different pressures had considerable effect on the
modulus of elasticity, water absorption, thickness swelling and linear expansion of
boards made from this wood. They also found that the interaction between steam
pressure and retention time was significant for modulus of rupture. Ormondroyd et al.
(2016) assessed the use of changing refiner pressures to tune the surface energy of the
refined fibre, which in turn could allow an improvement in the compatibility of the fibre
to different resin types.
In addition to the production of wood fibre for MDF manufacture, there is increasing
recognition that the technology has other potential applications, for instance in the pre-
treatment of lignocellulosic biomass for the production of advanced biofuels. A range of
biomass pre-treatments have been developed to deconstruct the polymers (C6 and C5)
in lignocellulosic materials, for conversion into fermentable sugars (Kumar et al., 2009).
There are limitations to some of these techniques, including the high energy demands
required to achieve cell wall disruption and the formation of chemical species that
inhibit yeast growth (Jonsson and Martin, 2016), and which can reduce conversion
efficiencies of the downstream fermentation process. Optimizing pre-treatment is
therefore a key step in the commercial viability of many biotransformation processes
and remains a challenge in the production of advanced biofuels. Continuous pressurised
refining offers an alternative to more conventional pre-treatment technologies and
there are reports of the use of this approach in the pre-treatment of both hard and
softwood residues (Koo et al., 2011) and straw (Fang et al., 2011).

Whilst the primary role of changing the refiner pressure is, in the case of panel
production, to give the most appropriate fibre architecture, these changes will have an
effect on the energy requirements and will therefore affect both the economic and
environmental viability of the whole production process.
1.2 Life cycle assessment
Life cycle assessment (LCA) is a method by which the environmental impacts of
production can be quantified and evaluated. The approach is defined by the ISO 14040
and 14044 standards (International Organization for Standardization, 2006a; 2006b)
which set out a four stage process. By defining a production system (in LCA
terminology, a system boundary) and then compiling a comprehensive inventory of the
mass and energy balances across this system, environmental impact data can be linked
to each of the material and energetic flows. This inventory is then converted into an
environmental profile using one of a number of established Impact Assessment
methods. The resulting output covers a range of eco-indictors, spanning ecosystem
quality (e.g. climate change, eutrophication, acidification), human health factors (e.g.
particulate matter, photochemical oxidant formation) and resource depletion (water,
fossil fuels and metals). This kind of analysis is increasingly important to producers who
see consumers and policy makers drive a shift towards more sustainable production
and, in particular, a de-carbonisation of production systems.
In terms of wood panel production, LCA has previously been used in studies of MDF
(e.g. Rivela et al., 2007, Werner et al., 2007), oriented strand board (e.g. Kline et al.,
2005), particleboard (Rivela et al., 2006) and laminated veneer lumber production
(Wilson and Dancer, 2004). Xu et al. (2008) used the approach to assess a composite of
wood fibre and polypropylene, demonstrating that the composite performed better
than a functionally equivalent product consisting of polypropylene alone. Drawing
comparisons of products based on results published across different LCA reports can be
challenging though. Studies are typically geographically specific, may use different
assessment protocols, and can be based on a variety of sources for secondary data (Hill
et al., 2015). Environmental Product Declaration (EPD) schemes go some way to
addressing this by defining specific product category rules (PCRs) to unify the criteria
against which LCA studies are calculated for a given product sector. Using LCA data
drawn from the largest of these schemes, Hill (2015) compared greenhouse gas (GHG)
emissions and embodied energy associated with a given mass of a range of wood panel
products (specifically, fibreboard, particleboard, OSB, Glulam / laminated veneer
lumber and solid wood). The analysis showed considerable scatter within the results for
each product category but that, overall, fibreboard tended to have the highest results in
both impact categories. Further analysis of the impacts associated with fibreboard
production is therefore worthwhile.
Considering fibre production specifically, previous LCA research has only been
undertaken within a broader analysis of fibre-based panel production, most notably
MDF. These studies have shown that wood refining is the most energy intensive step of
the process, with fibre production accounting for over half of the total process energy
required for board manufacture (Werner et al., 2007). More specifically, Rivela et al.
(2007) demonstrated that their ‘wood preparation’ stage (consisting of all steps
associated with wood chip production and delivery, pressurised refining, resination and
drying) accounted for 94% of the fossil fuel requirement and 88% of GHG emissions
associated with industrial-scale MDF production. Another study, based on Canadian
MDF production (Athena, 2013) broke this down further. Their analysis found that
49.9% of cradle-to-gate GHGs (196 kg CO2 eq. per m³ MDF) were associated with on-site
wood preparation (i.e. debarking, chipping, refining, resination and blow-line operation
only) and 20.1% (79 kg CO2 eq. per m³ MDF) with drying.
It is therefore clear that fibre production and drying are the most energy and carbon
intensive stages of the MDF production process, however little or no published LCA data
exists to break this down into the various sub-processes within these two stages. This
limits the ability to understand which of these sub-processes are most important in
terms of their contribution to the whole, and therefore which represent the
environmental hotspots of the fibre production process. Additionally, it hinders
accurate modelling of the effects of altering specific refiner parameters (e.g. refiner
pressure, plate gap width and configuration, and feed screw settings) using only the
existing data.
This study reports data for wood fibre production and the effect that varying the refiner
pressure has on the LCA of the overall process. Trials were run at pilot-scale so the
results are not directly comparable with those of highly optimised industrial-scale
operations, however it remains interesting to understand how specific changes in

refining conditions may affect the overall environmental performance of this key
process in the MDF production pathway.
The functional unit of this study (i.e. the unit against which the results are calculated
and reported) was one kilogram of unresinated wood fibres at 9% moisture content
(equivalent to 0.917 kg oven dry weight). This is a typical moisture content for wood
fibre used in commercial MDF production and prior to resination. The system boundary
was extended back to the ‘cradle’ to encompass upstream forestry processes, delivery,
and preparation of wood chips, though there is also consideration of the shorter gate-
to-gate system, in terms of assessing the impacts of energy use when converting chips
to dried fibre (figure 1).
2 Materials and methods
2.1 Fibre production
A commercial mix of spruce, pine and fir chips was received from Kronospan (Chirk,
UK). The chips were in a green state with a moisture content of ~120%. The chips were
refined at the BioComposites Centre’s Bio-Refining Technology Transfer Centre (Mona,
Anglesey, UK). The refining was undertaken with an Andritz Sprout-Bauer 12-in
pressurised refiner. The refiner was fed from a hopper, through a plug screw feeder or
MSD (modular screw device) that moved the chips from the atmospheric to the desired
refining pressure. The chips were then fed into a cooker screw and then into a 60 litre
digester. The nominal residence time for the material in the cooker screw and in the
digester was 60 seconds. After this, the chips were fed through a screw feed into the
refining zone, consisting of two, 12 inch diameter refiner plates, with a parallel bar
configuration, where the fibre was formed. The refined fibres were then vented through
a blow line into the continuous flash dryer. The air velocity in the flash dryer was
approximately 51 m s-1, and the fibre residence time in the dryer was approximately
four seconds, resulting in an end moisture content of 8% -10%.
The refiner pressure in the cooker screw and digester were varied between 6, 8 and 10
bar. The refiner run was started at 6 bar and the system stabilised, fibre was produced
and stored before the pressure was raised to 8 bar, the refiner was then allowed to
stabilise and fibre was again produced. This was then repeated for the 10 bar run. In
each case, fibre was produced under steady state for 20 minutes at each setting and the

yield of fibre produced was recorded. All three trials were then repeated under the
same conditions using a lower feed screw speed. Finally a 40 minute trial at 8 bar, using
a shorter plate gap width (10µm) was performed to give a range of test conditions
(table 1).
2.2 Life cycle assessment
Throughout the trials, real-time electricity consumption was recorded for each piece of
machinery using hardwired OWL +USB energy monitors and associated data logging
devices. After the trials, data was downloaded using the proprietary software (OWL
Energy Monitoring Systems) and exported into Excel for analysis. The heat requirement,
for steam generation and fibre drying, was calculated theoretically owing to an absence
of isolated metering at the gas inlet pipes for these two pieces of machinery. This was
achieved based on the specific heat capacities of water and air and an assumed boiler
efficiency of 85% (U.S. EPA, 2008). In fact, while the pilot-scale plant used gas for heat
generation, industrial-scale panel production typically uses wood fuel (either from
waste generated on site or material that is bought in) as the primary fuel for this
purpose. Three heat generation scenarios where therefore modelled to reflect a) the
actual experimental condition, and b) the conditions more typically employed at an
industrial-scale, based on either average or state-of-the-art technology (table 1).
Water was consumed through two processes: as steam for the pressurised cooker
function and in a cooling capacity for the refiner plate seals. The quantity required as
steam varied with changing refiner pressure, but the seal cooling function used water at
a uniform rate, irrespective of refiner conditions or material throughput. The average
steam flow rate was therefore recorded directly for each trial to give pressure-specific
data for this function. The remaining water (for cooling) was attributed evenly across
each trial based on its duration.
Upstream processes were modelled using Ecoinvent v3 LCI data (table 2), accessed via
SimaPro v8 software (PRé Consultants B.V., 2014). Data for wood chip production
included all upstream forestry operations and was based on softwood forestry with
average European production and harvesting techniques. Transportation was modelled
to reflect the provenance of the wood used in this trial (in this case, 260 km by rail from
forest to manufacturer) since this was not considered to be untypical of European

norms. Electricity data was specific to medium voltage UK grid usage.
Material loss during the refining process was assumed to be 1% (Athena, 2013) and this
was assumed to be fed back into energy generation. Air emissions were not directly
modelled though a small amount of wood dust is thought to escape to air.
Lifecycle inventory data was then analysed using the ReCiPe v1.11 life cycle impact
assessment method (Goedkoop et al., 2008) at midpoint indicator level, using the
default hierarchist version. The Cumulative Energy Demand method (Frischknecht et
al., 2007) was used to provide additional insight into the non-renewable energy
demand of the system.
3 Results & discussion
Table 2 shows the experimental conditions for each trial alongside the recorded average
steam flow rate, total electricity consumption, yield, and electricity use as a function of
yield. It can be seen that yields varied from 11.9 – 12.2 kg per trial at the higher feed
screw setting and from 10.0 – 10.2 kg per trial at the lower setting. The yield was
highest when refining pressure was 8 bar and the plate gap width was 15µm, although
the differences in yield across the three pressure settings were small. The total
electricity demand ranged from 68.6 – 74.5 kWh per hour and was lowest when
operating at low feed screw speed and 10 bar of pressure. Given the higher yields
recorded at the higher feed screw setting, electricity consumption expressed as a
function of output favoured this condition, with both 8 and 10 bar scenarios consuming
2.0 kWh per kg wood fibre produced (at 6 bar the figure was 2.1 kWh). This is notably
higher than figures reported for commercial-scale operations (Xu et al., 2008 estimated
0.25 – 0.4 kWh per kg dry fibre, for example) and reflects the pilot-scale nature of the
system used here.
The average steam flow rate showed consistency across the 8 bar (173 - 174 L min-1)
and 10 bar (185 - 189 L min-1) trials, however it varied considerably for the 6 bar trials
(87 – 146 L min-1). This can be explained by the less cohesive nature of the plug that is
formed at lower pressures and the irregular flow of the material that ensues. In fact, an
earlier trial at 6 bar was abandoned when the lower pressure resulted in a blockage in
the blow line. The 6 bar results are therefore included here as a point of comparison.
Ormondroyd et al. (2016) showed that the lower the refiner pressure the lower the

surface energy of the fibres (which in turn affects the gullibility of the fibre) and the
higher the equilibrium moisture content of the fibre. They suggested that this was due
to varying stages of lignin movement with the differing refiner pressures.
A breakdown of electricity consumption (figure 2) shows that the refiner, dryer fan and
hot oil boiler were the most significant consumers of electricity in all trial conditions. In
the most efficient scenario (trial 2), the refiner accounted for 34% of total electricity
consumption, the dryer fan 22% and the hot oil boiler 19%. The air compressor (which
operates the valve for the oil pump), extractor fan and hot oil pump also made notable
contributions, representing 8%, 7% and 6% of total electricity usage respectively. The
steam boiler (3%) and cyclone rotary value (2%) made up the remaining fraction. When
considered on a functional basis, i.e. as either refining or drying operations (figure 1), it
can be seen that the refining operation accounts for 36% of electrical energy
consumption and the drying function 64%.
Figure 3 shows the effect of the heat generation scenario on the GHG emissions profile
of the overall process energy requirement. It can be seen that GHGs relating to heat
generation can vary from 54% of the total (as in the experimental condition, S1) to as
low as 6.3% in the more industrially-focused biomass based scenarios (S2 and S3). In
practice, S1 is only applicable to the pilot-scale processing facilities used here, so these
figures reinforce the position that electricity dominates the process energy GHG burden
of industrial-scale operation. However, it can also be seen that wherever biomass is
used to generate at least 15% of the heat requirement (as is easily the case in the two
industrial scenarios) then electricity usage becomes the most relevant factor in terms of
GHG emissions from process energy.
Extending the analysis to include the upstream processes involved in wood chip
production (including forestry) and delivery, it can be seen that the electricity demand
remains the most significant factor in terms of climate change impact (figure 4). Based
on the S3 analysis, electricity makes up 88% of cradle-to-grave GHG emissions, with
heat generation and the remaining inputs representing 5.9% each. This implies that
producers wishing to reduce their carbon footprints may achieve the best returns by
focusing in on the electrical hotspots within the production process, as well as on some
ancillary components that may not otherwise been seen as priorities in this regard (e.g.
dust extraction, air compression). Electricity used by the refiner, for example,

represents 30% of cradle-to-gate GHG emissions, followed by the dryer fan (20%), hot
oil burner (16%), air compressor (7%) and extractor fan (6%).
Looking at the full LCA results (table 4) it can be seen that the carbon footprint of the
production system varies from 1.5 – 2.9 kg CO2e per kg dried fibre at this scale,
depending on the heat generation scenario. As expected, this is higher than figures
reported for industrial-scale studies, which report figures of 0.64 kg CO2e (Athena,
2013) – 1.2 kg CO2e (Werner et al., 2007) per kg finished MDF (assuming a material
density of 615 kg m3 -1 at 8% water content (Rivela et al., 2007)). This reflects the pilot-
scale nature of the equipment used here and the optimization that is achievable through
scaling up to commercial levels of production. The non-renewable energy consumption
varied from 24 – 36 MJ kg-1 dried fibre, again depending on the heat scenario. When
considered in the whole, the environmental profile shows a pattern that largely mirrors
that of the grid electricity generation, reflecting the dominance of electricity as an input
in the production process. It should be noted that these figures are particular to UK
production, given the UK-specific grid electricity LCI data used in this analysis. The
carbon-intensity of grid electricity at a national level varies considerably across the EU
and beyond it (e.g. see DEFRA, 2015), so studies at other national levels should use data
particular to their grid.
4 Conclusion
The yields and total energy consumption recorded during this study are not intended to
be competitive with those reported for fully-optimised industrial-scale operations. The
equipment used here was a small pilot-scale plant used for research and development
scale-up work. However, the data presented in this study provides a more detailed
insight into the electrical demands during wood refining than is currently available
through the existing LCA data, and over a range of refiner pressures.
Key to establishing the role of electricity in the overall environmental profile of fibre
production is an understanding of the heat generation scenario employed. While the
pilot plant used 100% gas for this purpose, industrial refiners use either a mix of gas
and biomass (typically 38:62) or 100% biomass (in the most modern operations). By
modelling each of these scenarios, the results here have reiterated the dominance of
electricity in the environmental profile of industrial-scale fibre production.

In the 100% biomass scenario, and at the most efficient operating conditions (8 bar
refining pressure; 15µm plate gap width), electricity represented 88% of cradle-to-gate
GHGs emissions and was the major contributor to most of the other impact categories
(the exceptions being photochemical oxidant formation, agricultural land occupation
and water depletion).
At a component level, the analysis has shown that the refiner, dryer fan and hot oil
boiler are all key pieces of machinery in terms of electrical energy consumption
(representing 74% of usage collectively) and cradle-to-gate GHG emissions (66% of the
total collectively). Additionally, it has shown that ancillary processes, such as air
compression (8% electricity; 7% GHGs) and dust extraction (7% electricity; 6% GHGs)
should not be overlooked.
Variation in refining pressure resulted in small differences in overall energy
consumption at each setting, with 8 and 10 bar refining using a total of 2.0 kWh per kg
dried fibre and 6 bar refining using 2.1 kWh. Additional trials may now be beneficial to
establish whether this difference is significant or not. At a functional level, the usage
broke down as 36% from components involved in the refining process itself and 64%
from those involved in drying.
The analysis suggests the manufacturers wishing to improve the environmental
performance of their wood fibre production facilities should focus on key electricity
consuming components such as the refiner, dryer fan and hot oil boiler, and on other
significant ancillary processes such as dust extraction and air compression. These are
the components where percentage improvements in energetic performance offer the
greatest potential for environmental gain.
Acknowledgements
The research leading to these results has received funding from BEACON (funded by the
European Regional Development Fund and Welsh Government) and the European
Union's Seventh Framework Programme (FP7/2007-2013) for research, technological
development and demonstration under grant agreement no 609234.
References

Athena, 2013. A cradle-to-gate life cycle assessment of Canadian medium density fibreboard (MDF), 2013 update, Athena Sustainable Materials Institute, Ottawa, Canada.
CEN, 2012. Sustainability of construction works. Environmental product declarations. Core rules for the product category of construction products, Brussels, European Committee for Standardisation.
DEFRA, 2015. Greenhouse gas conversion factor repository. [online] Available at: http://www.ukconversionfactorscarbonsmart.co.uk [Accessed 25 November 2015].
Fang, H., Deng, J., Zhang, X. 2011. Continuous steam explosion of wheat straw by high pressure mechanical refining system to produce sugars for bioconversion, BioResources, 6, (4), 4468-4480.
Frischknecht, R., Jungbluth, N., Althaus, H. J., Doka, G., Dones, R., Hischier, R., Hellweg, S., Humbert, S., Margni, M., Nemecek, T., Spielmann, M. 2007. Implementation of Life Cycle Impact Assessment Methods: Data v2.0. ecoinvent report No. 3, Swiss Centre for Life Cycle Inventories, Dübendorf, Switzerland.
Goedkoop, M. J., Heijungs, R., Huijbregts, M., De Schryver, A., Struijs, J., Van Zelm, R. 2008). ReCiPe 2008, A life cycle impact assessment method which comprises harmonised category indicators at the midpoint and the endpoint level; First edition Report I: Characterisation. [online] Available at: http://www.lcia-recipe.net [Accessed 25 November 2015].
Hill, C. 2015. The environmental impact of wood compared to other building materials - the impact of European standard EN15804, in Proceedings of the International Panel Products Symposium, 7-8th October 2015, Llandudno, UK.
Hill, C., Norton, A., Kutnar, A. 2015. Environmental impacts of wood composites and legislative obligations, in Wood composites, (ed. M. Ansell), 311-333, Cambridge, Woodhead Publishing.
International Organization for Standardization, 2006a. ISO 14040 Environmental management – life cycle assessment – principles and framework, International Organization for Standardization, Geneva, Switzerland.
International Organization for Standardization, 2006b. ISO 14044 Environmental management – life cycle assessment – requirements and guidelines, International Organization for Standardization, Geneva, Switzerland.
Jonsson, L. J. and Martin, C. 2016. Pretreatment of lignocellulose: formation of inhibitory by-products and strategies for minimizing their effects, Bioresource Technol., 199, 103-112.

Källbom, S., Ormondroyd, G. A., Segerholm, B. K., Jones, D., Wålinder, M. E. P. 2014. Surface energy characteristics of fibres refined at different pressures, Northern European Wood Science and Technology Conference 2014, Edinburgh, UK.
Kelley, S. S., Elder, T., Groom, L. H. 2005. Changes in the chemical composition and spectroscopy of loblolly pine medium density fiberboard furnish as a function of age and refining pressure, Wood and Fiber Sci., 37, (1), 14-22.
Kline, E. D. 2004. Southeastern oriented strandboard production, CORRIM Phase I Final Report Module E. Life cycle environmental performance of renewable building materials in the context of residential construction, Seattle, University of Washington,
Koo, B. W., Treasure, T.H., Jameel, H., Phillips, R. B., Chang, H. M., Park, S. 2011. Reduction of enzyme dosage by oxygen delignification and mechanical refining for enzymatic hydrolysis of green liquor-pretreated hardwood, Appl. Biochem. Biotech., 165, (3-4), 832-844.
Krug, D., Kehr, E. 2001. Influence of high pulping pressures on permanent swelling-tempered medium density fibreboards, Holz als Roh- und Werkstoff, 59, (5), 342–343.
Kumar, P., Barrett, D. M., Delwiche, M.J., Stroeve, P. 2009. Methods for pretreatment of lignocellulosic biomass for efficient hydrolysis and biofuel production, Ind. Eng. Chem. Res., 48, 3713–3729.
Ormondroyd, G. A., Kallbom, S. K., Curling, S. F., Stefanowski, B. K., Segerholm, B. K., Walinder, M. E. P., Jones, D. 2016. Water sorption, surface structure and surface energy characteristics of wood composite fibres refined at different pressures, Wood Mater. Sci. Eng. In Press.
PRé Consultants B.V. 2014. SimaPro LCA software version 8. Amersfoort, Netherlands. [online] Available at: http://www.simapro.co.uk/ [Accessed 26 November 2015].
Rivela, B., Hospido, A., Moreira, M.T., Feijoo, G. 2006. Life cycle inventory of particleboard: a case study in the wood sector. Int. J. Life Cycle Assess., 11, 106–113.
Rivela, B., Moreira, M. T., Feijoo, G. 2007. Life Cycle Inventory of Medium Density Fibreboard, Int. J. Life Cycle Assess., 12, (3), 143-150.
Roffael, E., Dix, B., Schneider, T. 2001. Thermomechanical (TMP) and Chemo-Thermomechanical Pulps (CTMP) for Medium Density Fibreboard (MDF), Holzforschung, 55, (2), 214–218.
Snell, R., Groom, L. H., Rials, T. G. 2001. Characterizing the Surface Roughness of Thermomechanical Pulp Fibers with Atomic Force Microscopy, Holzforschung, 55, (5), 511-520.

U.S. EPA, 2008. Climate Leaders Greenhouse Gas Inventory Protocol Offset Project Methodology for Industrial Boiler Efficiency, United States Environment Protection Agency, EPA400-S-08-001.
Weidema, B. P., Bauer, Ch., Hischier, R., Mutel, Ch., Nemecek, T., Reinhard, J., Vadenbo, C. O., Wernet, G. 2013. The ecoinvent database: overview and methodology, data quality guideline for the ecoinvent database version 3. [online]
Available at: www.ecoinvent.org [Accessed 26 November 2015].
Werner, F., Althaus, H-J., Künniger, T., Richter, K. 2007. Life cycle inventories of wood as fuel and construction material. Ecoinvent report no. 9, Swiss Centre for Life Cycle Inventories, Dübendorf, Switzerland.
Wilson, J.B. and Dancer, E.R. 2004. Laminated veneer lumber – Pacific Northwest and Southeast, CORRIM Phase I Final Report Module H: http://www.corrim.org/pubs/reports/2005/Phase1/Module_H_Final.pdf [Accessed 25 January 2016].
Xing, C., Deng, J., Zhang, S. Y., Riedl, B., Cloutier, A. 2006. Properties of MDF from black spruce tops as affected by thermomechanical refining conditions, Holz als Roh- und Werkstoff, 64, (6), 507–512.
Xu, X., Jayaraman, K., Morin, C., Pecqueux, N. 2008. Life cycle assessment of wood-fibre-reinforced polypropylene composites, J. Mater. Process. Tech., 198, 168-177.
Figure and table captions
Figure 1. System boundary of the modelled wood fibre production process. Dotted
line shows the shorter gate-to-gate processes of refining wood chips in to dried fibre.
MSD = modular screw device.
Table 1: Modelled heat generation scenarios
Table 2: Life cycle inventory data sources
Table 3: Experimental conditions with average steam flow rate, yield and electrical
energy consumption
Figure 2: Comparison and breakdown of electricity usage across the different refiner
trials
Figure 3: GHG emissions associated with heat generation, relative to electrical energy
consumption, based on three heat generation scenarios (S1 = 100% nat. gas; S2 = 38%

nat. gas, 62% biomass; S3 = 100% biomass)
Figure 4: Breakdown of GHG emissions associated with pilot-scale production of 1 kg
wood fibre at 8 bar (trial 2 conditions) using heat scenario 3 (100% biomass). (Data for
wood chips includes all upstream forestry operations)
Table 4: Cradle-to-gate LCA results for pilot-scale production of 1 kg wood fibre at 8 bar
(trial 2 conditions) using ReCiPe and Cumulative Energy Demand mid-point categories
and three heat generation scenarios (S1: 100% nat. gas; S2: 38% nat. gas, 62% biomass;
S3: 100% biomass)
Figures
[See as separate files]
Tables
Table 1: Modelled heat generation scenarios
Scenario Description Fuel mix Detail Reference
1 Pilot-scale production
100% nat. gas Primary data collection …
2 Industrial mix 1 38% nat. gas, 62% biomass
Weighted average production of European Panel Federation members
Werner et al., 2007
3 Industrial mix 2 100% biomass State-of-the-art facilities in Spain (2) and Chile (1), production capacity 150,000m3 pa
Rivela et al., 2007
Table 2: Life cycle inventory data sources
Input Unit ecoinvent dataset
Wood chips* kg Wood chips, wet, measured as dry mass, RER
Electricity kWh Electricity, medium voltage, GB
Heat, natural gas MJ Heat, central or small-scale, natrual gas, Europe excl. CH,
Heat, biomass MJ Wood chips, from industry, softwood, burned in furnace 50kW, CH
Transport tkm Freight train, Europe excl. CH
Water kg Tap water, Europe excl. CH
* Data for wood chips includes upstream forestry operations
Table 3: Experimental conditions with average steam flow rate, yield and electrical energy

consumption
Trial P
(bar)
Time (min
s)
Feed screw speed
(low/high)
Plate gap
width (µm)
Ave steam
flow rate (L min-1)
Total electricity use (kWh)
Yield
(kg)
Electricity use by yield (kWh
kg-1 fibre)
1 6 20 H 15 145.8 24.8 11.9 2.1
2 8 20 H 15 173.8 24.0 12.2 2.0
3 10 20 H 15 189.1 24.0 11.9 2.0
4 6 20 L 15 87.4 24.2 10.0 2.4
5 8 20 L 15 172.9 24.4 10.1 2.4
6 10 20 L 15 185.2 22.9 10.2 2.2
7 8 40 L 10 159.0 46.2 21.0 2.2
Table 4: Cradle-to-gate LCA results for pilot-scale production of 1 kg wood fibre at 8 bar (trial 2
conditions) using ReCiPe and Cumulative Energy Demand mid-point categories and three heat
generation scenarios (S1: 100% nat. gas; S2: 38% nat. gas, 62% biomass; S3: 100% biomass)
Impact category Unit S1 S2 S3
Climate change kg CO2 eq 2.9E+00 2.0E+00 1.5E+00
Ozone depletion kg CFC-11 eq 1.8E-07 1.2E-07 9.3E-08
Terrestrial acidification kg SO2 eq 1.0E-02 8.5E-03 7.3E-03
Freshwater eutrophication kg P eq 4.3E-04 4.4E-04 4.5E-04
Marine eutrophication kg N eq 2.2E-02 2.2E-02 2.1E-02
Human toxicity kg 1,4-DB eq 4.2E-01 4.3E-01 4.3E-01
Photochemical oxidant formation kg NMVOC 5.2E-03 5.6E-03 5.9E-03
Particulate matter formation kg PM10 eq 2.8E-03 3.0E-03 3.1E-03
Terrestrial ecotoxicity kg 1,4-DB eq 2.2E-04 2.1E-04 2.0E-04
Freshwater ecotoxicity kg 1,4-DB eq 2.3E-02 1.9E-02 1.6E-02
Marine ecotoxicity kg 1,4-DB eq 1.8E-02 1.7E-02 1.6E-02
Ionising radiation kBq U235 eq 4.4E-01 4.7E-01 4.8E-01
Agricultural land occupation m2a 2.5E+00 2.7E+00 2.8E+00
Urban land occupation m2a 3.4E-02 3.8E-02 4.0E-02
Natural land transformation m2 5.1E-04 4.5E-04 4.1E-04
Water depletion m3 3.5E-02 4.1E-02 4.5E-02
Metal depletion kg Fe eq 4.6E-02 4.0E-02 3.6E-02
Non-renewable energy* MJ 3.6E+01 2.9E+01 2.4E+01

Figure 1. System boundary of the modelled wood fibre production process. Dotted line shows the shorter gate-to-gate processes of refining wood chips in to dried fibre.
Figure 2: Comparison and breakdown of electricity usage across the different refiner trials.
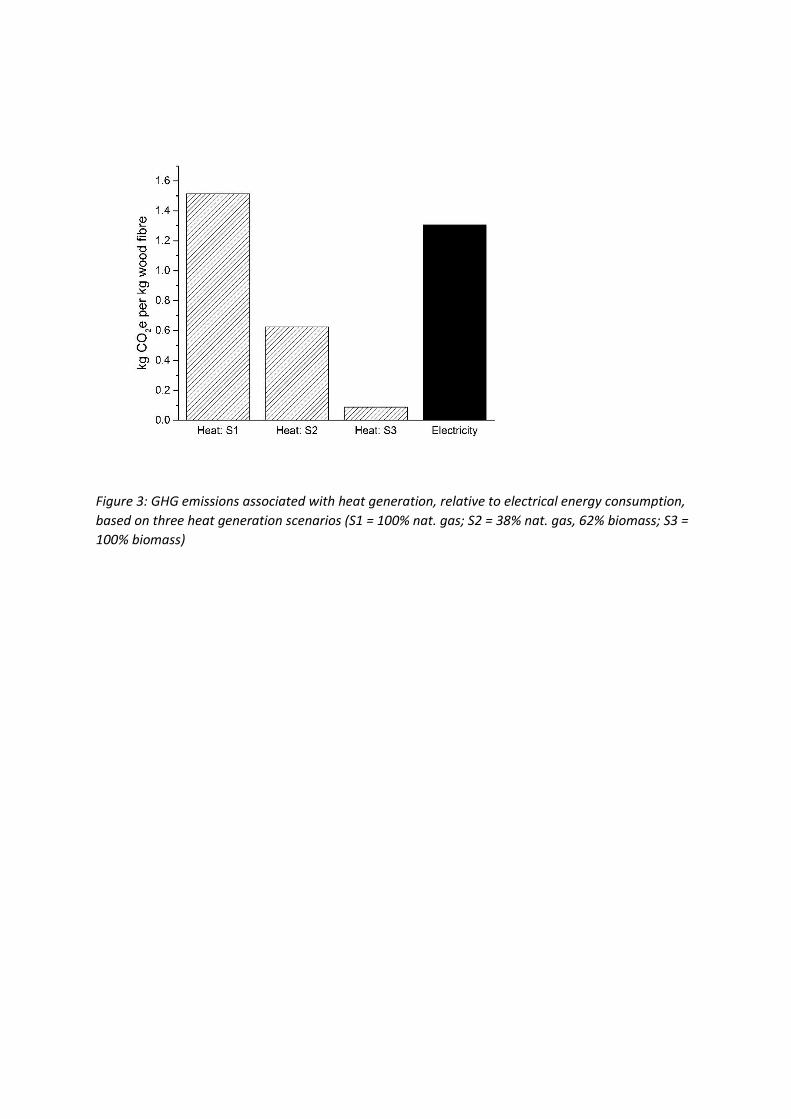
Figure 3: GHG emissions associated with heat generation, relative to electrical energy consumption,
based on three heat generation scenarios (S1 = 100% nat. gas; S2 = 38% nat. gas, 62% biomass; S3 =
100% biomass)
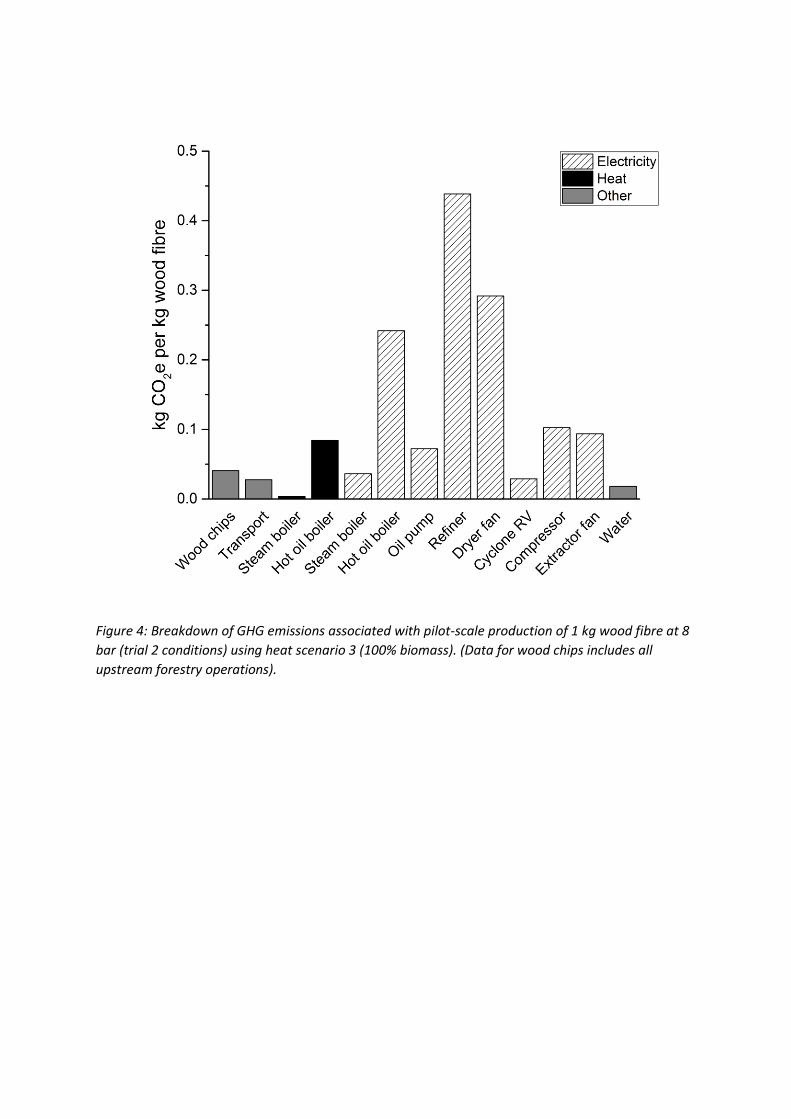
Figure 4: Breakdown of GHG emissions associated with pilot-scale production of 1 kg wood fibre at 8
bar (trial 2 conditions) using heat scenario 3 (100% biomass). (Data for wood chips includes all
upstream forestry operations).