life cycle assessment of high-sea fish and salmon...
TRANSCRIPT
Uster, May 2011 Practical training report
25.05.11 15:09 \\Server\E\ESU-Docs\Projekte laufend\084 ESU LCI database\LCI Daten ESU\Food\fish\Fish-report - high sea + salmon\Bericht\buchspies-2011-LCA-fish.docx
ESU-services Ltd. Kanzleistrasse 4 CH - 8610 UsterRolf Frischknecht T +41 44 940 61 91 [email protected] Jungbluth T +41 44 940 61 32 [email protected] Büsser T +41 44 940 61 35 [email protected] Karin Flury T +41 44 940 61 02 [email protected] René Itten T +41 44 940 61 38 [email protected] Matthias Stucki T +41 44 940 67 94 [email protected] F +41 44 940 61 94
Life Cycle Assessment of High-Sea Fish and Salmon
Aquaculture
Benedikt Buchspies
Sunnie J. Tölle
Niels Jungbluth
ESU-services Ltd.
Imprint
Title Life Cycle Assessment of High-Sea Fish and Salmon Aquaculture
Authors Benedikt Buchspies, Sunnie Tölle, Niels Jungbluth
ESU-services Ltd., fair consulting in sustainability
Kanzleistr. 4, CH-8610 Uster
www.esu-services.ch
Phone 044 940 61 32, Fax +41 44 940 61 94
About us ESU-services Ltd. has been founded in 1998. Its core objectives are consulting, coaching, training
and research in the fields of Life Cycle Assessment (LCA), carbon footprints, water footprint in the
sectors energy, civil engineering, basic minerals, chemicals, packaging, telecommunication, food
and lifestyles. Fairness, independence and transparency are substantial characteristics of our con-
sulting philosophy. We work issue-related and accomplish our analyses without prejudice. We doc-
ument our studies and work transparency and comprehensibly. We offer a fair and competent con-
sultation, which makes it for the clients possible to control and continuously improve their environ-
mental performance. The company worked and works for various national and international com-
panies, associations and authorities. In some areas, team members of ESU-services performed
pioneering work such as development and operation of web based LCA databases or quantifying
environmental impacts of food and lifestyles.
Copyright All content provided in this report is copyrighted, except when noted otherwise. Such information
must not be copied or distributed, in whole or in part, without prior written consent of ESU-services
Ltd.. This report is provided on the website www.esu-services.ch. A provision of this report or of
files and information from this report on other websites is not permitted. Any other means of distri-
bution, even in altered forms, require the written consent. Any citation naming ESU-services Ltd. or
the authors of this report shall be provided to the authors before publication for verification.
Liability Statement Information contained herein have been compiled or arrived from sources believed to be reliable.
Nevertheless, the authors or their organizations do not accept liability for any loss or damage aris-
ing from the use thereof. Using the given information is strictly your own responsibility.
Version buchspies-2011-LCA-fish.docx, 25.05.2011 15:09:00

Life Cycle Assessment of High-Sea Fish and Salmon Aquaculture - i - 25/05/2011 15:09
Abstract
The aim of this study is to assess environmental impacts of different fish products sold in Swiss su-
permarkets. The defined functional unit is one kg of frozen cod, canned mackerel, canned herring or
smoked salmon. The former three are caught and processed in Denmark; the latter is farmed and pro-
cessed in Norway. To evaluate environmental impacts, the ecological scarcity method 2006 and global
warming potential 2007 are used. Furthermore, results are compared to several meat products.
When comparing the results with the ecological scarcity method 2006, high sea fish is at the lower end
of range for all compared products. Fishing and packaging are main determinant in regard to environ-
mental impacts of high sea fishing. Salomon’s environmental impacts are nearly as high as those of
veal. Feed production and the nutrient emissions into the sea are quite important for the total environ-
mental impacts. In regard to the global warming potential, fish offers an alternative to meat. Depend-
ing on the type of fish, emission per kg of filet range between 3.7 and 6.6 kg CO2-eq. For farmed
salmon indirect dinitrogen monoxide emissions from nutrient emissions need to be considered. Fish
cannot be regarded generally as a more environmentally friendly food product than meat, because en-
vironmental impacts of different fish products might be quite variable and be even higher than these of
meat.
Kurzfassung
Ziel dieser Studie ist es die Umwelteinflüsse verschiedener, in der Schweiz verkaufter, Fischprodukte
zu quantifizieren. Die Untersuchten Produkte sind tiefgefrorener Kabeljau, Hering und Makrele in Öl,
sowie geräucherter Lachs. Kabeljau, Makrele und Hering werden in Dänemark gefangen und verarbei-
tet. Der Lachs stammt aus einer norwegischen Aquakultur und wird ebenfalls in Norwegen verarbeitet.
Alle Fischprodukte werden dann zu Schweizer Supermärkten transportiert, dort gelagert und verkauft.
Die Umwelteinwirkungen werden anhand der Methode der ökologischen Knappheit 2006 (ecological
scarcity 2006) sowie dem Treibhauspotential 2007 (global warming potential 2007) quantifiziert und
verglichen. Um die Ergebnisse besser einordnen zu können, werden diese mit verschiedenen Fleisch-
produkten verglichen.
Die Ergebnisse der Methode der ökologischen Knappheit 2006 zeigen, dass gefangener Fisch ver-
gleichsweise geringe Umwelteinwirkungen verursacht. Der Großteil der Umwelteinwirkungen wird
durch den Fang und bei Hering und Makrele durch die Verpackung (Aluminiumdose) verursacht. Im
Gegensatz dazu verursacht der gezüchtete Lachs Umwelteinwirkungen, die fast so hoch sind, wie die
von Kalbfleisch. Ein Großteil dieser Belastungen stammt aus der Futtermittelherstellung und von
Nährstoffemissionen. Betrachtet man das Treibhauspotential, so zeigt sich, dass Fisch eine Alternative
zu Fleischprodukten bietet: Die Treibhausgasemissionen der Fischprodukte liegen zwischen 3.7 und
6.6 kg CO2 Äquivalenten. Ein großer Teil der Emissionen von Fisch aus der Hochseefischerei stammt
aus den Dieselmotoren der Fischerboote. Im Falle des gezüchteten Lachs spielen indirekte Treibhaus-
gasemissionen aus emittierten Nährstoffen eine wichtige Rolle. Zusammenfassend kann festgestellt
werden, dass Fisch im Vergleich zu Fleischprodukten etwas geringe Mengen an Treibhausgasen ver-
ursacht. Jedoch gibt es weitere Faktoren, wie z.B. Überfischung, (Zer-)Störung von Ökosystemen,
usw., die bei der Betrachtung der Umwelteinflüsse eine wichtige Rolle spielen. Deshalb kann nicht
pauschal darauf geschlossen werden, dass Fisch eine umweltfreundliche Alternative zu Fleisch dar-
stellt.
Acknowledgements
This report has been written during a practical training at ESU-services Ltd.. I owe thanks to Niels
Jungbluth for his supervision and helpful guidance and Sunnie Toelle for her previous work on high-
sea fishery products. Her work is the basis for the assessment of high-sea fishery products carried out
in this report. Furthermore, I thank Friederike Ziegler and Ian Vázquez-Rowe for contributing im-
portant data to this report.

Life Cycle Assessment of High-Sea Fish and Salmon Aquaculture - ii - 25/05/2011 15:09
Table of Contents
IMPRINT .......................................................................................................................... I
ABSTRACT ..................................................................................................................... I
KURZFASSUNG ............................................................................................................... I
ACKNOWLEDGEMENTS .................................................................................................... I
TABLE OF CONTENTS ..................................................................................................... II
1 LIFE CYCLE ASSESSMENT (LCA) METHODOLOGY .................................................... 1
2 GOAL AND SCOPE .................................................................................................. 3
2.1 Outline of the Study .............................................................................................................. 3
2.2 Functional Unit ...................................................................................................................... 3
2.3 System Boundaries ................................................................................................................ 4
2.4 Scenarios Investigated ........................................................................................................... 5 2.4.1 High sea fish .......................................................................................................................... 5 2.4.2 Farmed Salmon ..................................................................................................................... 5
2.5 Allocation .............................................................................................................................. 5
2.6 Life Cycle Impact Assessment Methods ............................................................................... 6
3 LIFE CYCLE INVENTORY ANALYSIS........................................................................... 7
3.1 High Sea fishing .................................................................................................................... 7 3.1.1 Global overview .................................................................................................................... 7 3.1.2 High Sea Fishing in Denmark ............................................................................................... 7
3.2 Salmon aquaculture ............................................................................................................... 8 3.2.1 Global overview .................................................................................................................... 8 3.2.2 Salmon aquaculture in Norway ............................................................................................. 8
4 LIFE CYCLE IMPACT ASSESSMENT ........................................................................... 9
4.1 Ecological Scarcity 2006 Method ......................................................................................... 9
4.2 Global Warming Potential 2007 .......................................................................................... 12
4.3 Comparison between Fish and Meat ................................................................................... 13 4.3.1 Eco Scarcity 2006................................................................................................................ 13 4.3.2 Global Warming Potential 2007 .......................................................................................... 15
5 RECOMMENDATIONS ............................................................................................. 17
5.1 Policy Recommendations .................................................................................................... 17
5.2 Consumer Recommendations .............................................................................................. 17
5.3 Research Recommendations................................................................................................ 18
6 BIBLIOGRAPHY ..................................................................................................... 19
7 ANNEXE LCIA METHODS ....................................................................................... 21
7.1 Global Warming Potential 2007 (GWP) ............................................................................. 21
7.2 Ecological Scarcity 2006 ..................................................................................................... 21
8 DETAILED LIFE CYCLE INVENTORY ANALYSIS (CONFIDENTIAL ANNEXE) ................... 22
8.1 Inventory description of High Sea Fishing Activity on the Northeast Atlantic and product
distribution ..................................................................................................................................... 22

Life Cycle Assessment of High-Sea Fish and Salmon Aquaculture - iii - 25/05/2011 15:09
8.1.1 Fishing Gear ........................................................................................................................ 22 8.1.2 Fishing Vessel ..................................................................................................................... 22 8.1.3 Ice Machine ......................................................................................................................... 23 8.1.4 Codfish at Harbour .............................................................................................................. 23 8.1.5 Mackerel at Harbour ............................................................................................................ 25 8.1.6 Herring at Harbour .............................................................................................................. 26 8.1.7 Cod, Mackerel and Herring processing ............................................................................... 27 8.1.8 Cod, Mackerel, Herring and Fish at supermarket ................................................................ 29
8.2 Inventory description of Salmon aquaculture in Norway .................................................... 30 8.2.1 Fish feed production ............................................................................................................ 30 8.2.2 Freshwater phase - Hatchery ............................................................................................... 31 8.2.3 Saltwater phase – floating net-pen ...................................................................................... 32 8.2.4 Salmon processing............................................................................................................... 33 8.2.5 Salmon at supermarket ........................................................................................................ 34
8.3 Allocation ............................................................................................................................ 35
1. Life Cycle Assessment (LCA) Methodology
Life Cycle Assessment of High-Sea Fish and Salmon Aquaculture - 1 - 25/05/2011 15:09
1 Life Cycle Assessment (LCA) Methodology The life cycle assessment (LCA) – sometimes also called ecobalance – is a method to assess the envi-
ronmental impacts of a product1. The LCA is based on a perspective which includes the whole life cy-
cle. Hence, the environmental impacts of a product are evaluated from cradle to grave, which means
from the resource extraction up to the disposal of the product and also the production wastes.
The International Organization for Standardization (ISO) has standardised the general procedure of
conducting an LCA in ISO 14040 (International Organization for Standardization (ISO) 2006a) and
ISO 14044 (International Organization for Standardization (ISO) 2006b).
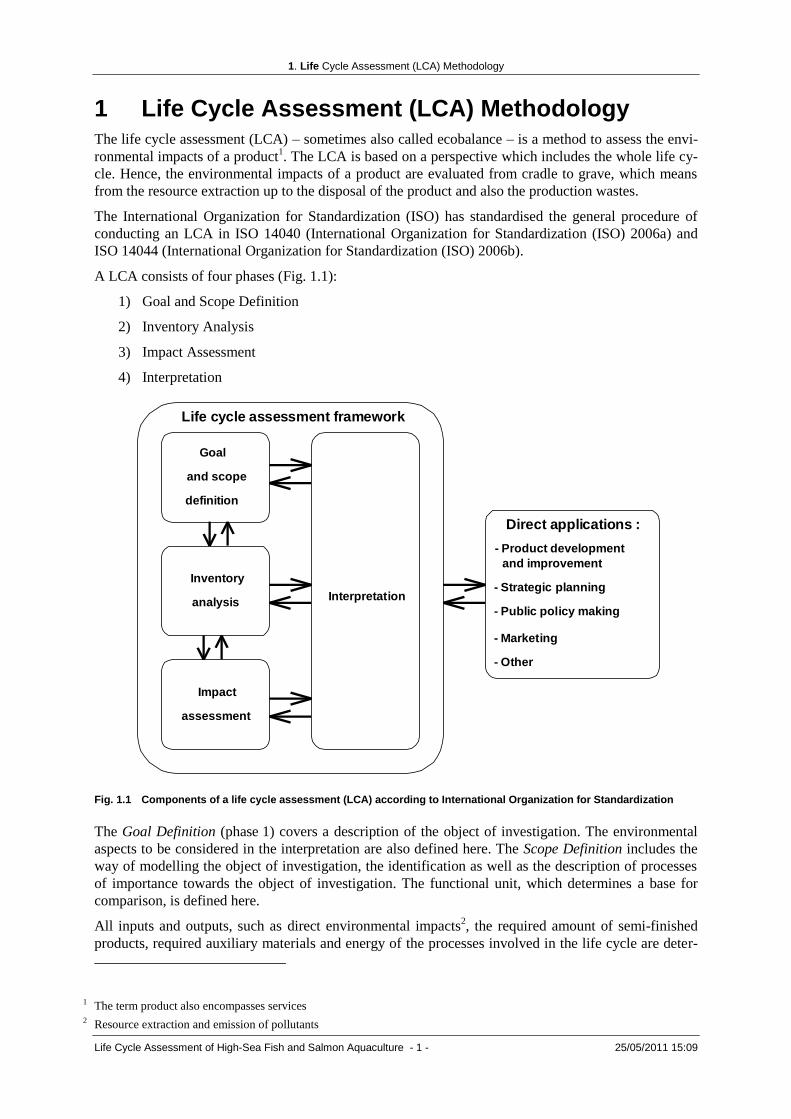
A LCA consists of four phases (Fig. 1.1):
1) Goal and Scope Definition
2) Inventory Analysis
3) Impact Assessment
4) Interpretation
Fig. 1.1 Components of a life cycle assessment (LCA) according to International Organization for Standardization
The Goal Definition (phase 1) covers a description of the object of investigation. The environmental
aspects to be considered in the interpretation are also defined here. The Scope Definition includes the
way of modelling the object of investigation, the identification as well as the description of processes
of importance towards the object of investigation. The functional unit, which determines a base for
comparison, is defined here.
All inputs and outputs, such as direct environmental impacts2, the required amount of semi-finished
products, required auxiliary materials and energy of the processes involved in the life cycle are deter-
1 The term product also encompasses services 2 Resource extraction and emission of pollutants
Goal
definition
and scope
Inventory
analysis
Impact
assessment
Interpretation
Life cycle assessment framework
Direct applications :
- Product development
- Marketing
and improvement
- Strategic planning
- Other
- Public policy making

1. Life Cycle Assessment (LCA) Methodology
Life Cycle Assessment of High-Sea Fish and Salmon Aquaculture - 2 - 25/05/2011 15:09
mined and inventoried in the Inventory Analysis (phase 2). This data is set in relation to the object of
investigation, i.e. the functional unit. The final outcome consists of cumulative resource demands and
emissions of pollutants.
The Inventory Analysis provides the basis for the Impact Assessment (phase 3). Evaluation methods,
e.g. eco-indicator, ecological scarcity or CML are applied to the inventory results. The results of the
inventory analysis and the impact assessment are analysed and commented in the Interpretation
(phase 4) according to the initially defined goal and scope of the LCA. Final conclusions are drawn
and recommendations are given.
2. Goal and Scope
Life Cycle Assessment of High-Sea Fish and Salmon Aquaculture - 3 - 25/05/2011 15:09
2 Goal and Scope
2.1 Outline of the Study
Due to the absence of a datasets on fish, its environmental impact has been roughly assumed in previ-
ous studies of ESU-services to be similar to that of meat (Jungbluth 2000). However, the activity of
raising cattle on a farm is distinctly different from catching fish in the sea or farming fish in aquacul-
tures. Hence, the goal of this study is to quantify the environmental impacts of high-sea fishing and
salmon aquaculture, fish processing, transport and distribution to supermarkets across Switzerland.
Moreover, this life cycle inventory data completes the ESU-database3. Finally, it should be noted that
this is an internal study made during the internships of Benedikt Buchspies and Sunnie Tölle at ESU-
services Ltd..
In the course of this paper, the following key questions are addressed:
What emissions are caused by high sea fishing?
What are the emissions caused by Salmon aquaculture?
What are the environmental hotspots associated with fishing and aquaculture? How can their envi-
ronmental impacts be minimized?
Are the environmental impacts of fish similar to those of meat?
2.2 Functional Unit
In this study it is assumed that codfish is caught in the Northeast Atlantic Ocean by trawl or gillnet
vessels whereas mackerel and herring are caught by trawl nets only. Codfish fillets are usually pack-
aged in plastic laminated cardboard boxes and can be bought in the freezer section of supermarkets
across Switzerland. Mackerel and herring, on other hand, are canned and do not require any refrigera-
tion. Salmon is raised in net-pen aquacultures, processed and kippered. Usually, smoked Salmon fillet
is sliced and packed in plastic. Since the weight of fish per package and the package itself varies ac-
cording to each product, the functional unit is one kilogram of fish fillet sold in a Swiss supermar-
ket.
3 http://www.esu-services.ch/ourservices/lci/database/
2. Goal and Scope
Life Cycle Assessment of High-Sea Fish and Salmon Aquaculture - 4 - 25/05/2011 15:09
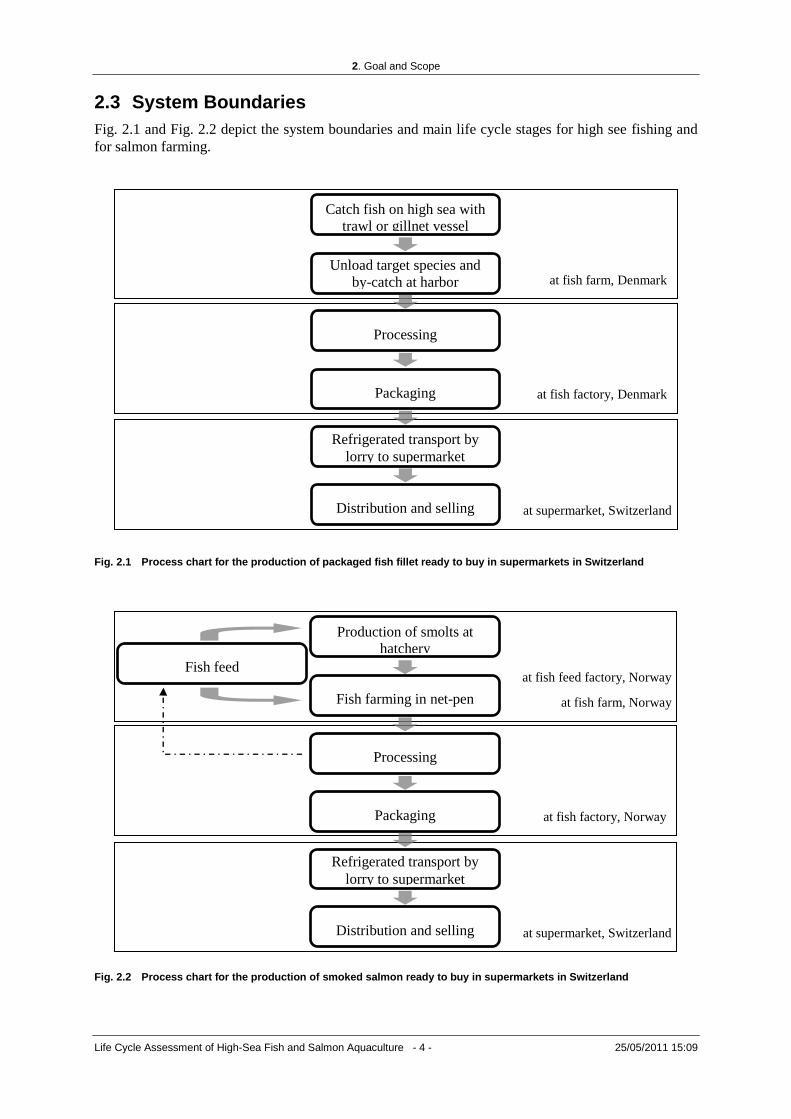
2.3 System Boundaries
Fig. 2.1 and Fig. 2.2 depict the system boundaries and main life cycle stages for high see fishing and
for salmon farming.
Fig. 2.1 Process chart for the production of packaged fish fillet ready to buy in supermarkets in Switzerland
Fig. 2.2 Process chart for the production of smoked salmon ready to buy in supermarkets in Switzerland
at fish farm, Denmark
Catch fish on high sea with
trawl or gillnet vessel
Unload target species and
by-catch at harbor
at fish factory, Denmark
Processing
at supermarket, Switzerland
Refrigerated transport by
lorry to supermarket
Distribution and selling
Packaging
at fish feed factory, Norway
at fish farm, Norway
Fish feed
Production of smolts at
hatchery
Fish farming in net-pen
at fish factory, Norway
Processing
at supermarket, Switzerland
Refrigerated transport by
lorry to supermarket
Distribution and selling
Packaging

2. Goal and Scope
Life Cycle Assessment of High-Sea Fish and Salmon Aquaculture - 5 - 25/05/2011 15:09
2.4 Scenarios Investigated
2.4.1 High sea fish
Although a fishery has normally got one or several target species (i.e. codfish, mackerel or herring)
which is the main purpose of the fishing activity, a number of by-catch species are also landed and
sold (i.e. flatfish, Norway lobster, shrimp and industrial fish). While the latter are not the main driving
force of the fisherman, they do have a commercial value. Thus they should account for some of the
environmental impact caused by fishing activity. The fish is caught by gillnet or trawl net vessels with
a gross tonnage of approximately 19 GT. According to Ziegler (2002), 47% of the cod catches from
the Baltic Sea are caught by gillnets and 53% by trawl nets. For herring and mackerel datasets it was
assumed that they were caught with trawl nets only. The fish were landed at a harbour located in
Denmark. The fish are then processed and packaged (in cardboard or canned) at a nearby factory.
From Denmark, the packaged frozen or canned fish is transported by lorry to supermarkets across
Switzerland.
Fig. 2.3 The left illustration shows a gillnet4 while the right illustration shows a trawl net
5
2.4.2 Farmed Salmon
The first step of Salmon aquaculture which takes place at an on-shore hatchery is the production of smolts. A partial reuse system has been chosen out of several different technologies. A share of water that leaves the rearing unit is first treated and then reused. This reduces freshwater and energy needed.
The fish feed used is made of industrial fish and agricultural products. Until harvesting, the salmons are kept in a floating net pen structures. In the processing stage, the salmons are slaughtered, gutted, filleted, brined and cold smoked. Finally, the smoked salmon is sliced, put on aluminium coated card-board and packed in plastic packages. Harvesting and pro-cessing take place in Norway. After processing, the salmon is transported by lorry to supermarkets across Switzerland.
Fig. 2.4 Floating net pen5
2.5 Allocation
In the fishing industry, several productions steps create multiple outputs. Examples are fishing where
by-catch is caught and fish processing were fish waste is produced. By-catch and fish waste have got
an economic value as they can be used for other products (e.g. fish meal and oil or pet food). To allo-
cate environmental burdens, economic allocation is done. To lower uncertainty resulting from fluctuat-
4 http://www.afma.gov.au/wp-content/uploads/2010/06/bottom_set_gillnet.jpg (29.04.20011) 5 http://www.fish-4-ever.com/img/pic08_bottom_trawling.jpg (29.04.20011) 5 http://blog.cleveland.com/world_impact/2008/11/large_Maine-Salmon_Farming_Meye.JPG (29.04.20011)

2. Goal and Scope
Life Cycle Assessment of High-Sea Fish and Salmon Aquaculture - 6 - 25/05/2011 15:09
ing prices, average prices for fish meal and oil from 2004 to 2008 and average prices for fish products
from 2000 to 2008 have been used (FAO 1998-2010). Prices used for allocation can be found in the
annex (8.3).
2.6 Life Cycle Impact Assessment Methods
In this study two methods for the life cycle impact assessment (LCIA) namely the ecological scarcity
method 2006 (Frischknecht et al. 2009) and the global warming potential (GWP or carbon footprint)
(Solomon et al. 2007) are applied. For more details, see the annex 7.

3. Life Cycle Inventory Analysis
Life Cycle Assessment of High-Sea Fish and Salmon Aquaculture - 7 - 25/05/2011 15:09
3 Life Cycle Inventory Analysis In the following section, the two analysed systems are described. Data has been obtained from litera-
ture study. The full life cycle inventory analysis is documented in a confidential annex. The annex and
electronic XML data can be purchased from ESU-services on request.
3.1 High Sea fishing
3.1.1 Global overview
The trade of fish and fishery products has significantly increased in the last decades, reaching a
worldwide volume of 102 billion US$ in 2008. At present about 80% of total fishery production is
used for direct human consumption. The remaining 20% entirely from capture fisheries is destined for
non-food products such as fish oil as well as direct feed in aquaculture and livestock. While demand
continues to grow, capture fishery production has stabilized at approximately 90 Mt (OECD FAO Ag-
ricultural Outlook 2009)6.
3.1.2 High Sea Fishing in Denmark
In this study it is assumed that the high sea fishing activities occur on the Northeast Atlantic Sea. The
fish is landed at a harbor located in Denmark and processed to fillets and packaged at a nearby fish
factory. The major part of production is exported. The EU is the most important market for Danish
fishery products. The value of Danish exports of fish and fishery products was 18.6 billion DKK in
2001. The value of Danish imports, which are dominated by unprocessed fish, were 11.3 billion DKK.
There are basically three types of fisheries in Denmark:
The industrial fishery for fishmeal and fish oil; mainly for sandeel, Norway pout, blue whiting
and sprat in the North Sea, sprat in the Skagerrak/Kattegat, and sprat in the Baltic Sea
The pelagic fishery for human consumption; mainly herring and mackerel stored in tanks and
landed whole
The demersal fishery for white fish (cod, hake, haddock, whiting, saithe), flatfish (sole, plaice,
flounder etc), lobster and deep water prawns
In this study, the focus is on codfish (representing the demersal fishery) and on herring and mackerel
(representing the pelagic fishery). The final product is determined by the processing of the caught fish
at a fish factory that is located close to the harbour. Fuel consumption has been derived from (Thrane
2004a). In case of codfish, it is assumed that the fillet is frozen and packaged into LDPE laminated
cardboard boxes, whereas herring and mackerel fillets are processed and canned. In the processing
stage, the fish is gutted, de-headed, filleted and packed. Literature study showed a variety of figures
for energy use, waste water loads and losses from filleting and trimming (Cardinal et al. 2001, COWI
2000, Silvenius & Grönroos 2003, Thrane 2004a, Winther et al. 2009 and Ziegler 2002). As pro-
cessing inputs and outputs differ significantly according to the efficiency of the technology used for
processing, an average performance has been assumed. The fish to fillet factor, which is the edible
share of weight, differs among species. The fish to fillet factors for the species analysed is 0.41 (cod-
fish), 0.46 (herring) and 0.53 (mackerel). Fish waste is used for fish feed. From Denmark cod is
brought to Switzerland by refrigerated transport in a lorry. Transport of canned mackerel and herring
6 http://books.google.ch/books?id=l-ScEVN-
GEUC&pg=PA45&dq=oecd+environmental+outlook+2009+fish&hl=de&ei=vSvlTMOrLY7Mswaom4HDCw&sa=X&oi=b
ook_result&ct=result&resnum=3&ved=0CDQQ6AEwAg#v=onepage&q=oecd%20environmental%20outlook%202009%20f
ish&f=false (18.11. 2010)

3. Life Cycle Inventory Analysis
Life Cycle Assessment of High-Sea Fish and Salmon Aquaculture - 8 - 25/05/2011 15:09
does not need any refrigeration. In the supermarket, cod is kept in a freezer unit whereas the canned
mackerel and herring are stored on the supermarket’s shelves.
Previous LCA studies on codfish include the data report Environmental Assessment of a Swedish, fro-
zen cod product with a Life-Cycle Perspective by Ziegler (2002) as well as a research article published
in the Journal of Industrial Ecology by Thrane (2004b) titled “Environmental impacts of Danish fish
products”. Latter also provided some significant data on mackerel and herring fishery. In personal con-
tact, Ian Vazquez-Rowe provided some background data on mackerel, which he originally gathered
for his report “Life Cycle Assessment of Horse Mackerel Fisheries in Galicia (NW Spain)” (Vazquez
2010).
3.2 Salmon aquaculture
3.2.1 Global overview
Aquaculture is a fast growing sector in the global fish industry as it offers possibilities to accommo-
date increasing consumer’s demand for fish products: From 1970 to 2006, the aquaculture production
increased significantly from 3.9% to 36.0% (weight) of global fish production. Growing rates are even
higher than global population’s growth rate. The per capita production increased eleven fold from 0.7
kg in 1970 to 7.8 kg in 2006. The leading producers of farmed salmon are Chile and Norway with
31% and 33% respectively of worldwide production. (FAO 2008)
3.2.2 Salmon aquaculture in Norway
As mentioned above, Norway is the leading country in producing farmed salmon. The main species is
Atlantic salmon (salmon salar). Before being transferred to the offshore net-pen, smolts are raised in
hatcheries. In 2008, there were 224 concessions for smolt production facilities in Norway (FHL 2008).
In this study, it is assumed that smolts are produced at a land-based hatchery using a partial water re-
use system. Other technologies can be found in (Colt 2008).
After smoltification, a physiological transformation, salmons are able to live in salt water; salmons are
transferred to a marine net-pen. At that stage, the salmon weights approx. 60-90g (Colt 2008). Salm-
ons spend between 14 and 25 months in the net-pen before harvesting. At that time, they have gained a
weight of 2-5.5 kg. In this study, a growth time of 20 month is assumed (Tyedmers 2000). The net-pen
structure usually consists of several cages located around 100 m off-shore or in fjords for sheltering
from storms (Tyedmers 2000). The cages are made of a steel structure and a net. During operation
electricity, anti-foiling paint and the operation of a fishing boat is required. According to the Norwe-
gian Fiskeri - og havbruksnærings landsforening (Norwegian Seafood Federation), 884 concessions
for salmon aquaculture were granted in 2008 (FHL 2008).
It is assumed that the same feed is used in the hatchery and the net-pen. As mentioned by Pelletier
(2009), the feed conversion ratio (FCR) and feed composition differ for different salmon species and
regions: Salmons raised in Norway have got a FCR of ~1.1 whereas Salmons from aquacultures in the
UK (~1.33), Canada (~1.31) and Chile (~1.5) have got higher FCRs. The analysed Norwegian feed
consists of 41.90% of vegetal products (e.g. oils and meals) and 58.10% of fishery products (fish meal
and oil). A detailed composition of fish feed in different countries can be found in (Pelletier et al.
2009). Due to the lack of inventory data for several fishery products, industrial fish products from fish-
ing processes, modelled for high sea fish and from salmon processing, are used. This is only a rough
assumption which should be improved as feed input is a major determinant of environmental impacts.
Ecoinvent v.2.2 data has been used for vegetal products.
In the processing stage, the fish is gutted, de-headed, filleted, brined and smoked. For an explanation
of energy requirements, see 3.1.2 and literature mentioned therein. The fish to fillet factor is 0.49. Fi-
nally, the salmon is packed, refrigerated transported and distributed to supermarkets across Switzer-
land.
4. Life Cycle Impact Assessment
Life Cycle Assessment of High-Sea Fish and Salmon Aquaculture - 9 - 25/05/2011 15:09
4 Life Cycle Impact Assessment
4.1 Ecological Scarcity 2006 Method
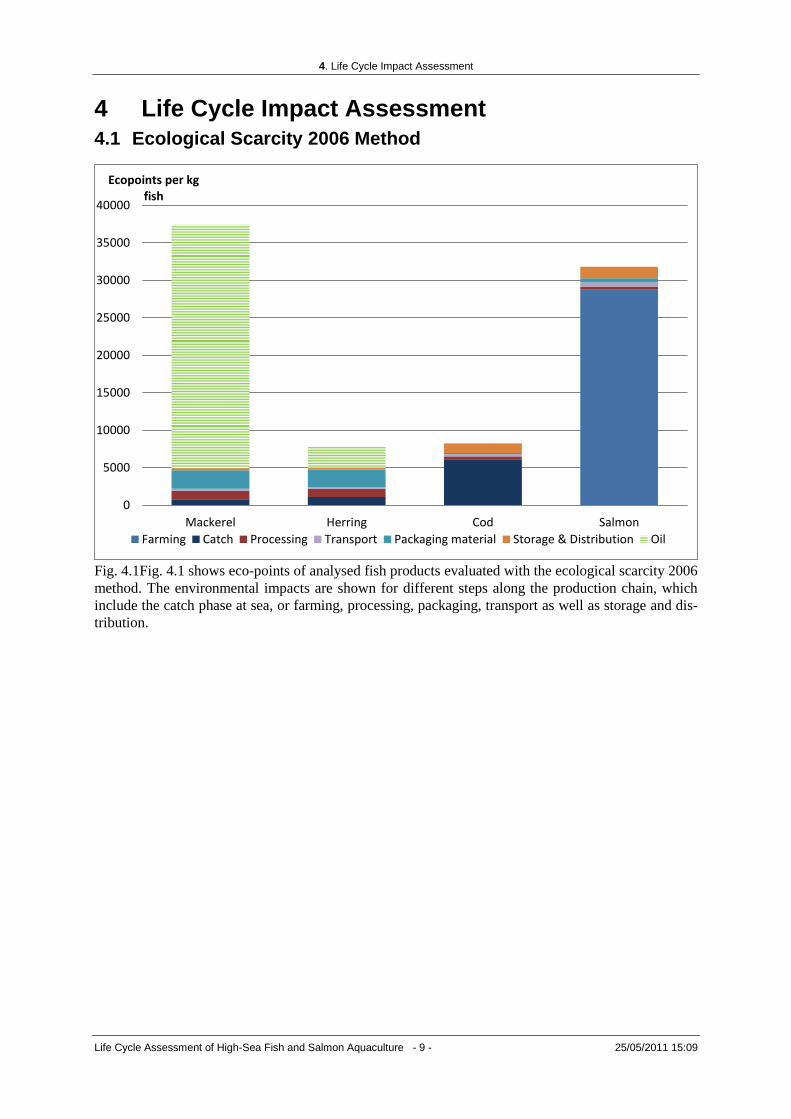
Fig. 4.1Fig. 4.1 shows eco-points of analysed fish products evaluated with the ecological scarcity 2006
method. The environmental impacts are shown for different steps along the production chain, which
include the catch phase at sea, or farming, processing, packaging, transport as well as storage and dis-
tribution.
0
5000
10000
15000
20000
25000
30000
35000
40000
Mackerel Herring Cod Salmon
Ecopoints per kg fish
Farming Catch Processing Transport Packaging material Storage & Distribution Oil
4. Life Cycle Impact Assessment
Life Cycle Assessment of High-Sea Fish and Salmon Aquaculture - 10 - 25/05/2011 15:09
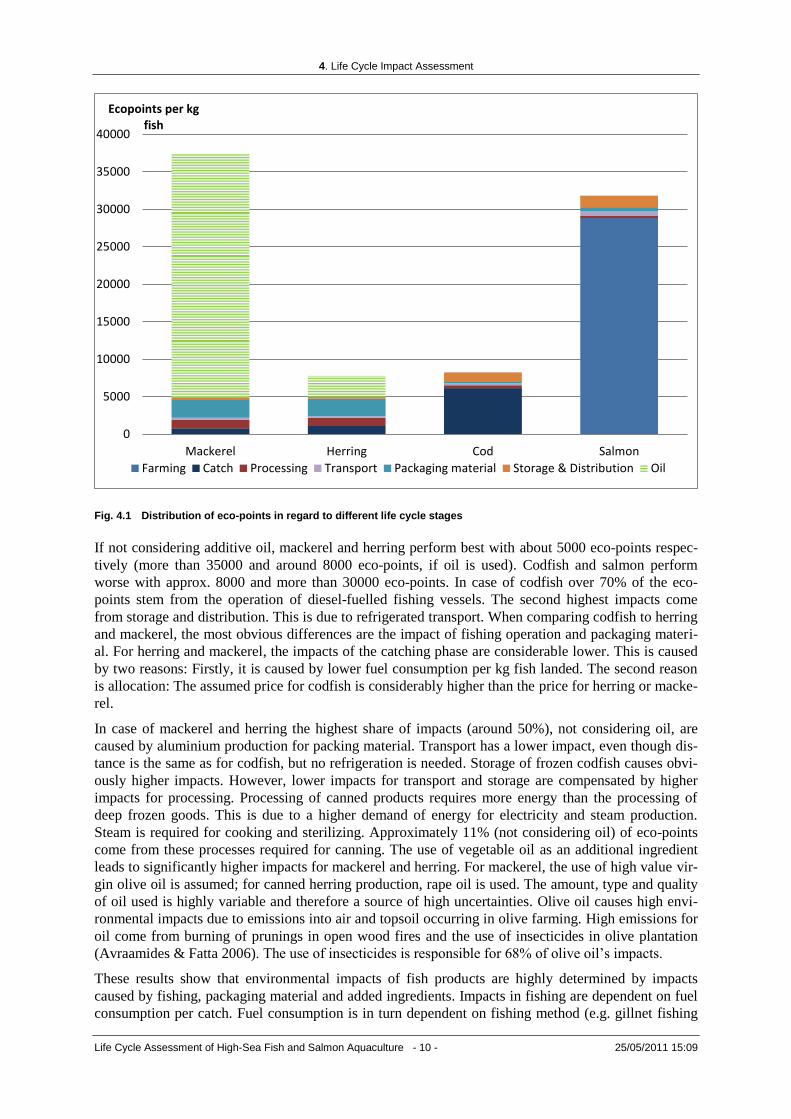
Fig. 4.1 Distribution of eco-points in regard to different life cycle stages
If not considering additive oil, mackerel and herring perform best with about 5000 eco-points respec-
tively (more than 35000 and around 8000 eco-points, if oil is used). Codfish and salmon perform
worse with approx. 8000 and more than 30000 eco-points. In case of codfish over 70% of the eco-
points stem from the operation of diesel-fuelled fishing vessels. The second highest impacts come
from storage and distribution. This is due to refrigerated transport. When comparing codfish to herring
and mackerel, the most obvious differences are the impact of fishing operation and packaging materi-
al. For herring and mackerel, the impacts of the catching phase are considerable lower. This is caused
by two reasons: Firstly, it is caused by lower fuel consumption per kg fish landed. The second reason
is allocation: The assumed price for codfish is considerably higher than the price for herring or macke-
rel.
In case of mackerel and herring the highest share of impacts (around 50%), not considering oil, are
caused by aluminium production for packing material. Transport has a lower impact, even though dis-
tance is the same as for codfish, but no refrigeration is needed. Storage of frozen codfish causes obvi-
ously higher impacts. However, lower impacts for transport and storage are compensated by higher
impacts for processing. Processing of canned products requires more energy than the processing of
deep frozen goods. This is due to a higher demand of energy for electricity and steam production.
Steam is required for cooking and sterilizing. Approximately 11% (not considering oil) of eco-points
come from these processes required for canning. The use of vegetable oil as an additional ingredient
leads to significantly higher impacts for mackerel and herring. For mackerel, the use of high value vir-
gin olive oil is assumed; for canned herring production, rape oil is used. The amount, type and quality
of oil used is highly variable and therefore a source of high uncertainties. Olive oil causes high envi-
ronmental impacts due to emissions into air and topsoil occurring in olive farming. High emissions for
oil come from burning of prunings in open wood fires and the use of insecticides in olive plantation
(Avraamides & Fatta 2006). The use of insecticides is responsible for 68% of olive oil’s impacts.
These results show that environmental impacts of fish products are highly determined by impacts
caused by fishing, packaging material and added ingredients. Impacts in fishing are dependent on fuel
consumption per catch. Fuel consumption is in turn dependent on fishing method (e.g. gillnet fishing
0
5000
10000
15000
20000
25000
30000
35000
40000
Mackerel Herring Cod Salmon
Ecopoints per kg fish
Farming Catch Processing Transport Packaging material Storage & Distribution Oil
4. Life Cycle Impact Assessment
Life Cycle Assessment of High-Sea Fish and Salmon Aquaculture - 11 - 25/05/2011 15:09
or trawling), technology (e.g. vessel and engine) and fish abundance. These factors may vary signifi-
cantly in different regions. As fish abundance is highly variable in time, different results might be
found for other time periods or years. Furthermore, it should be mentioned, that data from fishing used
in this study is from 2004 and only from one country (Denmark). That’s why it is not a complete pic-
ture of fish products sold in Switzerland.
The second type of product, analysed in this study, is fish from aquaculture. Environmental impacts of
farmed salmon are considerably higher than those of caught wild fish. This is due to the significantly
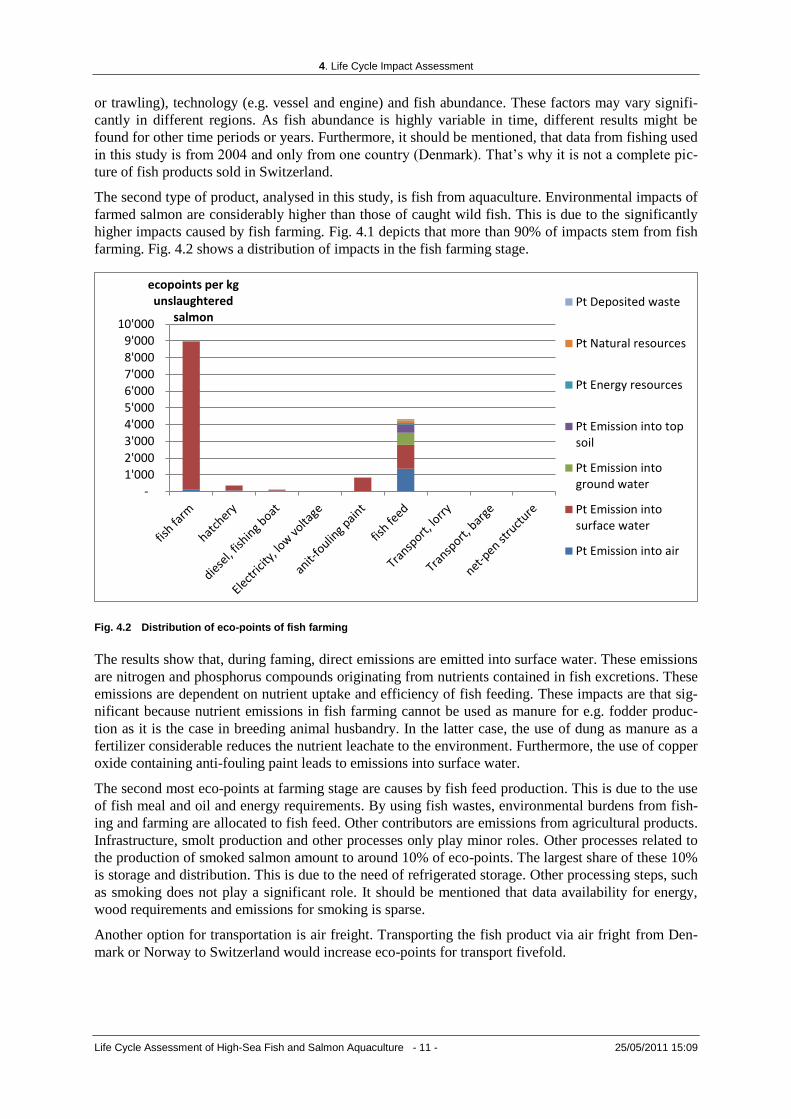
higher impacts caused by fish farming. Fig. 4.1 depicts that more than 90% of impacts stem from fish
farming. Fig. 4.2 shows a distribution of impacts in the fish farming stage.
Fig. 4.2 Distribution of eco-points of fish farming
The results show that, during faming, direct emissions are emitted into surface water. These emissions
are nitrogen and phosphorus compounds originating from nutrients contained in fish excretions. These
emissions are dependent on nutrient uptake and efficiency of fish feeding. These impacts are that sig-
nificant because nutrient emissions in fish farming cannot be used as manure for e.g. fodder produc-
tion as it is the case in breeding animal husbandry. In the latter case, the use of dung as manure as a
fertilizer considerable reduces the nutrient leachate to the environment. Furthermore, the use of copper
oxide containing anti-fouling paint leads to emissions into surface water.
The second most eco-points at farming stage are causes by fish feed production. This is due to the use
of fish meal and oil and energy requirements. By using fish wastes, environmental burdens from fish-
ing and farming are allocated to fish feed. Other contributors are emissions from agricultural products.
Infrastructure, smolt production and other processes only play minor roles. Other processes related to
the production of smoked salmon amount to around 10% of eco-points. The largest share of these 10%
is storage and distribution. This is due to the need of refrigerated storage. Other processing steps, such
as smoking does not play a significant role. It should be mentioned that data availability for energy,
wood requirements and emissions for smoking is sparse.
Another option for transportation is air freight. Transporting the fish product via air fright from Den-
mark or Norway to Switzerland would increase eco-points for transport fivefold.
-
1'000
2'000
3'000
4'000
5'000
6'000
7'000
8'000
9'000
10'000
ecopoints per kg unslaughtered
salmon Pt Deposited waste
Pt Natural resources
Pt Energy resources
Pt Emission into topsoil
Pt Emission intoground water
Pt Emission intosurface water
Pt Emission into air

4. Life Cycle Impact Assessment
Life Cycle Assessment of High-Sea Fish and Salmon Aquaculture - 12 - 25/05/2011 15:09
4.2 Global Warming Potential 2007
The fish products analysed in this study cause approximately four to six kg CO2 equivalent emissions
per kg product (Fig. 4.3)
Fig. 4.3 Global warming potential of analysed fish products (kg CO2-eq per kg)
The lowest impacts are caused by herring and mackerel with 3.7 kg CO2 eq. emissions, without the use
of additive oil; 54 and 4.5 kg CO2 eq. Emissions, respectively, with oil. The results show that packag-
ing material has a high influence on CO2 equivalent emissions: Aluminium cans, used for herring and
mackerel perform worse than plastic foil used for codfish and salmon. The results for cod (5.3 kg CO2
eq. emissions) show that the fishing stage can play an important role, in case fuel consumption is high.
Fuel consumption and its emissions are a hotspot in fishing industry as it offers high possibilities for
improvements. One fact that affects the performance of mackerel positively is the high fish to fillet
factor.
Highest emissions (6.6 kg CO2 eq.) are caused by Salmon .Around 58% of these emissions stem from
fish feed production. Salmon has got the highest impacts for transport due to a longer distance and re-
frigeration. Because of cleaner energy supply, processing of farmed salmon in Norway emits less CO2
equivalent emissions than processing in a Danish factory. This fact shows that it matters, where fish is
processed. A similar conclusion can be found in (Winther et al. 2009).
Fig. 4.4 shows the contribution of carbon dioxide, methane and dinitrogen oxide to GWP. The highest
contributions to GWP come from carbon dioxide emissions. These emissions mainly stem from diesel
use in fishing boat operation and fish feed production. Due to high impacts of fish feed and secondary
dinitrogen oxide emissions formed from nitrogen compounds, farmed salmon is more environmentally
harmful than high sea fish products. So far there seems not to be any clear scientific knowledge about
the influence of added nitrogen on the natural oceanic nitrogen cycle and therefore of the formation of
dinitrogen oxide. Due to the lack of useful information, standard emissions factors from IPCC for dini-
trogen formation in agriculture have been used (De Klein et al. 2006).
0
1
2
3
4
5
6
7
Mackerel Herring Cod Salmon
kg CO2 eq. per kg fish
Oil
Storage & Distribution
Packaging material
Transport
Processing
Catch
Fish feed
Farming

4. Life Cycle Impact Assessment
Life Cycle Assessment of High-Sea Fish and Salmon Aquaculture - 13 - 25/05/2011 15:09
Fig. 4.4 Greenhouse gas emissions of analysed fish products
Tab. 4.1 gives a comparison of results for GWP of different studies. In most cases, GWP of landed
fish had to be compared as different products were analysed (e.g. frozen or pickled, not canned her-
ring). Landed codfish shows the highest discrepancy in results. Differences in results are caused by
different data (different fisheries under study) and allocation.
Tab. 4.1 Comparison of different studies (kg CO2-eq/kg)
Own calcula-
tions
Winther et al.
2009
(NO)
Ziegler 2002
(SE)
Ayer &
Tyedmers
2008
(CA)
Pelletier et al.
2009
(NO)
Cod, at harbour 1.78 1.6 2.45 - -
Mackerel, at harbour 0.32 0.4 - - -
Herring, at harbour 0.47 0.4 - - -
Cod, at supermarket 5.25 - 5.83 - -
Salmon, at fish farm 2.05 2 - 2.07 1.79
4.3 Comparison between Fish and Meat
Because the environmental impact of fish has not been quantified so far in the ESU database; some-
times it was assumed to be similar to that of meat (Jungbluth 2000).In the following, the validity of
this assumption is tested by comparing cod, herring, mackerel and salmon to poultry, pork, lamb, beef
and veal.
4.3.1 Eco Scarcity 2006
In Fig. 4.5, fish and meat are compared with the ecological scarcity 2006 method. The absolute single
score of high sea fish is between 6000 and 8000 eco-points, which is 2 to 4 times lower than the single
score of one kilogram of meat which ranges between 13’000 eco points (poultry) and 33’000 eco
points (veal). Compared to meat products, farmed salmon is on the high end of range. As mentioned in
4.1, this is due to the emissions of nutrients and copper oxide to the ocean.
0
1
2
3
4
5
6
7
Mackerel Herring Cod Salmon
kg CO2 eq. per kg fish
Other from oil
Dinitrogenmonoxide fromoilMethane from oil

4. Life Cycle Impact Assessment
Life Cycle Assessment of High-Sea Fish and Salmon Aquaculture - 14 - 25/05/2011 15:09
It has to be noted that environmental impacts of fish can vary considerably depending on the type of
fish: There also some types of fish, such as lobster for which eco-points are as high as 75’000 points
per kg landed at harbor.
The reason why veal has got higher impacts than beef may seem peculiar at first thought, but can be
explained due to the economic allocation that has been used: The price of veal meat is higher than the
one of beef. Beef is also produced in co-production with milk which leads to lower environmental im-
pacts. Calves raised solely for the purpose of meat production thus exhibit higher environmental im-
pacts.
Fig. 4.5 Comparison of fish and meat – eco Scarcity 2006
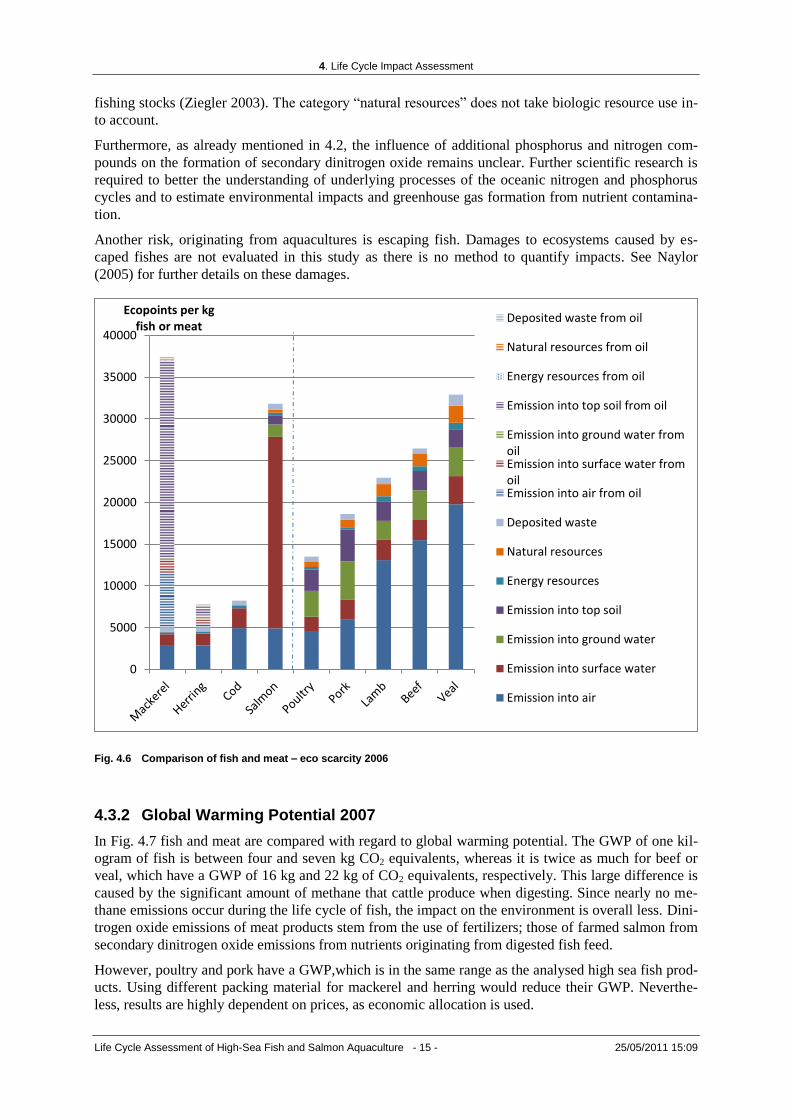
In Fig. 4.6, fish and meat are compared with regard to the sphere where emissions occur. In this figure
you see how and to what extent the various meat and fish sorts impact different environmental com-
partments. For meat products, the majority of emissions are emitted into air, whereas a larger share of
emissions from fishery products is emitted into surface water. These eco-points stem from anti-fouling
paint that is used. The same type of paint is used to a smaller extent in fish farming.
However, it should be noted that specific environmental impacts of fishery such as disturbance of nat-
ural habitats on sea ground or overuse of natural stocks are so far not covered by common LCIA
methods. For a full environmental assessment it is necessary to better take into account such impacts.
For example, the impact of a bottom trawl fishing vessel can differ considerably between sediments,
where the oxygen content of the bottom water allows the existence of higher life forms. The swirled
up sediment caused by the passing trawl may release organic (potentially toxic) material that had been
buried. Furthermore, an increase in nutrients might accelerate eutrophication and oxygen-depletion
processes even further (Ziegler 2002).The second significant environmental impact that remains un-
addressed by the life cycle assessment is overfishing and the severe consequences it poses to marine
ecosystems. For example, Atlantic cod only matures at six to nine years. Due to overfishing, a high
percentage of the catches are not able to reproduce before being caught which leads to unsustainable
0
5000
10000
15000
20000
25000
30000
35000
40000
Ecopoints per kg fish or meat Oil
Processing anddistribution
Storage &Distribution
Transport
Packagingmaterial
Processing
Catch
Farming
Livestockbreeding
4. Life Cycle Impact Assessment
Life Cycle Assessment of High-Sea Fish and Salmon Aquaculture - 15 - 25/05/2011 15:09
fishing stocks (Ziegler 2003). The category “natural resources” does not take biologic resource use in-
to account.
Furthermore, as already mentioned in 4.2, the influence of additional phosphorus and nitrogen com-
pounds on the formation of secondary dinitrogen oxide remains unclear. Further scientific research is
required to better the understanding of underlying processes of the oceanic nitrogen and phosphorus
cycles and to estimate environmental impacts and greenhouse gas formation from nutrient contamina-
tion.
Another risk, originating from aquacultures is escaping fish. Damages to ecosystems caused by es-
caped fishes are not evaluated in this study as there is no method to quantify impacts. See Naylor
(2005) for further details on these damages.
Fig. 4.6 Comparison of fish and meat – eco scarcity 2006
4.3.2 Global Warming Potential 2007
In Fig. 4.7 fish and meat are compared with regard to global warming potential. The GWP of one kil-
ogram of fish is between four and seven kg CO2 equivalents, whereas it is twice as much for beef or
veal, which have a GWP of 16 kg and 22 kg of CO2 equivalents, respectively. This large difference is
caused by the significant amount of methane that cattle produce when digesting. Since nearly no me-
thane emissions occur during the life cycle of fish, the impact on the environment is overall less. Dini-
trogen oxide emissions of meat products stem from the use of fertilizers; those of farmed salmon from
secondary dinitrogen oxide emissions from nutrients originating from digested fish feed.
However, poultry and pork have a GWP,which is in the same range as the analysed high sea fish prod-
ucts. Using different packing material for mackerel and herring would reduce their GWP. Neverthe-
less, results are highly dependent on prices, as economic allocation is used.
0
5000
10000
15000
20000
25000
30000
35000
40000
Ecopoints per kg fish or meat
Deposited waste from oil
Natural resources from oil
Energy resources from oil
Emission into top soil from oil
Emission into ground water fromoilEmission into surface water fromoilEmission into air from oil
Deposited waste
Natural resources
Energy resources
Emission into top soil
Emission into ground water
Emission into surface water
Emission into air

4. Life Cycle Impact Assessment
Life Cycle Assessment of High-Sea Fish and Salmon Aquaculture - 16 - 25/05/2011 15:09
Fig. 4.7 Comparison of greenhouse gas emissions
0
5
10
15
20
25
kg per kg fish or meat
Other from oil
Dinitrogen monoxide from oil
Methane from oil
Carbon dioxide from oil
Other
Dinitrogen monoxide
Methane
Carbon dioxide
5. Recommendations
Life Cycle Assessment of High-Sea Fish and Salmon Aquaculture - 17 - 25/05/2011 15:09
5 Recommendations
5.1 Policy Recommendations
From the evaluated results it becomes obvious that the main area for improving the environmental im-
pact of fishing lies in the catch phase and in particular in the operation of the fishing vessel. While the
political solution so far has been to support investments in new engines, Thrane (2004b) argues that
more efficient engines are likely to cause an increase in fishing activity, which in turn results in less
fish. Less fish leads to another increase in fishing activity. A positive feedback loop evolves.
He recommends focusing on cleaner fishing techniques. He found out that gillnets and the Danish
seines are considerably more fuel-efficient than bottom and beam trawls when used for the same target
species. He therefore recommends supporting further development of passive and semi-active fishing
methods, such as the Danish seine.
Further significant improvements can be made in packaging: The use of different packaging material
can lead to a reduction of environmental impacts. To reduce impacts on biological resources, strict
fishing quotas should be established and adhered to. In addition, sustainable management of fish
stocks could reduce the amount of energy used per kg of landed fish as low catch rates are linked to
high fuel consumption. High fuel prices might have a positive effect on fuel consumption, (Schau et
al. 2002).
Aquaculture’s environmental impacts can be lowered by a change in feed composition: The substitu-
tion of animal by-products by vegetal ingredients reduces total environmental impacts of fish feed.
One should keep in mind that fish meal and oil are mainly by-products from other industries. Aban-
doning the use of these ingredients would reduce environmental impacts of fish feed, but it is not clear
if this leads to an improvement on a larger scale: The available quantity (and environmental impacts)
of these by-products is defined by the production of other products not by the demand created by fish
feed production as the clear majority of fishing targets edible fish. It would not be any better to waste
these by-products.
Another option is to improve feeding technique: The amount of feed needed per kg of salmon pro-
duced (FCR) varies significantly in different regions: From a FCR of 1.103 in Norway to 1.493 in
Chile (Pelletier et al. 2009). In this study, an FCR of 1.103 was assumed as Norwegian farmed Salmon
was analysed. In other regions, where the optimum is not reached, high potential for improvements are
given.
Another risk created by aquacultures is escaping fish. Naylor (2005) explains adverse effects of escap-
ing salmon on wild salmons. Therefore regulations need to be introduced to protect natural habitats.
In fish processing, improvements can be achieved by using energy and water efficient machinery
(COWI 2000). Winther (2009) and own calculations proved that it matters where fish is processed as
energy mixes and their environmental impacts vary in different countries.
5.2 Consumer Recommendations
From the consumer perspective, two recommendations can be made in regards to choices made at the
supermarket: Firstly, when deciding between fish and meat, the analyses with the GWP method sug-
gest that some types of fish from high-sea fishing are a less harmful choice for the environment than
beef and veal. However, this cannot be generalized, as environmental impacts of some fish species are
considerably higher. For some more expensive types of fish such as shrimps, flatfish or delicacies such
as the Norway lobster, the GWP can rise above 30 kg CO2-eq per kg of fish. This is due to economic
allocation.
Aquaculture is sometimes praised as an environmental friendly alternative to high-sea fishing or land
based animal husbandry. Calculations reveal that it is for salmon in the same range as high sea fish
with regard to GWP. Its downside is eutrophication and disturbance of natural habitats. The use of
5. Recommendations
Life Cycle Assessment of High-Sea Fish and Salmon Aquaculture - 18 - 25/05/2011 15:09
vaccines and antibiotics worsens environmental impacts of farmed salmon. In regards to eco-points,
salmon performs considerably worse than high sea fish and most meat products.
Thus, there’s no clear cut answer to the question of whether an environmentally concerned consumer
should rather buy meat or fish. The environmental impacts of fish are quite variable depending on the
type of fish and fishery. From an environmental point of view a vegetarian diet is more preferable than
eating fish and meat.
Finally, consumers should be aware that neither the eco-scarcity nor the GWP method adequately ad-
dresses the severe environmental consequences of overfishing or sea floor damage caused in particular
by bottom trawl fishing vessels. For consumer advices one should consider e.g. recommendations by
the WWF concerning types of fish which are so far not endangered by marine overfishing.7
5.3 Research Recommendations
Apart from consumer and policy recommendations some recommendations for further research can be
given. This study shows that several aspects are not implemented in the LCA methodology so far. The
most significant aspect concerning fishery is overfishing and the destruction and disturbance of natural
habitats. Further development in LCA should address these problems as they resolve around the main
problems towards a sustainable fishery. A starting point might be to check whether fishing quotas are
adhered to or not (provided that current fishing quotas are considered as sufficient means of creating a
sustainable fishery). Coping with seabed disturbance is another point that needs to be taken into ac-
count in more detail, especially when analysing trawling.
Another aspect that has been mentioned several times before is the formation of secondary dinitrogen
oxide from nitrogen emissions into the ocean. So far there seems not to be much scientific knowledge
about it.
Furthermore, the amount and influence of emitted anti-fouling paint is uncertain. The share of paint
that flakes off the ship is hard to quantify and its fate and behaviour in the environment is highly un-
certain.
7 http://www.wwf.ch/de/tun/tipps_fur_den_alltag/essend/fisch/fischfuhrer/

6. Bibliography
Life Cycle Assessment of High-Sea Fish and Salmon Aquaculture - 19 - 25/05/2011 15:09
6 Bibliography Avraamides & Fatta 2006 Avraamides M. and Fatta D. (2006) Life Cycle Assessment (LCA) as a Decision
Support Tool (DST) for the ecoproduction of olive oil", Implementation of Life
Cycle Inventory in Lythrodontas region of Cyprus, Task 3.2. University of
Cyprus, Nicosia.
Ayer & Tyedmers 2008 Ayer N. and Tyedmers P. (2008) Assessing alternative aqucaculture
technologies. In: Journal of Cleaner Production, 2009(17), pp. 362.
Cardinal et al. 2001 Cardinal M., Knockaert C., Torrissen O., Sigurguskadottir S., Mørkøre T.,
Thomassen M. and Vallet J. L. (2001) Relation of smoking parameters to the
yield, colour and sensory quality of smoked Atlantic salmon (Salmo salar). In:
Food Research International(34(6)), pp. 26.
Colt 2008 Colt J. (2008) Energy and resource consumption of land-based Atlantic salmon
smolt hatcheries in the Pacific Northwest (USA). In: Aquaculture(280), pp. 15.
COWI 2000 COWI (2000) Cleaner Production Assessment in Fish Processing. COWI
Consulting Engineers and Planners AS, Denmark; UNEP.
De Klein et al. 2006 De Klein C., Novoa R., Ogle S., Smith K. A., Rochette P. and Wirth T. C. (2006)
2006 IPCC Guidelines for National Greenhouse Gas Inventories - Chapter 11
N2O emissions from managed soils, and CO2 emissions from lime and urea
application. IPCC.
Eidg. Oberzolldirektion 2004 Eidg. Oberzolldirektion (2004) Schweizerische Aussenhandelsstatistik -
Jahresstatistik 2004. Vol. Veröffentlichung im Internet, Bern, CH, retrieved
from: www.zoll.admin.ch.
FAO 1998-2010 FAO (1998-2010) Aquastat: FAO's Information System on Water and
Agriculture, retrieved from:
http://www.fao.org/ag/agl/aglw/aquastat/dbase/index.stm.
FAO 2008 FAO (2008) The state of world fisheries and aquaculture.
FHL 2008 FHL (2008) Miljørapport for norsk havbruksnæringmed hovedvekt på tall og
fakta for 2008 Fiskeri - og havbruksnærings landsforening, Oslo.
Frischknecht et al. 2008 Frischknecht R., Steiner R. and Jungbluth N. (2008) Methode der ökologischen
Knappheit - Ökofaktoren 2006. Umwelt-Wissen Nr. 0906. Bundesamt für
Umwelt (BAFU), Bern, retrieved from:
www.bafu.admin.ch/publikationen/publikation/01031/index.html?lang=de.
Frischknecht et al. 2009 Frischknecht R., Steiner R. and Jungbluth N. (2009) The Ecological Scarcity
Method - Eco-Factors 2006: A method for impact assessment in LCA. Federal
Office for the Environment FOEN, Zürich und Bern, retrieved from:
www.bafu.admin.ch/publikationen/publikation/01031/index.html?lang=en.
International Organization for Standardization (ISO) 2006a International Organization for Standardization
(ISO) (2006a) Environmental management - Life cycle assessment - Principles
and framework. ISO 14040:2006; Second Edition 2006-06, Geneva.
International Organization for Standardization (ISO) 2006b International Organization for Standardization
(ISO) (2006b) Environmental management - Life cycle assessment -
Requirements and guidelines. ISO 14044:2006; First edition 2006-07-01,
Geneva.
Jungbluth 2000 Jungbluth N. (2000) Umweltfolgen des Nahrungsmittelkonsums: Beurteilung
von Produktmerkmalen auf Grundlage einer modularen Ökobilanz. Dissertation
Nr. 13499. Eidgenössische Technische Hochschule Zürich, Umweltnatur- und
Umweltsozialwissenschaften, dissertation.de, Berlin, D, retrieved from:
www.jungbluth.de.vu.
Miyazaki et al. 2004 Miyazaki N., Siegenthaler C., Schoenbaum T. and Azuma K. (2004) Japan
Environmental Policy Priorities Index (JEPIX) - Calculation of Ecofactors for
6. Bibliography
Life Cycle Assessment of High-Sea Fish and Salmon Aquaculture - 20 - 25/05/2011 15:09
Japan: Method for Environmental Accounting based on the EcoScarcity
Principle. 7. International Christian University Social Science Research Institute,
Tokyo.
Naylor et al. 2005 Naylor R., Hindar K., Fleming I. and Goldburg R. (2005) Fugitive Salmon:
Assessing the Risks of Escaped Fish from Net-Pen Aquaculture. In: BioScience,
55(5), pp. 11.
Nordic Council of Ministers 1995 Nordic Council of Ministers (1995) LCA-NORDIC technical report no. 10
and special reports no. 1-2., Kopenhagen.
Pelletier 2006 Pelletier N. (2006) Life Cycle Assessment of Salmon feed. Dalhousie University,
Halifax.
Pelletier et al. 2009 Pelletier N., Tyedmers P., Sonesson U., Flysjo A., Kruse H., Cancino B. and
Silverman H. (2009) Not All Salmon Are Created Equal: Life Cycle Assessment
(LCA) of Global Salmon Fishing Systems. In: Environ Sci. Technol., pp.
Schau et al. 2002 Schau E. M., H E., Endal A. and Aanondsen S. (2002) Energy consumption in
the Norwegian fisheries. In: Journal of Cleaner Production, 17, pp. 325-334,
retrieved from: www.elsevier.com/locate/jclepro.
SGP 1994 SGP (1994) Etude relative à la normalisation écologique des emballages en
Belgique, raport final au ministre belge de la santé publique, de l'intégration
sociale et de l'environnement, Liège.
Silvenius & Grönroos 2003 Silvenius F. and Grönroos J. (2003) Fish farming and the environment. Results
od inventrory analysis.
Solomon et al. 2007 Solomon S., Qin D., Manning M., Alley R. B., Berntsen T., Bindoff N. L., Chen
Z., Chidthaisong A., Gregory J. M., Hegerl G. C., Heimann M., Hewitson B.,
Hoskins B. J., Joos F., Jouzel J., Kattsov V., Lohmann U., Matsuno T., Molina
M., Nicholls N., Overpeck J., Raga G., Ramaswamy V., Ren J., Rusticucci M.,
Somerville R., Stocker T. F., Whetton P., Wood R. A. and Wratt D. (2007)
Technical Summary. In: Climate Change 2007: The Physical Science Basis.
Contribution of Working Group I to the Fourth Assessment Report of the
Intergovernemental Panel on Climate Change (IPCC), Cambridge University
Press, Cambridge, United Kingdom and New York, NY, USA.
Spielmann et al. 2007 Spielmann M., Roberto Dones, Bauer C. and Tuchschmid M. (2007) Life Cycle
Inventories of Transport Services. ecoinvent report No. 14, v2.0. Swiss Centre
for Life Cycle Inventories, Dübendorf, CH, retrieved from: www.ecoinvent.org.
Thrane 2004a Thrane M. (2004a) Environmental impacts from danish fish products. Aalborg
University, Aalborg.
Thrane 2004b Thrane M. (2004b) Energy Consumption in the Danish Fishery. In: Journal of
Industrial Ecology, 8(2), pp. 223-239.
Tyedmers 2000 Tyedmers P. (2000) Salmon and sustainability the biophysical cost of producing
salmon through the commercial salmon fishery and the intensive salmon culture
industry. University of British Columbia, Vancouver.
Vazquez 2010 Vazquez I. (2010) Life cycle assessment of Horse Mackerel fisheries in Galicia
(NW Spain). Comparative analysis of two major fishing methods. In, pp.
Winther et al. 2009 Winther U., F. Z., Hognes E., Emanuelsson A., Sund V. and Ellingsen H. (2009)
SINTEF Fisheries and Aquaculture. In, pp.
Ziegler 2002 Ziegler F. (2002) Environmental Assessment of a Swedish, frozen co product
with a life-cycle perspective In, pp.
Ziegler 2003 Ziegler F. H., P (2003) Emissions from fuel combustion in Swedish cod fishery.
In: Journal of Cleaner Production, pp. 303-314.

7. Annexe LCIA methods
Life Cycle Assessment of High-Sea Fish and Salmon Aquaculture - 21 - 25/05/2011 15:09
7 Annexe LCIA methods
7.1 Global Warming Potential 2007 (GWP)
All substances, which contribute to climate change, are included in the global warming potential
(GWP) indicator according to IPCC (Solomon et al. 2007). The residence time of the substances in the
atmosphere and the expected immission design are considered to determine the global warming poten-
tials. The potential impact of the emission of one kilogram of a greenhouse gas is compared to the po-
tential impact of the emission of one kilogram CO2 resulting in kg CO2-equivalents. The global warm-
ing potentials are determined applying different time horizons (20, 100 and 500 years). The short inte-
gration period of 20 years is relevant because a limitation of the gradient of change in temperature is
required to secure the adaptation ability of terrestrial ecosystems. The long integration time of 500
years is about equivalent with the integration until infinity. This allows monitoring the overall change
in temperature and thus the overall sea level rise, etc..
In this study a time horizon of 100 years is chosen, which is also used in the Kyoto protocol.
7.2 Ecological Scarcity 2006
The ecological scarcity method (Frischknecht et al. 2008) evaluates the inventory results on a distance
to target principle. The calculation of the eco-factors is based on one hand on the actual emissions (ac-
tual flow) and on the other hand on Swiss environmental policy and legislation (critical flow). These
goals are:
Ideally mandatory or at least defined as goals by the competent authorities,
formulated by a democratic or legitimised authority, and
preferably aligned with sustainability.
The weighting is based on the goals of the Swiss environmental policy; global and local impact cate-
gories are translated to Swiss conditions, i.e. normalised. The method is applicable to other regions as
well. Eco-factors were also developed for the Netherlands, Norway, Sweden (Nordic Council of
Ministers 1995, Tab. A22 / A23), Belgium (SGP 1994) and Japan (Miyazaki et al. 2004).
The ecological scarcity method allows for an optimisation within the framework of a country’s envi-
ronmental goals.
The environmental and political relevance is essential for the choice of substances. The environmental
policy does by far not define goals for all substances. Thus the list of eco-factors is limited. This par-
ticularly applies to substances with low or unknown environmental relevance in Switzerland and Eu-
rope (e.g. sulphate emissions in water bodies).