life cycle assessment of biogas production from...
TRANSCRIPT

Eidgenössisches Departement für Umwelt, Verkehr, Energie und Kommunikation UVEK
Bundesamt für Energie BFE
Schlussbericht Dezember 2011
Life Cycle Assessment of Biogas Production from Different Substrates
Auftraggeber: Bundesamt für Energie BFE Forschungsprogramm Biomasse CH-3003 Bern www.bfe.admin.ch
Auftragnehmer: ESU-services GmbH fair consulting in sustainability Kanzleistrasse 4 CH-8610 Uster www.esu-services.ch
Autoren: Matthias Stucki, ESU-services Ltd., [email protected] Niels Jungbluth, ESU-services Ltd., [email protected] Marianne Leuenberger, ESU-services Ltd.
BFE-Bereichsleiter: Sandra Hermle
BFE-Programmleiter: Sandra Hermle BFE-Vertrags- und Projektnummer: 154346 / 103298
Für den Inhalt und die Schlussfolgerungen sind ausschliesslich die Autoren dieses Berichts verantwortlich.

Imprint
Title Life Cycle Assessment of Biogas Production from Different Substrates
Authors Matthias Stucki, Niels Jungbluth, Marianne Leuenberger
ESU-services Ltd., fair consulting in sustainability
Kanzleistr. 4, CH-8610 Uster
www.esu-services.ch
Phone 0041 44 940 67 94, Fax +41 44 940 61 94
Commissioner Bundesamt für Energie
About us ESU-services Ltd. has been founded in 1998. Its core objectives are consulting, coaching, training
and research in the fields of Life Cycle Assessment (LCA), carbon footprints, water footprint in the
sectors energy, civil engineering, basic minerals, chemicals, packaging, telecommunication, food
and lifestyles. Fairness, independence and transparency are substantial characteristics of our con-
sulting philosophy. We work issue-related and accomplish our analyses without prejudice. We doc-
ument our studies and work transparency and comprehensibly. We offer a fair and competent con-
sultation, which makes it for the clients possible to control and continuously improve their environ-
mental performance. The company worked and works for various national and international com-
panies, associations and authorities. In some areas, team members of ESU-services performed
pioneering work such as development and operation of web based LCA databases or quantifying
environmental impacts of food and lifestyles.
Copyright All content provided in this report is copyrighted, except when noted otherwise. Such information
must not be copied or distributed, in whole or in part, without prior written consent of ESU-services
Ltd. or the customer. This report is provided on the website www.esu-services.ch and the website of
the customer. A provision of this report or of files and information from this report on other websites
is not permitted. Any other means of distribution, even in altered forms, require the written consent.
Any citation naming ESU-services Ltd. or the authors of this report shall be provided to the authors
before publication for verification.
Liability Statement Information contained herein have been compiled or arrived from sources believed to be reliable.
Nevertheless, the authors or their organizations do not accept liability for any loss or damage aris-
ing from the use thereof. Using the given information is strictly your own responsibility.
Version 103298_SB_154346_LCA Biogas_ESU-services_v1.0, 10/01/2012 17:07:00

4/84
Table of contents
1 INTRODUCTION ...................................................................................................... 9
1.1 Background ........................................................................................................................... 9
1.2 Goal and scope ...................................................................................................................... 9
1.3 Allocation ............................................................................................................................ 11
2 OVERVIEW OF BIOMASS SUBSTRATES FOR CO-DIGESTION ........................................ 14
3 LIFE CYCLE INVENTORIES: SUMMARY .................................................................... 16
3.1 Biogas conversion in agricultural biogas plants .................................................................. 16
3.2 Application of digested matter on agricultural land ............................................................ 20
3.3 Cogeneration of electricity and heat in agricultural biogas plants ...................................... 21
3.4 Grass refinery ...................................................................................................................... 23
3.5 Biogas purification, distribution and use as fuel ................................................................. 25
3.6 Comparison between biogas modelled in this study and in ecoinvent v2.2 ........................ 30
4 LIFE CYCLE IMPACT ASSESSMENT .......................................................................... 31
4.1 Car transportation using biogas ........................................................................................... 31
4.2 Grass refinery products ....................................................................................................... 39
4.3 Electricity from Cogeneration ............................................................................................. 40
5 CONCLUSION ....................................................................................................... 42
6 OUTLOOK ............................................................................................................ 43
7 REFERENCES ........................................................................................................ 44
8 APPENDIX A: LCI OF BIOGAS CONVERSION IN AGRICULTURAL BIOGAS PLANTS ......... 47
8.1 Biogenic carbon balance methodology ............................................................................... 47
8.2 General assumptions............................................................................................................ 47
8.3 Biogas from maize .............................................................................................................. 49
8.4 Biogas from sugar beet, fodder beet and beet residues ....................................................... 50
8.5 Biogas from molasses .......................................................................................................... 52
8.6 Biogas from glycerine ......................................................................................................... 53
8.7 Life cycle inventories of biogas conversion in agricultural biogas plants .......................... 54
9 APPENDIX B: LCI OF APPLICATION OF DIGESTED MATTER ON AGRICULTURAL LAND . 59
9.1 Ammonia ............................................................................................................................. 59
9.2 Heavy metals ....................................................................................................................... 59
10 APPENDIX C: LCI OF COGENERATION OF ELECTRICITY AND HEAT ........................... 63
10.1 Emissions from combustion of biogas in agricultural co-generation units ......................... 63
10.2 Cogeneration of electricity and heat .................................................................................... 66
11 APPENDIX D: LCI OF A GRASS REFINERY ............................................................... 67
11.1 Introduction ......................................................................................................................... 67
11.2 Resources ............................................................................................................................ 67
11.3 Characterisation and use of products ................................................................................... 67
11.4 Life cycle inventories .......................................................................................................... 68

5/84
12 APPENDIX E: LCI OF BIOGAS PURIFICATION, DISTRIBUTION AND USE AS FUEL .......... 80
12.1 Biogas mix for purification ................................................................................................. 80
12.2 Purification technologies ..................................................................................................... 81
12.3 Distribution and combustion in passenger car ..................................................................... 84

6/84
Abstract
In order to improve the yield of biogas plants, operators often purchase or cultivate substrates with
high energy content. With a life cycle assessment (LCA), the environmental impacts due to the diges-
tions of these substrates can be analysed.
In this report life cycle inventory datasets of biogas production from the following substrates are in-
vestigated: maize silage, sugar beets, fodder beets, beet residues, molasses, and glycerine. Further-
more, biogas from a grass refinery is analysed. The life cycle inventory data required for such an LCA
are collected according to the ecoinvent v2.0 quality guidelines. The life cycle inventories are based
on literature data and a current survey of 16 biogas plant operators, which was conducted within an-
other project of the BFE “Biomass Research Programme”.
In addition to the new inventories of the biogas production, life cycle inventories of the provision of
electricity and heat from burning biogas from the examined substrates in a biogas engine (cogenera-
tion unit) are set up. Part of this electricity and heat is then used for the operation of the biogas plants.
In the survey the biogas plant operators declare that 62 % of the electricity consumption is met with
electricity from a cogeneration unit that is operated with biogas. About 38 % of the electricity con-
sumption is covered with electricity from the grid. The heat consumption is completely covered by the
cogeneration unit.
Life cycle inventory datasets are also prepared for three technologies of biogas purification with the
purpose of supplying biomethane to the natural gas grid. The considered technologies are amino wash-
ing, glycol washing, and pressure swing adsorption
The setup of life cycle inventory datasets allows for a detailed assessment and comparison of the envi-
ronmental impacts of using biogas from different substrates and products of biogas operated cogenera-
tion units.
The total greenhouse gas (GHG) emissions of a transport service with biogas fuel from the new estab-
lished inventories and an average load of 1.6 passenger amounts to between 95 gCO2-eq./pkm (biogas
from grass refinery) and 163 gCO2-eq./pkm (beet residues). Even though these values are lower than
the greenhouse gas emissions of using conventional fuels, most biogas types analysed in this study do
not comply with the thresholds for a tax reduction (40 % less GHG emissions compared to using con-
ventional fuels). Important for the GHG result are the methane emissions from the biogas production
and purification, and the dinitrogen monoxide emissions from the plant cultivation. Those emissions
can vary significantly between individual biogas plants and different energy crops.
If considering the total environmental impacts assessed with the ecological scarcity method (2006),
driving with biogas from non-waste substrates has higher environmental impacts compared to driving
with conventional natural gas.
Electricity produced from biogas generated from energy crops has considerably higher environmental
compared to the average electricity from the Swiss grid, whereas electricity produced from biogas
generated from waste substrates has lower environmental impacts and can be considered as green elec-
tricity.
At present, biogas in Switzerland is mainly produced from sewage sludge, slurry, and biowaste. If the
co-digestion with higher shares of substrates made from energy crops increases significantly in future,
the produced biogas cannot comply with the thresholds for a fuel tax reduction anymore.
7/84
Kurzfassung
Um den Ertrag von Biogasanlagen zu verbessern, setzen die Anlagenbetreiber oftmals Substrate mit
einem hohen Energiegehalt ein, die gekauft oder extra angebaut werden. Im Rahmen dieses Projekts
wurde eine Ökobilanz der Vergärung von Maissilage, Zuckerrüben, Futterrüben, Rübenreste, Melasse
und Glycerin in Biogasanlagen durchgeführt. Zudem wurde Biogas aus einer Grasraffinerie beurteilt.
Die Sachbilanzinventare wurden basierend auf aktuellen Literaturdaten und einer Umfrage bei 16 Be-
treibern von Biogasanlagen in der Schweiz erstellt.
Zusätzlich zu der Biogasproduktion, wurde auch die Verbrennung des produzierten Biogases in einem
Blockheizkraftwerk berücksichtigt, wobei ein Teil der produzierten Wärme und des Stroms wiederum
in der Biogasanlage verbraucht wird. Des Weiteren wurde die Aufbereitung des Biogases mittels
Druckwechseladsorption, Amin-Wäsche und Glykol-Wäsche zu Biomethan für das Erdgasnetz und
die Verbrennung in Fahrzeugmotoren untersucht.
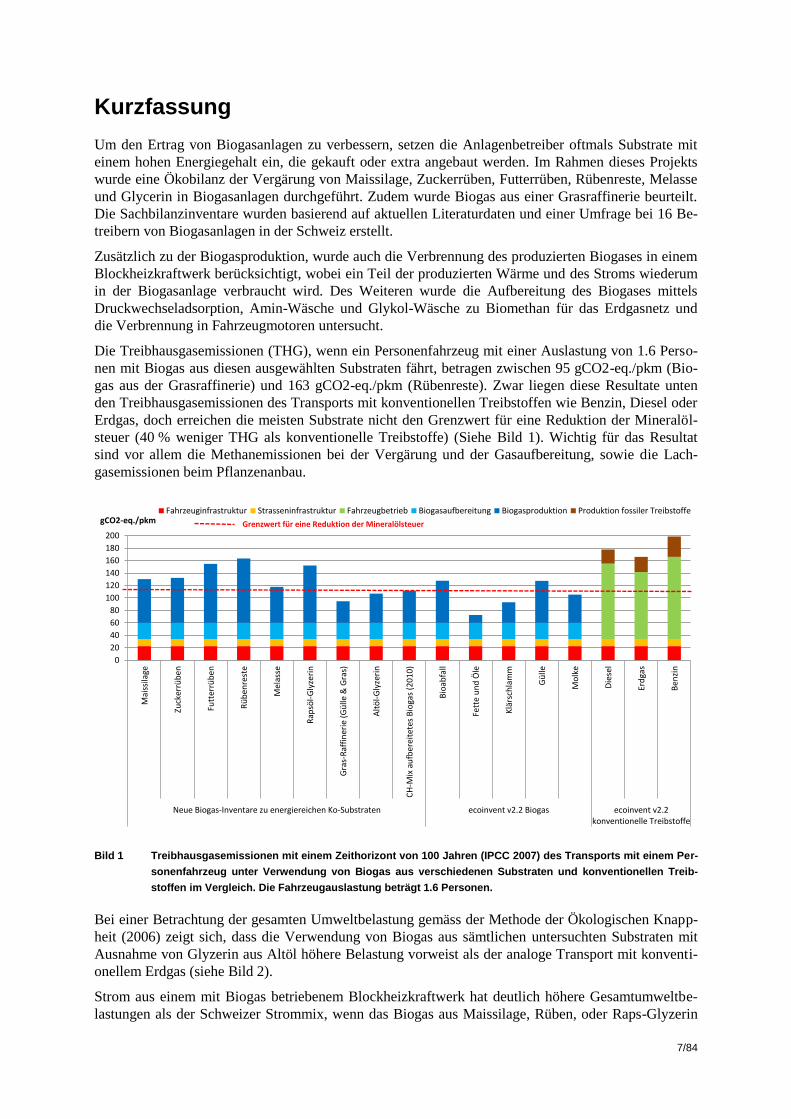
Die Treibhausgasemissionen (THG), wenn ein Personenfahrzeug mit einer Auslastung von 1.6 Perso-
nen mit Biogas aus diesen ausgewählten Substraten fährt, betragen zwischen 95 gCO2-eq./pkm (Bio-
gas aus der Grasraffinerie) und 163 gCO2-eq./pkm (Rübenreste). Zwar liegen diese Resultate unten
den Treibhausgasemissionen des Transports mit konventionellen Treibstoffen wie Benzin, Diesel oder
Erdgas, doch erreichen die meisten Substrate nicht den Grenzwert für eine Reduktion der Mineralöl-
steuer (40 % weniger THG als konventionelle Treibstoffe) (Siehe Bild 1). Wichtig für das Resultat
sind vor allem die Methanemissionen bei der Vergärung und der Gasaufbereitung, sowie die Lach-
gasemissionen beim Pflanzenanbau.
Bild 1 Treibhausgasemissionen mit einem Zeithorizont von 100 Jahren (IPCC 2007) des Transports mit einem Per-
sonenfahrzeug unter Verwendung von Biogas aus verschiedenen Substraten und konventionellen Treib-
stoffen im Vergleich. Die Fahrzeugauslastung beträgt 1.6 Personen.
Bei einer Betrachtung der gesamten Umweltbelastung gemäss der Methode der Ökologischen Knapp-
heit (2006) zeigt sich, dass die Verwendung von Biogas aus sämtlichen untersuchten Substraten mit
Ausnahme von Glyzerin aus Altöl höhere Belastung vorweist als der analoge Transport mit konventi-
onellem Erdgas (siehe Bild 2).
Strom aus einem mit Biogas betriebenem Blockheizkraftwerk hat deutlich höhere Gesamtumweltbe-
lastungen als der Schweizer Strommix, wenn das Biogas aus Maissilage, Rüben, oder Raps-Glyzerin
0
20
40
60
80
100
120
140
160
180
200
Mai
ssila
ge
Zuck
errü
ben
Futt
errü
ben
Rü
ben
rest
e
Mel
asse
Rap
söl-
Gly
zeri
n
Gra
s-R
affi
ner
ie (
Gü
lle &
Gra
s)
Alt
öl-
Gly
zeri
n
CH
-Mix
au
fber
eite
tes
Bio
gas
(20
10)
Bio
abfa
ll
Fett
e u
nd
Öle
Klä
rsch
lam
m
Gü
lle
Mo
lke
Die
sel
Erd
gas
Ben
zin
Neue Biogas-Inventare zu energiereichen Ko-Substraten ecoinvent v2.2 Biogas ecoinvent v2.2konventionelle Treibstoffe
gCO2-eq./pkmFahrzeuginfrastruktur Strasseninfrastruktur Fahrzeugbetrieb Biogasaufbereitung Biogasproduktion Produktion fossiler Treibstoffe
Grenzwert für eine Reduktion der Mineralölsteuer

8/84
produziert wird. Elektrizität aus vergärten Energiepflanzen kann deshalb nicht als ökologische Alter-
native betrachtet werden. Wenn jedoch das Biogas aus Abfallprodukten wie Klärschlamm, Gülle, Alt-
öl-Glyzerin oder Bioabfall produziert wird, liegen die Gesamtumweltbelastungen tiefer als beim
Schweizer Strommix.
Zurzeit wird Biogas in der Schweiz hauptsächlich durch Vergärung solcher Abfallprodukte hergestellt.
Falls in Zukunft die Vergärung von pflanzlichen Produkten wie z.B. Maissilage, Futter- und Zucker-
rüben, Rübenreste, Melasse und Raps-Glyzerin deutlich zunimmt, kann das produzierte Biomethan die
Grenzwerte für eine Reduktion der Mineralölsteuer nicht mehr in allen Fällen einhalten.
Bild 2 Umweltbelastungspunkte (UBP) gemäss der Methode der Ökologischen Knappheit des Transports mit ei-
nem Personenfahrzeug unter Verwendung von Biogas aus verschiedenen Substraten und konventionellen
Treibstoffen im Vergleich. Die Fahrzeugauslastung beträgt 1.6 Personen.
0
50
100
150
200
250
300
350
400
450
Mai
ssila
ge
Zuck
errü
be
n
Futt
errü
ben
Rü
ben
rest
e
Mel
asse
Rap
söl-
Gly
zeri
n
Gra
s-R
affi
ner
ie (
Gü
lle &
Gra
s)
Gra
s-R
affi
ner
ie (
Gü
lle &
Gra
s)
Alt
öl-
Gly
zeri
n
CH
-Mix
au
fber
eite
tes
Bio
gas
(20
10
)
Bio
abfa
ll
Fett
e u
nd
Öle
Klä
rsch
lam
m
Gü
lle
Mo
lke
Die
sel
Erd
gas
Ben
zin
Neue Biogas-Inventare zu energiereichen Ko-Substraten ecoinvent v2.2 Biogas ecoinvent v2.2konventionelle
Treibstoffe
UBP/pkm Fahrzeuginfrastruktur Strasseninfrastruktur Fahrzeugbetrieb Biogasaufbereitung Biogasproduktion Produktion fossiler Treibstoffe
Grenzwert für eine Reduktion der Mineralölsteuer

9/84
1 Introduction
1.1 Background
Biogas from anaerobic digestion either can be burned directly in cogeneration power and heat plants
or can be used as substitute for or additive to natural gas. In contrast to fossil fuel systems, the carbon
dioxide released from biogas production and combustion, was just recently assimilated in photosyn-
thesis. This emission does not result in a net production of carbon dioxide and is therefore neutral to
climate change, as long as plants continue taking up carbon dioxide.
As a consequence, the overall environmental performance of biogas production is strongly dependent
on the environmental impacts of the substrate provision, the biogas yield, the energy input and source
for the digestion process and direct emissions from the process and the use of digestates (Börjesson &
Berglund 2005). Actual biomass substrates used in anaerobic digestion have different biogas yields
due to their different energy content. Substrates with high energy contents are often purchased or
grown by farmers in order to enhance the biogas yield. The digestion of low-energy substrates is often
treated as a disposal service and generates an additional income. This study focuses on substrates,
which are added to the usual substrates in order to enhance the biogas yield of the digestion process.
Furthermore, it includes life cycle inventories of a grass refinery providing the products insulation ma-
terials, organic fertilisers, biopolymers, and biogas from grass silage.
1.2 Goal and scope
This study aims to assess the environmental impact of the current situation of biogas production and
potential substrates for future co-digestion in Switzerland. The goals of this study can be summarized
as follows:
Assessment of the environmental impact of purchased substrates in biogas plants
Update of the emissions from cogeneration units
Assessment of the environmental impacts of the various products of a grass refinery
Modelling of the different technologies for biogas purification in Switzerland
Evaluation of the actual production mix of purified biomethane for the natural gas supply grid
and the use as fuel in vehicles in Switzerland
In a first step, this study gives an overview of different substrates that can be used in co-digestion, and
six substrates are selected for an in-depth analysis in this project. For the assessment of the environ-
mental performance of different biomass substrate, the supply of the substrate has to be taken into ac-
count. If the purpose of the substrate production is the production of biogas, the full production pro-
cess has to be allocated to the environmental impact of biogas production. However, the substrates of-
ten are by- or co-products of other production processes and have to be dealt as multi-output process.
The environmental impact of the production process is allocated using the price of the different prod-
ucts as allocation factor.
Secondly, the emissions from the biogas production and combustion in cogeneration units have to be
considered. The two main gases produced in an anaerobic digestion plant are carbon dioxide and me-
thane. Methane is a highly potential greenhouse gas. The release of methane during biogas production
is of major interest considering the environmental performance of biogas production. The combustion
of biogas in cogeneration units leads to specific emissions, which are dependent on the applied tech-
nology and composition of the biogas.
In Fig. 1.1 a flow chart of the production of biogas and biomethane as well as the co-generation of
heat and electricity from the biogas is presented. Operators of biogas plants have the option to send
some of the produced biogas for purification to biomethane which can be used as a fuel in road trans-
portation. Alternatively, they can burn all biogas in a cogeneration unit in order to produce electricity

10/84
and heat. A minimum amount of biogas needs to be burned in cogeneration unit, in order to cover the
heat (and optionally also the electricity) requirement of the anaerobic digestion plant.
Fig. 1.1 Flow chart of the biogas production from substrates of the purification to biomethane and of the generation
of heat and electricity in a biogas co-generation unit
In addition to the life cycle inventories of biogas from different substrates, new datasets of the various
products from a grass refinery are established. These are insulation materials, organic fertilisers, bio-
polymers, and biogas. The substrates of the biogas plant in the grass refinery are cow slurry and grass
slurry. In Fig. 1.2 a flow chart of the grass refinery is presented. The data of the grass refinery are
based on a study prepared by Leuenberger & Jungbluth (2010).

11/84
Fig. 1.2 Flow chart of the grass refinery
The following chapters firstly give an overview on substrates used for anaerobic co-digestions (Chap-
ter 2). Secondly they present a summary of the life cycle inventories of biogas from six selected sub-
strates, as well as models of burning the biogas from these substrates in a cogeneration unit, purifying
biogas with different technologies, and producing various products in a grass refinery (Chapter 3). Fi-
nally, the life cycle impact assessment results of using biogas for transportation are shown (Chapter 4).
The detailed life cycle inventory data are presented in the Appendix.
1.3 Allocation
With regard to the LCA of biogas production, allocation questions come up concerning the production
of the biogas substrates and the fate of the biogas digestates.
Fig. 1.3 shows how the production of the substrate and the fate of the digestate are allocated in the da-
tasets of biogas from sewage sludge and manure prepared by Jungbluth et al. (2007) and in this study.

12/84
Fig. 1.3 Allocation in datasets of biogas from sewage sludge and manure prepared by Jungbluth et al. (2007) and in datasets of biogas from energy substrates in this study
Substrate production &
cultivation Biogas production
Digestate application on land
Agricultural plant cultivation
Wastewater treatment
(production of sewage sludge)
Biogas production
Disposal of digested sewage
sludge
Substrate collection and transport
Animal breeding (manure
production)
Biogas production Manure application on land
Agricultural plant cultivation
Transport
Allocated to wastewater treatment
Allocated to biogas production
Allocated to animal breeding
Allocated to biogas production Allocated to plant cultivation
Allocated to biogas production
Emissions from
manure storage
Additional emissions
from storage
because of digestion
Additional emissions because of application
from digestated
manure
Allocated to plant cultivation
Biogas from
sewage sludge in ecoinvent
v2.2
Biogas from
manure in ecoinvent
v2.2
Biogas from high
energy substrates
in this study

13/84
In the case of biogas from sewage sludge only the resource consumption and emissions directly related
to the biogas production are considered in the biogas dataset. The production of sewage sludge is part
of the wastewater treatment service in a sewage plant and is therefore not considered in the biogas in-
ventory. The disposal of sewage sludge is also part of wastewater treatment in sewage plants without
biogas production. Consequently, the environmental impacts of the disposal of the digested sludge are
not considered in the biogas inventory.
In the case of biogas from manure, the substrate (manure) is considered as a waste product from ani-
mal breeding. Consequently, the environmental impacts from animal breeding are allocated to the an-
imal products such as meat, milk etc. and not to the manure. Emissions from manure also occur, if
manure is not digested in biogas plants. Therefore, those emissions are allocated to the animal breed-
ing. However, if manure is used as biogas substrate, there are higher emissions compared to conven-
tional manure digestion. These additional emissions are considered in the inventory of the biogas pro-
duction. Manure is an important fertilizer in agricultural plant production. Thus, the environmental
impacts from application of digested or undigested manure on agricultural land is allocated to the agri-
culture and not to the biogas production.
Finally, in the case of biogas from energy substrates in this study, operators of biogas plants purchase
those substrates or grow them on their own field in order to increase the biogas production. Hence,
these products are not wastes and the environmental impacts of their production are considered in the
life cycle inventory of the produced biogas. With regard to the application of digestates on agricultural
land, the situation is similar to the application of manure. The digestates have a fertilizing effect on the
soil and therefor the environmental impacts of their application in agriculture are attributed to the life
cycle of the cultivated plants.
The allocation of the digestate fate as described above is a common approach in LCA. However, a
common agreement on how to allocate the environmental impacts (e.g. transport, spreading, heavy
metal emissions into soil) from the digestate application on agricultural fields is not achieved yet. In
order to increase the fertility of their soil, some farmers purchase these digestates from biogas plants
by paying a price. However, in other cases farmers who accept the digestates from biogas plants re-
ceive a payment for this disposal service of the residues. This would justify an allocation of the diges-
tate application to the biogas produced. Very common is the situation where the biogas plant is the
part of the same entity as the agricultural fields where the digestates are applied. Obviously, there is no
money transferred with regard to the digestate application and an economic allocation is not feasible.
In order to incorporate the different expert opinions on how to allocate the environmental impacts
from digestate application, we include a scenario in this study where the digestate application is allo-
cated to the biogas production.
The economic allocation between sugar beets and beet residues as well as between plant oil methyl es-
ter and glycerine is described in Appendix 8.
14/84
2 Overview of biomass substrates for co-digestion
Traditionally, mainly sewage sludge was used to generate biogas, but with growing interest other sub-
strates are fed into anaerobic digestion.
According to the list by VKS (Verein Kompost und Vergärung Schweiz), the following categories of
substrates can be used for anaerobic digestion (Inspektorat der Kompostier- und Vergärbranche der
Schweiz 2006):
Crops + grass
Harvest residues and by-products
Manure
Industrial organic waste by-products and waste
By-products and waste from horticulture and landscape management
Municipal organic waste
For most of these substrates categories, life cycle inventories have been established and are published
in the ecoinvent database v2.2 (Jungbluth et al. 2007).
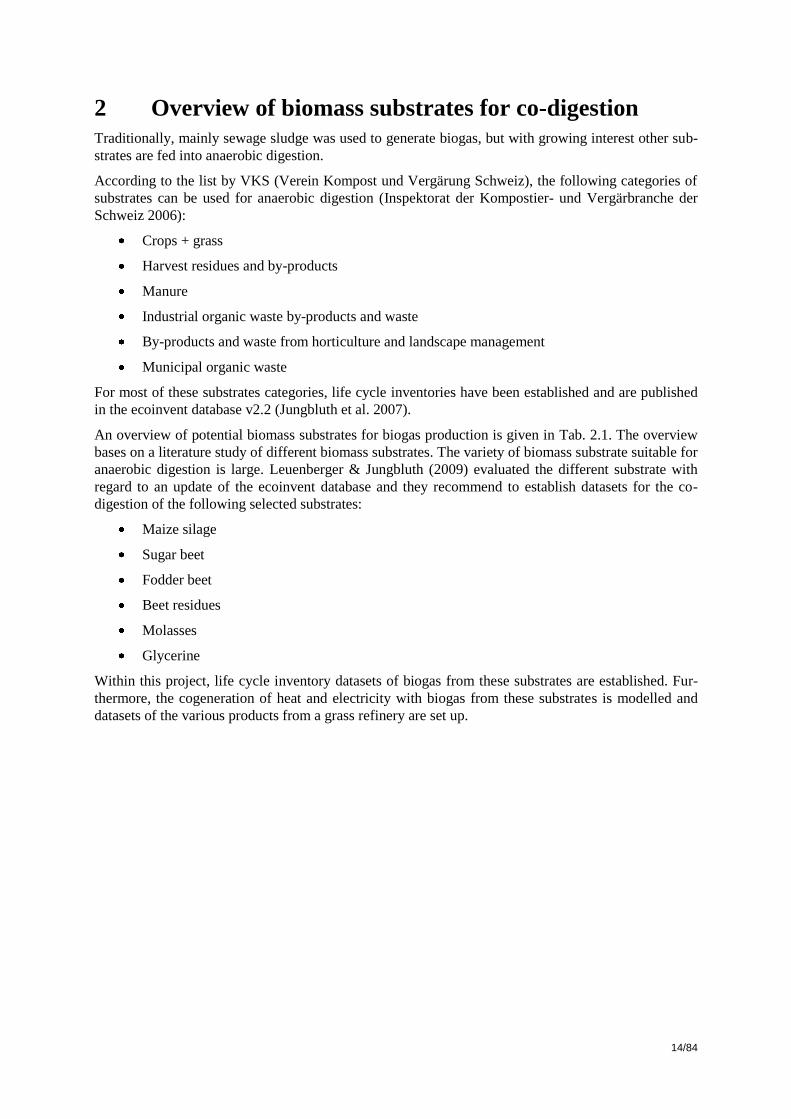
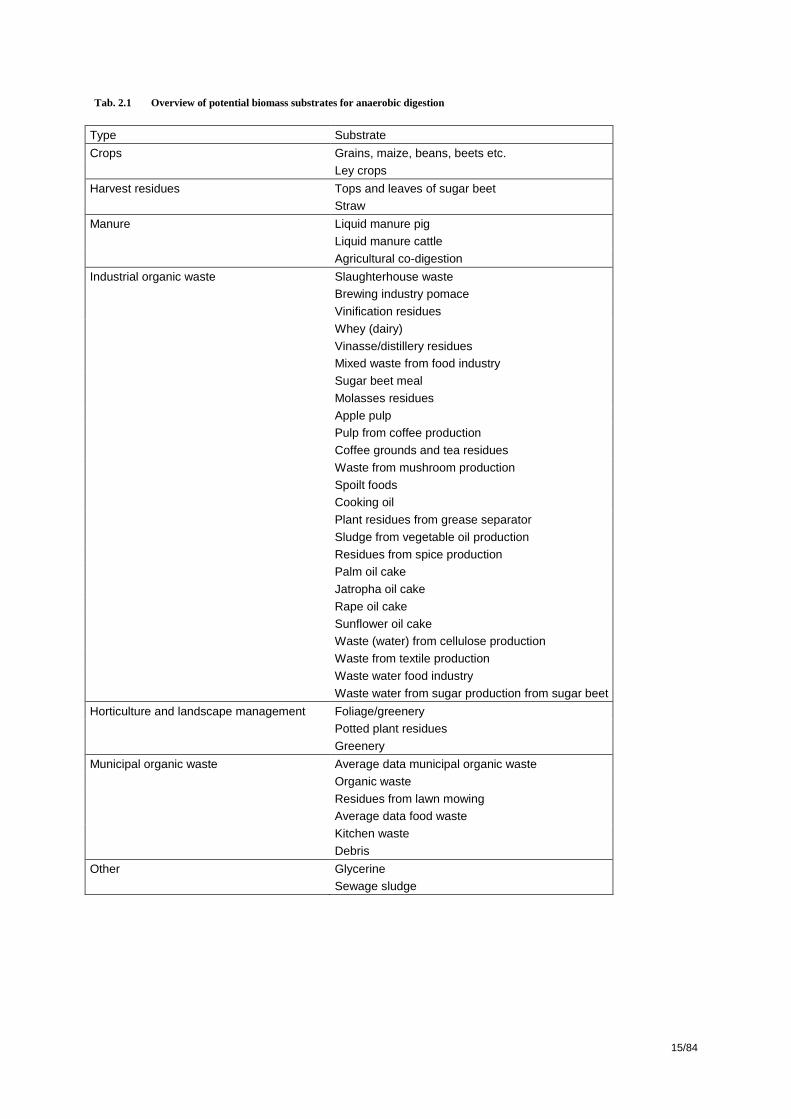
An overview of potential biomass substrates for biogas production is given in Tab. 2.1. The overview
bases on a literature study of different biomass substrates. The variety of biomass substrate suitable for
anaerobic digestion is large. Leuenberger & Jungbluth (2009) evaluated the different substrate with
regard to an update of the ecoinvent database and they recommend to establish datasets for the co-
digestion of the following selected substrates:
Maize silage
Sugar beet
Fodder beet
Beet residues
Molasses
Glycerine
Within this project, life cycle inventory datasets of biogas from these substrates are established. Fur-
thermore, the cogeneration of heat and electricity with biogas from these substrates is modelled and
datasets of the various products from a grass refinery are set up.
15/84
Tab. 2.1 Overview of potential biomass substrates for anaerobic digestion
Type Substrate
Crops Grains, maize, beans, beets etc.
Ley crops
Harvest residues Tops and leaves of sugar beet
Straw
Manure Liquid manure pig
Liquid manure cattle
Agricultural co-digestion
Industrial organic waste Slaughterhouse waste
Brewing industry pomace
Vinification residues
Whey (dairy)
Vinasse/distillery residues
Mixed waste from food industry
Sugar beet meal
Molasses residues
Apple pulp
Pulp from coffee production
Coffee grounds and tea residues
Waste from mushroom production
Spoilt foods
Cooking oil
Plant residues from grease separator
Sludge from vegetable oil production
Residues from spice production
Palm oil cake
Jatropha oil cake
Rape oil cake
Sunflower oil cake
Waste (water) from cellulose production
Waste from textile production
Waste water food industry
Waste water from sugar production from sugar beet
Horticulture and landscape management Foliage/greenery
Potted plant residues
Greenery
Municipal organic waste Average data municipal organic waste
Organic waste
Residues from lawn mowing
Average data food waste
Kitchen waste
Debris
Other Glycerine
Sewage sludge

16/84
3 Life cycle inventories: summary
In this Chapter, a summary of the modelled life cycle inventories is given. Subchapter 3.1 describes
the production of biogas, Subchapter 3.2 describes the application of digested matter on agricultural
land, Subchapter 3.3 explains the model for the cogeneration of heat and electricity from biogas, Sub-
chapter 3.4 presents the detailed model of a grass refinery, and Subchapter 3.5 describes the life cycle
inventories of biogas purification. The full description of the life cycle inventories is presented in the
Appendix.
3.1 Biogas conversion in agricultural biogas plants
In this Subchapter, we describe specific substrates that are used in biogas plants for co-digestion. The-
se are maize silage, sugar beets, fodder beets, beet residues, molasses, and glycerine.
In Tab. 3.1 the properties of the average Swiss biogas mix are shown. Since the methane content of
biogas is the key property, the biogas yields of different biogas substrates are corrected according to
the methane content of the produced biogas (see Tab. 3.2). Furthermore, Tab. 3.2 shows the biogas
conversion efficiency calculated as the ratio of the energy content of the produced biogas to the energy
content of the used substrate.
Tab. 3.1 Summary of main properties of the Swiss biogas mix according to Jungbluth et al. (2007:244)
Biogas-Mix
Methane Vol. % 63.3
Carbon dioxide Vol. % 33.4
Methane Kg/Nm3
0.45
Carbon Dioxide Kg/Nm3 0.66
Total Carbon Content Kg/Nm3 0.52
Nitrogen Vol. % 3.17
Density Kg/Nm3 1.15
Lower heating value MJ/Nm3
22.7
Tab. 3.2 Actual and methane corrected biogas yield of different substrates (Institut für Energetik und Umwelt 2006)
and biogas conversion efficiency
Substrate Unit Maize si-
lage
Sugar
beet
Fodder
beet
Beet res-
idues Molasses Glycerine
Biogas yield Nm3 per
t fm 188.4 175.0 109.4 59.5 287.3 976.5
Methane content Vol. % 53% 54% 54% 55% 73% 50%
Methane correct-
ed biogas yield
Nm3 per
t fm 156.1 147.8 92.4 51.2 328.9 770.6
Energy content of
substrate MJ/kg 5.3 3.8 3.0 3.5 n/a 18.0
Biogas conver-
sion efficiency
MJbio-
gas/MJin 67% 89% 70% 34% n/a 97%
3.1.1 Biogas from maize
Maize is one of the most commonly used energy crop in agricultural or industrial biogas production
plants and therefore plays an important role for the evaluation of different substrates in anaerobic di-
gestion. Compared to other energy crops, the properties of maize silage are favourable for biogas pro-
duction. The cultivation has no special requirements, the maize yield per hectare is comparably high,

17/84
and the silage can easily be stored in bunker silos (Institut für Energetik und Umwelt gGmbH 2006).
The biogas yield per ton maize silage depends on the variety. Varieties with late ripening produce
more biogas than early ripening varieties (Amon et al. 2007a; Institut für Energetik und Umwelt
gGmbH 2006). A drawback of maize silage used in anaerobic digestion is its competitive use as ani-
mal feed.
Experiences with maize in anaerobic digestion are available from biogas production in Germany,
where maize is often added as a co-substrate. The agricultural production of maize has to be fully at-
tributed to the environmental impact of the biogas production. LCI data on maize cultivation is availa-
ble in the ecoinvent database (Nemecek et al. 2007).
The specifications of maize silage that are used in this study are declared in Tab. 3.3.
Tab. 3.3 Specification of maize silage and of the production of biogas from this substrate (Institut für Energetik und
Umwelt gGmbH 2006)
Maize silage
Dry matter content % 27.5%
organic substance % DM 90.0%
N % DM 1.6%
P % DM 0.3%
Biogas yield m3 per t DM 672.7
CH4 content % 52.5%
3.1.2 Biogas from sugar beet, fodder beet and beet residues
Apart from maize, beet cultivation in Switzerland provides large amounts of biomass, which could be
potentially used in biogas production. Currently, beets are used for sugar production or as animal feed.
If the beet silage is directly added to anaerobic digestion, the environmental impact of beet production
has to be taken into account for the LCA of biogas production.
Similar to maize silage, the cultivation of beets has a high yield and the methane production is compa-
rably high. Cultivation requirements and the storage of the silage on the other hand are more compli-
cated. The dependence of biogas yield from fodder beet digestion on microbiologic conditions has
been investigated by Scherer et al. (2009).
As sugar and fodder beets are primarily used for sugar production or animal feed respectively, the use
of the entire beet as substrate still is uncommon. More often the residues from sugar and fodder beet,
leafs and tops, are fermented in closed silos and later used as substrates (Börjesson & Berglund 2005).
Residues from sugar and fodder beet processing, mainly tops and leaves, are organic by-products with
high dry matter contents. This makes them attractive for the use as substrate in anaerobic digestion.
Depending on the market price paid for the sugar and fodder beet residues, a part of the environmental
impact arising from beet production has to be allocated to the beet residues.
The use as substrates with solid potato waste showed, that the biogas yield can be enhanced, when
fodder beet leafs are digested together with other substrates (Parawira et al. 2008).
The specifications of sugar beets, fodder beets and beet residues that are used in this study are declared
in Tab. 3.4.

18/84
Tab. 3.4 Specification of sugar beet, fodder beet, and beet residues, as well as of the production of biogas from the-
se substrates
Sugar Beet Fodder Beet Beet leaves Beet leaves Beet residues
Institut für
Energetik
und Umwelt
(2006)
Institut für
Energetik
und Umwelt
(2006)
Institut für
Energetik
und Umwelt
(2006)
Baserga (2000) This study
Dry matter
content % 23.0% 12.0% 16.0% 16.5% 16.3%
Organic
substance % DM 92.5% 80.0% 82.5% 79.0% 80.8%
N-content % DM 2.6% 1.9% 0.3% - 0.3%
NH4-content % DM 0.2% 0.4% - - 0.04%
P-content % DM 0.4% 0.3% 0.8% - 0.8%
Biogas yield Nm
3 per t
DM 760.8 729.1 437.5 355.5 396.5
CH4 content % 53.5% 53.5% 54.5% - 54.5%
3.1.3 Biogas from molasses
Molasses are a by-product of sugar production. They have high dry matter and sugar contents and
therefore are suitable to increase the biogas yield of liquid biogas substrates. Like the other sugar beet
residues, molasses are used as animal feed or in distilleries, which makes it rather rare for the use as
substrate for anaerobic digestion (Institut für Energetik und Umwelt gGmbH 2006).
The specifications of molasses that are used in this study are declared in Tab. 3.5.
Tab. 3.5 Specification of molasses and of the production of biogas from this substrate
Molasses Molasses Molasses
Institut für Energetik und Umwelt
(2006) Baserga (2000) This study
Dry matter content % 85.0% 80.0% 82.5%
organic substance % DM 87.5% 79.0% 91.3%
N % DM 1.5% - 1.5%
P % DM 0.3% - 0.3%
Biogas yield m3 per t DM 370.6 427.5 399.0
CH4 content % 72.5% - 72.5%
3.1.4 Biogas from glycerine
Glycerine for biogas production is mainly extracted in vegetable oil esterification plants, but it can al-
so be produced by many other industries (petrochemical, soap by-product etc.). Glycerine is used with
increasing popularity as a substrate and increases the biogas yield considerably. The use of glycerine
as a mono-substrate in biogas fermentation has been investigated by Erb et al. (2008). In the question-
naires filled in by operators of agricultural biogas plants, three operators declare that they pay a price
of between 200 and 220 CHF per ton of glycerine in 2008 and 2009 (Dauriat et al. 2011). In this study
we investigate the use of glycerine made from rape oil and glycerine made from waste oil in the biogas
production.
The specifications of glycerine that are used in this study are declared in Tab. 3.6.

19/84
Tab. 3.6 Specification of glycerine and of the production of biogas from this substrate (Erb et al. 2008; Institut für
Energetik und Umwelt gGmbH 2006])
Glycerine
Dry matter content % 97.2%
organic substance % DM 93.6%
N % DM 0.03%
P % DM 0.003%
Biogas yield m3 per t DM 1004.3
CH4 content % 50.0%
3.1.5 Energy consumption
In order to evaluate typical conditions of the operation of agricultural biogas plants in Switzerland, a
questionnaire was sent to biogas operators. Sixteen operators filled in the questionnaire.
About 61.7 % of the biogas from these biogas plants is produced with self-produced electricity and
38.3 % with purchased electricity. The heat used in the biogas plants is commonly generated onsite
from burning biogas.
From the 16 filled in questionnaires we obtained the information that the electricity consumption of
biogas production in an agricultural co-digestion plant e.g. for stirring the substrates amounts between
0.5 and 36.4 kWh per ton substrate with an average of 12.9 kWh/ton. The heat consumption of the bi-
ogas plants amounts between 16.7 and 356.4 MJ per ton substrate with an average of 187.7 MJ/ton.
The average energy consumption per ton of substrates is applied in the inventories.
With regard to the energy consumption per m3 of biogas, the average amounts to 0.158 kWh of elec-
tricity and 3.470 MJ heat per m3 biogas.
1 (Dauriat et al. 2011)
3.1.6 Infrastructure
According to the questionnaires, 62.9 % of the biogas is produced in plants with digestate cover and
37.1 % in plants without digestate cover. We apply two different inventories for biogas plants with and
without cover, respectively. The calculation of the infrastructure use per ton of handled substrate is
shown in Tab. 3.7.
1 All information from this Section: Personal communication with Arnaud Dauriat from ENERS on 22.11. 2010

20/84
Tab. 3.7 Calculation of infrastructure use per ton of handled substrate in biogas plants (based on data from
Jungbluth et al. (2007))
3.1.7 Ammonia, dinitrogen monoxide, and methane emissions
From the filled in questionnaires we obtained the information that 62.9 % of the biogas is produced in
plants with digestate cover and 37.1 % in plants without digestate cover. The LCI datasets described in
this chapter refer to biogas production in a mix of biogas plants with and without digestate cover.
Ammonia emissions arise from the storage of digestates. According to Edelmann et al. (2001) because
of the conventional storage and application of liquid manure, 50 % of the ammonium content is re-
leased as ammonia emissions. 1/6th of these emissions stem from the storage and 5/6
th from the appli-
cation resulting in emission factors of 8.3 % during storage and 41.7 % during and after application on
fields.
Furthermore, Edelmann et al. (2001) explain that the conversion in a biogas plant leads to increased
ammonia emissions due to an increased degradation of organically bound nitrogen in the fermenter
and an increase of the pH value. Ammonia emissions are therefore increased by 40 % during storage
and by 10 % during application. This leads total ammonia emission factors of 11.7 % of the ammonia
content in the substrates during digestate storage and 45.8 % during digestate application on fields.
With appropriate measures these emissions can be reduced. The emissions during storage are reduced
by 80 % when digestates are covered.2
Dinitrogen monoxide emissions from digesting substrates amount to 0.1 kg /t according to Jungbluth
et al. (2010). When digestates are covered, these emissions are reduced by 75 %.
According to Jungbluth et al. (2007) the methane emission factor amounts to 1 % in biogas plant with
covered stock and to 5 % in biogas plants with uncovered stock. The emission factor of an average bi-
ogas plant is considered by applying the shares of biogas plants with and without digestate cover as
described above and by considering the methane share of 63.3 % in the volume of the produced bio-
gas.
3.2 Application of digested matter on agricultural land
After the production of biogas, the digested matter is usually spread as fertiliser on agricultural land.
This requires vehicles and machinery for transport and spreading and it leads to ammonia emissions
2 www.nw.ch/dl.php/de/20060502101744/Ammoniak_NH3_Faktenblatt.pdf (access on 11.10.2011)
Uncovered biogas plant
Capacity m3 300
Life time years 20
Annual biogas production Co-
substrate and manure mixm
3/a 104000
Potential Biogas Production m3/t substrate 53.08
Annual substrate handling tons/a 1959
Infrastructure requirement m3/t substrate 2.55E-05
Covered biogas plant
Capacity m3 500
Life time years 20
Annual biogas production m3/a 300000
Potential Biogas Production m3/t substrate 53.08
Annual substrate handling tons/a 5652
Infrastructure requirement m3/t substrate 8.85E-06

21/84
into air and heavy metal emissions into soil. In the standard case, the environmental impacts from the
digestate application are allocated to the agricultural cultivation and not to the biogas production (see
Subchapter 1.3). However, in a scenario we analyse the environmental impacts if the digestate applica-
tion is allocated to the biogas production.
The filled in questionnaires show that solid digested matter is delivered over a distance between
1.5 km and 5 km with a weighted average distance of 3.0 km. Liquid digested matter is delivered over
a distance between 0.5 km and 20 km with a weighted average distance of 10.5 km.
As described in Section 3.1.7, 45.8 % of the ammonia content in the substrate is released into air when
applying the digestates on agricultural fields. New biogas plants in Switzerland often use trail hoses
for spreading liquid digested matter, which reduces the ammonia emissions about 40 % according to
Edelmann (2006). We assume in the application datasets that such trail hoses are used. Hence, the
ammonia emissions per kg digested matter are calculated with the following procedure: First, the share
of NH4 available nitrogen in the dry matter content is multiplied with the dry matter content of the
substrate input per m3 biogas and the amount of nitrogen is converted into ammonia with the molecu-
lar weight of the two substances. This amount of ammonia is multiplied with the emission factor of
45.8 %. The resulting figure is divided by the amount of digested matter per m3 biogas and the 40 %
emission reduction due to the use of trail hoses is applied. The nitrogen and ammonium content of the
substrates is presented in Tab. 3.8.
Tab. 3.8 Nitrogen and ammonium content in substrates
Nitrogen content
according to the Institut für Ener-
getik und Umwelt (2006)
NH4-content
according to according to the Institut für Ener-
getik und Umwelt (2006) and own estimations
% TS % TS
Maize silage 1.1-2 0.15-0.3
Sugar beets 2.6 0.2
Beet residues 0.2-0.4 0.04
Molasses 1.5 0.17
No dinitrogen monoxide emissions arise from the application of digestates, when using trail hoses
(Jungbluth et al. 2010).
When digested matter is applied as fertiliser on agricultural land, the heavy metal content of the biogas
substrates is emitted into the soil. In general, the heavy metal emissions from the digestates are calcu-
lated from the elemental composition of the substrates reported by the Institut für Energetik und Um-
welt (2006). Missing data are completed with information from Freiermuth-Knuchel (2006).
3.3 Cogeneration of electricity and heat in agricultural biogas plants
In most agricultural biogas plants, biogas is burned in order to co-generate electricity and heat. The
heat consumption in the biogas plants is usually met with the own heat generation whereas the elec-
tricity consumption is only partly met with own produced electricity and additional electricity from
grid needs to be bought.
3.3.1 Emissions from combustion of biogas in agricultural co-generation units
Some older cogeneration units use pilot fuel, which leads to higher emission values. Newer types
however use lean-burn engines with a SCR catalyst, which reduces the emissions considerably. Emis-
sion data for cogeneration unit of these newer technologies were updated and documented in

22/84
Jungbluth et al. (2010). For the update of the ecoinvent data on biogas combustion, these values are
applied.
In previous inventories, the emission of biogas is mainly estimated based on data of natural gas fur-
naces. However, newer publications show that in biogas plants partly much higher emissions occur
(Bayer. Landesamt für Umwelt (Hrsg.) 2006:62ff, Nielsen & Illerup 2003:33ff, Kath 2009:3). There-
fore, these emission factors are applied in this study.
The Swiss Clean Air Act3 regulates the exhaust emissions of biogas cogeneration units with limits of
50 mg particulate matter per Nm3, 400 mg/Nm
3 of NOx and 650 mg/Nm
3 of CO (related to 5 % residu-
al oxygen). The amount of nitrous oxides fluctuates considerably depending on the biogas quality (me-
thane content). A typical 100 kWel cogeneration unit with ignition engine emits about 1’100 mg/Nm3
NOx and 800 mg/Nm3 CO (Ruch 2005).
In a research project a catalyst with SCR basis was developed which balances all fluctuations in the
exhaust emissions from cogeneration units in biogas plants. This catalyst enables operators of cogen-
eration units to smoothly comply with the limits of the Clean Air Act (Ruch 2005).
In contrast to cogeneration units with very high emission factors, there are also cogeneration units
available with much lower emissions which even fall below the limits in the canton Zurich of 50 mg
NOx/Nm3 and 150 mg CO/Nm
3.
Currently, no cogeneration units with catalysts are known in Switzerland. Normally, lean burn engines
are used, which comply with the Clean Air Act limit of 400 mg/Nm3. Considerably higher can be the
emissions from ignition gas engines which are typically used in Germany and in which 5 to 10 % of
diesel is co-burnt. With these engines it is difficult to comply with the Swiss limits (median of meas-
urements at 450 mg/Nm3). Therefore such ignition gas engines are a phased-out model. As far as it is
known to the authors, since the last few years only lean burn engines were installed in Switzerland.
Gas motors like all type of furnaces have to be checked regularly with regard to compliance with the
exhaust emission limits in the Clean Air Act. (Jungbluth et al. 2010)
Within the survey about Swiss operators of biogas plants that was conducted in this project, 87.5 % of
the operators declared that they installed biogas engines in their biogas plants. Only two operators use
ignition engines, one with diesel and one with biodiesel. The operators declare their nitrous oxide
emissions as between 300 and 900 mg/Nm3 with an average at 470 mg/Nm3 which is considerably
higher than the 15 mg/Nm3 estimated by Jungbluth et al. (2007) based on natural gas furnaces. The
average nitrous oxide emissions from the survey are used for the dataset of the combustion of biogas
in a biogas engine.
3.3.2 Cogeneration of electricity and heat
The range of capacities and the efficiency of the cogeneration units with biogas engines considered in
the survey within this project is displayed and compared to the data used in Jungbluth et al. (2007) in
Tab. 3.9. The average electric and thermal efficiency from the survey is considered in order to estab-
lish datasets of the cogeneration of electricity and heat with biogas from specific substrates.
3 Luftreinhalteverordnung (LRV)

23/84
Tab. 3.9 Selected results of the survey of 16 Swiss operators compared to the data implemented by Jungbluth et al.
(2007)
Survey of 16 Swiss biogas operators (2010)
minimum maximum
This study
(average)
Jungbluth et al.
(2007)
capacity kW 15 250 118.6 160
electric efficiency % 25% 39% 35.4% 32%
thermal efficiency % 45% 64% 51.0% 55%
nitrous oxide emissions mg/Nm3 300 900 470.0 15
The inventory of the cogeneration of heat and electricity encompasses the infrastructure, the operation
of the engine (including auxiliary materials and emissions into air), and the specific type of used bio-
gas. The allocation of the emissions and the shared infrastructure elements to the two products heat
and electricity is based on exergy content. The exergy value of electricity is 1 and the exergy value of
heat is 0.17. The multiplication of the exergy value with the heat and electricity outputs per MJ biogas
input leads to an allocation of 80 % to the electricity generation and 20 % to the heat generation.
3.4 Grass refinery
The grass refinery of the Biowert Industrie GmbH. produces insulation material (AgriCell), organic
fertiliser (AgriFer) and biopolymers (AgriPlast) from grass silage as raw material. The grass silage is
stored in a silo and later fed in a disintegration process. After the disintegration process, the grass fi-
bres are used for AgriCell and AgriPlast production. Grass slurry is a by-product of the grass disinte-
gration. Together with cow slurry it is used as a substrate in the biogas production. All parts of the bi-
ogas plant are covered. This leads to considerably lower emission values compared to uncovered bio-
gas plants. In a proxy, the allocation factor is set to 90% for biogas and 10% for the digestate.
The biogas is burned in a cogeneration unit, which generates heat and electricity used for the different
production processes or could be sold as grid electricity. The allocation of the environmental impact to
heat and electricity is carried out according to the allocation factor used in the ecoinvent data set (ex-
ergy content).
In order to utilize digestate from the anaerobic digestion, the organic matter content is concentrated in
a reversed osmosis. The products of this process can be used as organic fertilizers (AgriFer) on the
grass fields. The nutrient content of the AgriFer products is shown in Tab. 3.10.

24/84
Tab. 3.10 Nutrient contents of AgriFer fertiliser products (Bundesgütegemeinschaft Kompost E.V. 2008)
The production process as described above creates two options for closed loop resource management.
Firstly, the electricity produced in the cogeneration unit could be used meet the electricity demand of
the production process. Secondly, the fertiliser AgriFer can be used in the grass cultivation. We inves-
tigate two scenarios; one scenario meeting the fertilizer and electricity requirement in the grass refin-
ery system with electricity and AgriFer produced in the refinery, and one scenario meeting those re-
quirements with purchased products (mineral fertiliser, electricity from grid).
This Chapter is based on an LCA study of the Biowert grass refinery prepared by Leuenberger &
Jungbluth (2010).
AgriFer Unit Liquid Solid
Density g/l 1.039 0.757
Dry matter content % 0.0402 0.28
N content %DM 0.283 0.0391
P2O5 content %DM 0.0118 0.0313
K2O content %DM 0.1582 0.0089
MgO content %DM 0.001 0.0146
N per m3
kg/m3 11.7 8.25
N per kg kg/kg 0.0113 0.0109
P2O5 per m3
kg/m3 0.42 6.59
P2O5 per kg kg/kg 0.0004 0.0087
K2O per m3
kg/m3 6.55 1.82
K2O per kg kg/kg 0.0063 0.0024
Amount AgriFer m3 17
Amount AgriFer kg 3714.29
N input kg 198.9 40.49
P2O5 input kg 7.14 32.31
K2O input kg 111.35 8.91
25/84
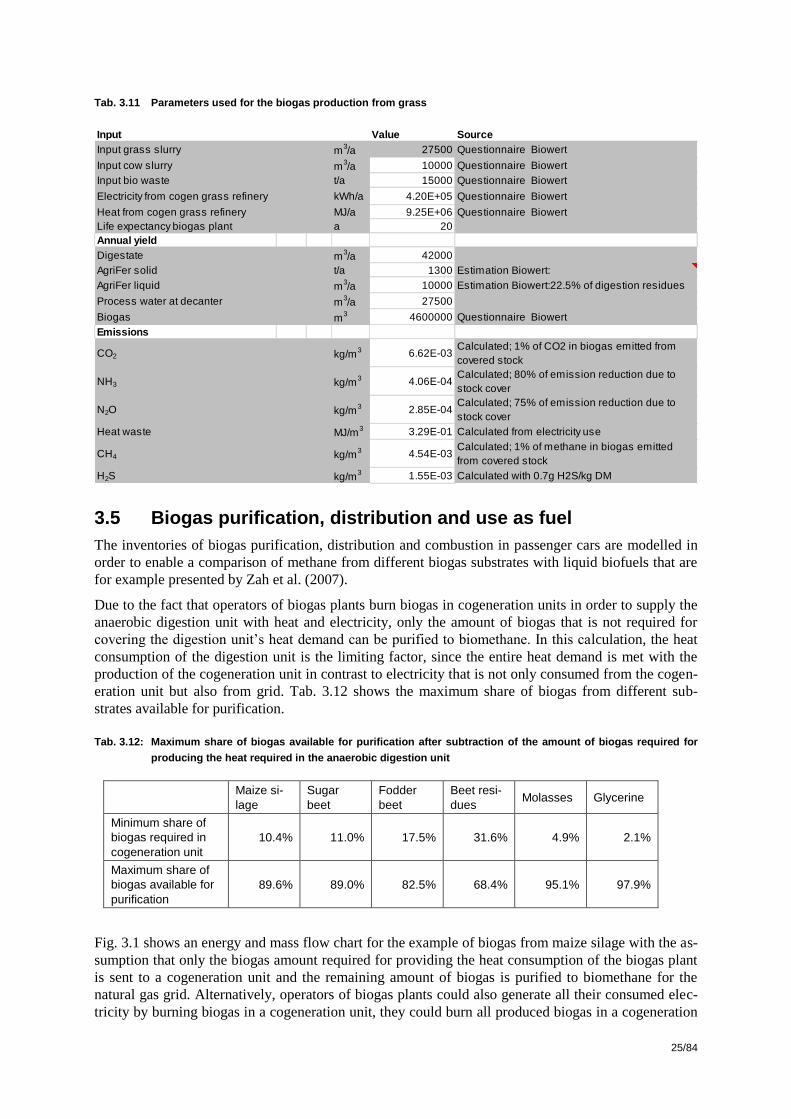
Tab. 3.11 Parameters used for the biogas production from grass
3.5 Biogas purification, distribution and use as fuel
The inventories of biogas purification, distribution and combustion in passenger cars are modelled in
order to enable a comparison of methane from different biogas substrates with liquid biofuels that are
for example presented by Zah et al. (2007).
Due to the fact that operators of biogas plants burn biogas in cogeneration units in order to supply the
anaerobic digestion unit with heat and electricity, only the amount of biogas that is not required for
covering the digestion unit’s heat demand can be purified to biomethane. In this calculation, the heat
consumption of the digestion unit is the limiting factor, since the entire heat demand is met with the
production of the cogeneration unit in contrast to electricity that is not only consumed from the cogen-
eration unit but also from grid. Tab. 3.12 shows the maximum share of biogas from different sub-
strates available for purification.
Tab. 3.12: Maximum share of biogas available for purification after subtraction of the amount of biogas required for
producing the heat required in the anaerobic digestion unit
Maize si-
lage
Sugar
beet
Fodder
beet
Beet resi-
dues Molasses Glycerine
Minimum share of
biogas required in
cogeneration unit
10.4% 11.0% 17.5% 31.6% 4.9% 2.1%
Maximum share of
biogas available for
purification
89.6% 89.0% 82.5% 68.4% 95.1% 97.9%
Fig. 3.1 shows an energy and mass flow chart for the example of biogas from maize silage with the as-
sumption that only the biogas amount required for providing the heat consumption of the biogas plant
is sent to a cogeneration unit and the remaining amount of biogas is purified to biomethane for the
natural gas grid. Alternatively, operators of biogas plants could also generate all their consumed elec-
tricity by burning biogas in a cogeneration unit, they could burn all produced biogas in a cogeneration
Input Value Source
Input grass slurry m3/a 27500 Questionnaire Biowert
Input cow slurry m3/a 10000 Questionnaire Biowert
Input bio waste t/a 15000 Questionnaire Biowert
Electricity from cogen grass refinery kWh/a 4.20E+05 Questionnaire Biowert
Heat from cogen grass refinery MJ/a 9.25E+06 Questionnaire Biowert
Life expectancy biogas plant a 20
Annual yield
Digestate m3/a 42000
AgriFer solid t/a 1300 Estimation Biowert:
AgriFer liquid m3/a 10000 Estimation Biowert:22.5% of digestion residues
Process water at decanter m3/a 27500
Biogas m3 4600000 Questionnaire Biowert
Emissions
CO2 kg/m3 6.62E-03
Calculated; 1% of CO2 in biogas emitted from
covered stock
NH3 kg/m3 4.06E-04
Calculated; 80% of emission reduction due to
stock cover
N2O kg/m3 2.85E-04
Calculated; 75% of emission reduction due to
stock cover
Heat waste MJ/m3 3.29E-01 Calculated from electricity use
CH4 kg/m3 4.54E-03
Calculated; 1% of methane in biogas emitted
from covered stock
H2S kg/m3 1.55E-03 Calculated with 0.7g H2S/kg DM

26/84
unit and send no biogas for purification, or they could send all biogas to a purification plant and meet
their energy demand with electricity from grid and heat from other sources. Depending on the decision
of the biogas usage, different datasets have to be considered for the electricity and heat input in the bi-
ogas plant. Nevertheless, since the consumption of electricity and heat has a relatively small share in
the total environmental impacts of biogas (less than 10 %), this decision is not very important for the
LCA results.
Fig. 3.1 Energy and mass flow chart of the biogas production from maize silage, the purification to biomethane and
the generation of heat and electricity in a biogas co-generation unit
3.5.1 Biogas mix for purification
Most operators of biogas plants in Switzerland burn all produced biogas in a cogeneration unit in order
to produce heat and electricity. In the year 2010, only 13 operators purified their biogas to biomethane
that was fed into the natural gas grid or sold in a pumping station. Based on these operators, we creat-
ed the biogas mix in Tab. 3.13 with information about their substrates and their production capacities
(see Tab. 3.15 on page 29).
Anaerobic digestion plant
Cogeneration unit
Biogas purification
Application on field
1 tons maize silage
156 m3 biogas188 MJ heat
8.0 kWh electricity
5.0 kWh electricity from grid
16 m3 biogas
140 m3 biogas
28.2 kWh electricity
0.82 tons digestates
93 m3 biomethan

27/84
Tab. 3.13: Unit process raw data of the biogas mix for purification in Switzerland
3.5.2 Purification technologies
In Switzerland, biogas is purified with three different technologies: pressure swing adsorption (PSA),
glycol washing, and amino washing. Fig. 1.1 shows the unit process raw data of these technologies ex-
cluding the biogas input.
Amino washing
Up to date information about a purification plant using amino washing and operating in Switzerland
are available from EMPA (2009). The amount of electricity and heat consumed, as well as the amount
of amine (monoethanolamine) and tap water used for the washing, and the amount of activated carbon
(charcoal) and thermal oil (lubricating oil) for desulphurisation is taken from this publication. The
amount of used tap water is treated as sewage in a wastewater treatment plant. The amine is consid-
ered to be disposed in a hazardous waste incineration after use. Several publications report that less
than 0.1 % of the methane content in the raw biogas is emitted into air in the amino washing process
(EMPA 2009; Urban et al. 2009).
Glycol washing
Glycol washing is used in biogas plants in Romanshorn, Bischofszell, and Pratteln (see Fig. 3.2). The
average specific electricity consumption of two operators in Switzerland is 0.81 kWh per Nm3 bio-
methane which is significantly higher than what can be derived from literature sources.
The washing agent used in the glycol washing process is a mixture of dimethyl ether and polyethylene
glycol. The density of the washing agent varies between different formulations, but is around 1 kg/l
(Clariant 2002). In the Biogas plant Pratteln, 110 litre of washing agent were refilled in 2010.4 In rela-
tion to the biomethane production of 626'885 m3 in the same year, this results in a washing agent con-
sumption of 0.18 g/m3. Since no specific information of the detailed composition of washing agent is
available, it is assumed that the two components each have a share of 50 %. It is assumed that the
washing agent is disposed in a hazardous waste incineration after its end of life. According to Urban et
al. (2009), 1 % of the methane content in the raw gas is emitted into air. We apply an emission factor
of 2.6 % of the methane content in the raw gas, calculated from up to date information from a Swiss
operator.5
4 Biopower-Anlage Pratteln, Biogasaufbereitung, Betriebskennzahlen Jahr 2010, personal information from Mike Keller from
the Biopower Nordwestschweiz AG, on 21.02.2011. 5 ARA Region Romanshorn Biogasaufbereitung - Energieflussdiagramm 2010, personal information from Heinz Greuter from
Erdgas Romanshorn, on 31.01.2011.
Name
Lo
ca
tio
n
Infr
astr
uctu
reP
r
Un
it
biogas,
production mix,
at storage,
Update
Un
ce
rta
inty
Typ
e
Sta
nd
ard
De
via
ti
on
95
%
GeneralComment
Location CH
InfrastructureProcess 0
Unit Nm3
product biogas, production mix, at storage, Update CH 0 Nm3 1
shares biogas, from biowaste, at storage CH 0 Nm3 55% 1 1.24(3,1,1,1,1,5,BU:1.05); 7 operators
in Switzerland
biogas, from sewage sludge, at storage CH 0 Nm3 34% 1 1.24(3,1,1,1,1,5,BU:1.05); 5 operators
in Switzerland
biogas, mix, at agricultural co-fermentation, covered CH 0 Nm3 12% 1 1.24(3,1,1,1,1,5,BU:1.05); 1 operator
in Switzerland

28/84
Fig. 3.2 Installation for biogas purification using glycol washing at the biogas plant in Pratteln
(Source: Keller, Biopower Nordwestschweiz AG)
PSA
The most common technology of biogas purification in Switzerland is pressure swing adsorption
(PSA). Urban et al. (2009) report an electricity consumption of the PSA process of 0.22 kWh per m2
raw biogas. Schulte-Schulze (2006) mentions an electricity consumption of 0.25 kWh per m2 raw bio-
gas. We apply a value of 0.23 kWh per m2 raw biogas, which results in 0.35 kWh per m
2 purified bio-
methane. A detailed study published by Baier et al. (2008) analysed the methane emissions of a PSA
plant in Switzerland and revealed that 2.6 % of the methane content in the raw biogas are emitted into
air during the purification process.
3.5.3 General assumptions
Since, the amino washing process and the PSA process also require a desulphurisation step, the same
amount of activated carbon and lubricating oil is taken into account as in the amino washing process.
The generic value of infrastructure facilities is taken from Jungbluth et al. (2007).
The compositions of raw biogas, waste gas and biomethane from PSA is obtained from Jungbluth et
al. (2007). The hydrogen sulphide content in the biomethane from PSA is adjusted to 0.0003 % as de-
clared by Rütgers (general) cited in Jungbluth et al. (2007). And the composition of biomethane from
amino and glycol washing is calculated from composition of biomethane from PSA and the higher me-
thane share as reported by Urban et al. (2009).
The amount of waste heat is calculated from the energy consumption. The carbon dioxide emissions
are calculated from the carbon dioxide input in the raw biogas (1.5 m3 biogas/m
3 biomethane;
33.5 vol% carbon dioxide share) and the carbon dioxide output in the purified biomethane (0.5 vol% -
2 vol%). The methane emissions are calculated by applying the methane emission factors from litera-
ture on the methane input from the raw biogas. Hydrogen sulphide emissions are calculated from the
H2S content in the waste gas reported by in Jungbluth et al. (2007) and 0.5 m3 waste gas per m
3 puri-
fied gas. We assume that the retained sulphur dioxide is oxidised to sulphur dioxide and emitted into
air. The amount of sulphur dioxide is calculated from the difference between the hydrogen sulphide
input from raw biogas and hydrogen sulphide output in the purified biomethane and the waste gas.
29/84
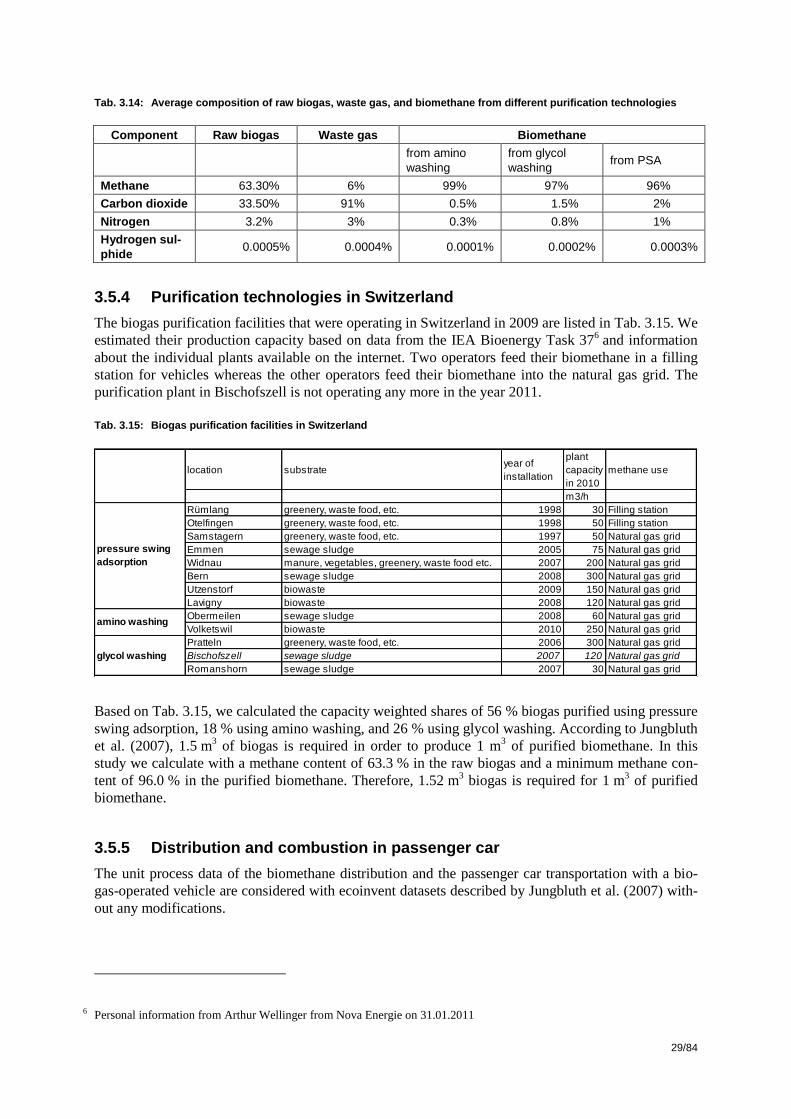
Tab. 3.14: Average composition of raw biogas, waste gas, and biomethane from different purification technologies
Component Raw biogas Waste gas Biomethane
from amino
washing
from glycol
washing from PSA
Methane 63.30% 6% 99% 97% 96%
Carbon dioxide 33.50% 91% 0.5% 1.5% 2%
Nitrogen 3.2% 3% 0.3% 0.8% 1%
Hydrogen sul-
phide 0.0005% 0.0004% 0.0001% 0.0002% 0.0003%
3.5.4 Purification technologies in Switzerland
The biogas purification facilities that were operating in Switzerland in 2009 are listed in Tab. 3.15. We
estimated their production capacity based on data from the IEA Bioenergy Task 376 and information
about the individual plants available on the internet. Two operators feed their biomethane in a filling
station for vehicles whereas the other operators feed their biomethane into the natural gas grid. The
purification plant in Bischofszell is not operating any more in the year 2011.
Tab. 3.15: Biogas purification facilities in Switzerland
Based on Tab. 3.15, we calculated the capacity weighted shares of 56 % biogas purified using pressure
swing adsorption, 18 % using amino washing, and 26 % using glycol washing. According to Jungbluth
et al. (2007), 1.5 m3 of biogas is required in order to produce 1 m
3 of purified biomethane. In this
study we calculate with a methane content of 63.3 % in the raw biogas and a minimum methane con-
tent of 96.0 % in the purified biomethane. Therefore, 1.52 m3 biogas is required for 1 m
3 of purified
biomethane.
3.5.5 Distribution and combustion in passenger car
The unit process data of the biomethane distribution and the passenger car transportation with a bio-
gas-operated vehicle are considered with ecoinvent datasets described by Jungbluth et al. (2007) with-
out any modifications.
6 Personal information from Arthur Wellinger from Nova Energie on 31.01.2011
location substrateyear of
installation
plant
capacity
in 2010
methane use
m3/h
Rümlang greenery, waste food, etc. 1998 30 Filling station
Otelfingen greenery, waste food, etc. 1998 50 Filling station
Samstagern greenery, waste food, etc. 1997 50 Natural gas grid
Emmen sewage sludge 2005 75 Natural gas grid
Widnau manure, vegetables, greenery, waste food etc. 2007 200 Natural gas grid
Bern sewage sludge 2008 300 Natural gas grid
Utzenstorf biowaste 2009 150 Natural gas grid
Lavigny biowaste 2008 120 Natural gas grid
Obermeilen sewage sludge 2008 60 Natural gas grid
Volketswil biowaste 2010 250 Natural gas grid
Pratteln greenery, waste food, etc. 2006 300 Natural gas grid
Bischofszell sewage sludge 2007 120 Natural gas grid
Romanshorn sewage sludge 2007 30 Natural gas grid
pressure swing
adsorption
amino washing
glycol washing

30/84
3.6 Comparison between biogas modelled in this study and in ecoinvent v2.2
The major differences between the biogas modelling in this study and the biogas datasets in ecoinvent
v2.2 are listed in Tab. 3.16. If one compares the new datasets from this study with the biogas datasets
in ecoinvent, these differences should be considered.
Tab. 3.16 Comparison between biogas modelled in this study and in ecoinvent v2.2 (Jungbluth et al. 2007)
This study ecoinvent v2.2
Heat consumption 100% from biogas Sewage: from natural gas
Others: from biogas
Electricity consumption 62% from biogas
38% from grid
Agricultural: 50-60% from biogas,
0-50% from grid
Biowaste/whey: 100% from biogas
Substrates Production of substrates (energy crops)
included
Production of substrates not included be-
cause of cut-off approach for wastes
Digested matter Application on agricultural land not includ-
ed (only included in a scenario)
Application on agricultural land not includ-
ed
Methane emissions 62.9% (with digestate cover) * 1% +
37.1% (without cover) * 5%
With digestate cover: 1%
Without cover: 5%
Ammonia emissions See Section 3.1.7 Different calculation approach
Dinitrogen monoxide
emissions
62.9% (with digestate cover) * 25 mg
N2O/kg substrate
+ 37.1% (without cover) * 100 mg N2O/kg
substrate
Proportional to ammonia emissions
Biogas combustion in
cogeneration unit
166 mg NOx/MJin
102 mg CH4 /MJin
15 mg NOx/MJin
23 mg CH4 /MJin
Biogas purification 56 % pressure swing adsorption technol-
ogy,
26 % glycol washing technology, and
18 % amino washing technology
100% Pressure swing adsorption technol-
ogy

31/84
4 Life cycle impact assessment
Zah et al. (2007) and Jungbluth et al. (2008) compared the environmental impacts of several biofuels
with using fossil fuels in conventional cars. The authors used two single score impact assessment
methods for their evaluation, namely the Eco-indicator 99 (H,A)(Goedkoop & Spriensma 2000) and
the Ecological Scarcity 2006 Method (Frischknecht et al. 2009) as well as the cumulative non-
renewable energy use (Frischknecht et al. 2007) and the global warming potential (IPCC 2007). In or-
der to make the results of this study comparable with those from Zah et al. (2007) and Jungbluth et al.
(2008), the same life cycle impact assessment methods are applied.
The Swiss regulation on LCA of fuels describes the requirements for biofuels in order to get a tax re-
duction. The life cycle greenhouse gas emissions and the total environmental impacts of the use of
such biofuels, shall be lower than 60 % and 125 % of that of the use of conventional fuels respectively
(TrÖbiV 2009). We evaluate to what extend the use of energy crops in co-digestion influences the
compliance with this regulation.
The transportation with biogas modelled in this study is compared to transportation datasets using bio-
gas and conventional fuels from the ecoinvent v2.2 database (ecoinvent Centre 2010) combined with
the updated inventories of biogas purification. When comparing the new datasets from this study with
the biogas datasets in ecoinvent, the modelling differences in Tab. 3.16 on page 30 should be consid-
ered. In order to seek consistency, the purification of biogas is considered with the new datasets from
this study for all types of biogas (ecoinvent v2.2 datasets and new biogas datasets).
For the biogas from the grass refinery, two scenarios are shown. The first scenario represents the mod-
el where mineral fertiliser is used for the grass cultivation and electricity from grid is purchased for the
operation of the grass refinery. The second scenario, marked in the figures with a star (*), represents
the model where the produced AgriFer fertilizer is used for the grass cultivation and the electricity
generated from biogas is used for the operation of the grass refinery.
4.1 Car transportation using biogas
4.1.1 Cumulative energy demand
Fig. 4.1 shows the renewable and non-renewable energy consumption of passenger transportation with
an average load of 1.6 passengers, fuelled with biogas and conventional fossil fuels. The transport ser-
vice with one of the new inventoried biogas substrates results in a cumulative non-renewable energy
demand per passenger kilometre between 1.5 MJ-eq. (grass in grass refinery) and 2.1 MJ-eq. (rape oil
glycerine), the one of the compared biogas substrates from ecoinvent v2.2 amounts to between 1.4 MJ-
eq. (fat and oil) and 1.9 MJ-eq. (sewage sludge) compared to the transportation with conventional
fuels which requires an amount of between 3.0 MJ-eq. (diesel) and 3.3 MJ-eq. (petrol) of non-
renewable energy per passenger kilometre.
Compared to conventional fuels, fuelling a vehicle with biogas requires more nuclear energy in all
cases due to the electricity consumption in the biogas production process and the biogas purification
process. About 0.3 MJ-eq./pkm is required for the operation and maintenance of the road infrastruc-
ture independent from the type of fuel used. The total consumption of non-renewable energy is con-
siderably higher when using conventional fuels, since these fuels are based on fossil resources. Com-
pared to driving a car with petrol, using biogas can reduce the consumption of non-renewable energy
resources between 37% (rape oil glycerine) and 59 % (fat and oil).
If the total energy demand including renewable energy is considered, using biogas from energy crops
leads to higher results than using conventional fuels, because of the solar energy uptake during the
growth of the biomass substrate.

32/84
Fig. 4.1 Renewable and non-renewable cumulative energy demand (Frischknecht et al. 2007) of the transport ser-
vice (MJ-eq/pkm) with an average load of 1.6 passengers
4.1.2 Greenhouse gases
In Fig. 4.2, the carbon footprint of passenger transport with biogas from different substrates and with
conventional fuels is displayed. The carbon footprint of the transport service with biogas from the new
established inventories amounts to between 95 gCO2-eq./pkm (biogas from grass refinery) and
163 gCO2-eq./pkm (beet residues). Biogas from substrates with the highest carbon footprint is compa-
rable with natural gas fuels whereas those biogas types with the lowest carbon footprint enable a re-
duction of 54 % of greenhouse gas emissions compared to transportation with a petrol fuelled passen-
ger car. Most biogas types analysed in this study do not comply with the thresholds for a tax reduction.
The carbon footprint of transportation with conventional fuels is strongly dominated by the carbon di-
oxide emissions during the car operation, whereas biogenic methane emissions during the biogas pro-
duction and purification as well as the dinitrogen monoxide emissions during the substrate cultivation
have major shares in the carbon footprint of a transport service with biogas fuels. However, it needs to
be considered that methane leakage rates can differ significantly between individual biogas plants.
Using biogas from beet residues has the highest emissions within the different biogas types, which is
because of the low methane yield of this substrate, which results in a larger volume of beet residues
that is required to produce one m3 of biogas. The production of this amount of substrate, but also its
transportation and the electricity and heat consumption for its handling in the biogas plant, results in
higher greenhouse gas emissions compared to biogas from other substrates.
0.0
0.5
1.0
1.5
2.0
2.5
3.0
3.5
4.0
4.5
5.0
mai
ze s
ilage
suga
r b
eet
fod
der
be
et
bee
t re
sid
ue
s
mo
lass
es
rap
e o
il gl
yce
rin
e
gras
s re
fin
ery
(gra
ss &
co
w s
lurr
y)
gras
s re
fin
ery*
(gr
ass
& c
ow
slu
rry)
was
te o
il gl
ycer
ine
Swis
s m
ix o
f p
uri
fie
d b
ioga
s (t
his
stu
dy)
bio
was
te
fat
and
oil
sew
age
slu
dge
slu
rry
wh
ey
die
sel
nat
ura
l gas
pet
rol
new inventories biogas co-substrates ecoinvent v2.2 biogas ecoinvent v2.2conventional
MJ/pkmfossil nuclear renewable

33/84
Fig. 4.2 Global warming potential over a time horizon of 100 years (IPCC 2007) of transport services (g CO2-eq per
pkm) with an average load of 1.6 passengers
4.1.3 Ecological Scarcity 2006
The environmental impacts assessed with the Ecological Scarcity Method (2006) are presented in Fig.
4.3 und Fig. 4.4. The results show a similar result as the assessment with Eco-indicator 99 shown in
Fig. 4.6.
The highest environmental impacts stem from biogas produced from whey, rape oil glycerine, and
fodder beets. If those substrates are used in biogas plants, the total life cycle environmental impacts of
the produced biogas are increased and a tax reduction might not be achieved.
All other substrates considered would comply with threshold for a tax reduction of biofuels in Switzer-
land. The use of molasses or energy crops such as sugar beets, beet residues, and maize silage can
achieve the requirement for a tax reduction depending on the individual circumstances of the agricul-
tural cultivation and the biogas plant. Using biogas from maize silage and molasses has about the same
amount of environmental impacts as using conventional petrol.
Car driving with biogas from a grass refinery or from waste products such as vegetable waste oil
(glycerine), biowaste, fat and oil, sewage sludge, and slurry can easily achieve the total environmental
impact requirements for a tax reduction. Driving with the current Swiss mix of purified biomethane
has lower environmental impacts than driving with a petrol fuelled car, since the current biomethane
mix uses only waste substrates (biowaste, sewage sludge, and slurry) for the production of biogas.
Nevertheless, the total environmental impacts of using biogas from these substrates are comparable to
the total environmental impacts of using conventional diesel or natural gas. Consequently, the poten-
tial of reducing environmental impacts by driving with biogas is about the same as the one by driving
with diesel or natural gas.
In the case of driving a car with biogas from maize silage, sugar beet, or molasses, the assessment re-
sults in an environmental credit due to the plant uptake of heavy metals during the agricultural cultiva-
tion of the substrates. However, the reader should keep in mind that producing biogas from agricultur-
al substrates does usually not remove heavy metals from nature. The environmental impacts from re-
turning the heavy metals to soil when applying digestates on agricultural land can just be allocated to
0
20
40
60
80
100
120
140
160
180
200m
aize
sila
ge
suga
r b
eet
fod
der
be
et
bee
t re
sid
ue
s
mo
lass
es
rap
e o
il gl
yce
rin
e
gras
s re
fin
ery
(gra
ss &
co
w s
lurr
y)
gras
s re
fin
ery*
(gr
ass
& c
ow
slu
rry)
was
te o
il gl
ycer
ine
Swis
s m
ix o
f p
uri
fie
d b
ioga
s (t
his
stu
dy)
bio
was
te
fat
and
oil
sew
age
slu
dge
slu
rry
wh
ey
die
sel
nat
ura
l gas
pet
rol
new inventories biogas co-substrates ecoinvent v2.2 biogas ecoinvent v2.2conventional
gCO2-eq./pkmCar infrastructure Road infrastructure Car operation Biogas purification Biogas production Fossil fuel production
threshold for tax reduction of biofuels
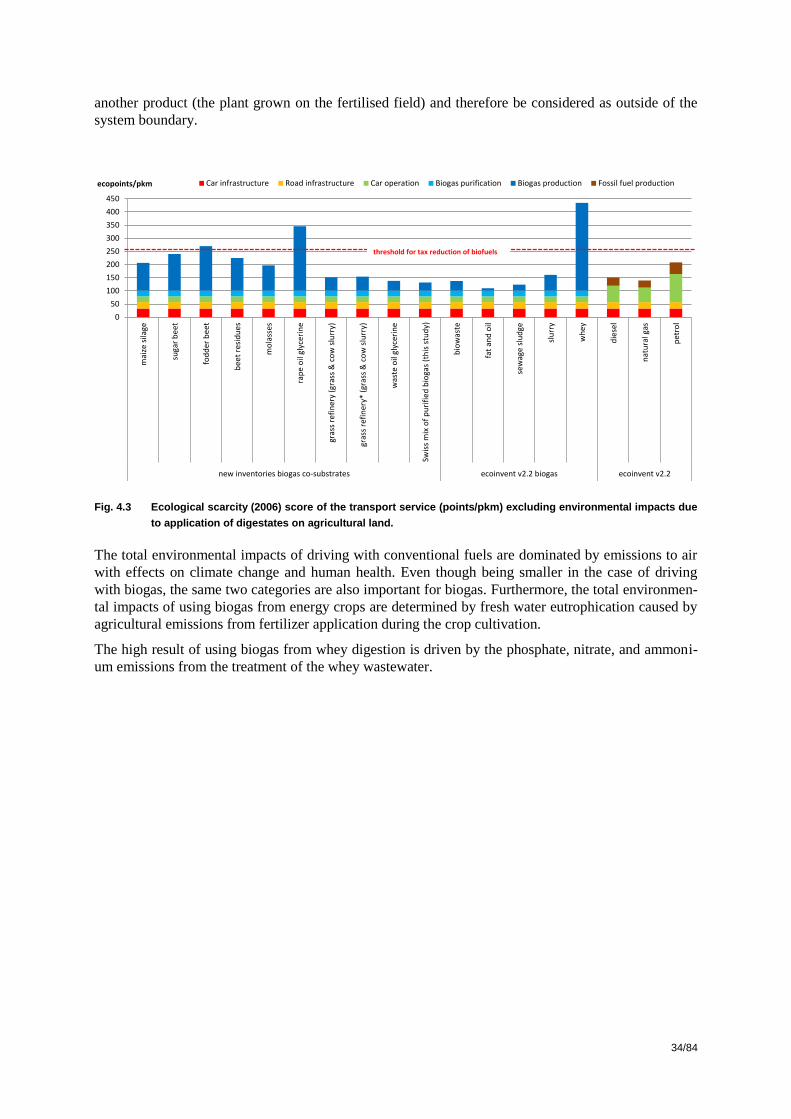
34/84
another product (the plant grown on the fertilised field) and therefore be considered as outside of the
system boundary.
Fig. 4.3 Ecological scarcity (2006) score of the transport service (points/pkm) excluding environmental impacts due
to application of digestates on agricultural land.
The total environmental impacts of driving with conventional fuels are dominated by emissions to air
with effects on climate change and human health. Even though being smaller in the case of driving
with biogas, the same two categories are also important for biogas. Furthermore, the total environmen-
tal impacts of using biogas from energy crops are determined by fresh water eutrophication caused by
agricultural emissions from fertilizer application during the crop cultivation.
The high result of using biogas from whey digestion is driven by the phosphate, nitrate, and ammoni-
um emissions from the treatment of the whey wastewater.
0
50
100
150
200
250
300
350
400
450
mai
ze s
ilage
suga
r b
eet
fod
der
be
et
bee
t re
sid
ue
s
mo
lass
es
rap
e o
il gl
yce
rin
e
gras
s re
fin
ery
(gra
ss &
co
w s
lurr
y)
gras
s re
fin
ery*
(gr
ass
& c
ow
slu
rry)
was
te o
il gl
ycer
ine
Swis
s m
ix o
f p
uri
fie
d b
ioga
s (t
his
stu
dy)
bio
was
te
fat
and
oil
sew
age
slu
dge
slu
rry
wh
ey
die
sel
nat
ura
l gas
pet
rol
new inventories biogas co-substrates ecoinvent v2.2 biogas ecoinvent v2.2conventional
ecopoints/pkm Car infrastructure Road infrastructure Car operation Biogas purification Biogas production Fossil fuel production
threshold for tax reduction of biofuels

35/84
Fig. 4.4 Contribution of different environmental impacts to the Ecological scarcity (2006) score of transport service
with different fuels scaled to 100 %. The contribution of toxic hydrocarbons, ozone depletion, and water re-
courses is too small to be obvious from this figure.
In a scenario we calculated the total environmental impacts if the application of the digested matter on
agricultural land is allocated to the biogas production instead of the crop cultivation. Fig. 4.5 shows
the environmental impacts assessed with the ecological scarcity method (2006) when including the
environmental impacts from the digestate application. When allocating the digestates and their use in
agriculture to the biogas production, the overall environmental impacts from transport services using
biogas substrates are significantly increased (up to 45 % in case of fodder beets and beet residues).
With this approach, beside biogas from rape oil glycerine, also biogas from sugar beets, fodder beets,
and beet residues does not comply with the requirements for a tax reduction. The total environmental
impacts of biogas from maize silage and molasses are close to the threshold for a tax reduction.
It has to be considered that if digested matter from biogas plants is used as fertilizer in the cultivation
of energy crops (e.g. used as substrates for biogas production) the use of conventional fertilizers can
be reduced.
As the two scenarios show quite different results it will be very important to consider the most appro-
priate modelling of fertilizer application for a final judgment. It has to be known if the energy crops
used in the biogas plants are fertilized by the digestate from the plant and how much of conventional
fertilizers can be saved by applying the digestates. So far the data in this study did not take into ac-
count such an integrated production.
0%
10%
20%
30%
40%
50%
60%
70%
80%
90%
100%
mai
ze s
ilage
suga
r b
eet
fod
der
bee
t
bee
t re
sid
ues
mo
lass
es
rap
e o
il gl
ycer
ine
gras
s re
fin
ery
(gra
ss &
co
w s
lurr
y)
gras
s re
fin
ery*
(gr
ass
& c
ow
slu
rry)
was
te o
il gl
ycer
ine
Swis
s m
ix o
f p
uri
fied
bio
gas
(th
is s
tud
y)
bio
was
te
fat
and
oil
sew
age
slu
dge
slu
rry
wh
ey
die
sel
nat
ura
l gas
pet
rol
new inventories biogas co-substrates ecoinvent v2.2 biogas ecoinvent v2.2conventional
Toxic hydrocarbons
Ozone depletion
Water recourses
Radioactive waste
Mineral resources
Land resources
Energy resources
Pesticides
Heavy metals to soil
Radioactive
Heavy metals to water
Eutrophication
Heavy metals to air
Human health
Acidification
NMVOC
Climate change

36/84
Fig. 4.5 Ecological scarcity (2006) score of the transport service (points/pkm) with an average load of
1.6 passengers. This scenario includes environmental impacts due to application of digestates on agricul-
tural land (see grey bar).
4.1.4 Eco-indicator 99
Fig. 4.6 presents the overall environmental impacts of passenger transport assessed with the Eco-
indicator 99 (H,A) method. In contrast to driving with biogas described by existing ecoinvent v2.2 da-
tasets which all have a considerably lower environmental impact compared to driving with conven-
tional fuels, driving with biogas from substrates evaluated in this study has considerably higher envi-
ronmental impacts than conventional fuels. The reason for this difference is the fact that the analysed
biogas inventories from ecoinvent are based on waste products whereas most of the substrates in the
new established biogas inventories have an economic value and are not waste products. In contrast to
waste substrates, non-waste substrates bear environmental burdens from their production which cover
e.g. agricultural plant cultivation. The cultivation of silage maize, sugar beet, fodder beet, and rape
seeds requires agricultural land and the use of agricultural appliances which has a strong influence on
the environmental impacts of the transport service. If such energy crops are used in cogeneration, the
environmental impacts are higher compared to using only waste products, and depending on the share
of substrates from energy crops, the biogas might not comply with the requirement for a tax reduction.
The reason for the low environmental impacts of using biogas from waste oil glycerine is the fact that
the basis for the glycerine is a waste product which does not bear any environmental burdens. The low
environmental impacts of biogas from grass in a grass refinery can be explained with the fact that the
environmental impacts from the grass cultivation and processing are allocated to the different products
of the biogas refinery. In consequence, biogas from grass bears only a small share of the overall envi-
ronmental impacts from the grass refinery.
0
50
100
150
200
250
300
350
400
450
mai
ze s
ilage
suga
r b
eet
fod
der
bee
t
bee
t re
sid
ues
mo
lass
es
rap
e o
il gl
ycer
ine
gras
s re
fin
ery
(gra
ss &
co
w s
lurr
y)
gras
s re
fin
ery*
(gr
ass
& c
ow
slu
rry)
was
te o
il gl
ycer
ine
Swis
s m
ix o
f p
uri
fied
bio
gas
(th
is s
tud
y)
bio
was
te
fat
and
oil
sew
age
slu
dge
slu
rry
wh
ey
die
sel
nat
ura
l gas
pet
rol
new inventories biogas co-substrates ecoinvent v2.2 biogas ecoinvent v2.2conventional
ecopoints/pkmCar infrastructure Road infrastructure Car operation Biogas purification
Biogas production Fossil fuel production Digestate application
threshold for tax reduction of biofuels

37/84
Fig. 4.6 Eco-indicator 99 (H,A) score of the transport service with an average load of 1.6 passengers
4.1.5 Yield and impacts per hectare
In addition to the environmental impacts per passenger kilometre, we also present two dimensional di-
agrams showing the kilometric performance and the greenhouse gas emissions and total environmental
impact, respectively, per hectare of energy crop, cultivated. In these charts only the results of biogas
from energy crops are displayed, since a presentation of agricultural land use and non-agricultural bio-
gas substrates would not meaningful.
In Fig. 4.7, passenger car transportation using biogas produced from energy crops that are analysed in
this study, is compared to passenger car transportation using plant methyl ester, ethanol or biomass-to-
liquid fuels that were analysed by Jungbluth et al. (2008) and Zah et al. (2007). It is shown that the
greenhouse gas emissions and the kilometric performance of car transportation using biogas are in the
same order of magnitude as compared to using liquid biofuels. However, the kilometric performance
using biogas is higher as compared to using liquid biofuels with exception of palm oil methyl ester and
ethanol from sugar beets and also the greenhouse gas emissions of using biogas from one hectare is
higher compared to using liquid biofuels from most energy crops cultivated on the same area. Overall,
the higher kilometric performance does not outweigh the higher greenhouse gas emissions and there-
fore from a climate point of view, using energy crops for biogas cultivation is less favourable than us-
ing energy crops for the production of liquid biofuels. The reason for the higher greenhouse gas emis-
sions of biogas fuels is mainly the leakage of methane in the biogas plant and during the purification
of biogas.
A comparison of the biogas and bioethanol conversion route can be made, based on datasets of sugar
beet usage in both routes (see the two red data points connected with a dashed line in Fig. 4.7). Driv-
ing with biogas from sugar beets requires 0.96 kg beets per km whereas driving with bioethanol from
sugar beets requires 0.73 kg beets per km. It can be concluded from these results that in case of sugar
beets the bioethanol conversion route is a more efficient way of producing biofuels than producing bi-
ogas from the same crop. Bioethanol not only has a higher kilometric performance per hectare, but al-
so lower greenhouse gas emissions. Nevertheless, from this single example it cannot be generalized to
other substrates and biofuel types.
The lower kilometric performance of the analysed biomass-to-liquid (BTL) fuels and of soy bean me-
thyl ester is not because of an inefficient conversion route, but because of a low yield of soy bean,
wood, and miscanthus per cultivated hectare.
0.0E+00
5.0E-03
1.0E-02
1.5E-02
2.0E-02
2.5E-02
3.0E-02
mai
ze s
ilage
suga
r b
eet
fod
der
be
et
bee
t re
sid
ue
s
mo
lass
es
rap
e o
il gl
yce
rin
e
gras
s re
fin
ery
(gra
ss &
co
w s
lurr
y)
gras
s re
fin
ery*
(gr
ass
& c
ow
slu
rry)
was
te o
il gl
ycer
ine
Swis
s m
ix o
f p
uri
fie
d b
ioga
s (t
his
stu
dy)
bio
was
te
fat
and
oil
sew
age
slu
dge
slu
rry
wh
ey
die
sel
nat
ura
l gas
pet
rol
new inventories biogas co-substrates ecoinvent v2.2 biogas ecoinvent v2.2conventional
EIP 99/pkm Fossil fuels Minerals Land use Acidification/ Eutrophication
Ecotoxicity Ozone layer Radiation Climate change
Resp. inorganics Resp. organics Carcinogens
threshold for tax reduction of biofuels

38/84
The datasets of methyl ester from different crops consider an economic allocation with 2001 prices of
methyl ester and glycerine. Since prices of glycerine have decreased significantly within the last few
years, updating this allocation will result in a slightly lower yield and higher environmental impacts.
Fig. 4.7 Two dimensional presentation of kilometric performance per hectare and greenhouse gas emissions per
hectare of different energy crops and biofuel conversion. Filled squares represent liquid biofuels and hol-
low squares represent biogas fuels.
-
2
4
6
8
10
12
14
16
18
0 10 20 30 40 50 60 70 80 90 100 110
t CO2-eq./ha
1'000 km/ha
rape methyl ester
ethanol from sugar beets
ethanol from corn (from USA)
miscanthus BTL
wood BTL-CUTEC
wood BTL-TUV
wood BTL-UET
soy methyl ester (from Brazil)
soy methyl ester (from USA)
palm oil methyl ester
biogas from sugar beets
biogas from fodder beet
biogas from grass (ecoinvent DS)
biogas from maize silage
biogas from rape glycerine

39/84
As well as in Fig. 4.7, also in the two dimensional diagram in Fig. 4.8, where kilometric performance
and total environmental impacts assessed with the method of Ecological Scarcity (2006) per hectare
are displayed, it is shown that the results for using biogas in cars is in the same order of magnitude as
compared to using liquid biofuels.
The example of using sugar beets shows that bioethanol is the more efficient conversion route than
driving with biogas produced from the same crop (see the two red data points connected with a dashed
line in Fig. 4.8). Both alternatives have about the same amount of total environmental impacts per hec-
tare of cultivated sugar beet, but ethanol from sugar beets has a significantly higher kilometric perfor-
mance compared to biogas from sugar beets. If looking at all examples, the liquid biofuels tend to
have a lower kilometric performance, because of the crops with low yields such as wood, soy bean,
and miscanthus
In contrast to the greenhouse gas emissions, the higher total environmental impacts of using biogas
can be outweighed by the higher kilometric performance. Finally, this leads to similar amounts of total
environmental impacts per passenger or vehicle kilometre when using biogas and liquid biofuels re-
spectively.
Fig. 4.8 Two dimensional presentation of kilometric performance per hectare and total environmental impacts as-
sessed with the method of Ecological scarcity (2006) per hectare of different energy crops and biofuel con-
version. Filled squares represent liquid biofuels and hollow squares represent biogas fuels.
4.2 Grass refinery products
The impact assessment of the various products from the grass refinery that are different than biogas is
presented in a separate report published by Leuenberger & Jungbluth (2010). The key findings are:
-
5
10
15
20
25
30
35
40
45
50
0 10 20 30 40 50 60 70 80 90 100 110
Mio ecopoints/ha
1'000 km/ha
rape methyl ester
ethanol from sugar beets
ethanol from corn (from USA)
miscanthus BTL
wood BTL-CUTEC
wood BTL-TUV
wood BTL-UET
soy methyl ester (from Brazil)
soy methyl ester (from USA)
palm oil methyl ester
biogas from sugar beets
biogas from fodder beet
biogas from grass (ecoinvent DS)
biogas from maize silage
biogas from rape glycerine

40/84
The total environmental impacts of all grass refinery products are lower compared to a total of
comparable products with the same functional unit with regard to all applied impact assess-
ment methods.
On products level, the results differ depending on the selected impact assessment methods.
Whereas AgriCell has higher environmental impacts compared to conventional insulation ma-
terials, AgriPlast has lower environmental impacts compared to similar products using high
density polyethylene with regard to most indicators.
Extensive grass cultivation leads to significantly lower environmental impacts compared to in-
tensive grass cultivation.
Since the grass cultivation has a high impact on the total environmental impacts of the refin-
ery, the chosen allocation between the different products is important. Depending on the se-
lected allocation factors, the environmental impacts of the individual products can be varied.
Using electricity from burning biogas has lower environmental impacts compared to operating
the grass refinery with electricity from the German grid.
4.3 Electricity from Cogeneration
At present, more common than purifying biogas for the use as fuel in transportation, is the burning of
biogas in a cogeneration unit in order to produce electricity and heat. Fig. 4.9 shows the total environ-
mental impacts assessed with the Ecological Scarcity Method (2006). Electricity produced from
wastes such as biowaste, sewage sludge, or slurry, can reduce the environmental impacts compared to
the average Swiss electricity mix significantly, because they avoid the generation of radioactive wastes
from Swiss nuclear power plants.
On the other hand, electricity from biogas produced from energy crops has considerably higher total
environmental impacts compared to the average electricity from grid. Hence, from an environmental
point of view, it is not reasonable, if operators of biogas plants purchase energy crops in order to en-
hance their biogas production. This supports the criteria of the naturemade star label which defines
that only the share of electricity that is produced from biogenic wastes can be certified as green elec-
tricity and electricity from other biogas substrates is not entitled for certification (naturemade 2011).

41/84
Fig. 4.9 Ecological Scarcity (2006) scores of electricity generated from biogas in cogeneration units and of average
electricity from the Swiss grid. The contribution of toxic hydrocarbons, ozone depletion, water and mineral
recourses, NMVOC, and heavy metals to air is too small to be obvious from this figure.
-250
0
250
500
750
1000
1250
maizesilage
sugarbeet
fodderbeet
beetresidues
grass molasses rape oilglycerine
waste oilglycerine
biowaste&
sewagesludge
slurry CH gridmix
new inventories ecoinvent v2.2
ecopoints/kWh electricity Water recourses
Toxic hydrocarbons
Ozone depletion
Mineral resources
NMVOC
Heavy metals to air
Radioactive waste
Land resources
Energy resources
Pesticides
Radioactive
Eutrophication
Human health
Acidification
Climate change
Heavy metal to soiland water

42/84
5 Conclusion
As shown in this study, using biogas from non-waste substrates as vehicle fuels instead of using con-
ventional fuels has some benefits regarding the consumption of non-renewable energy resources and
regarding carbon footprint. However, these benefits are lower than when using biogas from waste sub-
strates.
The overall environmental impacts of transport services with biogas from non-waste substrates is con-
siderably higher compared to those of transport services with biogas from waste substrates. In most
cases it also exceeds the total environmental impacts of driving with conventional fuels. In particular
important are the use of agricultural land, and emissions during the cultivation of plants used as biogas
substrates or as feedstock for biogas substrates.
There is a large range of environmental impacts depending on which specific substrate is used in an
agricultural biogas plant. Since several biogas substrates bear high environmental impacts, we suggest
analysing these impacts in depth before making decisions that have an impact on the type and amount
of biogas substrate produced.
The allocation of emissions from applying digestates influences the final performance of biogas pro-
duced from energy crops. In this study we assume in the standard case that these emissions are allocat-
ed to the crop produced with the digestates used as a fertilizer. If digestates are more seen as a waste
and thus emissions are allocated to the biogas plant, this raises the environmental impacts considera-
bly. A possibility not investigated in this study is the situation where energy crops used in the biogas
plant are fertilized with digestates from the same biogas plant.
Out of the biogas substrates considered in this study, only the combination of cow and grass slurry in a
grass refinery as well as glycerine made from waste oil comply with the Swiss requirements for a tax
reduction on biofuels, which are a threshold of 60 % of the greenhouse gas emissions and a threshold
of 125 % of the total environmental impacts, respectively, of transportation with conventional fuels. In
particular the threshold for greenhouse gas emissions is not achieved by other types of substrates. Due
to the additional environmental impacts from the crop cultivation, none of the biogas substrates from
energy crops meets this requirement, if digested as a single substrate. The current trend towards using
high energy substrates made from agricultural crops leads to more environmental impacts and a worse
environmental performance of biogas.
At present, biogas in Switzerland is mainly produced from sewage sludge, slurry, and biowaste. If the
co-digestion with higher shares of substrates made from energy crops increases significantly in future,
the produced biogas cannot comply with the thresholds for a fuel tax reduction.
Electricity produced from biogas made from non-waste energy crops has significantly higher total en-
vironmental impacts than the average electricity form grid in Switzerland. Therefore, such electricity
cannot be considered as green, in contrast to electricity made from biogas produced from waste sub-
strates, which has significantly lower environmental impacts.
This study confirms in general the knowledge gained for other types of biofuels. There is not a single
judgement for one type of fuel, since the environmental impacts are quite dependent on the biomass
resource used as a starting point and the conversion efficiency in the process. A comparison for sugar
beets used as an input for biogas or ethanol production also shows that in certain cases other conver-
sion routes than biogas are more efficient from an environmental point of view.

43/84
6 Outlook
The life cycle inventories that are established in this project in EcoSpold format v1 are available from
the public webpage www.lc-inventories.ch. They can be downloaded and imported into LCA software
such as SimaPro.
In addition to the life cycle inventories presented in this report, new life cycle inventories of the biogas
production from further substrates recommended by Leuenberger & Jungbluth (2009) could be con-
sidered in a next step. These are waste cooking oils, potato starch and potato starch residues, as well as
rape meal and oil residues.
Also it would be interesting to analyse the environmental effects, if the energy crops for biogas pro-
duction are cultivated using biogas digestates as fertilizer.
Within this project, the economic allocation of the esterification of rape oil and vegetable oil from
waste cooking oil are updated. However, there are more datasets in ecoinvent using the same alloca-
tion factors, which should be updated as well.

44/84
7 References Amon et al. 2007a Amon T., Amon B., Kryvoruchko V., Zollitsch W., Mayer K. and Gruber L.
(2007a) Biogas production from maize and dairy cattle manure - Influence of bi-
omass composition on the methane yield. In: Agriculture, Ecosystems and Envi-
ronment, 118, pp. 173-182.
Baier et al. 2008 Baier U., Baum S., Judex J. and Biollaz S. (2008) Methanverluste bei der Bio-
gasaufbereitung. ZHAW, Wädenswil.
Bayer. Landesamt für Umwelt (Hrsg.) 2006 Bayer. Landesamt für Umwelt (Hrsg.) (2006) Emissions- und Leis-
tungsverhalten von Biogas-Verbrennungsmotoren in Abhängigkeit von der Mo-
torenwartung, Augsburg, DE.
Börjesson & Berglund 2005 Börjesson P. and Berglund M. (2005) Environmental system analysis of biogas
systems - Part I: Fuel-cycle emissions. In: Biomass and Bioenergy, 30, pp. 469-
485.
Clariant 2002 Clariant (2002) Scrubbing Waste Air and Waste Gas Streams. Clariant GmbH,
Division Functional Chemicals, Functional Fluids/Marketing, Frankfurt am
Main, Germany.
Dauriat et al. 2011 Dauriat A., Gaillard G., Alig M., Scharfy D., Membrez Y., Bachmann N., Stei-
ner R., Charles R., Maltas A. and Sinaj S. (2011) Analyse de cycle de vie de la
production centralisée et décentralisée de biogaz en exploitations agricoles.
ENERS Energy Concept, Lausanne.
ecoinvent Centre 2010 ecoinvent Centre (2010) ecoinvent data v2.2, ecoinvent reports No. 1-25. Swiss
Centre for Life Cycle Inventories, Duebendorf, Switzerland, retrieved from:
www.ecoinvent.org.
Edelmann et al. 2001 Edelmann W., Schleiss K., Engeli H. and Baier U. (2001) Ökobilanz der
Stromgewinnung aus landwirtschaftlichem Biogas - Schlussbericht November
2001. 210146. Arbi Bioenergie GmbH, Baar, retrieved from:
www.energieforschung.ch.
Edelmann 2006 Edelmann W. (2006) Kennwertmodell Biogas mit Cosubstrat. Arbi Bioenergie
GmbH, Baar.
EMPA 2009 EMPA (2009) Ökobilanz Biomethan-Aufbereitungsanlage Meilen. EMPA,
Technology and Society Lab, Life Cycle Assessment & Modelling Group, on
behalf of Erdgas Zürich, St. Gallen.
Erb et al. 2008 Erb D., Büeler E. and Spicher M. (2008) Monovergärung von Glycering -
Vergärung von einem Substrat in dominierender Menge. Bundesamt für Energie,
Bern.
Freiermuth-Knuchel 2006 Freiermuth-Knuchel R. (2006) Modell zur Berechnung der Schwermetallflüsse
in der Landwirtschaftlichen Ökobilanz. FAL, Zürich-Reckenholz.
Frischknecht et al. 2007 Frischknecht R., Jungbluth N., Althaus H.-J., Bauer C., Doka G., Dones R.,
Hellweg S., Hischier R., Humbert S., Margni M. and Nemecek T. (2007) Imple-
mentation of Life Cycle Impact Assessment Methods. ecoinvent report No. 3,
v2.0. Swiss Centre for Life Cycle Inventories, Dübendorf, CH, retrieved from:
www.ecoinvent.org.
Frischknecht et al. 2009 Frischknecht R., Steiner R. and Jungbluth N. (2009) The Ecological Scarcity
Method - Eco-Factors 2006: A method for impact assessment in LCA. Federal
Office for the Environment FOEN, Zürich und Bern, retrieved from:
www.bafu.admin.ch/publikationen/publikation/01031/index.html?lang=en.
Goedkoop & Spriensma 2000 Goedkoop M. and Spriensma R. (2000) The Eco-indicator 99: A damage orient-
ed method for life cycle impact assessment. PRé Consultants, Amersfoort, The
Netherlands, retrieved from: www.pre.nl/eco-indicator99/.
45/84
Inspektorat der Kompostier- und Vergärbranche der Schweiz 2006 Inspektorat der Kompostier- und Vergär-
branche der Schweiz (2006) Positivliste der Ausgangsmaterialien und Zuschlag-
stoffe zur Herstellung von Komposten und Gärgut. VKS Verband Kompostier-
und Vergärwerke Schweiz, Bern.
Institut für Energetik und Umwelt gGmbH 2006 Institut für Energetik und Umwelt gGmbH (2006) Handrei-
chung Biogasgewinnung und -nutzung. Bundesforschungsanstalt für Land-
wirtschaft,
Kuratorium für Technik und Bauwesen in der Landwirtschaft, Gülzow, retrieved from: www.fnr.de.
IPCC 2007 IPCC (2007) The IPCC fourth Assessment Report. Cambridge University Press.,
Cambridge.
Jungbluth et al. 2007 Jungbluth N., Chudacoff M., Dauriat A., Dinkel F., Doka G., Faist Emmenegger
M., Gnansounou E., Kljun N., Schleiss K., Spielmann M., Stettler C. and Sutter
J. (2007) Life Cycle Inventories of Bioenergy. ecoinvent report No. 17, v2.0.
ESU-services, Uster, CH, retrieved from: www.ecoinvent.org.
Jungbluth et al. 2008 Jungbluth N., Büsser S., Frischknecht R. and Tuchschmid M. (2008) Ökobilanz
von Energieprodukten: Life Cycle Assessment of biomass-to-liquid fuels.
280006. ESU-services Ltd. im Auftrag des Bundesamt für Energie, Bundesamt
für Umwelt und Bundesamt für Landwirtschaft, Berne, CH, retrieved from:
www.esu-services.ch/projects/biofuel/btl/.
Jungbluth et al. 2010 Jungbluth N., Frischknecht R., Orthlieb A., Büsser S. and Leuenberger M.
(2010) Aktualisierung und Ergänzung der naturemade Kennwertmodelle:
Ökobilanzen für die Prüfung des globalen Kriteriums von Energieprodukten
(Zwischenbericht Juli 2010). ESU-services im Auftrag vom Verein für um-
weltgerechte Energie (VUE), Uster, retrieved from: www.esu-
services.ch/projects/naturemade/.
Kath 2009 Kath H. (2009) Gerüche und Schadstoffe aus Biogas-Blockheizkraftwerken: Re-
duzierung kritischer Emissionen bei der energetischen Verwertung von Biogas.
Lebensministerium, Freistaat Sachsen, DE.
Leuenberger & Jungbluth 2009 Leuenberger M. and Jungbluth N. (2009) LCA of biogas production from differ-
ent substrates - Pre-evaluation of substrates. ESU-services im Auftrag des Bun-
desamts für Energie BFE, Uster, CH.
Leuenberger & Jungbluth 2010 Leuenberger M. and Jungbluth N. (2010) Ökobilanz einer Grasveredelungsanla-
ge. ESU-services Ltd. im Auftrag der Biowert AG, Uster, CH, retrieved from:
www.esu-services.ch.
naturemade 2011 naturemade (2011) Zertifizierungsrichtlinien: Bestimmungen und Kriterien. Ver-
sion 2.0, 1.1.2011. Verein für Umweltgerechte Elektrizität (VUE), Zürich, re-
trieved from: www.naturemade.org.
Nemecek et al. 2007 Nemecek T., Heil A., Huguenin O., Meier S., Erzinger S., Blaser S., Dux. D. and
Zimmermann A. (2007) Life Cycle Inventories of Agricultural Production Sys-
tems. ecoinvent report No. 15, v2.0. Agroscope FAL Reckenholz and FAT Tae-
nikon, Swiss Centre for Life Cycle Inventories, Dübendorf, CH, retrieved from:
www.ecoinvent.org.
Nielsen & Illerup 2003 Nielsen M. and Illerup J. B. (2003) Emissionsfaktorer og emissionsopgørelse for
decentral kraftvarme: Kortlægning af emissioner fra decentrale kraft-
varmeværker. Faglig rapport fra DMU, nr. 442, Eltra PSO projekt 3141, re-
trieved from:
www.dmu.dk/1_viden/2_Publikationer/3_fagrapporter/rapporter/FR442.pdf.
Parawira et al. 2008 Parawira W., Read J. S., Mattiasson B. and Börnsson L. (2008) Energy produc-
tion from agricultural residues: High methane yields in pilot-scale two-stage an-
aerobic digestion. In: Biomass and Bioenergy, 32, pp. 44-50.

46/84
Ruch 2005 Ruch D. (2005) BHKW-Optimierung und SCRKatalysator Kompaktbiogasanla-
ge Küssnacht. Bundesamt für Energie, Bern, retrieved from:
www.bfe.admin.ch/php/modules/enet/streamfile.php?file=000000009017.pdf&n
ame=000000250087.pdf.
Scherer et al. 2009 Scherer P., Neumann L., Demirel B., Schmidt O. and Unbehauen M. (2009)
Long term fermentation studies about the nutritional requirements for biogasifi-
cation of fodder beet silage as mono-substrate. In: Biomass and Bioenergy, 33,
pp. 873-881.
Schulte-Schulze 2006 Schulte-Schulze B. A. (2006) Aufbereitung und Einspeisung von Biogas. Car-
boTech Engineering GmbH, Essen.
TrÖbiV 2009 TrÖbiV (2009) Verordnung des UVEK über den Nachweis der positiven
ökologischen Gesamtbilanz von Treibstoffen aus erneuerbaren Rohstoffen. In:
Eidg. Departement für Umwelt, Vekehr, Energie und Kommunikation (UVEK),
Vol. Stand 15. April 2009, Switzerland, retrieved from:
www.admin.ch/ch/d/sr/6/641.611.21.de.pdf.
Urban et al. 2009 Urban W., Lohmann H. and Girod K. (2009) Abschlussbericht für das BMBF-
Verbundsprojekt "Biogaseinspeisung" - Beseitigung technischer, rechtlicher und
ökonomischer Hemmnisse bei der Einspeisung biogener Gase in das Erdgasnetz
zur Reduzierung klimarelevanter Emissionen durch Aufbau und Anwendung
einer georeferenzierten Datenbank. Band 4. Technologien und Kosten der Bio-
gasaufbereitung und Einspeisung in das Erdgasnetz. Ergebnisse der Markterhe-
bung 2007-2008. Fraunhofer-Institut für Umwelt-, Sicherheits- und Energietech-
nik UMSICHT, BASE Technologies GmbH, Oberhausen, Leipzig. Wuppertal,
Bochum, Essen, Magdeburg, Trier.
Zah et al. 2007 Zah R., Böni H., Gauch M., Hischier R., Lehmann M. and Wäger P. (2007)
Ökobilanz von Energieprodukten: Ökologische Bewertung von Biotreibstoffen.
Schlussbericht. Abteilung Technologie und Gesellschaft, Empa im Auftrag des
Bundesamtes für Energie, des Bundesamtes für Umwelt und des Bundesamtes
für Landwirtschaft, Bern, retrieved from:
www.bfe.admin.ch/energie/00588/00589/00644/index.html?lang=de&msg-
id=12653.

47/84
8 Appendix A: LCI of biogas conversion in agricultural biogas plants
8.1 Biogenic carbon balance methodology
In contrast to the life cycle inventory data presented by Jungbluth et al. (2007), in this project in most
cases no specific corrections are made in order to maintain the biogenic carbon balance of multi-
output processes. In consequence, assessing the global warming potential of products described in this
project should not include a climate change characterization factor for biogenic carbon uptake nor for
biogenic carbon dioxide emissions.
8.2 General assumptions
8.2.1 Yields
In Tab. 8.1 the properties of the average Swiss biogas mix are shown. Since the methane content of
biogas is the key property, the biogas yields of different biogas substrates are corrected according to
the methane content of the produced biogas (see Tab. 8.2).
Tab. 8.1 Summary of main properties of the Swiss biogas mix according to Jungbluth et al. (2007) p. 244
Biogas-Mix
Methane Vol. % 63.3
Carbon dioxide Vol. % 33.4
Methane Kg/Nm3
0.45
Carbon Dioxide Kg/Nm3 0.66
Total Carbon Content Kg/Nm3 0.52
Nitrogen Vol. % 3.17
Density Kg/Nm3 1.15
Lower heating value MJ/Nm3
22.7
Tab. 8.2 Actual and methane corrected biogas yield of different substrates (Institut für Energetik und Umwelt 2006)
and biogas conversion efficiency
Substrate Unit Maize si-
lage
Sugar
beet
Fodder
beet
Beet res-
idues Molasses Glycerine
Biogas yield Nm3 per
t fm 188.4 175.0 109.4 59.5 287.3 976.5
Methane content Vol. % 53% 54% 54% 55% 73% 50%
Methane correct-
ed biogas yield
Nm3 per
t fm 156.1 147.8 92.4 51.2 328.9 770.6
Energy content of
substrate MJ/kg 5.3 3.8 3.0 3.5 n/a 18.0
Biogas conver-
sion efficiency
MJbio-
gas/MJin 67% 89% 70% 34% n/a 97%
8.2.2 Energy consumption
In order to evaluate typical conditions of the operation of agricultural biogas plants in Switzerland, a
questionnaire was sent to biogas operators. Sixteen operators filled in the questionnaire.
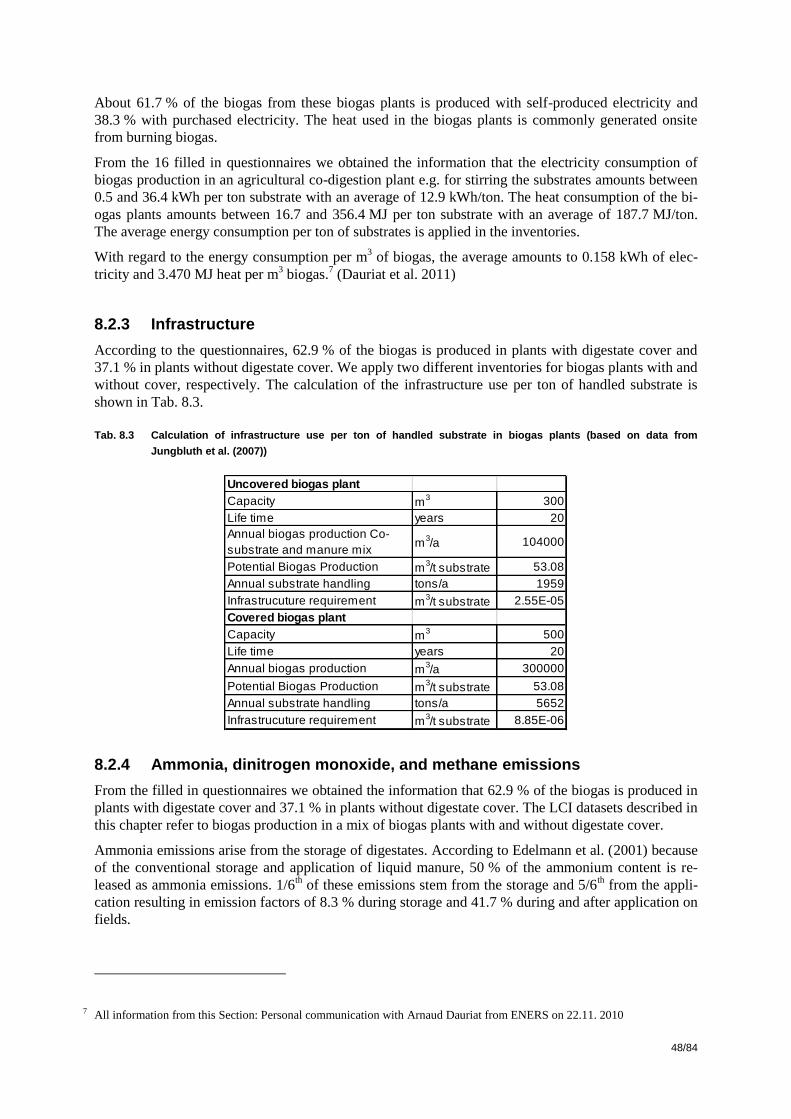
48/84
About 61.7 % of the biogas from these biogas plants is produced with self-produced electricity and
38.3 % with purchased electricity. The heat used in the biogas plants is commonly generated onsite
from burning biogas.
From the 16 filled in questionnaires we obtained the information that the electricity consumption of
biogas production in an agricultural co-digestion plant e.g. for stirring the substrates amounts between
0.5 and 36.4 kWh per ton substrate with an average of 12.9 kWh/ton. The heat consumption of the bi-
ogas plants amounts between 16.7 and 356.4 MJ per ton substrate with an average of 187.7 MJ/ton.
The average energy consumption per ton of substrates is applied in the inventories.
With regard to the energy consumption per m3 of biogas, the average amounts to 0.158 kWh of elec-
tricity and 3.470 MJ heat per m3 biogas.
7 (Dauriat et al. 2011)
8.2.3 Infrastructure
According to the questionnaires, 62.9 % of the biogas is produced in plants with digestate cover and
37.1 % in plants without digestate cover. We apply two different inventories for biogas plants with and
without cover, respectively. The calculation of the infrastructure use per ton of handled substrate is
shown in Tab. 8.3.
Tab. 8.3 Calculation of infrastructure use per ton of handled substrate in biogas plants (based on data from
Jungbluth et al. (2007))
8.2.4 Ammonia, dinitrogen monoxide, and methane emissions
From the filled in questionnaires we obtained the information that 62.9 % of the biogas is produced in
plants with digestate cover and 37.1 % in plants without digestate cover. The LCI datasets described in
this chapter refer to biogas production in a mix of biogas plants with and without digestate cover.
Ammonia emissions arise from the storage of digestates. According to Edelmann et al. (2001) because
of the conventional storage and application of liquid manure, 50 % of the ammonium content is re-
leased as ammonia emissions. 1/6th of these emissions stem from the storage and 5/6
th from the appli-
cation resulting in emission factors of 8.3 % during storage and 41.7 % during and after application on
fields.
7 All information from this Section: Personal communication with Arnaud Dauriat from ENERS on 22.11. 2010
Uncovered biogas plant
Capacity m3 300
Life time years 20
Annual biogas production Co-
substrate and manure mixm
3/a 104000
Potential Biogas Production m3/t substrate 53.08
Annual substrate handling tons/a 1959
Infrastrucuture requirement m3/t substrate 2.55E-05
Covered biogas plant
Capacity m3 500
Life time years 20
Annual biogas production m3/a 300000
Potential Biogas Production m3/t substrate 53.08
Annual substrate handling tons/a 5652
Infrastrucuture requirement m3/t substrate 8.85E-06

49/84
Furthermore, Edelmann et al. (2001) explain that the conversion in a biogas plant leads to increased
ammonia emissions due to an increased degradation of organically bound nitrogen in the fermenter
and an increase of the pH value. Ammonia emissions are therefore increased by 40 % during storage
and by 10 % during application. This leads a total ammonia emission factors of 11.7 % of the ammo-
nia content in the substrates during digestate storage and 45.8 % during digestate application on fields.
With appropriate measures these emissions can be reduced. The emissions during storage are reduced
by 80 % when digestates are covered.8
Dinitrogen monoxide emissions from digesting substrates amount to 0.1 kg /t according to Jungbluth
et al. (2010). When digestates are covered, these emissions are reduced by 75 %.
According to Jungbluth et al. (2007) the methane emission factor amounts to 1 % in biogas plant with
covered stock and to 5 % in biogas plants with uncovered stock. The emission factor of an average bi-
ogas plant is considered by applying the shares of biogas plants with and without digestate cover as
described above and by considering the methane share of 52.5 % in the volume of the produced bio-
gas.
8.3 Biogas from maize
8.3.1 System characteristics
Maize is one of the most commonly used energy crop in agricultural or industrial biogas production
plants and therefore plays an important role for the evaluation of different substrates in anaerobic di-
gestion. Compared to other energy crops, the properties of maize silage are favourable for biogas pro-
duction. Firstly, the cultivation has no special requirements, the maize yield per hectare is comparably
high and the silage can easily be stored in bunker silos (Institut für Energetik und Umwelt gGmbH
2006). The biogas yield per ton maize silage depends on the variety. Varieties with late ripening pro-
duce more biogas than early ripening varieties (Amon et al. 2007a; Institut für Energetik und Umwelt
gGmbH 2006). A drawback of maize silage used in anaerobic digestion is its competitive use as ani-
mal feed.
Experiences with maize in anaerobic digestion are mainly available from biogas production in Germa-
ny, where maize is often added as a co-substrate. The agricultural production of maize has to be fully
attributed to the environmental impact of the biogas production. LCI data on maize cultivation is
available in the ecoinvent database (Nemecek et al. 2007).
The specifications of maize silage that are used in this study are declared in Tab. 8.5.
Tab. 8.4 Specification of maize silage and of the production of biogas from this substrate (Institut für Energetik und
Umwelt gGmbH 2006)
Maize silage
Dry matter content % 27.5%
organic substance % DM 90.0%
N % DM 1.6%
P % DM 0.3%
Biogas yield m3 per t DM 672.7
CH4 content % 52.5%
8 www.nw.ch/dl.php/de/20060502101744/Ammoniak_NH3_Faktenblatt.pdf (access on 11.10.2011)

50/84
8.3.2 Raw material input
The Institut für Energetik und Umwelt (2006) reports a biogas yield of 170 – 200 Nm3
per ton fresh
matter and 450 – 700 Nm3 per ton of organic dry matter as well as a dry matter content of 27.5 %. Ad-
justing the mean value to the dry matter content of maize silage in ecoinvent (moisture content of
72%) results in 188.4 Nm3 of biogas per ton of maize silage. Since biogas from maize silage has a me-
thane content of 52.5 % which is lower than the average biogas content of 63.3 %, the methane cor-
rected biogas yield is 156.1 Nm3 of biogas per ton of maize silage. It is assumed that the maize silage
is transported by lorry over a distance of 50 km.
8.3.3 Emissions to air
As described in section 8.2.4 the ammonia emissions from storage of the maize digestate are calculat-
ed from the emission factor of 11.7 % of the ammonium content and an 80 % emission reduction for
the share of 62.9 % of biogas plants with a digestate cover. The ammonia content of the substrate is
between 0.15 % and 0.30 % (mean: 0.23 %) of the maize silage dry matter mass (Institut für Energetik
und Umwelt gGmbH 2006). Applying these factors, results in 0.28 g ammonia per m3 biogas.
The biogenic carbon dioxide emissions are considered with the same emission factor as methane and
the carbon dioxide share of 33.4 % in the biogas (see Tab. 8.1).
Gronauer et al. (1997) cited in Jungbluth et al. (2007: 188) claim a hydrogen sulphide emission factor
of 700 g per ton input dry matter. From this factors follow H2S emissions of 1.04 g per m3 biogas.
8.4 Biogas from sugar beet, fodder beet and beet residues
8.4.1 System characteristics
Apart from maize, beet cultivation in Switzerland provides large amounts of biomass, which could be
potentially used in biogas production. Currently, beets are used for sugar production or as animal feed.
If the beet silage is directly added to anaerobic digestion, the environmental impact of beet production
has to be taken into account for the LCA of biogas production.
Similar to maize silage, the cultivation of beets has a high yield and the methane production is compa-
rably high. Cultivation requirements and the storage of the silage on the other hand are more compli-
cated. The dependence of biogas yield from fodder beet digestion on microbiologic conditions has
been investigated by Scherer et al. (2009).
As sugar and fodder beets are primarily used for sugar production or animal feed respectively, the use
of the entire beet as substrate still is uncommon. More often the residues from sugar and fodder beet,
leafs and tops, are fermented in closed silos and later used as substrates (Börjesson & Berglund 2005).
Wastes from sugar and fodder beet processing, mainly tops and leaves, are organic wastes with high
dry matter contents. This makes them attractive for the use as substrate in anaerobic digestion. De-
pending on the market price paid for the sugar and fodder beet residues, a part of the environmental
impact arising from beet production has to be allocated to the beet residues.
The use as substrates with solid potato waste showed, that the biogas yield can be enhanced, when
fodder beet leafs are digested together with other substrates (Parawira et al. 2008).
The specifications of sugar beets, fodder beets and beet residues that are used in this study are declared
in Tab. 8.5.
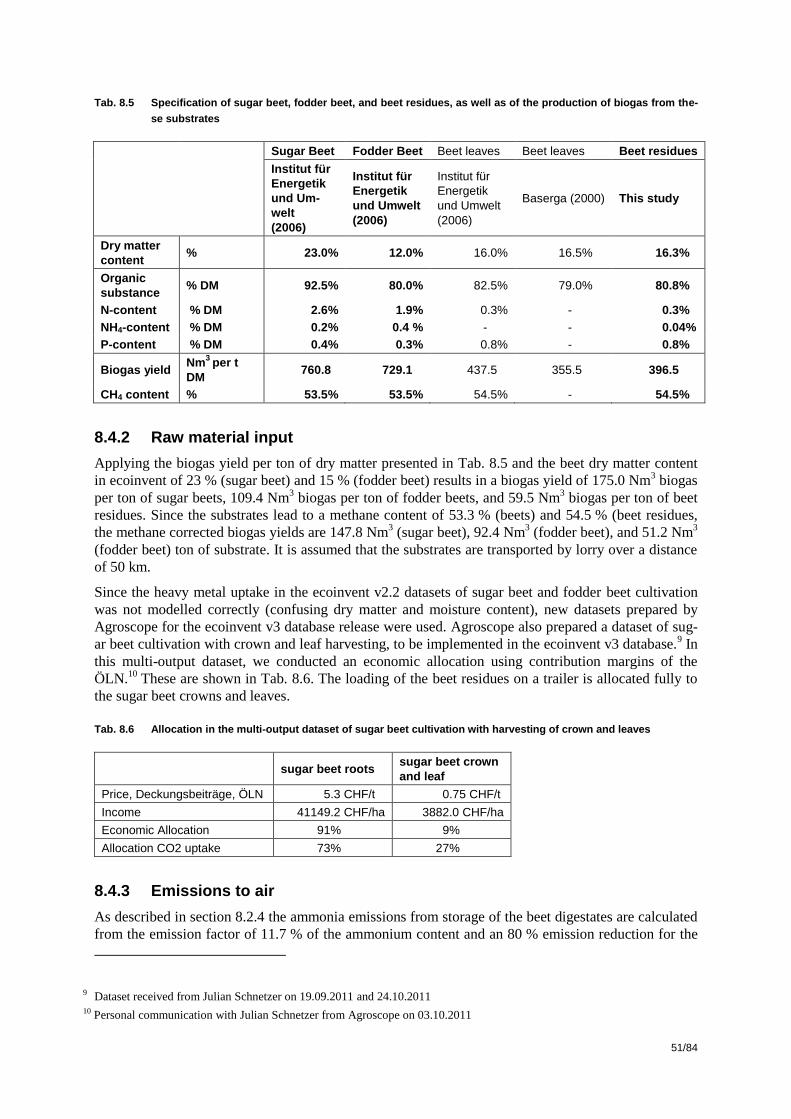
51/84
Tab. 8.5 Specification of sugar beet, fodder beet, and beet residues, as well as of the production of biogas from the-
se substrates
Sugar Beet Fodder Beet Beet leaves Beet leaves Beet residues
Institut für
Energetik
und Um-
welt
(2006)
Institut für
Energetik
und Umwelt
(2006)
Institut für
Energetik
und Umwelt
(2006)
Baserga (2000) This study
Dry matter
content % 23.0% 12.0% 16.0% 16.5% 16.3%
Organic
substance % DM 92.5% 80.0% 82.5% 79.0% 80.8%
N-content % DM 2.6% 1.9% 0.3% - 0.3%
NH4-content % DM 0.2% 0.4 % - - 0.04%
P-content % DM 0.4% 0.3% 0.8% - 0.8%
Biogas yield Nm
3 per t
DM 760.8 729.1 437.5 355.5 396.5
CH4 content % 53.5% 53.5% 54.5% - 54.5%
8.4.2 Raw material input
Applying the biogas yield per ton of dry matter presented in Tab. 8.5 and the beet dry matter content
in ecoinvent of 23 % (sugar beet) and 15 % (fodder beet) results in a biogas yield of 175.0 Nm3 biogas
per ton of sugar beets, 109.4 Nm3 biogas per ton of fodder beets, and 59.5 Nm
3 biogas per ton of beet
residues. Since the substrates lead to a methane content of 53.3 % (beets) and 54.5 % (beet residues,
the methane corrected biogas yields are 147.8 Nm3 (sugar beet), 92.4 Nm
3 (fodder beet), and 51.2 Nm
3
(fodder beet) ton of substrate. It is assumed that the substrates are transported by lorry over a distance
of 50 km.
Since the heavy metal uptake in the ecoinvent v2.2 datasets of sugar beet and fodder beet cultivation
was not modelled correctly (confusing dry matter and moisture content), new datasets prepared by
Agroscope for the ecoinvent v3 database release were used. Agroscope also prepared a dataset of sug-
ar beet cultivation with crown and leaf harvesting, to be implemented in the ecoinvent v3 database.9 In
this multi-output dataset, we conducted an economic allocation using contribution margins of the
ÖLN.10
These are shown in Tab. 8.6. The loading of the beet residues on a trailer is allocated fully to
the sugar beet crowns and leaves.
Tab. 8.6 Allocation in the multi-output dataset of sugar beet cultivation with harvesting of crown and leaves
sugar beet roots
sugar beet crown
and leaf
Price, Deckungsbeiträge, ÖLN 5.3 CHF/t 0.75 CHF/t
Income 41149.2 CHF/ha 3882.0 CHF/ha
Economic Allocation 91% 9%
Allocation CO2 uptake 73% 27%
8.4.3 Emissions to air
As described in section 8.2.4 the ammonia emissions from storage of the beet digestates are calculated
from the emission factor of 11.7 % of the ammonium content and an 80 % emission reduction for the
9 Dataset received from Julian Schnetzer on 19.09.2011 and 24.10.2011 10 Personal communication with Julian Schnetzer from Agroscope on 03.10.2011

52/84
share of 62.9 % of biogas plants with a digestate cover. The ammonia content of the substrates is given
in Tab. 8.5. The ammonia content of beet residues is calculated with the average ammonia-N share in
the total nitrogen content of sugar and fodder beets, which is 13 %. Applying these factors, results in
0.22 g NH3/m3 biogas from sugar beets, 0.32 g NH3/m
3 biogas from fodder beets, and 0.08 NH3/m
3 bi-
ogas from beet residues.
The biogenic carbon dioxide emissions are considered with the same emission factor as methane and
the carbon dioxide share of 33.4 % in the biogas (see Tab. 8.1).
Gronauer et al. (1997) cited in Jungbluth et al. (2007:188) claim a hydrogen sulphide emission factor
of 700 g per ton input dry matter. From this factors follow H2S emissions of 0.92 g per m3 biogas from
sugar beets, 0.96 g per m3 biogas from fodder beets, and 1.77 g per m
3 biogas from beet residues.
8.5 Biogas from molasses
8.5.1 System characteristics
Molasses are a by-product of sugar production. They have high dry matter and sugar contents and
therefore are suitable to increase the biogas yield of liquid biogas substrates. Like the other sugar beet
residues, molasses are used as animal feed or in distilleries, which makes it rather rare for the use as
substrate for anaerobic digestion (Institut für Energetik und Umwelt gGmbH 2006).
The specifications of molasses that are used in this study are declared in Tab. 8.7.
Tab. 8.7 Specification of molasses and of the production of biogas from this substrate
Molasses Molasses Molasses
Institut für Energetik und Umwelt
(2006) Baserga (2000) This study
Dry matter content % 85.0% 80.0% 82.5%
organic substance % DM 87.5% 79.0% 91.3%
N % DM 1.5% - 1.5%
P % DM 0.3% - 0.3%
Biogas yield m3 per t DM 370.6 427.5 399.0
CH4 content % 72.5% - 72.5%
8.5.2 Raw material input
As molasses input, we include an ecoinvent inventory dataset of molasses from sugar beet in Switzer-
land, which considers a molasses price of 240 CHF/t as basis for the economic allocation between
sugar, beet pulps, and molasses (Jungbluth et al. 2007).
Applying the biogas yield per ton of dry matter presented in Tab. 8.7 and the molasses dry matter con-
tent in ecoinvent of 72 % results in a biogas yield of 287.3 Nm3 biogas per ton of molasses. Since bio-
gas from molasses has a methane content of 72.5 %, the methane corrected biogas yield is 328.9 Nm3
of biogas per ton of molasses. It is assumed that the molasses are transported by lorry over a distance
of 50 km.
8.5.3 Emissions to air
As described in section 8.2.4 the ammonia emissions from storage of the beet digestates are calculated
from the emission factor of 11.7 % of the ammonium content and an 80 % emission reduction for the
share of 62.9 % of biogas plants with a digestate cover. In the data published by the Institut für Ener-
getik und Umwelt (2006), the average share of NH4-N in the total nitrogen content of the agricultural

53/84
processing industry is about 12 %, which means an ammonia content of 0.2 % of the molasses dry
matter. Applying these factors, results in 0.31 g NH3/m3 biogas from molasses.
The biogenic carbon dioxide emissions are considered with the same emission factor as methane and
the carbon dioxide share of 33.4 % in the biogas (see Tab. 8.1).
Gronauer et al. (1997) cited in Jungbluth et al. (2007:188) claim a hydrogen sulphide emission factor
of 700 g per ton input dry matter. From this factors follow H2S emissions of 1.75 g per m3 biogas.
8.6 Biogas from glycerine
8.6.1 System characteristics
Glycerine for biogas production is mainly extracted in vegetable oil esterification plants, but it can al-
so be produced by many other industries (petrochemical, soap by-product etc.). Glycerine is used with
increasing popularity as a substrate and increases the biogas yield considerably. The use of glycerine
as a mono-substrate in biogas fermentation has been investigated by Erb et al. (2008). In the question-
naires filled in by operators of agricultural biogas plants, three operators declare that they pay a price
of between 200 and 220 CHF per ton of glycerine in 2008 and 2009 (Dauriat et al. 2011). In this study
we investigate the use of glycerine made from rape oil and glycerine made from waste oil in the biogas
production.
The specifications of glycerine that are used in this study are declared in Tab. 8.8.
Tab. 8.8 Specification of glycerine and of the production of biogas from this substrate (Erb et al. 2008; Institut für
Energetik und Umwelt gGmbH 2006])
Glycerine
Dry matter content % 97.2%
organic substance % DM 93.6%
N % DM 0.03%
P % DM 0.003%
Biogas yield m3 per t DM 1004.3
CH4 content % 50.0%
8.6.2 Raw material input
Jungbluth et al. (2007) apply an economic allocation to the multi-output processes of plant oil esterifi-
cation. They consider the product methyl ester with a price of 1’010 SFr./t and the product glycerine
with a price of 1’380 SFr./t. However, in 2010 the glycerine is not sold in a highly pure quality any-
more and is valorised in a biogas plant instead. Glycerine that is used in biogas power plants is of low-
er purity. In questionnaires, biogas plant operators report an average glycerine price of 208 SFr./t. Ap-
plying this glycerine price and a rape oil esterification yield of 864 kg methyl ester and 93 kg glycer-
ine from one ton of rape oil results in an allocation factor of 97.8 % to methyl ester. In order to update
the inventory datasets of rape oil and vegetable oil esterification, this new allocation factor is included.
This correction influences the LCA results of both types of biofuels, rape methyl ester (RME) and bi-
ogas from glycerine. With the updated allocation, RME shows higher environmental impacts whereas
biogas from glycerine shows lower environmental impacts, compared to the analysis with the previous
allocation.
Erb et al. (2008) report a biogas yield of 940 Nm3 per ton organic substance, an organic substance con-
tent of 93.6 % in the total dry matter of glycerine and a dry matter content of 97.2 %. This results in a
biogas yield of 976.2 Nm3 biogas per ton of glycerine. Since biogas from glycerine has a methane con-
tent of 50.0 %, the methane corrected biogas yield is 770.6 Nm3 of biogas per ton of glycerine.

54/84
In addition to the biogas from glycerine made from rape oil, a scenario is considered with glycerine
from vegetable waste oil from France. The prices for obtaining and treating waste oil are very vola-
tile.11
Waste oil can be considered as a material for disposal and therefore, when calculating environ-
mental life cycle impacts, waste oil does not carry any environmental burdens from the oil production.
In the filled in questionnaires, 5 operators of agricultural biogas plants report transport distances of
glycerine between 6 and 50 km (average 39 km), which can be considered as the distance from the lo-
cal reseller. However, since most glycerine is imported from abroad12
, it is assumed in this study that
the glycerine is transported by lorry over a distance of 500 km.
8.6.3 Emissions to air
As described in section 8.2.4 the ammonia emissions from storage of the beet digestates are calculated
from the emission factor of 11.7 % of the ammonium content and an 80 % emission reduction for the
share of 62.9 % of biogas plants with a digestate cover. In the data published by the Institut für Ener-
getik und Umwelt (2006), the share of NH4-N in the total nitrogen content of fat is 46 %, which we
consider also for glycerine. Applying these factors, results in 2.4 mg NH3/m3 biogas from glycerine.
The biogenic carbon dioxide emissions are considered with the same emission factor as methane and
the carbon dioxide share of 33.4 % in the biogas (see Tab. 8.1).
Gronauer et al. (1997) cited in Jungbluth et al. (2007:188) claim a hydrogen sulphide emission factor
of 700 g per ton input dry matter. From this factors follow H2S emissions of 0.70 g per m3 biogas.
8.7 Life cycle inventories of biogas conversion in agricultural biogas plants
The unit process raw data of the anaerobic co-digestion in agricultural biogas plants is are displayed in
Tab. 8.9 and Tab. 8.10. The EcoSpold meta information is shown in Tab. 8.12.
11 Personal communication with Beat Amman from the ara region bern ag on 05.11.2011 12 Personal communication with Konrad Schleiss from UMWEKO GmbH on 03.01.2011

55/84
Tab. 8.9 Unit process raw data of anaerobic co-digestion in agricultural biogas plants (part I)
Name
Lo
ca
tio
n
Infr
astr
uctu
reP
roce
ss
Un
it
biogas, from
maize silage, co-
digestion, at
storage
biogas, from
sugar beet, co-
digestion, at
storage
biogas, from
fodder beet, co-
digestion, at
storage
biogas, from
beet residues,
co-digestion, at
storage
biogas, from
molasses, co-
digestion, at
storage
biogas, from
glycerine, co-
digestion, at
storage
biogas, from
glycerine, co-
digestion, at
storage,
scenario
vegetable oil Un
ce
rta
inty
Typ
e
Sta
nd
ard
De
via
tio
n9
5%
GeneralComment
Location CH CH CH CH CH CH CH
InfrastructureProcess 0 0 0 0 0 0 0
Unit Nm3 Nm3 Nm3 Nm3 Nm3 Nm3 Nm3
technosphere silage maize IP, at farm CH 0 kg 6.41E+0 - - - - - - 1 1.08 (2,1,2,1,1,2,BU:1.05);
sugar beets IP, at farm CH 0 kg - 6.77E+0 - - - - 1 1.08 (2,1,2,1,1,2,BU:1.05);
fodder beets IP, at farm CH 0 kg - - 1.08E+1 - - - - 1 1.08 (2,1,2,1,1,2,BU:1.05);
sugar beet crown and leaf IP, at farm CH 0 kg - - - 1.95E+1 - - - 1 1.08 (2,1,2,1,1,2,BU:1.05);
molasses, from sugar beet, at sugar refinery CH 0 kg - - - - 3.04E+0 - - 1 1.08 (2,1,2,1,1,2,BU:1.05);
glycerine, from rape oil, at esterification plant, 2011 CH 0 kg - - - - - 1.30E+0 - 1 1.08 (2,1,2,1,1,2,BU:1.05);
glycerine, from vegetable oil, at esterification plant, 2011 FR 0 kg - - - - - - 1.30E+0 1 1.08 (2,1,2,1,1,2,BU:1.05);
potato starch, at plant DE 0 kg - - - - - - - 1 1.08 (2,1,2,1,1,2,BU:1.05);
rape meal, at oil mill CH 0 kg - - - - - - - 1 1.08 (2,1,2,1,1,2,BU:1.05);
anaerobic digestion plant, agriculture CH 1 unit 6.06E-8 6.41E-8 1.02E-7 1.85E-7 2.88E-8 1.23E-8 1.23E-8 1 3.06(3,3,2,3,1,5,BU:3); 37.1% without digestate cover. Plant
producing 300'000 m3 biogas per year, life time 20 a
anaerobic digestion plant covered, agriculture CH 1 unit 3.56E-8 3.76E-8 6.02E-8 1.09E-7 1.69E-8 7.22E-9 7.22E-9 1 3.06(3,3,2,3,1,5,BU:3); 62.9% with digestate cover. Plant
producing 300'000 m3 biogas per year, life time 20 a
electricity, low voltage, at grid CH 0 kWh 3.17E-02 3.35E-02 5.35E-02 9.66E-02 1.50E-02 6.42E-03 6.42E-03 1 1.13 (3,2,1,1,1,3,BU:1.05);
electricity, biogas from maize silage, at cogen CH 0 kWh 5.10E-02 - - - - - - 1 1.13(3,2,1,1,1,3,BU:1.05); Share of self produced electricity
in plant with digestate cover
electricity, biogas from sugar beet, at cogen CH 0 kWh - 5.39E-02 - - - - - 1 1.13(3,2,1,1,1,3,BU:1.05); Share of self produced electricity
in plant with digestate cover
electricity, biogas from fodder beet, at cogen CH 0 kWh - - 8.62E-02 - - - - 1 1.13(3,2,1,1,1,3,BU:1.05); Share of self produced electricity
in plant with digestate cover
electricity, biogas from beet residues, at cogen CH 0 kWh - - - 1.56E-01 - - - 1 1.13(3,2,1,1,1,3,BU:1.05); Share of self produced electricity
in plant without digestate cover
electricity, biogas from molasses, at cogen CH 0 kWh - - - - 2.42E-02 - - 1 1.13(3,2,1,1,1,3,BU:1.05); Share of self produced electricity
in plant without digestate cover
electricity, biogas from glycerine, at cogen CH 0 kWh - - - - - 1.03E-02 - 1 1.13(3,2,1,1,1,3,BU:1.05); Share of self produced electricity
in plant without digestate cover
electricity, biogas from glycerine, at cogen, scenario
vegetable oilCH 0 kWh - - - - - - 1.03E-02 1 1.13
(3,2,1,1,1,3,BU:1.05); Share of self produced electricity
in plant without digestate cover
electricity, biogas from vegetable, at cogen CH 0 kWh - - - - - - - 1 1.13(3,2,1,1,1,3,BU:1.05); Share of self produced electricity
in plant without digestate cover
electricity, biogas from potato pulp, at cogen CH 0 kWh - - - - - - - 1 1.13(3,2,1,1,1,3,BU:1.05); Share of self produced electricity
in plant without digestate cover
electricity, biogas from rape meal, at cogen CH 0 kWh - - - - - - - 1 1.13(3,2,1,1,1,3,BU:1.05); Share of self produced electricity
in plant without digestate cover

56/84
Tab. 8.10 Unit process raw data of anaerobic co-digestion in agricultural biogas plants (part II)
Name
Lo
ca
tio
n
Infr
astr
uctu
reP
roce
ss
Un
it
biogas, from
maize silage, co-
digestion, at
storage
biogas, from
sugar beet, co-
digestion, at
storage
biogas, from
fodder beet, co-
digestion, at
storage
biogas, from
beet residues,
co-digestion, at
storage
biogas, from
molasses, co-
digestion, at
storage
biogas, from
glycerine, co-
digestion, at
storage
biogas, from
glycerine, co-
digestion, at
storage,
scenario
vegetable oil Un
ce
rta
inty
Typ
e
Sta
nd
ard
De
via
tio
n9
5%
GeneralComment
Location CH CH CH CH CH CH CH
InfrastructureProcess 0 0 0 0 0 0 0
Unit Nm3 Nm3 Nm3 Nm3 Nm3 Nm3 Nm3
heat, biogas from maize silage, at cogen CH 0 MJ 1.20E+00 - - - - - - 1 1.13 (3,2,1,1,1,3,BU:1.05);
heat, biogas from sugar beet, at cogen CH 0 MJ - 1.27E+00 - - - - - 1 1.13 (3,2,1,1,1,3,BU:1.05);
heat, biogas from fodder beet, at cogen CH 0 MJ - - 2.03E+00 - - - - 1 1.13 (3,2,1,1,1,3,BU:1.05);
heat, biogas from beet residues, at cogen CH 0 MJ - - - 3.67E+00 - - - 1 1.13 (3,2,1,1,1,3,BU:1.05);
heat, biogas from molasses, at cogen CH 0 MJ - - - - 5.71E-01 - - 1 1.13 (3,2,1,1,1,3,BU:1.05);
heat, biogas from glycerine, at cogen CH 0 MJ - - - - - 2.44E-01 - 1 1.13 (3,2,1,1,1,3,BU:1.05);
heat, biogas from glycerine, at cogen, scenario vegetable oil CH 0 MJ - - - - - - 2.44E-01 1 1.13 (3,2,1,1,1,3,BU:1.05);
heat, biogas from vegetable oil, at cogen CH 0 MJ - - - - - - - 1 1.13 (3,2,1,1,1,3,BU:1.05);
heat, biogas from potato pulp, at cogen CH 0 MJ - - - - - - - 1 1.13 (3,2,1,1,1,3,BU:1.05);
heat, biogas from rape meal, at cogen CH 0 MJ - - - - - - - 1 1.13 (3,2,1,1,1,3,BU:1.05);
transport, lorry 3.5-20t, fleet average CH 0 tkm 3.20E-1 3.38E-1 5.41E-1 9.77E-1 1.52E-1 6.49E-1 6.49E-1 1 2.09(4,5,na,na,na,na,BU:2); assumption: 50 km for
agricultural products, 500 km for glycerine
emission air,
unspecifiedAmmonia - - kg 2.79E-4 2.19E-4 3.20E-4 8.77E-5 3.06E-4 2.40E-6 2.40E-6 1 1.38
(2,3,4,3,1,5,BU:1.2); 80*% reduced emissions in
plants with digestate cover
Carbon dioxide, biogenic - - kg 1.64E-02 1.64E-02 1.64E-02 1.64E-02 1.18E-02 1.64E-02 1.64E-02 1 1.33(3,3,4,3,1,5,BU:1.05); 1% emissions from covered
stock and 5 % emissions from uncovered stock
Methane, biogenic - - kg 1.13E-02 1.13E-02 1.13E-02 1.13E-02 1.13E-02 1.13E-02 1.13E-02 1 1.64(3,3,4,3,1,5,BU:1.5); 1% emissions from covered stock
and 5 % emissions from uncovered stock
Hydrogen sulfide - - kg 1.26E-03 1.09E-03 1.14E-03 2.05E-03 1.53E-03 8.83E-04 8.83E-04 1 1.57 (1,3,2,3,1,5,BU:1.5);
Dinitrogen monoxide - - kg 3.38E-4 3.57E-4 5.72E-4 1.03E-3 1.61E-4 6.86E-5 6.86E-5 1 1.63 (2,3,4,3,1,5,BU:1.5);
emission air,
high
population
density
Heat, waste - - MJ 1.50E+0 1.58E+0 2.54E+0 4.58E+0 7.12E-1 3.04E-1 3.04E-1 1 1.13 (3,2,1,1,1,3,BU:1.05); own calculations

57/84
Tab. 8.11 Amount of digestate from anaerobic co-digestion in agricultural biogas plants (only considered in scenario with digestate allocation to biogas)
Name
Lo
ca
tio
n
Infr
astr
uctu
reP
roce
ss
Un
it
biogas, from
maize silage, co-
digestion, at
storage
biogas, from
sugar beet, co-
digestion, at
storage
biogas, from
fodder beet, co-
digestion, at
storage
biogas, from
beet residues,
co-digestion, at
storage
biogas, from
molasses, co-
digestion, at
storage
biogas, from
glycerine, co-
digestion, at
storage
biogas, from
glycerine, co-
digestion, at
storage,
scenario
vegetable oil Un
ce
rta
inty
Typ
e
Sta
nd
ard
De
via
tio
n9
5%
GeneralComment
Location CH CH CH CH CH CH CH
InfrastructureProcess 0 0 0 0 0 0 0
Unit Nm3 Nm3 Nm3 Nm3 Nm3 Nm3 Nm3
application, digested matter, from maize silage, on agricultural land CH 0 kg 5.23E+0 - - - - - - 1 1.13 (3,2,1,1,1,3,BU:1.05);
application, digested matter, from beets, on agricultural land CH 0 kg - 5.59E+0 9.64E+0 - - - - 1 1.13 (3,2,1,1,1,3,BU:1.05);
application, digested matter, from beet residues, on agricultural land CH 0 kg - - - 1.84E+1 - - - 1 1.13 (3,2,1,1,1,3,BU:1.05);
application, digested matter, from molasses, on agricultural land CH 0 kg - - - - 1.87E+0 - - 1 1.13 (3,2,1,1,1,3,BU:1.05);
application, digested matter, from glycerine, on agricultural land CH 0 kg - - - - - 1.19E-1 1.19E-1 1 1.13 (3,2,1,1,1,3,BU:1.05);
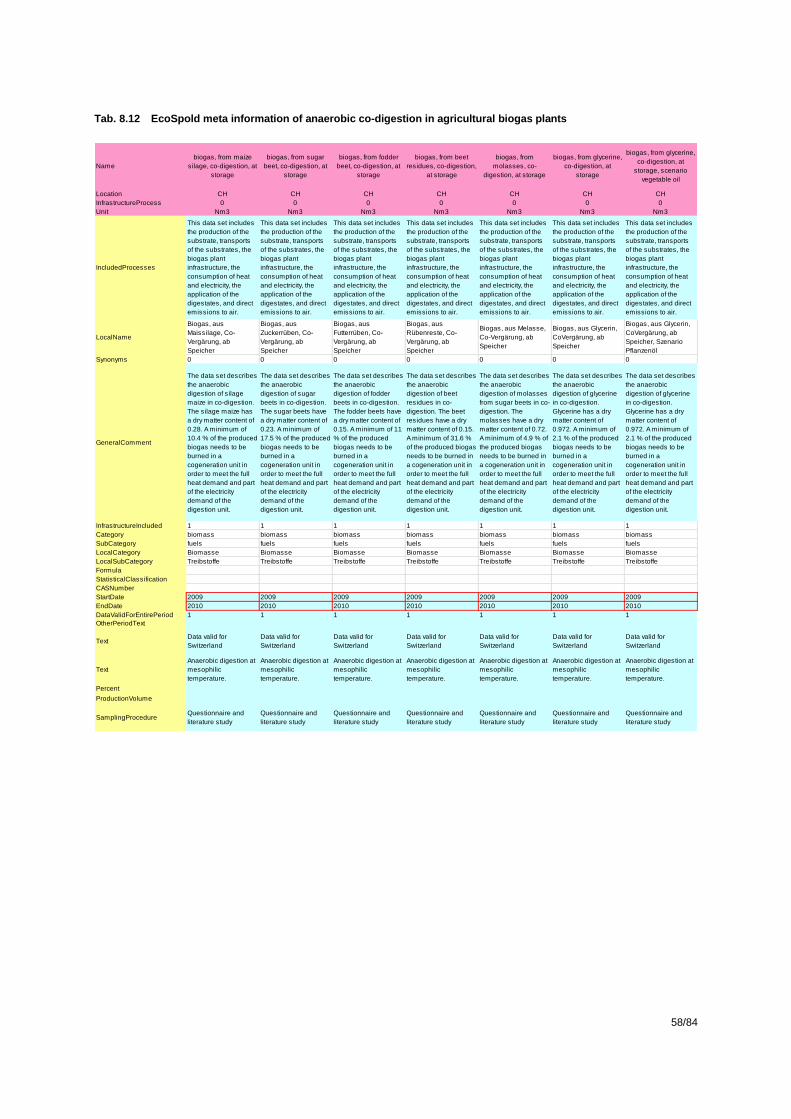
58/84
Tab. 8.12 EcoSpold meta information of anaerobic co-digestion in agricultural biogas plants
Name
biogas, from maize
silage, co-digestion, at
storage
biogas, from sugar
beet, co-digestion, at
storage
biogas, from fodder
beet, co-digestion, at
storage
biogas, from beet
residues, co-digestion,
at storage
biogas, from
molasses, co-
digestion, at storage
biogas, from glycerine,
co-digestion, at
storage
biogas, from glycerine,
co-digestion, at
storage, scenario
vegetable oil
Location CH CH CH CH CH CH CH
InfrastructureProcess 0 0 0 0 0 0 0
Unit Nm3 Nm3 Nm3 Nm3 Nm3 Nm3 Nm3
IncludedProcesses
This data set includes
the production of the
substrate, transports
of the substrates, the
biogas plant
infrastructure, the
consumption of heat
and electricity, the
application of the
digestates, and direct
emissions to air.
This data set includes
the production of the
substrate, transports
of the substrates, the
biogas plant
infrastructure, the
consumption of heat
and electricity, the
application of the
digestates, and direct
emissions to air.
This data set includes
the production of the
substrate, transports
of the substrates, the
biogas plant
infrastructure, the
consumption of heat
and electricity, the
application of the
digestates, and direct
emissions to air.
This data set includes
the production of the
substrate, transports
of the substrates, the
biogas plant
infrastructure, the
consumption of heat
and electricity, the
application of the
digestates, and direct
emissions to air.
This data set includes
the production of the
substrate, transports
of the substrates, the
biogas plant
infrastructure, the
consumption of heat
and electricity, the
application of the
digestates, and direct
emissions to air.
This data set includes
the production of the
substrate, transports
of the substrates, the
biogas plant
infrastructure, the
consumption of heat
and electricity, the
application of the
digestates, and direct
emissions to air.
This data set includes
the production of the
substrate, transports
of the substrates, the
biogas plant
infrastructure, the
consumption of heat
and electricity, the
application of the
digestates, and direct
emissions to air.
LocalName
Biogas, aus
Maissilage, Co-
Vergärung, ab
Speicher
Biogas, aus
Zuckerrüben, Co-
Vergärung, ab
Speicher
Biogas, aus
Futterrüben, Co-
Vergärung, ab
Speicher
Biogas, aus
Rübenreste, Co-
Vergärung, ab
Speicher
Biogas, aus Melasse,
Co-Vergärung, ab
Speicher
Biogas, aus Glycerin,
CoVergärung, ab
Speicher
Biogas, aus Glycerin,
CoVergärung, ab
Speicher, Szenario
Pflanzenöl
Synonyms 0 0 0 0 0 0 0
GeneralComment
The data set describes
the anaerobic
digestion of silage
maize in co-digestion.
The silage maize has
a dry matter content of
0.28. A minimum of
10.4 % of the produced
biogas needs to be
burned in a
cogeneration unit in
order to meet the full
heat demand and part
of the electricity
demand of the
digestion unit.
The data set describes
the anaerobic
digestion of sugar
beets in co-digestion.
The sugar beets have
a dry matter content of
0.23. A minimum of
17.5 % of the produced
biogas needs to be
burned in a
cogeneration unit in
order to meet the full
heat demand and part
of the electricity
demand of the
digestion unit.
The data set describes
the anaerobic
digestion of fodder
beets in co-digestion.
The fodder beets have
a dry matter content of
0.15. A minimum of 11
% of the produced
biogas needs to be
burned in a
cogeneration unit in
order to meet the full
heat demand and part
of the electricity
demand of the
digestion unit.
The data set describes
the anaerobic
digestion of beet
residues in co-
digestion. The beet
residues have a dry
matter content of 0.15.
A minimum of 31.6 %
of the produced biogas
needs to be burned in
a cogeneration unit in
order to meet the full
heat demand and part
of the electricity
demand of the
digestion unit.
The data set describes
the anaerobic
digestion of molasses
from sugar beets in co-
digestion. The
molasses have a dry
matter content of 0.72.
A minimum of 4.9 % of
the produced biogas
needs to be burned in
a cogeneration unit in
order to meet the full
heat demand and part
of the electricity
demand of the
digestion unit.
The data set describes
the anaerobic
digestion of glycerine
in co-digestion.
Glycerine has a dry
matter content of
0.972. A minimum of
2.1 % of the produced
biogas needs to be
burned in a
cogeneration unit in
order to meet the full
heat demand and part
of the electricity
demand of the
digestion unit.
The data set describes
the anaerobic
digestion of glycerine
in co-digestion.
Glycerine has a dry
matter content of
0.972. A minimum of
2.1 % of the produced
biogas needs to be
burned in a
cogeneration unit in
order to meet the full
heat demand and part
of the electricity
demand of the
digestion unit.
InfrastructureIncluded 1 1 1 1 1 1 1
Category biomass biomass biomass biomass biomass biomass biomass
SubCategory fuels fuels fuels fuels fuels fuels fuels
LocalCategory Biomasse Biomasse Biomasse Biomasse Biomasse Biomasse Biomasse
LocalSubCategory Treibstoffe Treibstoffe Treibstoffe Treibstoffe Treibstoffe Treibstoffe Treibstoffe
Formula
StatisticalClassification
CASNumber
StartDate 2009 2009 2009 2009 2009 2009 2009
EndDate 2010 2010 2010 2010 2010 2010 2010
DataValidForEntirePeriod 1 1 1 1 1 1 1
OtherPeriodText
TextData valid for
Switzerland
Data valid for
Switzerland
Data valid for
Switzerland
Data valid for
Switzerland
Data valid for
Switzerland
Data valid for
Switzerland
Data valid for
Switzerland
Text
Anaerobic digestion at
mesophilic
temperature.
Anaerobic digestion at
mesophilic
temperature.
Anaerobic digestion at
mesophilic
temperature.
Anaerobic digestion at
mesophilic
temperature.
Anaerobic digestion at
mesophilic
temperature.
Anaerobic digestion at
mesophilic
temperature.
Anaerobic digestion at
mesophilic
temperature.
Percent
ProductionVolume
SamplingProcedureQuestionnaire and
literature study
Questionnaire and
literature study
Questionnaire and
literature study
Questionnaire and
literature study
Questionnaire and
literature study
Questionnaire and
literature study
Questionnaire and
literature study

59/84
9 Appendix B: LCI of application of digested matter on agricultural land
After the production of biogas, the digested matter is usually spread as fertiliser on agricultural land.
This requires vehicles and machinery for transport and spreading and it leads to ammonia emissions
into air and heavy metal emissions into soil. The filled in questionnaires show that solid digested mat-
ter is delivered over a distance between 1.5 km and 5 km with a weighted average distance of 3.0 km.
Liquid digested matter is delivered over a distance between 0.5 km and 20 km with a weighted aver-
age distance of 10.5 km. The unit process raw data of application of digested matter on agricultural
land is presented in Tab. 9.5.
9.1 Ammonia
As described in Section 8.2.4, 45.8 % of the ammonia content in the substrate is released into air when
applying the digestates on agricultural fields. New biogas plants in Switzerland often use trail hoses
for spreading liquid digested matter, which reduces the ammonia emissions about 40 % according to
Edelmann (2006). We assume in the application datasets that such trail hoses are used. Hence, the
ammonia emissions per kg digested matter are calculated with the following procedure: First, the share
of NH4 available nitrogen in the dry matter content is multiplied with the dry matter content of the
substrate input per m3 biogas and the amount of nitrogen is converted into ammonia with the molecu-
lar weight of the two substances. This amount of ammonia is multiplied with the emission factor of
45.8 % (see Section 8.2.4). The resulting figure is divided by the amount of digested matter per m3 bi-
ogas and the 40 % emission reduction due to the use of trail hoses is applied. The nitrogen and ammo-
nium content of the substrates is presented in Tab. 9.1.
Tab. 9.1 Nitrogen and ammonium content in substrates
Nitrogen content
according to the Institut für Ener-
getik und Umwelt (2006)
NH4-content
according to according the Institut
für Energetik und Umwelt (2006)
and own estimations
% TS % TS
Maize silage 1.1-2 0.15-0.3
Sugar beets 2.6 0.2
Beet residues 0.2-0.4 0.04
Molasses 1.5 0.17
No dinitrogen monoxide emissions arise from the application of digestates, when using trail hoses
(Jungbluth et al. 2010).
9.2 Heavy metals
When digested matter is applied as fertiliser on agricultural land, the heavy metal content of the biogas
substrates is emitted into the soil. The heavy metal content of the substrates is displayed in Tab. 9.2 to
Tab. 9.4.
In general, the heavy metal emissions from the digestates are calculated from the elemental composi-
tion of the substrates reported by the Institut für Energetik und Umwelt (2006). Missing data are com-
pleted with information from Freiermuth-Knuchel (2006).

60/84
It is considered that digestate matter from fodder beets has the same heavy metal content as digestate
matter from sugar beets. The mercury content in beet residues is considered to be equal as in sugar
beets.
Data of the heavy metal content of glycerine are not available, but it can be assumed that these values
are low. The metal content in grease from a fat separator which amount to 44 mg copper and 290 mg
zinc per kg grease according to the Institut für Energetik und Umwelt (2006) is considered for the cal-
culation of heavy metal emissions during the application of glycerine digestates.
Tab. 9.2 Heavy metal content in silage maize
Institut für Ener-
getik und Umwelt
(2006)
Freiermuth-
Knuchel (2006) This study
mg/kg DM mg/kg DM mg/kg DM
Cd 0.2 0.1 0.1
Cr 0.5 0.7 0.7
Cu 4.8 5.0 5.0
Ni 5.0 0.5 0.5
Pb 2.0 1.6 1.6
Zn 45.5 34.5 34.5
Mn 31.0 - 31.0
Fe 67.0 - 67.0
Hg - 0.01 0.01
Tab. 9.3 Heavy metal content in beet residues and sugar beets
Beet residues Sugar Beets
Institut für Ener-
getik und Umwelt
(2006)
Freiermuth-
Knuchel (2006)
mg/kg DM mg/kg DM
Cd 0.2 0.4
Cr 1.0 1.8
Cu 10.0 12.0
Ni 5.0 1.1
Pb 0.5 1.2
Zn 28.0 36.4
Mn - -
Fe - -
Hg - 0.10

61/84
Tab. 9.4 Heavy metal content in molasses
Institut für Ener-
getik und Umwelt
(2006)
mg/kg FM
Cd 0.12
Cr 0.20
Cu 2.69
Ni 2.99
Pb -
Zn 32.00
Mn 29.60
Fe 32.30
Hg 0.01
Sn 0.18
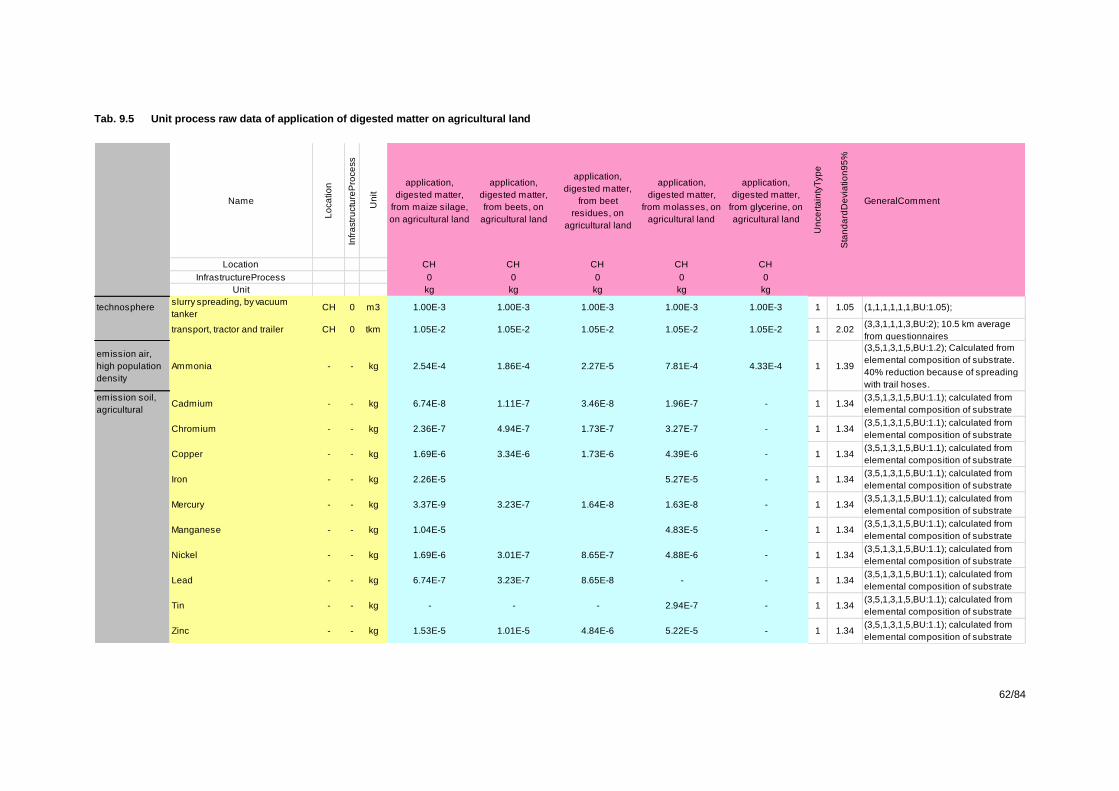
62/84
Tab. 9.5 Unit process raw data of application of digested matter on agricultural land
Name
Lo
ca
tio
n
Infr
astr
uctu
reP
roce
ss
Un
it
application,
digested matter,
from maize silage,
on agricultural land
application,
digested matter,
from beets, on
agricultural land
application,
digested matter,
from beet
residues, on
agricultural land
application,
digested matter,
from molasses, on
agricultural land
application,
digested matter,
from glycerine, on
agricultural land
Un
ce
rta
inty
Typ
e
Sta
nd
ard
De
via
tio
n9
5%
GeneralComment
Location CH CH CH CH CH
InfrastructureProcess 0 0 0 0 0
Unit kg kg kg kg kg
technosphereslurry spreading, by vacuum
tankerCH 0 m3 1.00E-3 1.00E-3 1.00E-3 1.00E-3 1.00E-3 1 1.05 (1,1,1,1,1,1,BU:1.05);
transport, tractor and trailer CH 0 tkm 1.05E-2 1.05E-2 1.05E-2 1.05E-2 1.05E-2 1 2.02(3,3,1,1,1,3,BU:2); 10.5 km average
from questionnaires
emission air,
high population
density
Ammonia - - kg 2.54E-4 1.86E-4 2.27E-5 7.81E-4 4.33E-4 1 1.39
(3,5,1,3,1,5,BU:1.2); Calculated from
elemental composition of substrate.
40% reduction because of spreading
with trail hoses.
emission soil,
agriculturalCadmium - - kg 6.74E-8 1.11E-7 3.46E-8 1.96E-7 - 1 1.34
(3,5,1,3,1,5,BU:1.1); calculated from
elemental composition of substrate
Chromium - - kg 2.36E-7 4.94E-7 1.73E-7 3.27E-7 - 1 1.34(3,5,1,3,1,5,BU:1.1); calculated from
elemental composition of substrate
Copper - - kg 1.69E-6 3.34E-6 1.73E-6 4.39E-6 - 1 1.34(3,5,1,3,1,5,BU:1.1); calculated from
elemental composition of substrate
Iron - - kg 2.26E-5 5.27E-5 - 1 1.34(3,5,1,3,1,5,BU:1.1); calculated from
elemental composition of substrate
Mercury - - kg 3.37E-9 3.23E-7 1.64E-8 1.63E-8 - 1 1.34(3,5,1,3,1,5,BU:1.1); calculated from
elemental composition of substrate
Manganese - - kg 1.04E-5 4.83E-5 - 1 1.34(3,5,1,3,1,5,BU:1.1); calculated from
elemental composition of substrate
Nickel - - kg 1.69E-6 3.01E-7 8.65E-7 4.88E-6 - 1 1.34(3,5,1,3,1,5,BU:1.1); calculated from
elemental composition of substrate
Lead - - kg 6.74E-7 3.23E-7 8.65E-8 - - 1 1.34(3,5,1,3,1,5,BU:1.1); calculated from
elemental composition of substrate
Tin - - kg - - - 2.94E-7 - 1 1.34(3,5,1,3,1,5,BU:1.1); calculated from
elemental composition of substrate
Zinc - - kg 1.53E-5 1.01E-5 4.84E-6 5.22E-5 - 1 1.34(3,5,1,3,1,5,BU:1.1); calculated from
elemental composition of substrate

63/84
10 Appendix C: LCI of cogeneration of electricity and heat
In most agricultural biogas plants, biogas is burned in order to co-generate electricity and heat. The
heat consumption in the biogas plants is usually met with the own heat generation whereas the elec-
tricity consumption is only partly met with own produced electricity and additional electricity from
grid needs to be bought.
10.1 Emissions from combustion of biogas in agricultural co-generation units
Some older cogeneration units use pilot fuel, which leads to higher emission values. Newer types
however use lean-burn engines with a SCR catalyst, which reduces the emissions considerably. Emis-
sion data for cogeneration unit of these newer technologies were updated and documented in
Jungbluth et al. (2010). For the update of the ecoinvent data on biogas combustion, these values are
applied.
In previous inventories, the emission of biogas is mainly estimated based on data of natural gas fur-
naces. However, newer publications show that in biogas plants partly much higher emissions occur
(Bayer. Landesamt für Umwelt (Hrsg.) 2006:62ff, Nielsen & Illerup 2003:33ff, Kath 2009:3). There-
fore, these emission factors are applied in this study.
The Swiss Clean Air Act13
regulates the exhaust emissions of biogas cogeneration units with limits of
50 mg particulate matter per Nm3, 400 mg/Nm
3 of NOx and 650 mg/Nm
3 of CO (related to 5 % residu-
al oxygen). The amount of nitrous oxides fluctuates considerably depending on the biogas quality (me-
thane content). A typical 100 kWel cogeneration unit with ignition engine emits about 1’100 mg/Nm3
NOx and 800 mg/Nm3 CO (Ruch 2005).
In a research project a catalyst with SCR basis was developed which balances all fluctuations in the
exhaust emissions from cogeneration units in biogas plants. This catalyst enables operators of cogen-
eration units to smoothly comply with the limits of the Clean Air Act (Ruch 2005).
In contrast to cogeneration units with very high emission factors, there are also cogeneration units
available with much lower emissions which even fall below the limits in the canton Zurich of 50 mg
NOx/Nm3 and 150 mg CO/Nm
3.
Currently, no cogeneration units with catalysts are known in Switzerland. Normally, lean burn engines
are used, which comply with the Clean Air Act limit of 400 mg/Nm3. Considerably higher can be the
emissions from ignition gas engines which are typically used in Germany and in which 5 to 10 % of
diesel is co-burnt. With these engines it is difficult to comply with the Swiss limits (median of meas-
urements at 450 mg/Nm3). Therefore such ignition gas engines are a phased-out model. As far as it is
known to the authors, since the last few years only lean burn engines were installed in Switzerland.
Gas motors like all type of furnaces have to be checked regularly with regard to compliance with the
exhaust emission limits in the Clean Air Act. (Jungbluth et al. 2010)
Within the survey about Swiss operators of biogas plants that was conducted in this project, 87.5 % of
the operators declared that they installed biogas engines in their biogas plants. Only two operators use
ignition engines, one with diesel and one with biodiesel. The operators declare their nitrous oxide
emissions as between 300 and 900 mg/Nm3 with an average at 470 mg/Nm3 which is considerably
higher than the 15 mg/Nm3 estimated by Jungbluth et al. (2007) based on natural gas furnaces. The
13 Luftreinhalteverordnung (LRV)

64/84
average nitrous oxide emissions from the survey are used for the dataset of the combustion of biogas
in a biogas engine.

65/84
Tab. 10.1 Unit process raw data of combustion of biogas and pilot oil excluding infrastructure
Name
Lo
ca
tio
n
Infr
astr
uctu
reP
ro
Un
it
operation,
biogas
combustion,
in cogen
with biogas
engine
operation,
biogas
combustion,
in cogen
with ignition
gas engine
operation,
biogas
combustion,
in cogen
200kWe
lean burn
operation,
biogas
combustion,
in micro gas
turbine
100kWe
operation,
oil
combustion,
in cogen
with ignition
gas engine
Biogasdr
evne
motorer
General
ignition
gas
engine
ignition
gas
engine
gas
cogenera
tion
biogas
engineLRV General
ignition
gas
engine
ignition
gas
engine
gas
cogener
ation
biogas
engineLRV
Location CH CH CH CH CH 2003 2009 2006 2005 2006 2010 2009 2006 2005 2006 2010
InfrastructureProcess 0 0 0 0 0 Nielsen Kath BaxLfU Ruch BaxLfU16
operatorsCH
Kath BaxLfU Ruch BaxLfU 16
operators
CH
Unit MJ MJ MJ MJ MJ kg/MJ kg/MJ kg/MJ kg/MJ kg/MJ kg/MJ kg/MJ mg/m3 mg/m3 mg/Nm3 mg/m3 mg/m3 mg/Nm3
product operation, biogas combustion, in cogen with biogas CH 0 MJ 1 0 0 0 0
operation, biogas combustion, in cogen with ignition gas CH 0 MJ 0 1 0 0 0
operation, biogas combustion, in cogen 200kWe lean CH 0 MJ 0 0 1 0 0
operation, biogas combustion, in micro gas turbine CH 0 MJ 0 0 0 1 0
operation, oil combustion, in cogen with ignition gas CH 0 MJ 0 0 0 0 1
lubricating oil, at plant RER 0 kg 3.00E-5 3.00E-5 3.00E-5 5.00E-7 0
disposal, used mineral oil, 10% water, to hazardous
waste incinerationCH 0 kg 3.00E-5 3.00E-5 3.00E-5 5.50E-7 0
emission air, low
population densityCarbon monoxide, biogenic kg 3.05E-4 2.82E-4 3.05E-4 2.80E-5 0 2.73E-04 3.11E-04 4.61E-04 2.82E-04 1.97E-04 2.30E-04 882 1305 800 558 650
Carbon dioxide, biogenic kg 0.0809 8.09E-2 8.09E-2 8.09E-2 0
Methane, biogenic kg 1.02E-4 1.98E-4 3.43E-4 5.40E-6 0 3.23E-04 3.63E-04 1.98E-04 0.00E+00 1.02E-04 1028 560 290
NMVOC, non-methane volatile organic compounds,
unspecified originkg 1.40E-5 1.40E-5 1.40E-5 6.00E-7 2.63E-6 1.40E-05
Dinitrogen monoxide kg 5.00E-7 5.00E-7 5.00E-7 1.00E-6 5.00E-6 5.00E-07
Sulfur dioxide kg 2.10E-5 2.10E-5 2.10E-5 2.10E-5 1.20E-4 1.90E-05 5.83E-05 165
Platinum kg 7.00E-12 0 0 0 0
Heat, waste MJ 1.00E+0 1.00E+0 1.00E+0 1.00E+0 1.00E+0
Carbon monoxide, fossil kg 0 0 0 0 1.26E-4
Carbon dioxide, fossil kg 0 0 0 0 7.41E-2
Methane, fossil kg 0 0 0 0 2.63E-6
Formaldehyde - - kg 8.12E-7 3.11E-6 1.31E-6 1.31E-6 0 2.12E-05 3.28E-05 3.11E-06 0.00E+00 8.12E-07 93 8.8 2.3
Particulates, < 2.5 um - - kg 2.06E-7 2.06E-7 2.06E-7 2.06E-7 1.50E-7 2.06E-07 0.00E+00 0.00E+00 0.00E+00 0.00E+00
Particulates, > 2.5 um, and < 10um - - kg 4.51E-7 4.51E-7 4.51E-7 4.51E-7 4.51E-7 4.51E-07
Particulates, > 10 um - - kg 1.97E-6 1.97E-6 1.97E-6 1.97E-6 1.97E-6 1.97E-06 1.77E-05 50
Acenaphthene - - kg 3.34E-9 3.34E-9 3.34E-9 3.34E-9 3.34E-9 3.34E-09
Benzo(a)pyrene - - kg 1.00E-12 1.00E-12 1.00E-12 1.00E-12 1.00E-12 1.00E-12
Acetaldehyde - - kg 1.10E-7 1.10E-7 1.10E-7 1.10E-7 1.10E-7 1.10E-07
Acrolein - - kg 1.00E-8 1.00E-8 1.00E-8 1.00E-8 1.00E-8 1.00E-08
Propanal - - kg 2.00E-8 2.00E-8 2.00E-8 2.00E-8 2.00E-8 2.00E-08
Acetone - - kg 2.00E-8 2.00E-8 2.00E-8 2.00E-8 2.00E-8 2.00E-08
Butanol - - kg 1.00E-8 1.00E-8 1.00E-8 1.00E-8 1.00E-8 1.00E-08
Benzaldehyde - - kg 2.00E-8 2.00E-8 2.00E-8 2.00E-8 2.00E-8 2.00E-08
Nitrogen oxides kg 1.66E-4 4.26E-4 1.41E-4 3.20E-5 5.78E-5 5.40E-04 2.55E-04 4.64E-04 3.88E-04 6.29E-04 1.66E-04 1.41E-04 723 1313 1100 1781 470 400

66/84
10.2 Cogeneration of electricity and heat
The range of capacities and the efficiency of the cogeneration units with biogas engines considered in
the survey within this project is displayed and compared to the data used in Jungbluth et al. (2007) in
Tab. 10.2. The average electric and thermal efficiency from the survey is considered in order to estab-
lish datasets of the cogeneration of electricity and heat with biogas from specific substrates.
Tab. 10.2 Selected results of the survey of 16 Swiss operators compared to the data implemented by Jungbluth et al.
(2007)
Survey of 16 Swiss biogas operators (2010)
minimum maximum average
Jungbluth et al.
(2007)
capacity kW 15 250 118.6 160
electric efficiency % 25% 39% 35.4% 32%
thermal efficiency % 45% 64% 51.0% 55%
nitrous oxide emissions mg/Nm3 300 900 470.0 15
The inventory of the cogeneration of heat and electricity encompasses the infrastructure, the operation
of the engine (including auxiliary materials and emissions into air), and the specific type of used bio-
gas. In Tab. 10.3 the example of cogeneration of heat and electricity with biogas from maize silage is
presented. Furthermore, five analogue unit process datasets of cogeneration with biogas from sugar
beet, fodder beet, beet residues, molasses, and glycerine are established.
The allocation of the emissions and the shared infrastructure elements to the two products heat and
electricity is based on exergy content. The exergy value of electricity is 1 and the exergy value of heat
is 0.17. The multiplication of the exergy value with the heat and electricity outputs per MJ biogas in-
put leads to an allocation of 80 % to the electricity generation and 20 % to the heat generation.
Tab. 10.3 Unit process raw data of the cogeneration of heat and electricity from biogas (example of biogas from
maize silage)
Name
Lo
ca
tio
n
Infr
astr
uctu
reP
roce
ss
Un
it
biogas, from
maize silage,
burned in cogen
Un
ce
rta
inty
Typ
e
Sta
nd
ard
De
via
tio
n
95
%
GeneralComment
heat, biogas
from maize
silage, at
cogen
electricity,
biogas from
maize silage,
at cogen
Location CH CH CH
InfrastructureProcess 0 0 0
Unit MJ MJ kWh
allocatedheat, biogas from maize silage, at
cogenCH 0 MJ 5.10E-1 100 0
productselectricity, biogas from maize silage, at
cogenCH 0 kWh 9.83E-2 0 100
technospherebiogas, from maize silage, co-digestion,
at storageCH 0 Nm3 4.40E-2 1 1.33
(1,4,2,1,3,4); Jungbluth et
al. (2007)20% 80%
operation, biogas combustion, in cogen
with biogas engineCH 0 MJ 1.00E+0 1 3.34
(1,1,1,1,1,1); emissions &
infrastructure20% 80%
cogen unit 160kWe, components for
heat onlyRER 1 unit 5.00E-9 1 1.65
(1,4,2,1,3,4); Jungbluth et
al. (2007)100% 0%
cogen unit 160kWe, components for
electricity onlyRER 1 unit 5.00E-9 1 1.65
(1,4,2,1,4,4); Jungbluth et
al. (2007)0% 100%
cogen unit 160kWe, common
components for heat+electricityRER 1 unit 5.00E-9 1 1.65
(1,4,2,1,3,4); Jungbluth et
al. (2007)20% 80%

67/84
11 Appendix D: LCI of a grass refinery Authors: Marianne Leuenberger, Matthias Stucki, ESU-services GmbH, Uster
Validation: Niels Jungbluth, ESU-services GmbH, Uster
Last changes: 2010
11.1 Introduction
The grass refinery of the Biowert Industrie GmbH. produces insulation material (AgriCell), organic
fertiliser (AgriFer) and biopolymers (AgriPlast) from grass silage as raw material. The grass silage is
stored in a silo and later fed in a disintegration process. After the disintegration process, the grass fi-
bres are used for AgriCell and AgriPlast production. Grass slurry is a by-product of the grass disinte-
gration. Together with cow slurry it is used as a substrate in the biogas production. The biogas is
burned in a cogeneration unit, which generates heat and electricity used for the different production
processes or could be sold as grid electricity. In order to utilize digestate from the anaerobic digestion,
the organic matter content is concentrated in a reversed osmosis. The products of this process can be
used as organic fertilizers (AgriFer) on the grass fields. A part of the remaining process water is recy-
cled in the grass disintegration process and the remaining is introduced in nearby surface waters. This
LCI investigates the resources needed to produce these products from grass at the grass refinery.
The production process as described above creates two options for closed loop resource management.
Firstly, the electricity produced in the cogeneration unit could be used meet the electricity demand of
the production process. Secondly, the fertiliser AgriFer can be used in the grass cultivation.
This Chapter is based on an LCA study of the Biowert grass refinery prepared by Leuenberger &
Jungbluth (2010).
11.2 Resources
The main resource for the products at the grass refinery is the grass cultivated in the region. Farmers
cut and store the grass for the grass refinery in silos. The concept of Biowert Industrie GmbH includes
that the digestate from the anaerobic digestion is brought back to the grass fields, where it is applied as
organic fertiliser. In order to represent this closed loop resource management in the LCI of the prod-
ucts, the grass cultivation is evaluated in two scenarios, one including the use of AgriFer, one basing
on the use of mineral fertiliser only. The electricity and heat produced in the cogeneration unit can be
assumed as input in the production process.
11.3 Characterisation and use of products
11.3.1 AgriCell
AgriCells consists of grass fibres, which are treated with borax and boric acid. The product can be
used as insulation material in buildings, similar to the use of cellulose fibres from recycling paper. It
replaces the use of synthetically produced insulation materials such as rock or mineral wool.
11.3.2 AgriPlast
Grass fibres are mixed with polypropylene or other thermoplasts in order to enhance the stability of
the pure thermoplast and reduce the material need for polypropylene granulate.
AgriPlast can be compared to other natural fibre reinforced thermoplasts or to polypropylene products.
11.3.3 AgriFer
The grass slurry is digested in a biogas plant together with other substrates, mainly biowastes and cow
slurry. The remaining digestate can be used as fertilizer on the grass field, which would close the nu-
trient cycle on a local basis.

68/84
11.3.4 Heat and Electricity
The cogeneration unit produces heat and electricity from the biogas. The heat is used for the different
process steps; the electricity is either fed into the supply grid or used in the production processes.
11.4 Life cycle inventories
11.4.1 Grass cultivation in Germany
The grass silage is produced from locally grown rye grass. In order to represent the actual cultivation
strategy of local farmers, the grass cultivation is modelled specifically for the case of the Biowert
grass refinery.
Only one farmer provided data for the life cycle inventory of grass cultivation. Some information was
therefore completed by adding information from Biowert and other sources in order to obtain repre-
sentative data basis for a standard scenario. As a future scenario, the application of AgriFer fertiliser is
investigated as a strategy to close the nutrient cycle. Both scenarios base on the same assumption and
data for grass cultivation, only the fertiliser use is changed from mineral fertiliser to AgriFer in the ad-
ditional scenario.
The annual grass yield per hectare is 67 tons fresh matter or 20 tons dry matter. Thus, the dry matter
content is 30%. Usually, the grass is grown in rotation with sugar beet and wheat. In this case, cultiva-
tion period for grass is two years. Within this cultivation period, the grass is cut four times (twice a
year), without additional ploughing or sowing. The soil type is characterised by weathered loess-loam.
After the cut, the grass is transported to a silo, where it is stored for silage production. Some silos are
situated in the vicinity (3 km) of the Biowert plant (60%); further amounts of grass (40%) are stored
directly in the silo at the Biowert plant site. The average transport distance with a tractor from the field
to the silo is set to 8.25 km.
The soil is prepared for sowing by ploughing and harrowing once in the two years of the cultivation
period. Fertiliser use is limited to NPK mineral fertilisers, no pesticides are applied. For the scenario
of AgriFer application, the nutrient input is partly substituted by the use of liquid and solid AgriFer.
The official analysis of the digestate (Bundesgütegemeinschaft Kompost E.V. 2008) recommends the
annual use of 7 tons AgriFer solid and 17 m3 AgriFer liquid per hectare. Applying these amounts, the
need for AgriFer solid would exceed the produced amount. Therefore, the use of AgriFer solid is set
3.7 tons per hectare, which is the amount that can be met by the annual AgriFer solid production. To-
gether with the 17 m3 AgriFer liquid an overall amount of 239 kg N per hectare is applied.
The emissions into soil, water and air arising from agricultural activities have a considerable influence
on the environmental impact of a crop. These are mainly influenced by the use of fertiliser and pesti-
cide. In the case of grass cultivation, the nitrate leaching to groundwater and the ammonia emissions
are key factors. Basically, emissions are quantified using different models, which use the fertiliser or
pesticide input and soil properties as parameters. The modelling of both scenarios is based on the
models used for ecoinvent life cycle inventories (Nemecek et al. 2007).

69/84
Tab. 11.1: Input parameter for the modelling of grass cultivation. Data per hectare of cultivation and year (2007)
Process, Input Unit Standard
with
AgriFer
use
ha ha
Lorry tkm 56 16100 km for mineral fertiliser, 10km
for AgriFer from Biowert to field
Fodder loader tkm 553 553
1.5-15km to silo. Tractor used for
ploughing, harrowing and fertiliser
application.
Barge tkm 28 850km, standard distances for
transport of feriliser
Ploughin ha 0.5 0.5Soil preparation once per two years
of grass cultivation
Harrowing ha 0.5 0.5Soil preparation once per two years
of grass cultivation
Rolling ha 0 0
Sowing ha 0.5 0.5Sowing once preparation per two
years of grass cultivation
Chiselling ha 0 0
Fertiliser/pesticide application ha 2 2Fertiliser application four times in
two years
Mowing ha 2 2 Mowing four times in two years
Loading fodder loader m3 558 558Calculated according to ecoinvent:
120kg/m3
N-fertilizer, tot kg 210 239 Calculated from N-input
P2O5-fertilizer, tot kg 100 100 Calculated from P2O5-input
K2O-fertilizer, min kg 250 215 Calculated from K2O-input
Manganese kg 0 0 n.a.
Lime kg 0 0 n.a.
Solid manure kg 0 3714 AgriFer solid, max. possible input
Slurry and liquid manure m3 0 17 AgriFer liquid, recommended input
Yield (dm) kg DS/ha 20000 20000 Biowert Questionnaire
Amount of harvests - 2 2 Biowert Questionnaire
Duration of plantation a 2 2 Biowert Questionnaire
Seeds spread kg 45 45 Biowert Questionnaire
Number of pesticide applications - 0 0 Biowert Questionnaire
Pesticides kg 0.00 0.00 Calculation
Water content crop % 70.0% 70.0% Biowert Questionnaire
NO3-N emission factor % 27.5% 27.5%Modelled according to ecoinvent
(Nemecek et al., 2007)
N2O-N emission factor % 2.0% 2.0%Modelled according to ecoinvent
(Nemecek et al., 2007)
NH3-N emission factor % 4.5% 17.4%Modelled according to ecoinvent
(Nemecek et al., 2007)
Total mineral fertiliser kg/ha 560 155Sum of all fertilisers (in kg mineral,
not total weight), data sheet Biowert
N-total, Mineral kg 210 0 Biowert Questionnaire
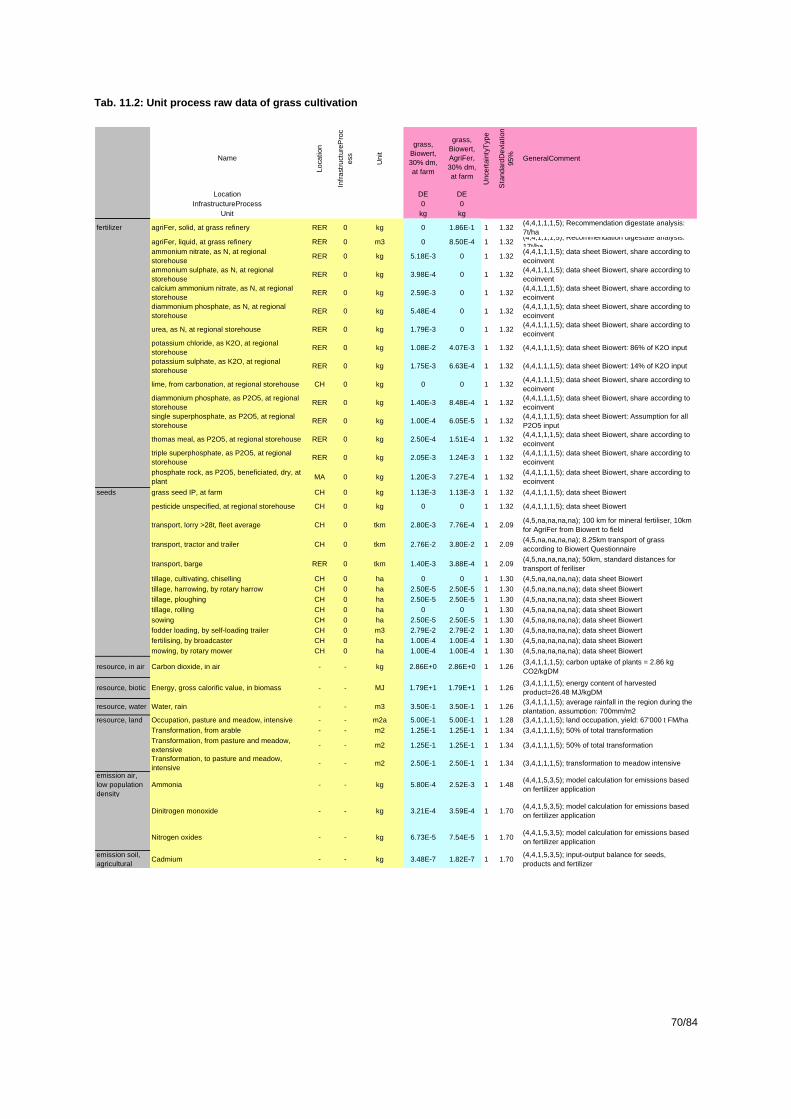
70/84
Tab. 11.2: Unit process raw data of grass cultivation
Name
Lo
cati
on
Infr
ast
ruct
ure
Pro
c
ess
Un
it
grass,
Biowert,
30% dm,
at farm
grass,
Biowert,
AgriFer,
30% dm,
at farm
Un
cert
ain
tyT
ype
Sta
nd
ard
De
viatio
n
95
% GeneralComment
Location DE DE
InfrastructureProcess 0 0
Unit kg kg
fertilizer agriFer, solid, at grass refinery RER 0 kg 0 1.86E-1 1 1.32(4,4,1,1,1,5); Recommendation digestate analysis:
7t/ha
agriFer, liquid, at grass refinery RER 0 m3 0 8.50E-4 1 1.32(4,4,1,1,1,5); Recommendation digestate analysis:
17t/haammonium nitrate, as N, at regional
storehouseRER 0 kg 5.18E-3 0 1 1.32
(4,4,1,1,1,5); data sheet Biowert, share according to
ecoinvent
ammonium sulphate, as N, at regional
storehouseRER 0 kg 3.98E-4 0 1 1.32
(4,4,1,1,1,5); data sheet Biowert, share according to
ecoinvent
calcium ammonium nitrate, as N, at regional
storehouseRER 0 kg 2.59E-3 0 1 1.32
(4,4,1,1,1,5); data sheet Biowert, share according to
ecoinvent
diammonium phosphate, as N, at regional
storehouseRER 0 kg 5.48E-4 0 1 1.32
(4,4,1,1,1,5); data sheet Biowert, share according to
ecoinvent
urea, as N, at regional storehouse RER 0 kg 1.79E-3 0 1 1.32(4,4,1,1,1,5); data sheet Biowert, share according to
ecoinvent
potassium chloride, as K2O, at regional
storehouseRER 0 kg 1.08E-2 4.07E-3 1 1.32 (4,4,1,1,1,5); data sheet Biowert: 86% of K2O input
potassium sulphate, as K2O, at regional
storehouseRER 0 kg 1.75E-3 6.63E-4 1 1.32 (4,4,1,1,1,5); data sheet Biowert: 14% of K2O input
lime, from carbonation, at regional storehouse CH 0 kg 0 0 1 1.32(4,4,1,1,1,5); data sheet Biowert, share according to
ecoinvent
diammonium phosphate, as P2O5, at regional
storehouseRER 0 kg 1.40E-3 8.48E-4 1 1.32
(4,4,1,1,1,5); data sheet Biowert, share according to
ecoinvent
single superphosphate, as P2O5, at regional
storehouseRER 0 kg 1.00E-4 6.05E-5 1 1.32
(4,4,1,1,1,5); data sheet Biowert: Assumption for all
P2O5 input
thomas meal, as P2O5, at regional storehouse RER 0 kg 2.50E-4 1.51E-4 1 1.32(4,4,1,1,1,5); data sheet Biowert, share according to
ecoinvent
triple superphosphate, as P2O5, at regional
storehouseRER 0 kg 2.05E-3 1.24E-3 1 1.32
(4,4,1,1,1,5); data sheet Biowert, share according to
ecoinvent
phosphate rock, as P2O5, beneficiated, dry, at
plantMA 0 kg 1.20E-3 7.27E-4 1 1.32
(4,4,1,1,1,5); data sheet Biowert, share according to
ecoinvent
seeds grass seed IP, at farm CH 0 kg 1.13E-3 1.13E-3 1 1.32 (4,4,1,1,1,5); data sheet Biowert
pesticide unspecified, at regional storehouse CH 0 kg 0 0 1 1.32 (4,4,1,1,1,5); data sheet Biowert
transport, lorry >28t, fleet average CH 0 tkm 2.80E-3 7.76E-4 1 2.09(4,5,na,na,na,na); 100 km for mineral fertiliser, 10km
for AgriFer from Biowert to field
transport, tractor and trailer CH 0 tkm 2.76E-2 3.80E-2 1 2.09(4,5,na,na,na,na); 8.25km transport of grass
according to Biowert Questionnaire
transport, barge RER 0 tkm 1.40E-3 3.88E-4 1 2.09(4,5,na,na,na,na); 50km, standard distances for
transport of feriliser
tillage, cultivating, chiselling CH 0 ha 0 0 1 1.30 (4,5,na,na,na,na); data sheet Biowert
tillage, harrowing, by rotary harrow CH 0 ha 2.50E-5 2.50E-5 1 1.30 (4,5,na,na,na,na); data sheet Biowert
tillage, ploughing CH 0 ha 2.50E-5 2.50E-5 1 1.30 (4,5,na,na,na,na); data sheet Biowert
tillage, rolling CH 0 ha 0 0 1 1.30 (4,5,na,na,na,na); data sheet Biowert
sowing CH 0 ha 2.50E-5 2.50E-5 1 1.30 (4,5,na,na,na,na); data sheet Biowert
fodder loading, by self-loading trailer CH 0 m3 2.79E-2 2.79E-2 1 1.30 (4,5,na,na,na,na); data sheet Biowert
fertilising, by broadcaster CH 0 ha 1.00E-4 1.00E-4 1 1.30 (4,5,na,na,na,na); data sheet Biowert
mowing, by rotary mower CH 0 ha 1.00E-4 1.00E-4 1 1.30 (4,5,na,na,na,na); data sheet Biowert
resource, in air Carbon dioxide, in air - - kg 2.86E+0 2.86E+0 1 1.26(3,4,1,1,1,5); carbon uptake of plants = 2.86 kg
CO2/kgDM
resource, biotic Energy, gross calorific value, in biomass - - MJ 1.79E+1 1.79E+1 1 1.26(3,4,1,1,1,5); energy content of harvested
product=26.48 MJ/kgDM
resource, water Water, rain - - m3 3.50E-1 3.50E-1 1 1.26(3,4,1,1,1,5); average rainfall in the region during the
plantation, assumption: 700mm/m2
resource, land Occupation, pasture and meadow, intensive - - m2a 5.00E-1 5.00E-1 1 1.28 (3,4,1,1,1,5); land occupation, yield: 67'000 t FM/ha
Transformation, from arable - - m2 1.25E-1 1.25E-1 1 1.34 (3,4,1,1,1,5); 50% of total transformation
Transformation, from pasture and meadow,
extensive- - m2 1.25E-1 1.25E-1 1 1.34 (3,4,1,1,1,5); 50% of total transformation
Transformation, to pasture and meadow,
intensive- - m2 2.50E-1 2.50E-1 1 1.34 (3,4,1,1,1,5); transformation to meadow intensive
emission air,
low population
density
Ammonia - - kg 5.80E-4 2.52E-3 1 1.48(4,4,1,5,3,5); model calculation for emissions based
on fertilizer application
Dinitrogen monoxide - - kg 3.21E-4 3.59E-4 1 1.70(4,4,1,5,3,5); model calculation for emissions based
on fertilizer application
Nitrogen oxides - - kg 6.73E-5 7.54E-5 1 1.70(4,4,1,5,3,5); model calculation for emissions based
on fertilizer application
emission soil,
agriculturalCadmium - - kg 3.48E-7 1.82E-7 1 1.70
(4,4,1,5,3,5); input-output balance for seeds,
products and fertilizer
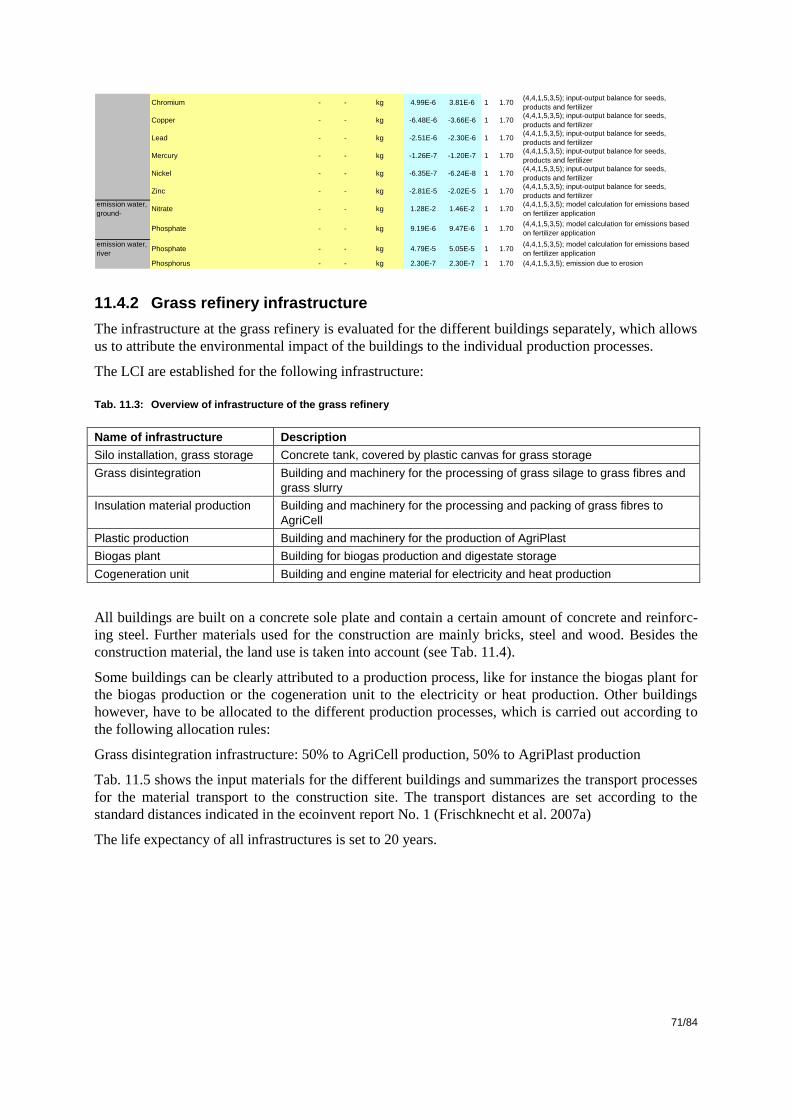
71/84
11.4.2 Grass refinery infrastructure
The infrastructure at the grass refinery is evaluated for the different buildings separately, which allows
us to attribute the environmental impact of the buildings to the individual production processes.
The LCI are established for the following infrastructure:
Tab. 11.3: Overview of infrastructure of the grass refinery
Name of infrastructure Description
Silo installation, grass storage Concrete tank, covered by plastic canvas for grass storage
Grass disintegration Building and machinery for the processing of grass silage to grass fibres and
grass slurry
Insulation material production Building and machinery for the processing and packing of grass fibres to
AgriCell
Plastic production Building and machinery for the production of AgriPlast
Biogas plant Building for biogas production and digestate storage
Cogeneration unit Building and engine material for electricity and heat production
All buildings are built on a concrete sole plate and contain a certain amount of concrete and reinforc-
ing steel. Further materials used for the construction are mainly bricks, steel and wood. Besides the
construction material, the land use is taken into account (see Tab. 11.4).
Some buildings can be clearly attributed to a production process, like for instance the biogas plant for
the biogas production or the cogeneration unit to the electricity or heat production. Other buildings
however, have to be allocated to the different production processes, which is carried out according to
the following allocation rules:
Grass disintegration infrastructure: 50% to AgriCell production, 50% to AgriPlast production
Tab. 11.5 shows the input materials for the different buildings and summarizes the transport processes
for the material transport to the construction site. The transport distances are set according to the
standard distances indicated in the ecoinvent report No. 1 (Frischknecht et al. 2007a)
The life expectancy of all infrastructures is set to 20 years.
Chromium - - kg 4.99E-6 3.81E-6 1 1.70(4,4,1,5,3,5); input-output balance for seeds,
products and fertilizer
Copper - - kg -6.48E-6 -3.66E-6 1 1.70(4,4,1,5,3,5); input-output balance for seeds,
products and fertilizer
Lead - - kg -2.51E-6 -2.30E-6 1 1.70(4,4,1,5,3,5); input-output balance for seeds,
products and fertilizer
Mercury - - kg -1.26E-7 -1.20E-7 1 1.70(4,4,1,5,3,5); input-output balance for seeds,
products and fertilizer
Nickel - - kg -6.35E-7 -6.24E-8 1 1.70(4,4,1,5,3,5); input-output balance for seeds,
products and fertilizer
Zinc - - kg -2.81E-5 -2.02E-5 1 1.70(4,4,1,5,3,5); input-output balance for seeds,
products and fertilizer
emission water,
ground-Nitrate - - kg 1.28E-2 1.46E-2 1 1.70
(4,4,1,5,3,5); model calculation for emissions based
on fertilizer application
Phosphate - - kg 9.19E-6 9.47E-6 1 1.70(4,4,1,5,3,5); model calculation for emissions based
on fertilizer application
emission water,
riverPhosphate - - kg 4.79E-5 5.05E-5 1 1.70
(4,4,1,5,3,5); model calculation for emissions based
on fertilizer application
Phosphorus - - kg 2.30E-7 2.30E-7 1 1.70 (4,4,1,5,3,5); emission due to erosion

72/84
Tab. 11.4 Raw materials in buildings and infrastructure of the grass refinery
Tab. 11.5 Unit process raw data of the grass refinery infrastructure data sets
train lorry silo installationgrass
disintegration
insulation
material
production
plastic
productionbiogas plant
cogeneration
unitSource
Unit km km
Emaillierte Fläche m2 1671 39.6to à 7900kg/m
3, 2x0.33mm
steel, low-alloyed kg 200 100 26000 300 800 30000 15000Questionnaire Biowert; partly
based on assumption
stainless steel kg 200 100 27000 5000 21000 2000Questionnaire Biowert; partly
based on assumption
steel sheet kg 8887.5 5332.5 17775
Questionnaire Biowert; partly
based on assumption, 0.75mm,
density: 7900 kg/m3
concrete kg - 50 1000000 660000 30000 2240000 290000
Estimation Biowert: 1000t,
ecoinvent: 0.91vol% in reinforced
steel, density:
http://www.crtib.lu/Leitfaden/conten
t/DE/116/C528/
bricks kg 50 10000 10000 40000 20000Questionnaire Biowert; partly
based on assumption
wood - 100 1000Questionnaire Biowert; partly
based on assumption
copper 200 100 400Questionnaire Biowert; partly
based on assumption
control cabinet unit 200 100 3.50 1.56 1.56 19.45 3.11
Entire equipment allocated to
different infrastructure. AF: Share
of built area
cables m 200 100 60 26.67 26.67 333.33 53.33
75t!, 500m (über Dichte
abgeschätzt), alloziert über
Flächenbedarf ohne Silo
industrial area, built up m2 2500 450 200 200 2500 400
Questionnaire Biowert; partly
based on assumption
area, uncovered m2 460 82.8 36.8 36.8 460 73.6
Questionnaire Biowert; partly
based on assumption
area, vegetation m2 2960 532.8 236.8 236.8 2960 473.6
Questionnaire Biowert; partly
based on assumption
transport lorry tkm 50000 38840 630 4080 118100 16200 Standard distances
transport train tkm 0 10680 60 1160 10200 3400 Standard distances
life expectancy of infrastructure a 20 20 20 20 20 20 Assumption: 20 years
Name
Lo
cati
on
Infr
ast
ructu
re
Pro
cess
Unit
silo
installation
grass
storage
grass
disintegration
infrastructure
insulating
material
production
infrastructure
plastic
production
infrastructure
anaerobic
digestion
plant
cogeneration
plant, in grass
refinery
Uncert
ain
tyT
y
pe
Sta
nd
ard
Devi
ati
on9
5%
GeneralComment
Location RER RER RER RER RER RER
InfrastructureProcess 1 1 1 1 1 1
Unit unit unit unit unit unit unit
enamelling RER 0 m2 0 0 0 0 1.67E+3 0 1 1.33 (2,4,1,1,3,5); 39.6to à 7900kg/m3, 2x0.33mm
steel, low-alloyed, at plant RER 0 kg 0 3.49E+4 3.00E+2 6.13E+3 4.78E+4 1.50E+4 1 1.33(2,4,1,1,3,5); Questionnaire Biowert; partly based
on assumption
chromium steel 18/8, at plant RER 0 kg 0 2.70E+4 0 5.00E+3 2.10E+4 2.00E+3 1 1.33(2,4,1,1,3,5); Questionnaire Biowert; partly based
on assumption
sheet rolling, steel RER 0 kg 0 8.89E+3 0 5.33E+3 1.78E+4 0 1 1.33(2,4,1,1,3,5); Questionnaire Biowert; partly based
on assumption, 0.75mm, density: 7900 kg/m3
concrete, normal, at plant CH 0 m3 3.74E+2 2.47E+2 0 1.12E+1 8.39E+2 1.09E+2 1 1.33
(2,4,1,1,3,5); Estimation Biowert: 1000t,
ecoinvent: 0.91vol% in reinforced steel, density:
http://www.crtib.lu/Leitfaden/content/DE/116/C528
/
reinforcing steel, at plant RER 0 kg 2.91E+5 1.92E+5 0 8.72E+3 6.51E+5 8.43E+4 1 1.33
(2,4,1,1,3,5); Estimation Biowert: 1000t,
Ecoinvent: 0.09 Vol% in reinforced concrete,
density:
http://www.crtib.lu/Leitfaden/content/DE/116/C459
/
brick, at plant RER 0 kg 0 1.00E+4 1.00E+4 4.00E+4 2.00E+4 0 1 1.33(2,4,1,1,3,5); Questionnaire Biowert; partly based
on assumption
sawn timber, softwood, planed, air dried,
at plantRER 0 m3 0 0 1.00E+3 0 0 0 1 1.33
(2,4,1,1,3,5); Questionnaire Biowert; partly based
on assumption
copper, at regional storage RER 0 kg 0 4.00E+2 0 0 0 0 1 1.33(2,4,1,1,3,5); Questionnaire Biowert; partly based
on assumption
control cabinet cogen unit 160kWe RER 1 unit 0 3.50E+0 1.56E+0 1.56E+0 1.95E+1 3.11E+0 1 3.11(2,4,1,1,3,5); Entire equipment allocated to
different infrastructure. AF: Share of built area
cable, connector for computer, without
plugs, at plantGLO 0 m 0 6.00E+1 2.67E+1 2.67E+1 3.33E+2 5.33E+1 1 1.33
(2,4,1,1,3,5); 75t!, 500m (über Dichte
abgeschätzt), alloziert über Flächenbedarf ohne
Silo
Occupation, industrial area, built up - - m2a 5.00E+4 9.00E+3 4.00E+3 4.00E+3 5.00E+4 8.00E+3 1 1.64(2,4,1,1,3,5); Questionnaire Biowert; partly based
on assumption
Occupation, industrial area, vegetation - - m2a 9.20E+3 1.66E+3 7.36E+2 7.36E+2 9.20E+3 1.47E+3 1 1.64(2,4,1,1,3,5); Questionnaire Biowert; partly based
on assumption
Transformation, from pasture and
meadow- - m2 2.96E+3 5.33E+2 2.37E+2 2.37E+2 2.96E+3 4.74E+2 1 1.40
(2,4,1,1,3,5); Questionnaire Biowert; partly based
on assumption
Transformation, to industrial area, built up - - m2 5.00E+4 9.00E+3 4.00E+3 4.00E+3 5.00E+4 8.00E+3 1 2.11(2,4,1,1,3,5); Questionnaire Biowert; partly based
on assumption
Transformation, to industrial area,
vegetation- - m2 9.20E+3 1.66E+3 7.36E+2 7.36E+2 9.20E+3 1.47E+3 1 2.11
(2,4,1,1,3,5); Questionnaire Biowert; partly based
on assumption
transport, lorry >16t, fleet average RER 0 tkm 5.00E+4 3.88E+4 6.30E+2 4.08E+3 1.18E+5 1.62E+4 1 2.09 (4,5,na,na,na,na); standard distances
transport, freight, rail RER 0 tkm 0 1.07E+4 6.00E+1 1.16E+3 1.02E+4 3.40E+3 1 2.09 (4,5,na,na,na,na); standard distances
disposal, building, brick, to sorting plant CH 0 kg 0 1.00E+4 1.00E+4 4.00E+4 2.00E+4 0 1 1.33(2,4,1,1,3,5); Questionnaire Biowert; partly based
on assumption
disposal, building, reinforced concrete, to
sorting plantCH 0 kg 1.00E+6 6.60E+5 0 3.00E+4 2.24E+6 2.90E+5 1 1.33
(2,4,1,1,3,5); Estimation Biowert: 1000t,
ecoinvent: 0.91vol% in reinforced steel, density:
http://www.crtib.lu/Leitfaden/content/DE/116/C528
/
disposal, building, electric wiring, to final
disposalCH 0 kg 0 6.00E+1 2.67E+1 2.67E+1 3.33E+2 5.33E+1 1 1.33
(2,4,1,1,3,5); 75t!, 500m (über Dichte
abgeschätzt), alloziert über Flächenbedarf ohne
Silo

73/84
11.4.3 Grass silage production
The grass is cut and transported to a silo. There the grass is stored for approximately 100 days. During
this process it loses water, which leads to an increase of the dry matter content from 30% to 35%
(source: Questionnaire). The silage is brought then to the Biowert site (transport distance: 3km) and
fed into the grass disintegration process. The grass silage data set includes grass input from both pro-
duction methods. The share of the two production methods can be varied according to actual or hypo-
thetical situations.
Tab. 11.6 Unit process raw data of grass silage production
11.4.4 Grass disintegration
The grass disintegration process separates the grass fibre from aqueous parts of the grass silage. The
grass fibres are the raw material for AgriPlast and AgriCell production and the grass slurry is used as a
substrate in the biogas plant.
The allocation of the materials and energy needed for the grass disintegration to the two products is
carried out using the dry matter content as allocation factor. The grass fibres account for 2’500 tons of
dry matter annually and the grass slurry for 825 tons. This leads to an allocation factor of 24.8% for
grass slurry and 75.2 % for grass fibres, respectively.
Tab. 11.7 Input data for the modelling of the grass disintegration process
Name
Lo
catio
n
Infr
astr
uc
Unit grass silage,
35% dm, at silo
Uncert
ain
tyT
ype
Sta
nda
rd
Devia
tion
95
% GeneralComment
Location RER
InfrastructureProcess 0
Unit kg
product grass silage, 35% dm, at silo RER 0 kg 1
technosphere grass, Biowert, 30% dm, at farm DE 0 kg 3.33E-1 1 1.21(1,1,1,1,1,5,BU:1.05); For scenario
calculation. Grass dm=30%, silage dm=35%
grass, Biowert, AgriFer, 30% dm, at farm DE 0 kg 3.33E-1 1 1.21(1,1,1,1,1,5,BU:1.05); For scenario
calculation. Grass dm=30%, silage dm=35%
grass from natural meadow extensive organic, at field CH 0 kg 3.33E-1 1 1.21(1,1,1,1,1,5,BU:1.05); For scenario
calculation. Grass dm=15%, silage dm=35%
transport, tractor and trailer CH 0 tkm 3.00E-3 1 2.02(2,1,1,1,1,4,BU:2); Questionnaire: 3 km from
pasture to silo
silo installation grass storage RER 1 unit 2.50E-9 1 3.09 (4,1,1,1,1,5,BU:3); life time: 20 years
Annual Input Source
Input grass silage t/a 20000 Questionnaire Biowert
Dry matter content in grass % 30% Questionnaire Biowert
Dry matter content grass silage % 35% Questionnaire Biowert
Grass silage input dry matter content t/a 7000 Questionnaire Biowert
process water per ton dry matter grass
silagem
3/t 5.5 Questionnaire Biowert
Electricity kWh 1.75E+06 Questionnaire Biowert
Heat from cogeneration unit MJ 2.40E+07 Questionnaire Biowert
Heat from natural gas MJ 7.00E+06 Questionnaire Biowert
Annual output
Grass fibres (dm) t 2.50E+03 Questionnaire Biowert
Grass slurry m3 2.75E+04 Questionnaire Biowert
Grass slurry (dm:3%) t 8.25E+02 Questionnaire Biowert
Share grass fibres (from dm input) % 75.19% Calculated
Share grass slurry (from dm input) % 24.81% Calculated
Life expectancy infrastructure a 20 Assumption

74/84
Tab. 11.8 Unit process raw data of grass disintegration
11.4.5 Grass fibre processing: AgriCell and AgriPlast
The production of AgriCell and AgriPlast involves the treatment of the grass fibres with the flame re-
tardants borax and boric acid. This is the only treatment necessary to obtain AgriCell, the insulation
material. It is packed in plastic bags for transportation to the construction site.
For the production of AgriPlast, the fibres are mixed with polypropylene and processed to granulate.
The AgriPlast granulate is packed in plastic bags or is directly processed in injection moulding or ex-
trusion. The fraction of grass fibres and matrix can vary. We assume a weight ratio of 50% grass fibres
and 50% polypropylene.
Tab. 11.9: Production volumes of AgriCell and AgriPlast
Name
Lo
cati
on
Infr
ast
ruct
ur
eP
roce
ss
Un
it
grass silage, in
grass
disintegration
GeneralComment
grass slurry, at
grass
disintegration
grass fibres, at
grass
disintegration
Location RER RER RER
InfrastructureProcess 0 0 0
Unit kg m3 kg
allocated grass slurry, at grass disintegration RER 0 m3 2.75E+04 (1,1,1,1,1,1); Product
products grass fibres, at grass disintegration RER 0 kg 2.50E+06 (1,1,1,1,1,1); Product
technosphere grass silage, 35% dm, at silo RER 0 kg 7.00E+6 (1,1,1,1,1,5); Questionnaire Biowert 24.81% 75.19%
process water, at decanter RER 0 m3 1.10E+5 (1,1,1,1,1,5); Questionnaire Biowert 24.81% 75.19%
electricity mix, at grass refinery RER 0 kWh 1.75E+6 (1,1,1,1,1,5); Questionnaire Biowert 24.81% 75.19%
heat, at cogen, grass refinery RER 0 MJ 2.40E+7 (1,1,1,1,1,5); Questionnaire Biowert 24.81% 75.19%
heat, natural gas, at industrial furnace low-
NOx >100kWRER 0 MJ 7.00E+6 (1,1,1,1,1,5); Questionnaire Biowert 24.81% 75.19%
grass disintegration infrastructure RER 1 unit 5.00E-2 (2,1,1,1,1,5); Assumption 24.81% 75.19%
emission air,
high population
density
Heat, waste - - MJ 6.30E+6 (2,1,1,1,1,5); calculation 24.81% 75.19%
Production AgriCell AgriPlast Source
Input Grass fibres (dry matter) t/a 1.25E+03 1.25E+03Questionnaire Biowert: Assumption 50% AgriCell, 50%
AgriPlast, dry matter: 92%
Output AgriCell (incl. water content) t/a 1410 - Questionnaire Biowert: Assumption 50% AgriCell
Output AgriPlast (incl. water content) t/a - 2500 Questionnaire Biowert: Assumption 50% AgriPlast
Borax t/a 50 - Questionnaire Biowert: 4% of mass
Packaging material (foil) t/a 20 15Questionnaire Biowert: 0.147 kg per package, 141000
packages
Polypropylene t/a 1250 Questionnaire Biowert
Electricity kWh 2.50E+04 6.25E+05 Questionnaire Biowert
Waste, municipal waste incineration t/a 5Questionnaire Biowert: waste from packaging and
cleaning
Infrastructure
Life expectancy infrastructure a 20 20 Assumption: 20 years life time

75/84
Tab. 11.10 Unit process raw data of AgriCell and AgriPlast production
11.4.6 Biogas production
The grass disintegration process results in grass fibres, which can be used for AgriCell or AgriPlast
production, and grass slurry. The grass slurry is used as a substrate in the biogas plant together with
cow slurry and biowaste. The biogas is burned in the cogeneration unit; the digestate is processed in
reverse osmosis to obtain liquid and solid organic fertiliser AgriFer.
The supply of biowaste and cow slurry for the digestion process is accounted for with the transport of
the waste and the slurry to and from the collection point and the biogenic CO2 content.
Tab. 11.11 Unit process raw data of cow slurry supply
The process heat for the anaerobic digestions is taken from the cogeneration unit.
All parts of the biogas plant are covered. This leads to considerably lower emission values compared
to uncovered biogas plants. The values used for the modelling of the biogas production are derived
from the ecoinvent data for the anaerobic digestion of grass in a covered agricultural biogas plant. In a
proxy, the allocation factor is set to 90% for biogas and 10% for the digestate.
Name
Lo
cation
Infr
ast
ruct
ur
Un
it AgriCell, at
grass refinery
AgriPlast,
granulate PP, at
grass refinery
Un
cert
ain
ty
Type
Sta
ndard
De
via
tion
95%
GeneralComment
Location RER RER
InfrastructureProcess 0 0
Unit kg kg
product AgriCell, at grass refinery RER 0 kg 1.00E+00 0.00E+00
301-08 AgriPlast, granulate PP, at grass refinery RER 0 kg 0.00E+00 1.00E+00
technosphere grass fibres, at grass disintegration RER 0 kg 8.87E-1 5.00E-1 1 1.21(1,1,1,1,1,3); Questionnaire Biowert:
Assumption 50% AgriCell, 50%
Borax, anhydrous, powder, at plant RER 0 kg 3.55E-2 1 1.21(1,1,1,1,1,3); Questionnaire Biowert:
4% of mass
polypropylene, granulate, at plant RER 0 kg 5.00E-1 1 1.21 (1,1,1,1,1,3); Questionnaire Biowert
polyethylene, HDPE, granulate, at plant RER 0 kg 1.42E-2 5.84E-3 1 1.21 (1,1,1,1,1,3); Questionnaire Biowert
electricity mix, at grass refinery RER 0 kWh 1.77E-2 2.50E-1 1 1.21 (1,1,1,1,1,3); Questionnaire Biowert
disposal, municipal solid waste, 22.9% water, to
municipal incinerationCH 0 kg 3.55E-3 1 1.21
(1,1,1,1,1,3); Questionnaire Biowert:
waste from packaging and cleaning
insulating material production infrastructure RER 1 unit 3.55E-8 1 3.05(2,1,1,1,1,3); Assumption: 20 years
life time
plastic production infrastructure RER 1 unit 2.00E-8 1 3.05(2,1,1,1,1,3); Assumption: 20 years
life time
emission air, high
population densityHeat, waste - - MJ 9.00E-1 1 1.22 (2,1,1,1,1,3); calculation
Name
Loca
tion
Infr
astr
uct
ure
Unit
cow slurry, in
anaerobic
digestion, at
collection point
Uncert
ain
tyT
y
pe
Sta
ndard
Devi
ation95%
GeneralComment
Location RER
InfrastructureProcess 0
Unit m3
product cow slurry, in anaerobic digestion, at collection point RER 0 m3 1
resource, in air Carbon dioxide, in air - - kg 4.44E+1 1 1.05
(2,2,1,1,3,4,BU:1.05); calculated from
Kennwertmodell naturemade and ecoinvent
data for slurry in biogas plant
technosphere transport, tractor and trailer CH 0 tkm 1.00E+1 1 2.00 (2,2,1,1,3,4,BU:2); assumption: 10 km

76/84
Tab. 11.12 Parameters used for the biogas production from grass
Tab. 11.13 Unit process raw data of biogas production from grass slurry, biowaste and cow slurry
11.4.7 Cogeneration of heat and electricity from biogas
The biogas from the biogas plant is burned in a cogeneration unit. The heat and the electricity from the
cogeneration are used as processes heat and electricity input.
Input Value Source
Input grass slurry m3/a 27500 Questionnaire Biowert
Input cow slurry m3/a 10000 Questionnaire Biowert
Input bio waste t/a 15000 Questionnaire Biowert
Electricity from cogen grass refinery kWh/a 4.20E+05 Questionnaire Biowert
Heat from cogen grass refinery MJ/a 9.25E+06 Questionnaire Biowert
Life expectancy biogas plant a 20
Annual yield
Digestate m3/a 42000
AgriFer solid t/a 1300 Estimation Biowert:
AgriFer liquid m3/a 10000 Estimation Biowert:22.5% of digestion residues
Process water at decanter m3/a 27500
Biogas m3 4600000 Questionnaire Biowert
Emissions
CO2 kg/m3 6.62E-03
Calculated; 1% of CO2 in biogas emitted from
covered stock
NH3 kg/m3 4.06E-04
Calculated; 80% of emission reduction due to
stock cover
N2O kg/m3 2.85E-04
Calculated; 75% of emission reduction due to
stock cover
Heat waste MJ/m3 3.29E-01 Calculated from electricity use
CH4 kg/m3 4.54E-03
Calculated; 1% of methane in biogas emitted
from covered stock
H2S kg/m3 1.55E-03 Calculated with 0.7g H2S/kg DM
Name
Lo
ca
tio
n
Infr
astr
uctu
re
Pro
ce
ss
Un
it
grass slurry,
digested in
anaerobic
digestion plant,
at grass refinery
GeneralComment
biogas, from
grass
refinery, at
storage
digestate,
at grass
refinery
Location RER RER RER
InfrastructureProcess 0 0 0
Unit m3 Nm3 m3
allocatedbiogas, from grass refinery, at
storageRER 0 Nm3 4.60E+06 (1,1,1,1,1,1); Product
products digestate, at grass refinery RER 0 m3 4.20E+04 (1,1,1,1,1,1); Product
technosphere grass slurry, at grass disintegration RER 0 m3 2.75E+4 (4,4,2,3,1,5); Questionnaire Biowert 90% 10%
cow slurry, in anaerobic digestion, at
collection pointRER 0 m3 1.00E+4 (3,1,2,1,1,5); Questionnaire Biowert 90% 10%
biowaste, at collection point CH 0 kg 1.50E+7 (4,4,3,3,4,5); Questionnaire Biowert 90% 10%
electricity mix, at grass refinery RER 0 kWh 4.20E+5 (4,4,3,3,4,5); Questionnaire Biowert 90% 10%
heat, at cogen, grass refinery RER 0 MJ 9.25E+6 (4,4,3,3,4,5); Questionnaire Biowert 90% 10%
anaerobic digestion plant RER 1 unit 5.00E-2 (4,4,3,3,4,5); 0 90% 10%
emission air,
unspecifiedCarbon dioxide, biogenic - - kg 3.04E+4 (4,4,3,3,4,5); 90% 10%
Ammonia - - kg 1.87E+3 (4,4,3,3,4,5); 90% 10%
Dinitrogen monoxide - - kg 1.31E+03 (4,4,3,3,4,5); 90% 10%
Methane, biogenic - - kg 2.09E+4 (4,4,3,3,4,5); 90% 10%
Hydrogen sulfide - - kg 7.13E+3 (4,4,3,3,4,5); 90% 10%
emission air,
high population
density
Heat, waste - - MJ 1.51E+6 (4,4,3,3,4,5); 90% 10%

77/84
Tab. 11.14 Input and output parameters of biogas production
Similar as for the biogas production, some parameters of the cogeneration data sets are derived from
existing data set of the ecoinvent database (Jungbluth et al. 2007). The in- and output of the lubricating
oil and the air emissions are described in Subchapter 3.3.1. Furthermore, the allocation of the envi-
ronmental impact to heat and electricity is carried out according to the allocation factor used in the
ecoinvent data set (exergy content).
Tab. 11.15 Unit process raw data of biogas burned in the cogeneration unit
11.4.8 AgriFer production
The digestate from the biogas production contains nutrients, which can be used as organic fertilizers.
The nutrient content of the AgriFer products is shown in Tab. 11.16.
Biowert Input Comment
Biogas in cogeneration m3/a 4600000 Questionnaire Biowert
lubricating oil kg 2.98E-04From ecoinvent DS cogen, biogas
from agricultural co-fermentation
Life expectancy a 20 Questionnaire Biowert
Biowert Output
ElectricitykWh/
a1.03E+07
Heat MJ/a 3.30E+07
Disposal lubricating oil kg 2.98E-04From ecoinvent DS cogen, biogas
from agricultural co-fermentation
Name
Lo
ca
tio
n
Infr
astr
uctu
re
Pro
ce
ss
Un
it
biogas, burned
in cogen at
grass refinery
Un
ce
rta
inty
Ty
Sta
nd
ard
De
v
iatio
n9
5%
GeneralCommentheat, at cogen,
grass refinery
electricity, at
cogen, grass
refinery
Location RER RER RER
InfrastructureProcess 0 0 0
Unit Nm3 MJ kWh
allocated heat, at cogen, grass refinery RER 0 MJ 3.30E+07
productselectricity, at cogen, grass
refineryRER 0 kWh 1.03E+07
technospherebiogas, from grass refinery, at
storageRER 0 Nm3 4.60E+6 1 1.33
(4,4,2,3,1,5,BU:1.05); Questionnaire
Biowert13% 87%
cogeneration plant, in grass
refineryRER 1 unit 5.00E-2 1 3.34
(4,4,3,3,4,5,BU:3); Questionnaire
Biowert13% 87%
operation, biogas combustion,
in cogen with biogas engineCH 0 MJ 1.10E+8 1 1.65
(4,4,3,3,4,5,BU:1.05); Heating value 24
MJ/m313% 87%

78/84
Tab. 11.16 Nutrient content of AgriFer fertiliser products (Bundesgütegemeinschaft Kompost E.V. 2008)
The digestate has a high water content, which is not suitable for the fertiliser application. Consequent-
ly, the water is extracted in reverse osmosis. The extracted water is recycled as process water in the
grass disintegration process and the dry matter enriched fertiliser can be applied to the grass fields in
order to close the nutrient cycle. The infrastructure needed for the reverse osmosis is included in the
biogas plant. The allocation factors are calculated according to the dry matter content of the products.
Tab. 11.17 Input and output parameters of AgriFer production
AgriFer Unit Liquid Solid
Density g/l 1.039 0.757
Dry matter content % 0.0402 0.28
N content %DM 0.283 0.0391
P2O5 content %DM 0.0118 0.0313
K2O content %DM 0.1582 0.0089
MgO content %DM 0.001 0.0146
N per m3
kg/m3 11.7 8.25
N per kg kg/kg 0.0113 0.0109
P2O5 per m3
kg/m3 0.42 6.59
P2O5 per kg kg/kg 0.0004 0.0087
K2O per m3
kg/m3 6.55 1.82
K2O per kg kg/kg 0.0063 0.0024
Amount AgriFer m3 17
Amount AgriFer kg 3714.29
N input kg 198.9 40.49
P2O5 input kg 7.14 32.31
K2O input kg 111.35 8.91
Input Wert TS Source
Digestate m3/a 42000 Questionnaire Biowert
AgriFer liquid m3/a 10000 2% Questionnaire Biowert
AgriFer solid t/a 1300 25% Questionnaire Biowert
Process water m3/a 32550 0% Questionnaire Biowert: 77.5% des Gärrests/Permeat
Electricity demandkWh/
a1280000 Questionnaire Biowert
Process water to waste water treatment m3/a 5.00E+03
Output
TS Input/Output
Output AgriFer liquid t 2.00E+02
Output Agrifer solid t 3.25E+02
Output process water t 4.91E+03
Input grass slurry t 8.25E+02
Input bio waste t 3.75E+03 15000t/a, assumption 25%
Input cow slurry t 8.60E+02 10000m3/a, DM: 8.6%
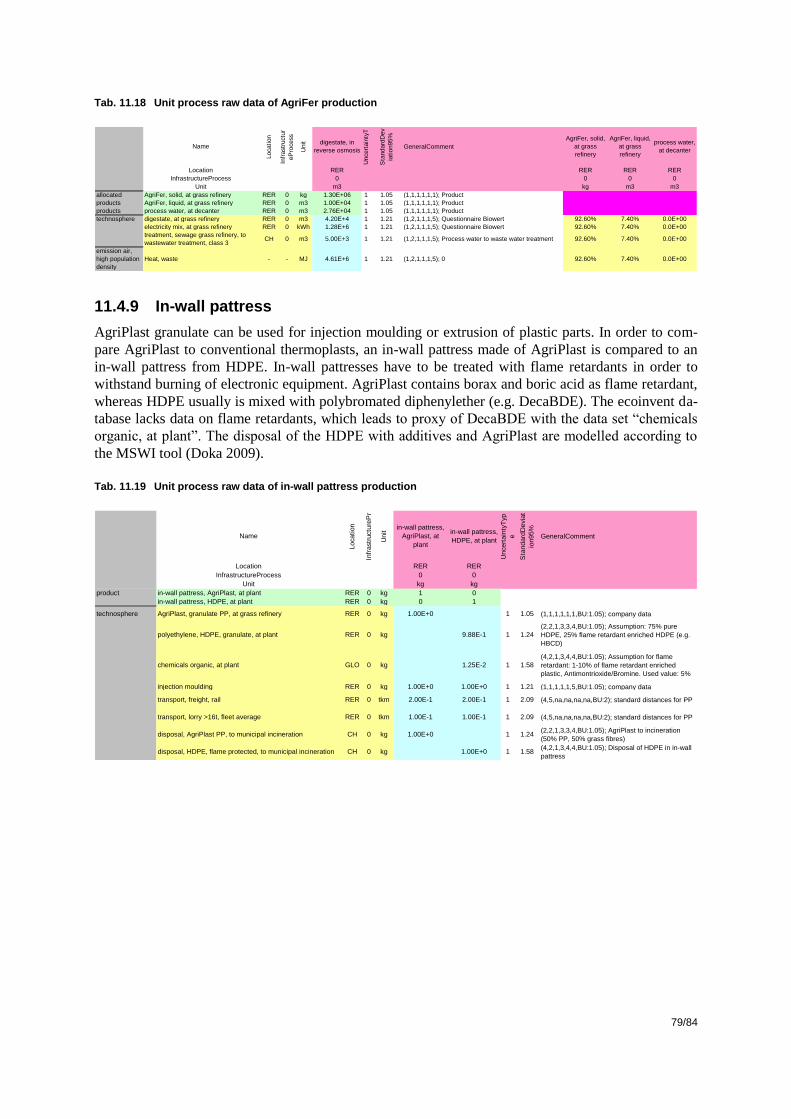
79/84
Tab. 11.18 Unit process raw data of AgriFer production
11.4.9 In-wall pattress
AgriPlast granulate can be used for injection moulding or extrusion of plastic parts. In order to com-
pare AgriPlast to conventional thermoplasts, an in-wall pattress made of AgriPlast is compared to an
in-wall pattress from HDPE. In-wall pattresses have to be treated with flame retardants in order to
withstand burning of electronic equipment. AgriPlast contains borax and boric acid as flame retardant,
whereas HDPE usually is mixed with polybromated diphenylether (e.g. DecaBDE). The ecoinvent da-
tabase lacks data on flame retardants, which leads to proxy of DecaBDE with the data set “chemicals
organic, at plant”. The disposal of the HDPE with additives and AgriPlast are modelled according to
the MSWI tool (Doka 2009).
Tab. 11.19 Unit process raw data of in-wall pattress production
Name
Loca
tion
Infr
astr
uctu
r
eP
rocess
Unit digestate, in
reverse osmosis
Uncert
ain
tyT
Sta
ndard
Dev
iation95%
GeneralComment
AgriFer, solid,
at grass
refinery
AgriFer, liquid,
at grass
refinery
process water,
at decanter
Location RER RER RER RER
InfrastructureProcess 0 0 0 0
Unit m3 kg m3 m3
allocated AgriFer, solid, at grass refinery RER 0 kg 1.30E+06 1 1.05 (1,1,1,1,1,1); Product
products AgriFer, liquid, at grass refinery RER 0 m3 1.00E+04 1 1.05 (1,1,1,1,1,1); Product
products process water, at decanter RER 0 m3 2.76E+04 1 1.05 (1,1,1,1,1,1); Product
technosphere digestate, at grass refinery RER 0 m3 4.20E+4 1 1.21 (1,2,1,1,1,5); Questionnaire Biowert 92.60% 7.40% 0.0E+00
electricity mix, at grass refinery RER 0 kWh 1.28E+6 1 1.21 (1,2,1,1,1,5); Questionnaire Biowert 92.60% 7.40% 0.0E+00
treatment, sewage grass refinery, to
wastewater treatment, class 3CH 0 m3 5.00E+3 1 1.21 (1,2,1,1,1,5); Process water to waste water treatment 92.60% 7.40% 0.0E+00
emission air,
high population
density
Heat, waste - - MJ 4.61E+6 1 1.21 (1,2,1,1,1,5); 0 92.60% 7.40% 0.0E+00
Name
Lo
cati
on
Infr
astr
uctu
reP
r
Unit
in-wall pattress,
AgriPlast, at
plant
in-wall pattress,
HDPE, at plant
Uncert
ain
tyT
yp
e
Sta
nd
ard
Devia
t
ion9
5%
GeneralComment
Location RER RER
InfrastructureProcess 0 0
Unit kg kg
product in-wall pattress, AgriPlast, at plant RER 0 kg 1 0
301-28 in-wall pattress, HDPE, at plant RER 0 kg 0 1
technosphere AgriPlast, granulate PP, at grass refinery RER 0 kg 1.00E+0 1 1.05 (1,1,1,1,1,1,BU:1.05); company data
polyethylene, HDPE, granulate, at plant RER 0 kg 9.88E-1 1 1.24
(2,2,1,3,3,4,BU:1.05); Assumption: 75% pure
HDPE, 25% flame retardant enriched HDPE (e.g.
HBCD)
chemicals organic, at plant GLO 0 kg 1.25E-2 1 1.58
(4,2,1,3,4,4,BU:1.05); Assumption for flame
retardant: 1-10% of flame retardant enriched
plastic, Antimontrioxide/Bromine. Used value: 5%
injection moulding RER 0 kg 1.00E+0 1.00E+0 1 1.21 (1,1,1,1,1,5,BU:1.05); company data
transport, freight, rail RER 0 tkm 2.00E-1 2.00E-1 1 2.09 (4,5,na,na,na,na,BU:2); standard distances for PP
transport, lorry >16t, fleet average RER 0 tkm 1.00E-1 1.00E-1 1 2.09 (4,5,na,na,na,na,BU:2); standard distances for PP
disposal, AgriPlast PP, to municipal incineration CH 0 kg 1.00E+0 1 1.24(2,2,1,3,3,4,BU:1.05); AgriPlast to incineration
(50% PP, 50% grass fibres)
disposal, HDPE, flame protected, to municipal incineration CH 0 kg 1.00E+0 1 1.58(4,2,1,3,4,4,BU:1.05); Disposal of HDPE in in-wall
pattress

80/84
12 Appendix E: LCI of biogas purification, distribution and use as fuel
The inventories of biogas purification, distribution and combustion in passenger cars are modelled in
order to enable a comparison of methane from different biogas substrates with liquid biofuels that are
for example presented by Zah et al. (2007).
Due to the fact that operators of biogas plants burn biogas in cogeneration units in order to supply the
anaerobic digestion unit with heat and electricity, only the amount of biogas that is not required for
covering the digestion unit’s heat demand can be purified to biomethane. In this calculation, the heat
consumption of the digestion unit is the limiting factor, since the entire heat demand is met with the
production of the cogeneration unit in contrast to electricity that is not only consumed from the cogen-
eration unit but also from grid. Tab. 12.1 shows the maximum share of biogas from different sub-
strates available for purification.
Tab. 12.1 Maximum share of biogas available for purification after subtraction of share of biogas required for produc-
ing the heat required in the anaerobic digestion unit
Maize silage Sugar beet Fodder beet
Beet resi-
dues Molasses Glycerine
Minimum
share of bio-
gas required
in cogenera-
tion unit
10.4% 11.0% 17.5% 31.6% 4.9% 2.1%
Maximum
share of bio-
gas availa-
ble for purifi-
cation
89.6% 89.0% 82.5% 68.4% 95.1% 97.9%
12.1 Biogas mix for purification
Most operators of biogas plants in Switzerland burn the biogas in a cogeneration unit in order to pro-
duce heat and electricity. In the year 2010, only 13 operators purified their biogas to biomethane that
was fed into the natural gas grid or sold in a pumping station. Based on these operators, we created the
biogas mix in Tab. 12.2 with information about their substrates and their production capacities (see
Tab. 12.5 on page 84).
Tab. 12.2: Unit process raw data of the biogas mix for purification in Switzerland
Name
Lo
ca
tio
n
Infr
astr
uctu
reP
r
Un
it
biogas,
production mix,
at storage,
Update
Un
ce
rta
inty
Typ
e
Sta
nd
ard
De
via
ti
on
95
%
GeneralComment
Location CH
InfrastructureProcess 0
Unit Nm3
product biogas, production mix, at storage, Update CH 0 Nm3 1
shares biogas, from biowaste, at storage CH 0 Nm3 55% 1 1.24(3,1,1,1,1,5,BU:1.05); 7 operators
in Switzerland
biogas, from sewage sludge, at storage CH 0 Nm3 34% 1 1.24(3,1,1,1,1,5,BU:1.05); 5 operators
in Switzerland
biogas, mix, at agricultural co-fermentation, covered CH 0 Nm3 12% 1 1.24(3,1,1,1,1,5,BU:1.05); 1 operator
in Switzerland
81/84
12.2 Purification technologies
In Switzerland, biogas is purified with three different technologies: pressure swing adsorption (PSA),
glycol washing, and amino washing. Tab. 12.4 shows the unit process raw data of these technologies
excluding the biogas input.
12.2.1 Amino washing
Up to date information about a purification plant using amino washing and operating in Switzerland
are available from EMPA (2009). The amount of electricity and heat consumed, as well as the amount
of amine (monoethanolamine) and tap water used for the washing, and the amount of activated carbon
(charcoal) and thermal oil (lubricating oil) for desulphurisation is taken from this publication. The
amount of used tap water is treated as sewage in a wastewater treatment plant. The amine is consid-
ered to be disposed in a hazardous waste incineration after use. Several publications report that less
than 0.1 % of the methane content in the raw biogas is emitted into air in the amino washing process
(EMPA 2009; Urban et al. 2009).
12.2.2 Glycol washing
Glycol washing is used in biogas plants in Romanshorn, Bischofszell, and Pratteln (see Fig. 3.2). Ur-
ban et al. (2009) report an electricity consumption of the glycol washing process of 0.24-0.3 kWh per
m2 raw biogas. Schulte-Schulze (2006) mentions an electricity consumption of 0.32 kWh per m
2 raw
biogas. The purification plant in Romanshorn has an annual electricity consumption of 120’000 kWh
and an annual purification of 187’509 Nm3 of raw biogas which results in a specific electricity con-
sumption of 0.97 kWh per Nm3 biomethane, if considering a biogas input of 1.5 m
3 per m
3 purified bi-
omethane. The purification plant in Pratteln has an annual electricity consumption of 504’162 kWh
and a production of 626'885 Nm3 biomethane, resulting in a specific consumption of 0.81 kWh per
Nm3 biomethane. Hence, the average electricity consumption of glycol washing in Switzerland is
0.89 kWh/m3 biomethane which is significantly higher than what can be derived from literature
sources.
The washing agent used in the glycol washing process is a mixture of dimethyl ether and polyethylene
glycol. The density of the washing agent varies between different formulations, but is around 1 kg/l
(Clariant 2002). In the Biogas plant Pratteln, 110 litre of washing agent were refilled in 2010.14
In rela-
tion to the biomethane production of 626'885 m3 in the same year, this results in a washing agent con-
sumption of 0.18 g/m3. Since no specific information of the detailed composition of washing agent is
available, it is assumed that the two components each have a share of 50 %. It is assumed that the
washing agent is disposed in a hazardous waste incineration after its end of life. According to Urban et
al. 2009, 1 % of the methane content in the raw gas is emitted into air. We apply an emission factor of
2.6 % of the methane content in the raw gas, calculated from up to date information from a Swiss op-
erator.15
12.2.3 PSA
The most common technology of biogas purification in Switzerland is pressure swing adsorption
(PSA). Urban et al. (2009) report an electricity consumption of the PSA process of 0.22 kWh per m2
14 Biopower-Anlage Pratteln, Biogasaufbereitung, Betriebskennzahlen Jahr 2010, personal information from Mike Keller from
the Biopower Nordwestschweiz AG, on 21.02.2011. 15 ARA Region Romanshorn Biogasaufbereitung - Energieflussdiagramm 2010, personal information from Heinz Greuter from
Erdgas Romanshorn, on 31.01.2011.

82/84
raw biogas. Schulte-Schulze (2006) mentions an electricity consumption of 0.25 kWh per m2 raw bio-
gas. We apply a value of 0.23 kWh per m2 raw biogas, which results in 0.35 kWh per m
2 purified bio-
methane. A detailed study published by Baier et al. (2008) analysed the methane emissions of a PSA
plant in Switzerland and revealed that 2.6 % of the methane content in the raw biogas are emitted into
air during the purification process.
12.2.4 General assumptions
Since, the amino washing process and the PSA process also require a desulphurisation step, the same
amount of activated carbon and lubricating oil is taken into account as in the amino washing process.
Activated carbon is usually impregnated with 2.5 % of potassium iodide, in order to remove hydrogen
sulphides from the biomethane.16
The generic value of infrastructure facilities is taken from Jungbluth et al. (2007).
Tab. 12.3 shows the average composition of raw biogas, waste gas, and purified biomethane from dif-
ferent technologies. The datasets refer to 1 m3 of purified biomethane. The compositions of raw bio-
gas, waste gas and biomethane from PSA is obtained from Jungbluth et al. (2007). The hydrogen sul-
phide content in the biomethane from PSA is adjusted to 0.0003 % as declared by Rütgers (general)
cited in Jungbluth et al. (2007). And the composition of biomethane from amino and glycol washing is
calculated from composition of biomethane from PSA and the higher methane share as reported by
Urban et al. (2009).
The amount of waste heat is calculated from the energy consumption. The carbon dioxide emissions
are calculated from the carbon dioxide input in the raw biogas (1.5 m3 biogas/m
3 biomethane;
33.5 vol% carbon dioxide share) and the carbon dioxide output in the purified biomethane (0.5 vol% -
2 vol%). The methane emissions are calculated by applying the methane emission factors from litera-
ture on the methane input from the raw biogas. Hydrogen sulphide emissions are calculated from the
H2S content in the waste gas reported by in Jungbluth et al. (2007) and 0.5 m3 waste gas per m
3 puri-
fied gas. We assume that the retained sulphur dioxide is oxidised to sulphur dioxide and emitted into
air. The amount of sulphur dioxide is calculated from the difference between the hydrogen sulphide
input from raw biogas and hydrogen sulphide output in the purified biomethane and the waste gas.
Tab. 12.3: Average composition of raw biogas, waste gas, and biomethane from different purification technologies
Component Raw biogas Waste gas Biomethane
from amino
washing
from glycol
washing from PSA
Methane 63.30% 6% 99% 97% 96%
Carbon dioxide 33.50% 91% 0.5% 1.5% 2%
Nitrogen 3.2% 3% 0.3% 0.8% 1%
Hydrogen sul-
phide 0.0005% 0.0004% 0.0001% 0.0002% 0.0003%
16 http://www.gutmbh.de/Aktivkohle.htm (access on19.10.2011)

83/84
Tab. 12.4: Unit process raw data of biogas purification technologies (excluding biogas input). Dataset refer to 1 m3
purified biomethane.
12.2.5 Purification technologies in Switzerland
The biogas purification facilities that were operating in Switzerland in 2009 are listed in Tab. 12.5. We
estimated their production capacity based on data from the IEA Bioenergy Task 3717
and information
about the individual plants available on the internet. Two operators feed their biomethane in a filling
station for vehicles whereas the other operators feed their biomethane into the natural gas grid. The
purification plant in Bischofszell is not operating any more in the year 2011.
17 Personal information from Arthur Wellinger from Nova Energie on 31.01.2011
Name
Lo
ca
tio
n
Infr
astr
uctu
reP
roce
ss
Un
it
biogas
purification, to
methane, 99 vol-
%, amino
washing
process
biogas
purification, to
methane, 97 vol-
%, glycol
washing
process
biogas
purification, to
methane, 96 vol-
%, pressure
swing
adsorption Un
ce
rta
inty
Typ
e
Sta
nd
ard
De
via
tio
n9
5%
GeneralComment
Location CH CH CH
InfrastructureProcess 0 0 0
Unit Nm3 Nm3 Nm3
product biogas purification, to methane, 99 vol-%, CH 0 Nm3 1 0 0
biogas purification, to methane, 97 vol-%, CH 0 Nm3 0 1 0
biogas purification, to methane, 96 vol-%, CH 0 Nm3 0 0 1
technosphere electricity, medium voltage, at grid CH 0 kWh 2.75E-1 8.88E-1 3.55E-1 1 1.09 (2,3,2,3,1,4); literature
natural gas, burned in boiler atm. low-NOx
condensing non-modulating <100kWRER 0 MJ 3.16E+0 - - 1 1.09 (1,4,1,3,1,5); EMPA (2009)
monoethanolamine, at plant RER 0 kg 2.08E-3 - - 1 1.09 (1,4,1,3,1,5); EMPA (2009)
dimethyl ether, at plant RER 0 kg - 8.77E-5 - 1 3.01 (3,2,1,3,1,5); 50% of genosorb
triethylene glycol, at plant RER 0 kg - 8.77E-5 - 1 1.16 (3,2,1,3,1,5); assumption from amino washing
charcoal, at plant GLO 0 kg 2.08E-4 2.08E-4 2.08E-4 1 3.09 (1,4,1,3,3,5); EMPA (2009)
lubricating oil, at plant RER 0 kg 1.50E-4 1.50E-4 1.50E-4 1 1.09 (1,4,1,3,3,5); EMPA (2009)
potassium hydroxide, at regional storage RER 0 kg 3.98E-6 3.98E-6 3.98E-6 1 3.09
(4,5,1,5,1,5); activated carbon impregnation
with 2.5 % of potassium iodide for H2S
removal
tap water, at user CH 0 kg 2.08E-3 - 1 1.12 (1,4,1,3,1,5); EMPA (2009)
treatment, sewage, unpolluted, to
wastewater treatment, class 3CH 0 m3 2.08E-6 - 1 2.02 (1,4,1,3,1,5); EMPA (2009)
disposal, hazardous waste, 25% water, to
hazardous waste incinerationCH 0 kg 2.08E-3 1.75E-4 1 1.52 (4,2,1,3,1,5); used washing chemicals
chemical plant, organics RER 1 unit 4.00E-10 4.00E-10 4.00E-10 1 3.31 (3,4,3,3,4,5); generic value
transport, lorry 3.5-20t, fleet average CH 0 tkm 1.22E-4 2.69E-5 1.81E-5 1 2.09 (4,5,na,na,na,na); standard distance 50km
transport, freight, rail CH 0 tkm 1.47E-3 3.22E-4 2.17E-4 1 2.09 (4,5,na,na,na,na); standard distance 600km
emission air, high
population densityHeat, waste - 0 MJ 4.15E+0 3.20E+0 1.28E+0 1 1.09
(2,3,2,3,1,4); calculated from energy
consumption
Carbon dioxide, biogenic - 0 kg 4.99E-1 4.79E-1 4.69E-1 1 1.12(4,3,1,1,1,5); calculated from difference
between input and output
Methane, biogenic - 0 kg 6.92E-4 1.56E-2 1.80E-2 1 2.02 (1,3,1,1,1,5); Emission factor in literature
Hydrogen sulfide - 0 kg 2.31E-6 2.31E-6 2.31E-6 1 1.52(4,3,1,1,1,5); calculated from H2S content in
waste gas
Sulfur dioxide - 0 kg 1.31E-5 8.77E-6 6.60E-6 1 1.13 (4,1,1,1,1,5); retained sulphur is oxidised

84/84
Tab. 12.5 Biogas purification facilities in Switzerland
Based on Tab. 12.5, we calculated the capacity weighted shares of 56 % biogas purified using pressure
swing adsorption, 18 % using amino washing, and 26 % using glycol washing. Tab. 12.6 shows the
unit process raw data of purified biogas. According to Jungbluth et al. (2007), 1.5 m3 of biogas is re-
quired in order to produce 1 m3 of purified biomethane. In this study we calculate with a methane con-
tent of 63.3 % in the raw biogas and a minimum methane content of 96.0 % in the purified bio-
methane. Therefore, 1.52 m3 biogas is required for 1 m
3 of purified biomethane.
Tab. 12.6 Unit process raw data of purified biomethane
12.3 Distribution and combustion in passenger car
The unit process data of the biomethane distribution and the passenger car transportation with a bio-
gas-operated vehicle are considered with ecoinvent datasets described by Jungbluth et al. (2007) with-
out any modifications.
location substrateyear of
installation
plant
capacity
in 2010
methane use
m3/h
Rümlang greenery, waste food, etc. 1998 30 Filling station
Otelfingen greenery, waste food, etc. 1998 50 Filling station
Samstagern greenery, waste food, etc. 1997 50 Natural gas grid
Emmen sewage sludge 2005 75 Natural gas grid
Widnau manure, vegetables, greenery, waste food etc. 2007 200 Natural gas grid
Bern sewage sludge 2008 300 Natural gas grid
Utzenstorf biowaste 2009 150 Natural gas grid
Lavigny biowaste 2008 120 Natural gas grid
Obermeilen sewage sludge 2008 60 Natural gas grid
Volketswil biowaste 2010 250 Natural gas grid
Pratteln greenery, waste food, etc. 2006 300 Natural gas grid
Bischofszell sewage sludge 2007 120 Natural gas grid
Romanshorn sewage sludge 2007 30 Natural gas grid
pressure swing
adsorption
amino washing
glycol washing
Name
Lo
ca
tio
n
Infr
astr
uctu
reP
roce
ss
Un
it
methane, 96 vol-
%, from biogas,
at purification,
Update
Un
ce
rta
inty
Typ
e
Sta
nd
ard
De
via
tio
n9
5%
GeneralComment
Location CH
InfrastructureProcess 0
Unit Nm3
product methane, 96 vol-%, from biogas, at purification, Update CH 0 Nm3 1
technosphere biogas purification, to methane, 99 vol-%, amino washing process CH 0 Nm3 1.79E-1 1 3.01 (3,1,1,1,1,1); 2 plants operating in 2010
biogas purification, to methane, 97 vol-%, glycol washing process CH 0 Nm3 2.59E-1 1 1.16 (3,1,1,1,1,1); 3 plants operating in 2010
biogas purification, to methane, 96 vol-%, pressure swing adsorption CH 0 Nm3 5.62E-1 1 3.09 (3,1,1,1,1,1); 8 plants operating in 2010
biogas, production mix, at storage, Update, Parameters CH 0 Nm3 1.52E+0 1 1.09 (2,5,2,1,3,5); raw gas input