life-cycle analysis, quality, health & safety
TRANSCRIPT
Life-cycle analysis, Quality, Health & SafetyCIV-E1040 Construction Management
Lecture 4b
Antti PeltokorpiAssistant ProfessorDepartment of Civil Engineering, Aalto [email protected]

Previous lecture
• Cost estimation methods
• Conceptual estimating
• Element based estimating
• Cost estimation process
• Evolutionary estimating
• Use of parametrics and BIM
Learning outcomes
After lecture student can:
• Describe the process and input-output methods for life-cycle
analysis of buildings
• Describe principles of life-cycle cost analysis
• Describe different definitions for quality in construction
• Describe quality and safety management methods and
practices
Life-cycle analysis(LCA)

Background
• Strategy to stop every possible emission that is harming our
shared environment
• Life-cycle assessment:
“a technique to assess environmental impacts associated with all the stages of a product's life from raw material extraction through materials processing, manufacture, distribution, use, repair and maintenance, and disposal or recycling”
• A carbon footprint:
“defines the total sets of greenhouse gas (GHG) emissions caused by organizations, events, products, individuals or regions”
“Sum of all emissions of carbon dioxide (CO2), which were induced by all activities in a given time frame”
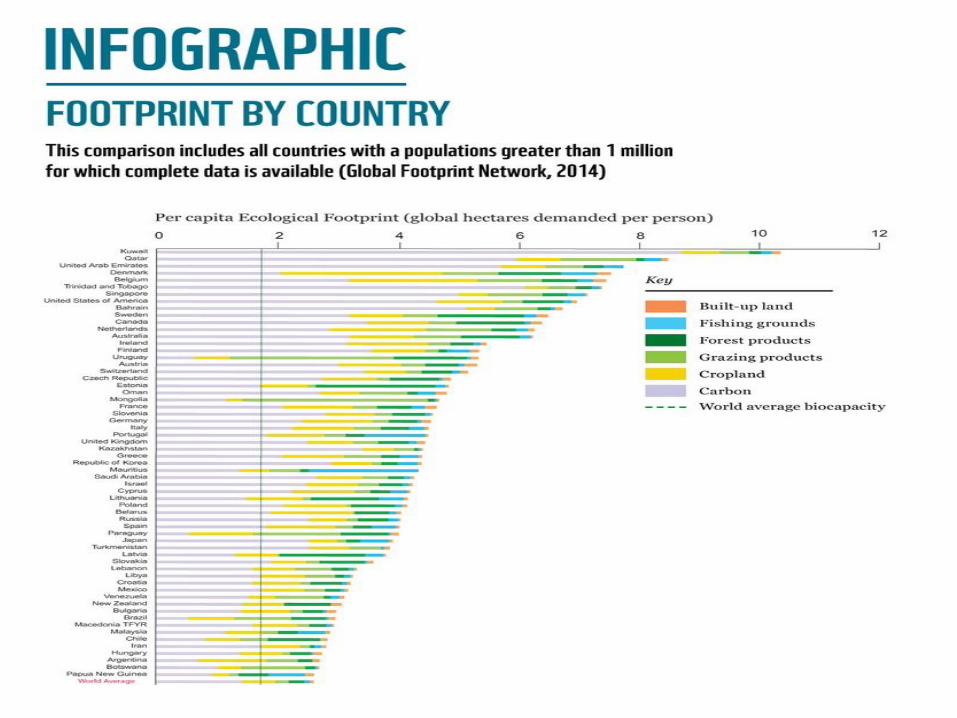
Carbon footprint assessment
• One of a family of footprint indicators (others: water footprint, land footprint)
• Measure direct emissions of gases that cause climate change into the atmosphere
• Individual / household / industry / product / region
• CO2 emissions are around 80 % of the greenhouse gas emissions (GHG)
• The primary greenhouse gases in Earth's atmosphere are water vapor, carbon dioxide (CO2), methane, nitrous oxide, and ozone
• CO2 enters the atmosphere through
• Burning fossil fuels (coal, natural gas, and oil)
• Solid waste
• Trees and wood products
• As a result of certain chemical reactions (e.g., manufacture of cement)
• CO2 is removed from the atmosphere when it is absorbed by plants as part of
the biological carbon cycle
Carbon footprint contributed by buildings
• Purpose is to find out how much carbon dioxide emissions
building produces during it’s lifespan
• Buildings alone are responsible for 38% of all human
Greenhouse Gas emissions (20% residential, 18%
commercial)
• Important to identify the sources of these emissions and
understand their relations to the construction phase and
essential in climate change mitigation

Environmental certificates for buildings in Finland
Source: Rakennushankkeiden ympäristöluokitukset Suomessa
Location and connections
Energy and environment
Materials
Indoor air
Site management
Transportation
Lot selection
Green areas
Process
Lifecycle costs
Maintenance
Moisture risk
management
Energy efficiency
Water use
Functional
assurance
CO2 measurement
Material efficiency
Resp. procurements
Waste management
Indoor air quality
Natural light
Material emissions
Chemical risks
Acoustics
Site environment
Cleanliness
Waste management

Purpose of carbon footprint assessment of buildings
• Can be used as a design goal or criteria
• Helps reduce the emissions of buildings by quantifying it
• Makes the choice easy for ideal structures
• Helps to improve the lifecycle efficiency, design goals and
setting the lifecycle requirement for the structures
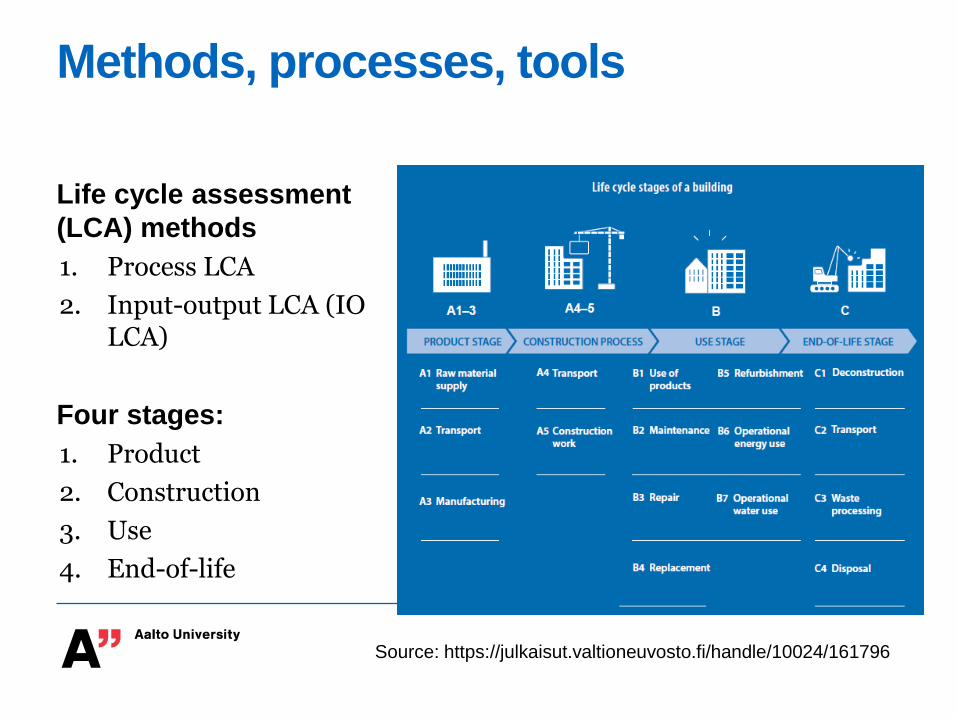
Methods, processes, tools
Life cycle assessment
(LCA) methods
1. Process LCA
2. Input-output LCA (IO LCA)
Four stages:
1. Product
2. Construction
3. Use
4. End-of-life
Source: https://julkaisut.valtioneuvosto.fi/handle/10024/161796
Process method to analyze carbonfootprint
• A bottom-up approach
• Takes into account all processes in the product life cycle,
from production to disposal of the product → accuracy
• Requires detailed information on the entire life cycle of the
product → expensive in terms of time and computation
• Data required is often not available
• Supplier not wanting to unveil information on their production processes
• Manual process and can take days per product
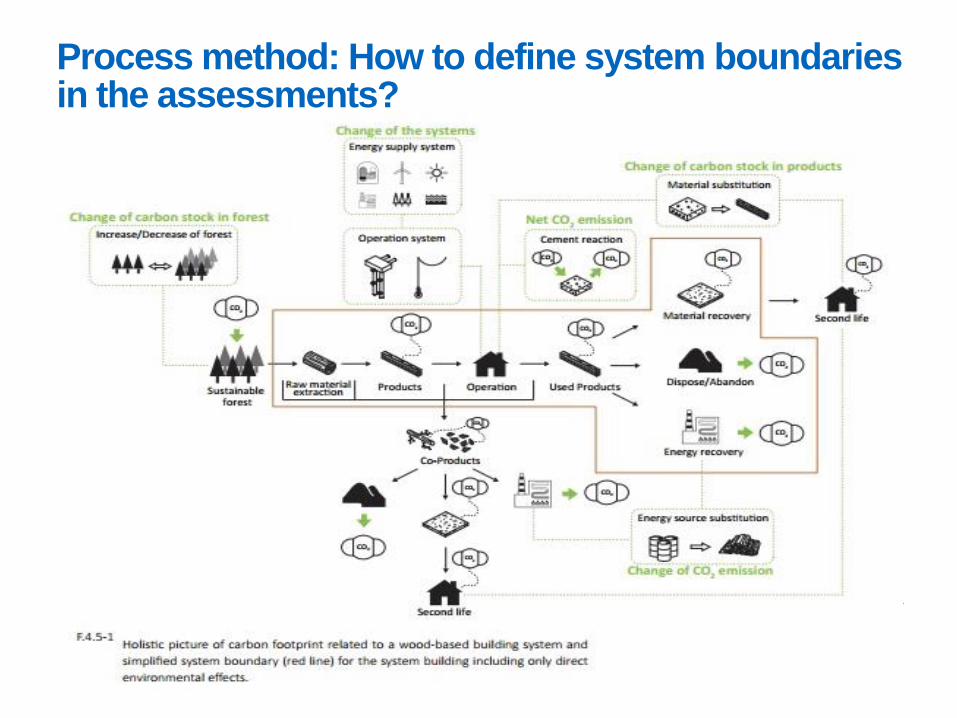
Process method: How to define system boundariesin the assessments?

Croissant example – 1/5
Step I – Building a process map
1. Define the functional unit
• the appropriate functional unit is driven by how the product is typically consumed (e.g. one 100 g croissant or tonne of croissants)
2. List the ingredients and proportions
• Flour (wheat) – 60%
• Water – 20%
• Butter – 15%
• Other (e.g. yeast) – 5%
• Packaging material (film and secondary packaging)
Guide to PAS 2050 How to assess the carbon footprint of goods and services. Available at: http://aggie-
horticulture.tamu.edu/faculty/hall/publications/PAS2050_Guide.pdf

Croissant example – 2/5
3. List the activities involved in producing and consuming
croissants
• Produce and transport raw materials- Grow and transport wheat; mill into flour
- Supply water
- Produce milk; manufacture butter
- Produce other ingredients
- Produce film packaging
• Manufacture and package croissants
• Distribute finished product
• Retail
• Use (eat)
• Dispose of waste
4. Reflect on what might have been missed

Croissant example – 3/5
Step II – Checking boundaries and
prioritisation
• Which life cycle stages, inputs and outputs should be included in the
assessment
• What not to include:
• Immaterial emissions sources (less than 1% of total footprint)• water supply, storage and retail
• Human inputs to processes
• Transport of consumers to retail outlets
• Animals providing transport

Croissant example – 4/5
Step III – Collecting data
• Two types of data are necessary to calculate a carbon footprint:
• Activity data
• Emission factors
• Activity data refers to all the material and energy amounts involved in
the product’s life cycle (material inputs and outputs, energy used,
transport, etc.)
• Emission factors provide the link that converts these quantities into
the resulting GHG emissions: the amount of greenhouse gases emitted
per ‘unit’ of activity data (e.g. kg GHGs per kg input or per kWh energy
used).

Croissant example – 5/5
Step IV –Calculating the footprint
• Carbon footprint of a given activity =
Activity data (mass/volume/kWh/km) × Emission factor (CO2e per unit)
• Simple Flour transport example:
Emissions = 1 kg /
km
Distance = 200 km
Emissions per
trip = 200 kgX
Tonnes flour per
trip = 20
Tonnes flour per
tonne croissants =
0.7
Emissions per
tonne flour = 10 kg÷
Emissions per tonne
croissants = 7 kgX
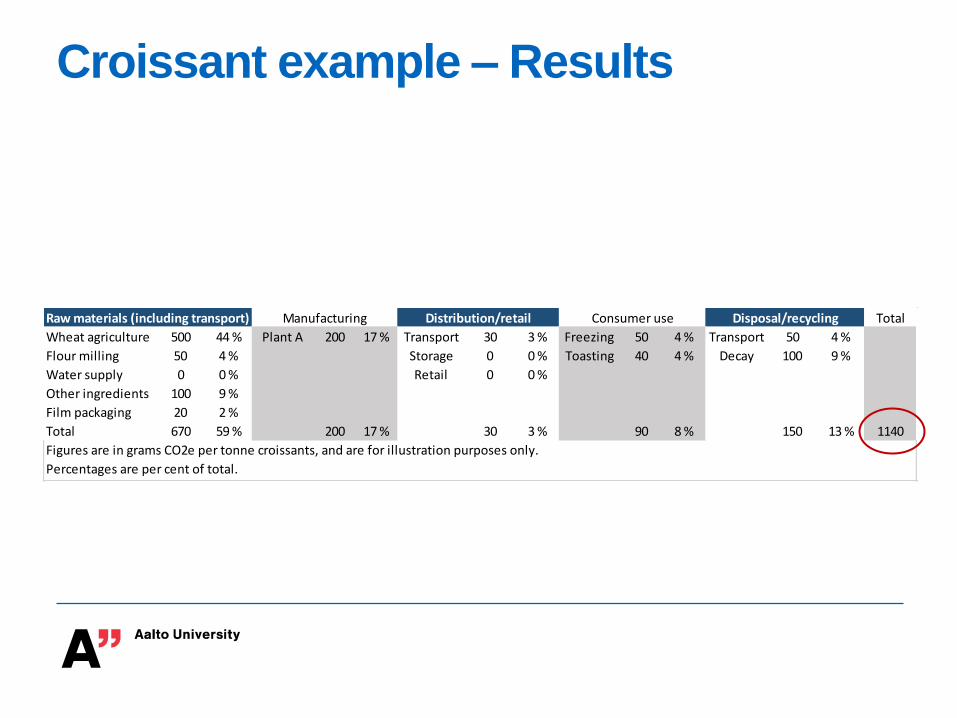
Croissant example – Results
Total
Wheat agriculture 500 44 % Plant A 200 17 % Transport 30 3 % Freezing 50 4 % Transport 50 4 %
Flour milling 50 4 % Storage 0 0 % Toasting 40 4 % Decay 100 9 %
Water supply 0 0 % Retail 0 0 %
Other ingredients 100 9 %
Film packaging 20 2 %
Total 670 59 % 200 17 % 30 3 % 90 8 % 150 13 % 1140
Raw materials (including transport) Manufacturing Distribution/retail Consumer use Disposal/recycling
Figures are in grams CO2e per tonne croissants, and are for illustration purposes only.
Percentages are per cent of total.

Raw Material
Production and
Transport
Product
Production and
Transport
Construction
Phase
Use, Maintenace,Repair and Operational
Phases
Demolition
and Waste
Processing
and Disposal
Phases
Estimation Phases in Buildings

STANDARD MATERIAL EMISSIONS
Input-Output method to analyze carbonfootprint
• A top-down approach
• Use of carbon intensities, measured in kilograms of carbon
dioxide per money spent, to assign footprint to a product
based on the price of the product
• The method uses information about industry transactions
• Purchases of materials by one industry from other industries
• Information about direct environmental emissions of industries
• The model is based on sector averages
• Cannot handle any product specific data

Allocation of emissions to products throughfinancial transactions between industries
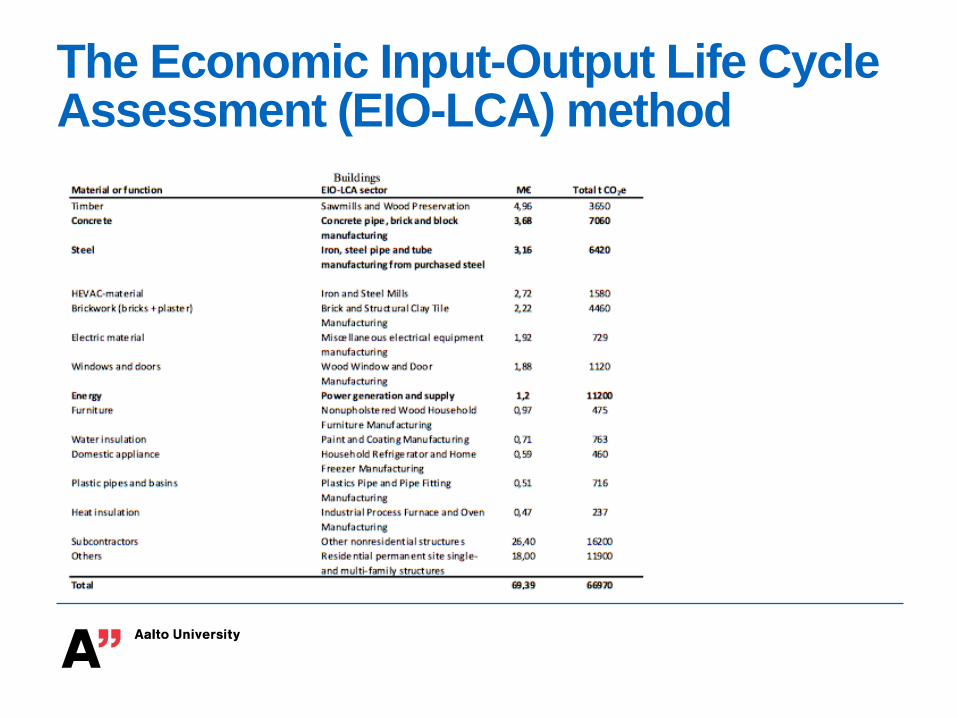
The Economic Input-Output Life Cycle Assessment (EIO-LCA) method
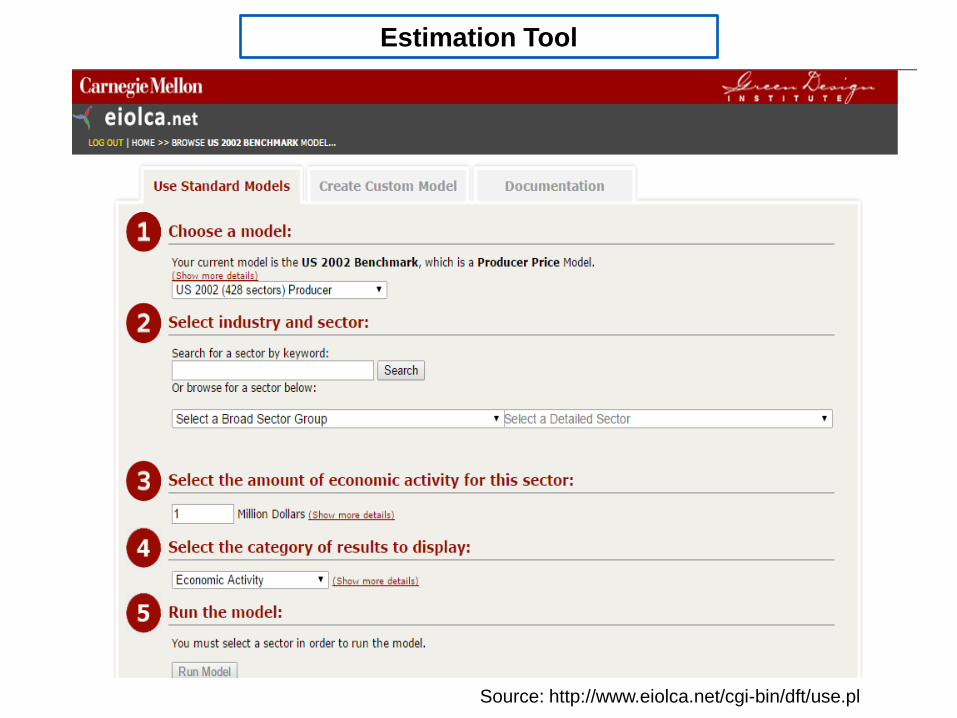
Estimation Tool
Source: http://www.eiolca.net/cgi-bin/dft/use.pl
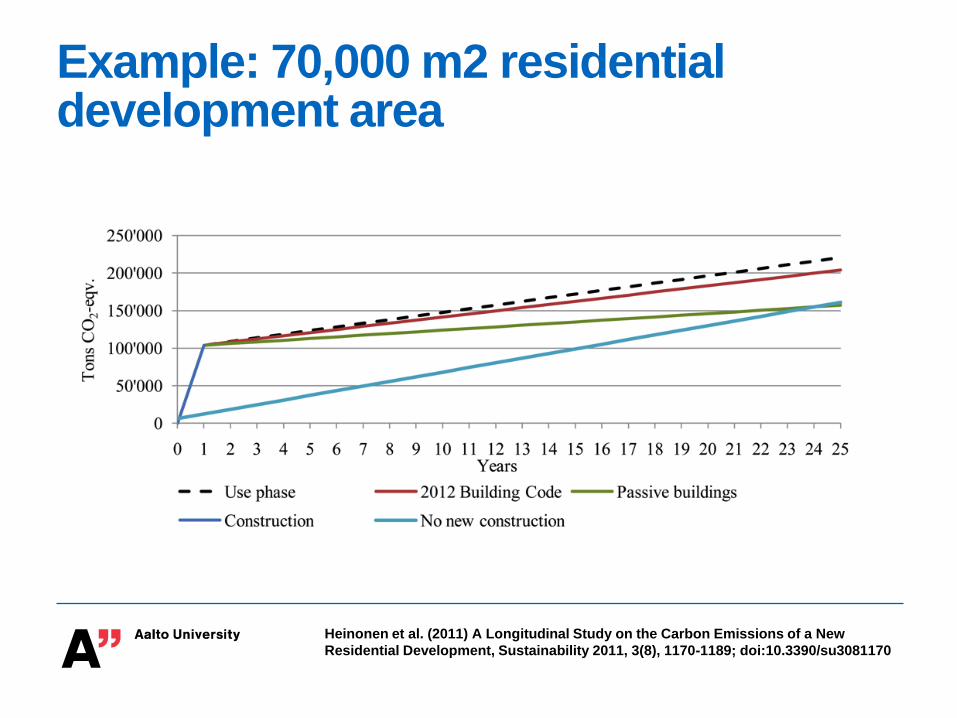
Example: 70,000 m2 residential development area
Heinonen et al. (2011) A Longitudinal Study on the Carbon Emissions of a New
Residential Development, Sustainability 2011, 3(8), 1170-1189; doi:10.3390/su3081170

CO2 and fossil fuel savings of wood products compared to steeland concrete building components
Chadwick Dearing Oliver, Nedal T. Nassar, Bruce R. Lippke & James B. McCarter (2014) Carbon,
Fossil Fuel, and Biodiversity Mitigation With Wood and Forests, Journal of Sustainable Forestry,
33:3, 248-275, DOI: 10.1080/10549811.2013.839386

Green Feature
Manufacturing Process Building operations Waste Management
Waste reduction
Pollution Prevention
Recycled materials
Embodied Energy
Reduction
Natural Materials
Energy Efficiency
Water Treatment &
Conservation
Nontoxic
Renewable Energy
Source
Longer Life
Biodegradable
Recyclable
Reusable
Others
Methods to reduce carbon footprint
Strategies adopted to reduce GHG emissions during construction
• Reduce quantity of materials used
• Select materials with low emissions factors associated
• e.g. recycled materials
• Select materials suppliers as close as possible from the
construction site
• Divert demolition wastes to recycling instead of landfills or
incineration

Examples: Material emissions

Summary of the topic
• Role of buildings in producing and reducing GHG emissions
• Role of operation / use phase as source for emissions in
built environment
• Calculation methods:
1. Process method
2. Input-output method

Further readings
Säynäjoki, A. (2014) How Does the Construction of a Residential Area
Contribute to Climate Change? Doctoral diessertation, Aalto University
publication series.
Barnett, R. W. Barraclough, V. Becerra, S. Nasuto. A comparison of
methods for calculating the carbon footprint of a product. Available at:
https://www.reading.ac.uk/web/FILES/tsbe/Barnett_TSBE_Conference_Pa
per_2012.pdf
Guide to PAS 2050 How to assess the carbon footprint of goods and
services. Available at: http://aggie-
horticulture.tamu.edu/faculty/hall/publications/PAS2050_Guide.pdf

Lifecycle costanalysis

What does ownership really cost?30-year life of classroom
Source: http://valuesinarchitecture.blogspot.fi/2011/03/what-does-your-building-really-cost.html

The hidden costs of buildings
The Client
Land costDesign fees
Construction costs
Maintenance costs Refurbishment costs
InsurancesStaff costs Water/waste
water chargesFurnishing
Energy/fuel costs
Security Taxation Cleaning costs Finance
Management
and administration
Initial capital costs
Operation and
maintenance
costs
Life cycle cost analysis (LCC)
• Life cycle costing (LCC) is the process of
economic analysis
• to assess the total cost of ownership of a product,
• including its cost of production, installation, operations, maintenance, conversion, and/ordecommission.

Cost elements in LCC
• For a building, there are several cost elements:
1. Initial Cost
2. Energy & Water Costs
3. Operation, Maintenance & Repair Cost
4. Replacement Cost
5. Other Costs (e.g. taxes)
6. Residual Value
• The identification of cost elements and their sub-divisions are
based on the purpose and scope of the LCCA

LCC impact and analysis of differentbuilding sub-systems
III
III IV
Po
ten
tia
lL
CC
im
pa
ct
Simple analysis Complex analysis
High
Low
Structural systems
Electrical systems
Mechanical
systems
Building envelope
Energy systems Siting / massing
Source: https://lbre.stanford.edu/sites/all/lbre-shared/files/docs_public/LCCA121405.pdf

Steps for calculating LCC
1. Identify alternatives
2. Define cost element categories
3. Determine time for each cost element
4. Estimate value of each cost element
5. Calculate net present value (NPV) of each cost
element, for every year (over its time period)
6. Calculate LCC by adding all cost elements, at
every year
7. Analyze the results
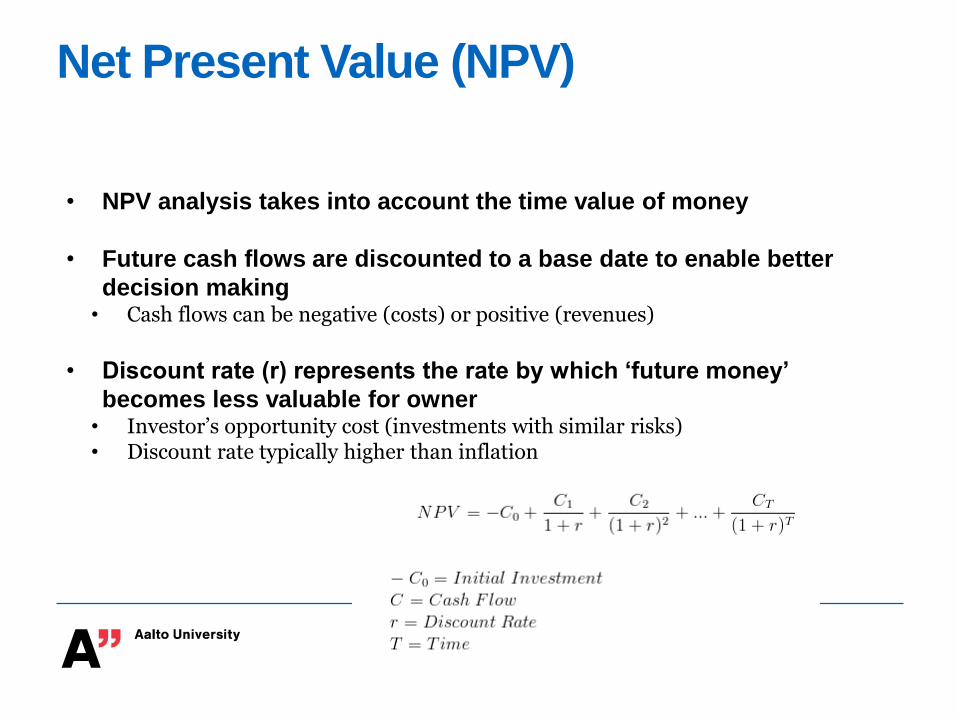
Net Present Value (NPV)
• NPV analysis takes into account the time value of money
• Future cash flows are discounted to a base date to enable better
decision making• Cash flows can be negative (costs) or positive (revenues)
• Discount rate (r) represents the rate by which ‘future money’
becomes less valuable for owner• Investor’s opportunity cost (investments with similar risks)• Discount rate typically higher than inflation

51Source: Means Life Cycle Costing For Facilities
Initial Cost – Office Building - $100 / SF
Uniformat Categories:
01 Foundation
02 Substructure
03 Superstructure
04 Exterior Closure
05 Roofing
06 Interior Construc.
07 Conveying System
08 Mechanical:
Plumbing
HVAC
Fire Protection
09 Electrical
11 Equipment
12 Sitework 4%
16%
3%
12%
4%
1%
15%
5%
5%
3%
3%
17%
12%
5% 10% 15% 20%
% of Total Building Cost

52Source: Means Life Cycle Costing For Facilities
Uniformat Categories:
01 Foundation
02 Substructure
03 Superstructure
04 Exterior Closure
05 Roofing
06 Interior Construc.
07 Conveying System
08 Mechanical:
Plumbing
HVAC
Fire Protection
09 Electrical
11 Equipment
12 Sitework
$10$8$4$2 $12 $14 $16 $18 $20$6
Life Cycle Cost – Office Building - $200 / SF
Life Cycle Cost – Present Value $ / ft2
Initial Cost Operational Cost
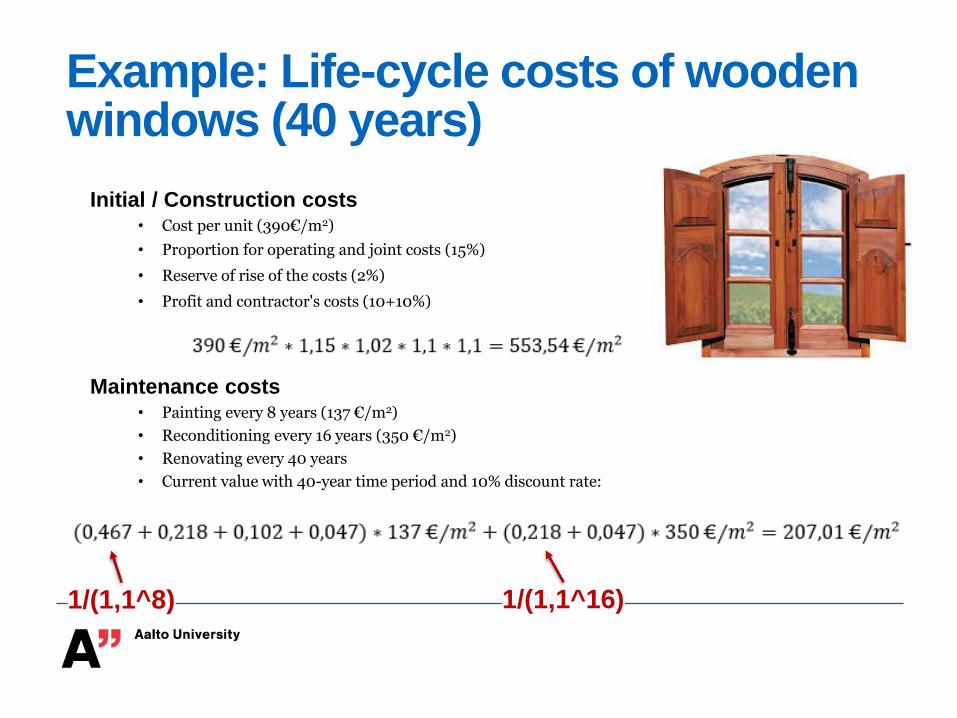
Example: Life-cycle costs of wooden windows (40 years)
Initial / Construction costs• Cost per unit (390€/m2)
• Proportion for operating and joint costs (15%)
• Reserve of rise of the costs (2%)
• Profit and contractor's costs (10+10%)
Maintenance costs• Painting every 8 years (137 €/m2)
• Reconditioning every 16 years (350 €/m2)
• Renovating every 40 years
• Current value with 40-year time period and 10% discount rate:
1/(1,1^8) 1/(1,1^16)
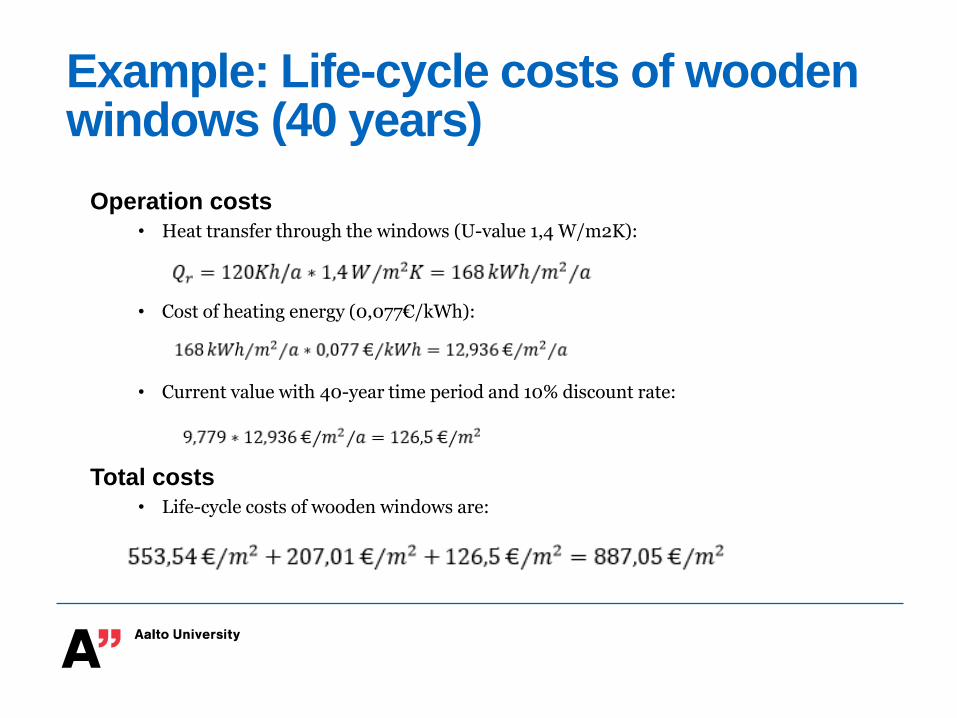
Example: Life-cycle costs of wooden windows (40 years)
Operation costs• Heat transfer through the windows (U-value 1,4 W/m2K):
• Cost of heating energy (0,077€/kWh):
• Current value with 40-year time period and 10% discount rate:
Total costs• Life-cycle costs of wooden windows are:

Quality management

Quality is not only luxury goods
Quality ~
”fitness of the product or service to the customers’ requirements”
”sum of attributes for a product or service that enables it to meet
the requirements or specified need of the customer”
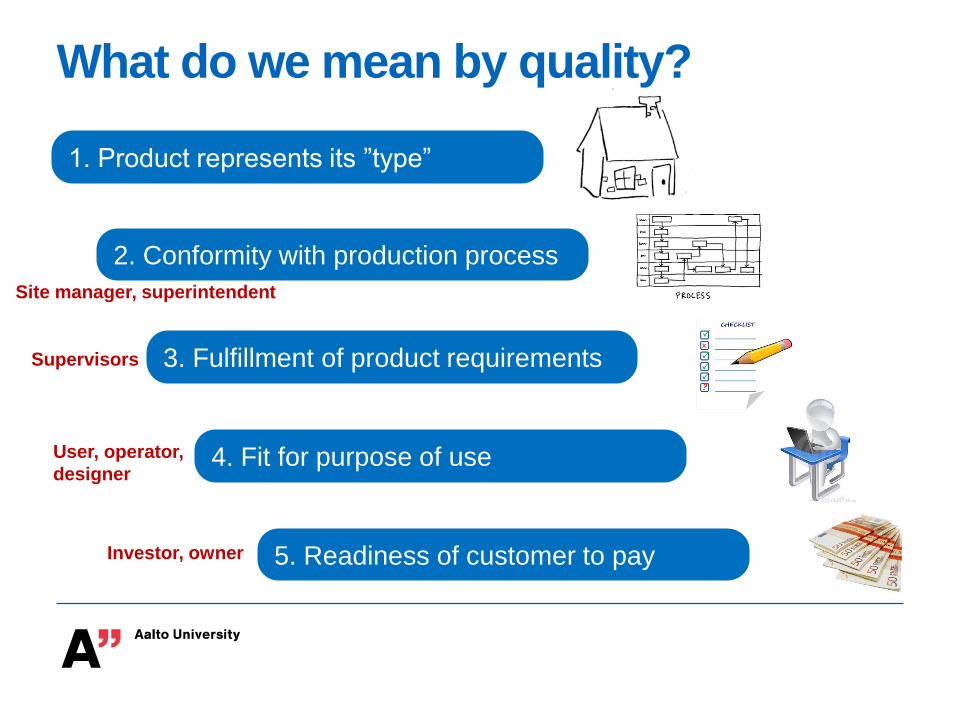
What do we mean by quality?
1. Product represents its ”type”
2. Conformity with production process
3. Fulfillment of product requirements
4. Fit for purpose of use
5. Readiness of customer to payInvestor, owner
User, operator,
designer
Supervisors
Site manager, superintendent

Implications from quality in manufacturing and services
• Construction is not purely any of those, options:
→ Moving toward more customer-focused service business: understand better
the use of building and of which customers are ready to pay
→ Moving toward more process-centered and standardized production:
decrease variation and waste in processes
ServicesTypically better
customer value and
satisfaction than in
manufacturing
Manufacturing typically better control
of processes and
product characteristics
than in services

Quality management in transition
1. Quality control and
inspections
2. Quality assurance
3. Total quality
management (TQM)
4. Quality management
systems
”Reacting to the
outcomes of site
activities”
”Strategic
business function
of companies”
This is minimum
activity from client!
This should be
minimum activity
from contractor!
”Effort toward a permanent climate in
which an organization continuously
improves its ability to deliver high-
quality products and services”
”Preventing defects in
products and avoiding
problems”, standard
processes

Understanding Wide Quality in Construction Industry
Quality of Planning Value in Use
DEMAND: What customer needs, wants?SUPPLY: What is possible?
EFFECTSVALUE
Wide quality: realization of desired effects
PLAN & DESIGN
REALIZED OUTPUT
CONSTRUCTIONPROCESS
Narrow quality:correctness
Process quality ≈efficiency
Tools and practices:
Communication platforms
Visualization
After sale operations
User communitiesEducation
Checklists Six Sigma Tools
Error ReportsModeling

Quality management practices in construction• Client sets quality requirements for end-product and construction
processes
• References to general quality requirements, e.g. RYL 2010
• Authorities set general quality requirements: e.g. personnel
qualifications, needed reviews & inspections
• Kick-off meeting, inspection book, quality assurance report
→ Designers design according to requirements
→ Contractor plans practices to ensure that requirements for processes
and end-product are fulfilled
• Detailed drawings work as ”communication tools” between
requirements and contractor:
• Locations, measurements, tolerances, materials, visual quality, connections…
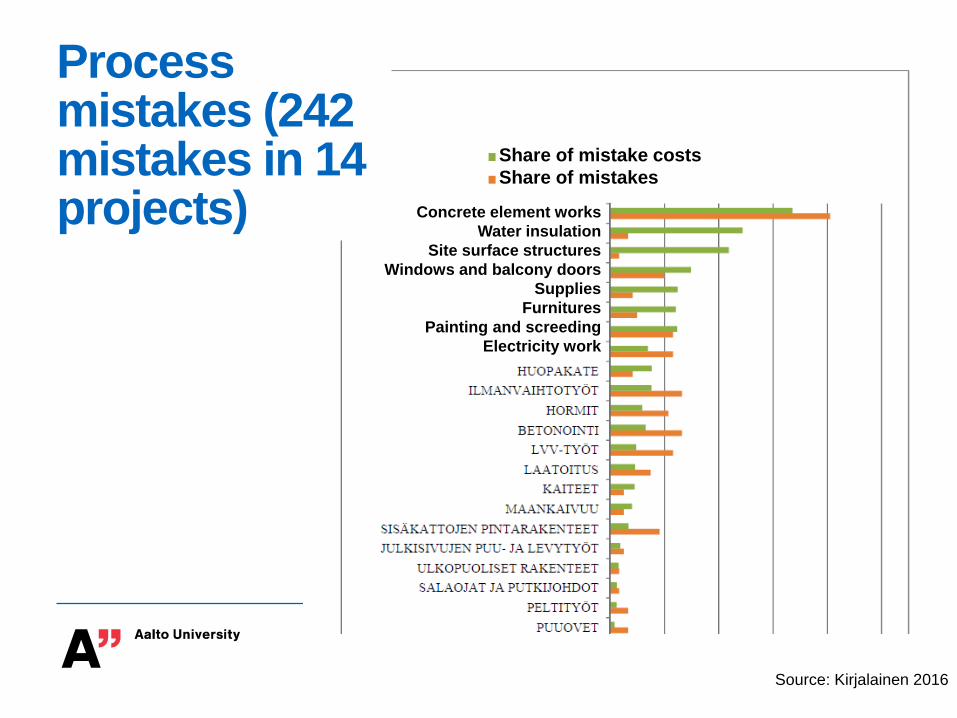
Processmistakes (242 mistakes in 14 projects)
Share of mistake costs
Share of mistakes
Concrete element works
Water insulation
Site surface structures
Windows and balcony doors
Supplies
Furnitures
Painting and screeding
Electricity work
Source: Kirjalainen 2016

Human reasons behind mistakes
Share of mistake costs
Share of mistakes
Source: Kirjalainen 2016

How customer can ensure good quality?
• Developing trust, continuous collaboration and communication
between customer, designers and contractors
• Smooth and systematic information flow about quality requirements
and project decisions between customer, project manager, designers,
contractor, sub-contractors and workers
• Problems related to missing or incorrect information are removed effectively
• Division of responsibilities and duties is clear among actors
• Customer and project manager ensure that premises for good quality
exist:
• Inform about decisions, design documents are timely delivered to contractor, design documents are checked and fit between documents is ensured, materials from customer are delivered timely
→ LEAN CONSTRUCTION!

Quality assurance practices of contractor
• Documented responsibilities and duties
• Documents about quality requirements and analysis of
potential quality problems
• Kick-off meeting with sub-contractors and workers
• Workstation handover with previous workers
• Model work
• Inspection after first job
• Spot checks
• Tests and examinations
• Self handover

Handover process – example of a residential building
Task Week 1 Week 2 Week 3 Week 4 Week 5Self handover
Functional examinations - contractors
Functional examinations - designers
Elevator inspection
Electricity inspection
Shelter inspection
Ventilation inspection
Water and drain inspection
Heating system inspection
Fire safety inspection
Pre-inspection of building authorities
Repair work
Final inspection of building authorities
Pre-inspection of residents
Repair work
Post-inspection of residents
Handover of interiors to customer
Move of residents

Health & Safety as part of quality in construction• Focus on people on-site instead of product
• Customer’s / Project manager’s liabilities
• Safety coordinator, safety documents• Abnormal dangers and harms, safety instructions, person identification
system, pass
• Contractor’s liabilities
• Safety control and management on site
• Evaluation of specific safety risks• Material handling, detonation, excavation, abutments, traffic, fall
protection, use of large equipment, large element assembly, power cables…
• Orientation, inspections
• TR metric ® for evaluating safety in construction site
• Categories: 1) workers; 2) scaffolds/bridges/ladders; 3) equipment; 4) fall protection; 5) electricity/lightning; 6) ordering/cleanliness/waste/dust
• Simple correct – incorrect evaluation (max 100%), done e.g. weekly
• Accidents / 1M working hours

Summary
• Describe and apply life-cycle analysis methods
• Describe and apply life-cycle cost analysis method
• Describe different definitions for quality in construction
• Describe quality and safety management methods and
practices