liberty lake source trace study reportbusiness visit techniques before continuing our source tracing...
TRANSCRIPT

Liberty Lake Source Trace Study Regarding PCB, PBDE, Metals, and Dioxin/Furan
A Pilot Project for Spokane Basin Source Tracing
October 2010, revised October 2012
Publication No. 10-04-027

Publication and Contact Information
This report is available on the Washington State Department of Ecology‟s website at
www.ecy.wa.gov/biblio/1004027.html
Data for this project are available at Ecology‟s Environmental Information Management (EIM)
website www.ecy.wa.gov/eim/index.htm. Search User Study ID, SRUW-Liberty Lake.
For more information contact:
Arianne Fernandez
Hazardous Waste and Toxics Reduction Program
Department of Ecology
4601 N Monroe, Spokane, WA 99205
Phone: (509) 329-3498
Washington State Department of Ecology - www.ecy.wa.gov/
o Headquarters, Olympia (360) 407-6000
o Northwest Regional Office, Bellevue (425) 649-7000
o Southwest Regional Office, Olympia (360) 407-6300
o Central Regional Office, Yakima (509) 575-2490
o Eastern Regional Office, Spokane (509) 329-3400
Any use of product or firm names in this publication
is for descriptive purposes only and
does not imply endorsement by the author
or the Washington State Department of Ecology.
To ask about the availability of this document in a format for the visually impaired, call the Hazardous
Waste and Toxics Reduction Program at 360-407-6700. Persons with hearing loss can call 711 for
Washington Relay Service. Persons with a speech disability can call 877-833-6341.

Liberty Lake Source Trace Study
Regarding PCB, PBDE,
Metals, and Dioxin/Furan
A Pilot Project for
Spokane Basin Source
Tracing
by
Arianne Fernandez
Hazardous Waste and Toxics Reduction Program Washington State Department of Ecology
Olympia, Washington
Waterbody Number(s): WA-57-9010

This page is purposely left blank

Page i
Table of Contents
List of Figures and Tables................................................................................................... ii
Abstract .............................................................................................................................. iv
Acknowledgements ............................................................................................................ iv
Introduction ..........................................................................................................................1 Study Design ..................................................................................................................2 Study Area .....................................................................................................................3 Background – The Bigger Picture..................................................................................4
Spokane River/Spokane Valley-Rathdrum Prairie Aquifer ..................................4
Contaminants of Concern ......................................................................................5
Methods................................................................................................................................7
Field Sampling ...............................................................................................................7 Wastewater System ...............................................................................................9
Stormwater System ..............................................................................................10 Business Visits .............................................................................................................11
Laboratory Analysis .....................................................................................................11 Data Quality .................................................................................................................12
Laboratory Quality Control .................................................................................13
Field Quality Control ...........................................................................................14
Results and Discussion ......................................................................................................17
Conventional Parameters .............................................................................................17
PBDE ...........................................................................................................................20
PCB ..............................................................................................................................23 Dioxin/Furan ................................................................................................................29
Priority Pollutant Metals ..............................................................................................30 Phosphorus ...................................................................................................................34 Business Visits .............................................................................................................34
Conclusions ........................................................................................................................34
Recommendations ..............................................................................................................36
Source Identification ....................................................................................................36 General Recommendations ..........................................................................................37
References ..........................................................................................................................38
Appendices Appendix A. Glossary, Acronyms, Abbreviations, and Units of Measurement ...... A-1 Appendix B. Figures .................................................................................................B-1 Appendix C. Contaminant Data ................................................................................C-1

Page ii
List of Figures and Tables
Figures
Figure 1. Liberty Lake study area ..............................................................................................3
Figure 2. Middle Spokane Watershed land use ..........................................................................4
Figure 3. Storm-drain sediment results for PBDE in µg/Kg dw ..............................................21
Figure 4. PBDE results in stormwater ......................................................................................23
Figure 5. Wastewater results for PBDE ...................................................................................23
Figure 6. Percent contribution pattern of PCB congener homologue groups per site
for stormwater and storm-drain sediment .................................................................25
Figure 7. Comparison of stormwater and wastewater results for PCB homologue
groups ........................................................................................................................27
Figure 8. Comparison of the percent PCB homologue groups contributing to a
sample of stormwater or wastewater.........................................................................28
Figure 9. Total recoverable metal concentrations in storm-drain sediment .............................31
Figure 10. Total recoverable zinc concentrations in storm-drain sediment ...............................31
Figure 11. Total recoverable metals data for stormwater ...........................................................32
Figure 12. Total recoverable zinc concentrations in stormwater ...............................................32
Figure 13. Comparison of old residential versus new residential metals
concentrations. ..........................................................................................................33
Figure 14. Total recoverable metal results for wastewater samples...........................................33
Figure 15. Total recoverable zinc and copper results for wastewater samples ..........................34
Figure B-1. Wastewater sampling locations...............................................................................B-1
Figure B-2. Drainage area of piped stormwater system in Liberty Lake study area ..................B-2
Figure B-3. Stormwater sampling subbasins ..............................................................................B-3
Figure B-4. WestLL storm-drain sampling locations for Zone 1 (Z1) and Zone 2 (Z2) ............B-4
Figure B-5. WestLL storm-drain sampling locations for Zone 3 (Z3) .......................................B-5
Tables
Table 1. Actual sample locations, purpose, and parameters measured .....................................8
Table 2. Analytical methods, reporting limits, and holding times ..........................................12
Table 3. Field quality control blank samples and the associated data flagged .......................15
Table 4. Field quality control replicate samples and percent RPD .........................................16
Table 5. Range of concentrations found in stormwater, wastewater, and sediment ...............17
Table 6. Grain size, total solids, and TOC results for storm-drain sediment
composites (%)..........................................................................................................18
Table 7. Stormwater results for conductivity, TOC, DOC, TDS, TSS, and turbidity in
mg/L except where noted ..........................................................................................18
Table 8. TOC, DOC, TSS, and TDS concentrations for wastewater pipe samples
in mg/L ......................................................................................................................19
Table 9. TOC, DOC, TSS, and TDS concentrations for LLSWD wastewater
treatment plant influent 12-hour composite samples in mg/L ..................................19
Page iii
Table 10. LLSWD wastewater treatment plant pH, DO, temperature and flow averages
for December 10 and 11, 2008 ..................................................................................19
Table 11. PBDE values by matrix .............................................................................................20
Table 12. Total PBDE storm-drain sediment results, percent fines, and percent TOC ............21
Table 13. Storm-drain sediment results for PCB in µg/Kg dw .................................................24
Table 14. Stormwater results for PCB in pg/L..........................................................................25
Table 15. Wastewater results for PCB in pg/L ..........................................................................26
Table 16. Dioxin/Furan results for the Liberty Lake study area ...............................................29
Table C-1. Total recoverable metal results for storm-drain sediment in mg/Kg DW ..............C-1
Table C-2. Total recoverable metal results for wastewater in µg/L .........................................C-1
Table C-3. Total recoverable metal results for stormwater in µg/L .........................................C-1
Table C-4. PBDE storm-drain sediment composite results for WestLL in µg/Kg DW.
Those values qualified as U or UJ are not reflected in calculated totals ................C-2
Table C-5. PBDE stormwater results in µg/L ...........................................................................C-2
Table C-6. PBDE results for LLSWD wastewater treatment plant influent 12-hour
composite samples and in-line wastewater samples in µg/L ..................................C-3
Table C-7. PCB results..............................................................................................................C-4
Table C-8. Dioxin/Furan 17 co-planar congener results and TEQ calculations .....................C-10
Table C-9. Total phosphorus results from stormwater ...........................................................C-11
Table C-10. Total phosphorus results from wastewater ...........................................................C-11

Page iv
Abstract
This report describes the results of the toxics trace pilot study in the Liberty Lake study area and
the next steps for source tracing in the Spokane River Watershed. The results of this pilot study
will help us identify and eliminate the sources of contaminants of concern (CoC) in the Spokane
River. The following CoC were identified by Ecology‟s Environmental Assessment Program as
high priority: polychlorinated biphenyls (PCB), polybrominated diphenyl ethers (PBDE),
dioxin/furan, and select metals (lead, cadmium, zinc).
The goals of this study include:
1. Determining the urban “background” concentration range of CoC from wastewater and storm
systems with no apparent industrial point source. For the purpose of this study, background
is defined as the urban concentrations of CoC where no known point source exists.
2. Beginning to identify and distinguish between point and non-point sources that contribute
CoC to the Spokane River and Spokane Valley-Rathdrum Prairie Aquifer.
3. Evaluating the pilot study‟s feasibility as an approach for further source tracing in the
Spokane basin.
Our sample size and localized area allowed us to tentatively identify urban background
concentrations from wastewater and storm systems. It did not, however, allow us to make a
statistical determination. The results of this study helped Ecology understand the movement of
the CoC within wastewater and stormwater systems and confirmed the studies feasibility.
Acknowledgements
The author would like to thank the following people for their contribution to this study:
Liberty Lake Sewer and Water District
Spokane County
Homeowners association
Washington State Department of Ecology staff:
o Ted Hamlin, for project support and report review.
o Manchester Environmental Laboratory staff, for data quality review.
o Dave George, Jim Ross, Damon Delistraty, Randy Coots, Elaine Snouwaert, Lisa Brown,
Dave Knight, Dave Duncan, Dave Moore, Karin Baldwin, Jim Bellatty, Lori Rodriguez,
and Jim Maroncelli, for report review.
Page 1
Introduction
In 2007, the Washington State Legislature passed the Urban Waters Initiative. Ecology received
funding under the Urban Waters Initiative to investigate and clean up three waterways in the state,
including the Spokane River. The purpose of the Spokane River Urban Waters Initiative is to find
and eliminate sources of the following contaminants identified as high priority contaminants of
concern (CoC):
Polychlorinated biphenyls (PCB)
Polybrominated diphenyl ethers (PBDE)
Dioxin/furan
Metals (lead, cadmium, zinc)
These priority CoC are described in greater detail in a later section of this report.
Ecology‟s Eastern Regional Office formed a cross-program team to develop a strategy for
understanding and eliminating toxics found in the Spokane River. Participating programs include
the Water Quality Program, Hazardous Waste and Toxics Reduction Program, and Toxics Cleanup
Program.
More than two decades of documentation exists for contamination of the Spokane River with
polychlorinated biphenyls (PCB), toxic metals, and other chemicals (e.g., Hopkins et al., 1985;
Ecology, 1995; Jack and Roose, 2002). The Spokane River has elevated concentrations of PCB and
dioxin/furan as indicated by a series of Ecology sponsored technical reports completed in 2006
(Serdar and Johnson, 2006b; Parsons and Terragraphics Inc 2007). In addition, concentrations of
PBDE in fish were highest in the Spokane River according to a statewide study of ten rivers and ten
lakes across the state (Johnson et al., 2006).
The Spokane River carries historic mining waste that includes heavy metals such as cadmium, lead,
and zinc. Recently, Ecology detected these contaminants in stormwater systems that discharge to
the Spokane River (Parsons and Terragraphics Inc 2007). To find out whether metals from the
Coeur d‟Alene Basin Superfund site were adversely affecting the aquifer‟s water quality, the United
States Geological Survey (USGS) investigated the movement of select metals between the aquifer
and river. They concluded wells near the river are not currently at risk for elevated metals from the
Coeur d‟Alene Basin Superfund site. Similar ion concentrations in the ground and surface water
confirm the groundwater-surface water exchange; however, metals concentrations did not indicate
an adverse affect to ground-water quality (USGS 2003).
The limited data collected to date indicates the city of Spokane to be a major contributor of some of
the CoCs to the Spokane River (Ecology 2007). Unfortunately, the city of Spokane has an old,
complicated storm and wastewater system. This makes it difficult to trace source contamination
through system sampling.
Before we could investigate sources in the city of Spokane, the following needed to occur:
1. A better understanding of the storm and wastewater collection systems‟ structure.

Page 2
2. Ecology needed to complete analysis of PBDE and dioxin/furan in stormwater and sediment
collected at river outfalls during 2006. The analysis will help determine the relative
contribution of PBDE and dioxin/furan from stormwater to the river.
3. Refining collection methods in a pilot study.
With these steps completed, we will then be able to use our resources in the city effectively.
The Liberty Lake study area is a set of several smaller watersheds (or catchments) within the
Spokane River Watershed (Spokane Basin). It does not have any known historic or current
industrial point sources of the organic contaminants of concern; however, the waterbody within the
study area, Liberty Lake, is on the 303d listing for PCB in fish tissue. This is not a unique situation.
At least three other lakes within the Spokane Basin are listed on the 303d list for PCB without any
known sources.
The area around all four of the lakes is urbanized. Because of this, the Liberty Lake system was an
ideal starting point for understanding background1 concentrations of these contaminants in urban
storm and wastewater systems. It also allowed us to evaluate and improve our sampling and
business visit techniques before continuing our source tracing efforts in the larger and more
complex city of Spokane system.
Study Design The primary goals of this study included:
Determine the background1 concentration of the CoCs from wastewater and storm systems with
no apparent industrial source.
Begin to identify and distinguish between point and non-point sources that contribute CoCs to
the Spokane River and Spokane Valley-Rathdrum Prairie Aquifer.
Begin to determine the general difference between residential versus business contributions.
Secondary goals include:
Evaluate the pilot study‟s feasibility as an approach for further source tracing in the Spokane
Basin.
Determine if any of the additional ten priority pollutant metals (arsenic, silver, antimony,
beryllium, chromium, copper, mercury, nickel, selenium, thallium) are present at concentrations
of concern in the wastewater and stormwater runoff.
Determine sources of phosphorus discharge in the sub-basin that includes Liberty Lake.
The study area shown in Figure 1 was chosen for the pilot study because it met the following
criteria:
It is the furthest upstream source from the Idaho/Washington border.
1 For the purposes of this study, background means CoC concentrations from residential and industrial
systems with no known sources of CoC.

Page 3
The wastewater system is small, discrete, and well known.
There are stormwater conveyance systems that will provide us data on residential contribution.
There are new and old community wastewater piping constructed of different material we can
isolate and look at more closely.
There are a variety of facility types that will provide an adequate representation sample of
contaminant contributions from industry that are not known to discharge our CoCs.
The need for an additional criterion became apparent at the beginning of the study when we
discovered the stormwater collection system needed to be mapped. This assisted with our
development of GIS mapping and analysis skills. Understanding hydrology from a spatial
perspective is crucial in determining trends and other patterns that assist with source tracing.
Study Area The Liberty Lake study area is defined
below for the purpose of this study only
(Figure 1). The study area is bounded by
Spokane River to the north, Kramer Hill
to the east, Liberty Lake Regional Park to
the south, and Carlson Hill to the west.
This includes all tributary basins that
drain into Liberty Lake and the plateau
that infiltrates to the aquifer.
The geology includes hills of basalt and
granite bedrock on the south end that then
flattens out to a plateau composed of sand
and gravel to the north. It is part of the
Middle Spokane Watershed, which is a
sub-watershed within the Spokane Basin.
Spokane County and the city of Liberty
Lake are the major land owners within the
study area. The city of Liberty Lake is
the only city within the study area and is
the first city the Spokane River flows past
once it crosses the Idaho-Washington
state line. The southern portion of the
study area, bounded by hills of basalt and
granite bedrock, directs surface water to
Liberty Lake. Liberty Lake and the
stormwater from the plateau infiltrate the
aquifer, which then discharges water to the Spokane River west of the city (USGS 2007).
Figure 1. Liberty Lake study area.

Page 4
The Liberty Lake Sewer and Water District (LLSWD) provides the majority of the public water for
the city of Liberty Lake and operates the city‟s sole wastewater treatment plant. The plant collects
and treats wastewater from industrial, commercial, and residential sources.
The LLSWD encompasses approximately 5,000 acres. The collection system contains structures of
various materials from brick and clay to polyvinyl chloride. Its design allowed us to isolate the
wastewater from new and old residential communities as well as industrial.
The city‟s stormwater management system is not connected to the city wastewater treatment
system. The community relies on strategically situated drywells for stormwater runoff
management. Any business or homeowner construction projects must provide individual drywells
to drain stormwater from their property.
The stretch of the Spokane River bordering Liberty Lake is a losing reach, meaning that the river
feeds into the aquifer (USGS 2007). This indicates pollution would flow from the river to the
aquifer within our study area. This does not relieve the area of pollution control concerns because
there is a potential for contamination to infiltrate into the aquifer, which flows in a westerly
direction and then recharges the river between the Sullivan Road USGS gauging station and the
Centennial Trail Bridge (USGS 2007).
Background – The Bigger Picture
Spokane River/Spokane Valley-Rathdrum Prairie Aquifer The Spokane River begins at Lake Coeur
d‟Alene in Idaho and flows 112 miles to the
Columbia River and Lake Roosevelt. Major
tributaries to the Spokane River include the
Little Spokane River and Hangman (Latah)
Creek.
The watershed is made up of forest, agriculture,
urban and range lands.
Agricultural lands lie primarily in the Lower
Spokane, Little Spokane and Hangman Creek
Watersheds.
The urban land use occurs mainly in the Middle
Spokane watershed, Water Resource Inventory
Area 57 (WRIA 57). This is primarily because
of the city of Spokane (Figure 2).
Figure 2. Middle Spokane Watershed land use.

Page 5
The Spokane Valley-Rathdrum Prairie Aquifer is a sole source aquifer that readily exchanges water
with the Spokane River. This increased concern for potential exchange of contaminants between
the two water sources (USGS 2003). Over the years, water pollution from a variety of sources
contributed to contaminating the river and aquifer. These contaminants of concern come from both
point and non-point sources. Point sources are direct discharges such as industrial wastewater from
a facility directly piped to a waterbody. Non-point sources are diffuse sources such as air
deposition and stormwater runoff.
Contaminants of Concern Polychlorinated Biphenyls (PCB) Polychlorinated biphenyls are a group of chlorinated aromatic hydrocarbons containing up to ten
chlorine atoms. There are 209 variations called congeners. The number and location of chlorine
atoms on the hydrocarbon ring dictates the behavior and toxicity of each congener in the
environment (ATSDR2 2000). Manufacturers would combine 40-70 congeners to produce aroclors
for various applications such as reducing transformer oil flammability. Due to increasing awareness
of their toxicity, the United States Environmental Protection Agency (EPA) banned the manufacture
of PCB in 1979. Chemical manufacturing currently produces some PCB as by-products (Panero et
al. 2005).
PCB enters the Spokane River from industrial discharges, wastewater treatment plants, stormwater,
local urban air deposition, and long-range air deposition in the Coeur d‟ Alene Basin. PCB from
mishandling transformers, caulking leachate, and other still unknown sources become mobile during
storm events and wash into the river. The Kaiser Trentwood aluminum plant is a well-known
historic source in the Spokane Valley. Since 1995, Kaiser has taken major steps to reduce PCB
concentrations in its wastewater. Kaiser and Inland Empire Paper each have a National Pollutant
Discharge Elimination System (NPDES) permit to manage their PCB-contaminated wastewater.
Ecology‟s Water Quality Program oversees these permits. The General Electric site was
contaminated with PCB, impacting the aquifer near the river (Serdar et al. 2006). Ecology‟s Toxic
Cleanup Program oversaw a 1999 cleanup of this site.
The Washington State Department of Health (WDOH) and the Spokane Regional Health District
(SRHD) currently have an advisory to avoid or limit consumption of fish in parts of the Spokane
River due to elevated PCB levels. The largest concentrations of PCB in fish or sediment have been
found between the Idaho border and Upriver Dam.
The ecological implications of PCB contamination in the Spokane River have been assessed by Art
Johnson (2001) from Ecology‟s Environmental Assessment Program. Johnson concluded there may
be adverse effects on the salmonid populations, fish-eating mammals, and benthic invertebrates
residing in the river reaches downstream of Kaiser. He did not find evidence of risk to fish-eating
birds. Johnson points out elevated concentrations of PCB in the fine-grained sediments between
Kaiser and Monroe Street Dam as one of the factors influencing his risk calculation for benthic
invertebrates. This includes the area behind Upriver Dam. In 2001, Ecology‟s Toxics Cleanup
Program placed a cap on the PCB-contaminated sediments behind Upriver Dam. This may to some
degree, have abated the risk to benthic invertebrates.
2 Agency for Toxic Substances and Disease Registry

Page 6
Polybrominated Diphenyl Ethers (PBDE) Polybrominated diphenyl ethers are chemical additives used as a flame retardant in everyday
household products. Studies indicate PBDE are building up in people‟s bodies, animals, and the
environment (Serdar and Johnson 2006b; Peele 2004, Johnson and Olson 2001, Johnson et al.
2006). There are no water quality or fish tissue standards for PBDE. Washington State had
concerns about increasing levels in the environment, bio-accumulative potential, and effects on
neurologic development and reproduction effects in laboratory animals. This prompted the State to
develop a plan to reduce PBDE inputs to the environment (Peeler 2004). Ecology recently
published data from ten rivers and ten lakes indicating that Spokane River fish tissue contains the
highest levels of PBDE of the 20 sites tested (Serdar and Johnson 2006b).
Three formulations of PBDE are in use. Each is a group of congeners at varying concentrations within
a similar homologue group. For example, the „PentaBDE‟ formulation tends to have congeners with
five bromine atoms. The three formulations, PentaBDE, OctaBDE, and DecaBDE, show different
levels of toxicity. Manufacturers voluntarily phased out PentaBDE and OctaBDE production. The
Ecology plan includes a ban on DecaBDE if a safe and effective alternative flame retardant is found.
PentaBDE was used in furniture and rigid insulation such as mattresses. OctaBDE was used in
high-impact plastics such as phones, automobile trim, and computers. DecaBDE is used in all the
above applications except mattresses and other materials such as draperies, cable insulation,
adhesives, and textile coatings (BSEF 2002, ATSDR 2004).
Dioxin and Furan As with the PBDE, we do not yet know the full extent of contamination or the sources of
dioxin/furan in the Spokane River. Nationwide, polychlorinated dibenzo-p-dioxin and
polychlorinated dibenzofuran (dioxin/furan) have been found in the air, soil, water, aquatic life,
food, and people. Chemical production can produce dioxin and furan as a by-product if a
halogenated substance is present. For example, dioxin and furan are inadvertently produced during
the manufacture of herbicides and paper products. The burning of municipal waste, sludge, medical
waste, and wood can produce these contaminants as an airborne particulate (Yake 2000).
Recent screening-level data suggest that dioxin/furan could merit further investigation in the
Spokane watershed. Ecology conducted fish sampling in the Spokane River in 2003. A single
rainbow trout fillet sample from the Nine Mile reach had a tetrachlorodibenzo-p-dioxin (2,3,7,8-
TCDD) toxic equivalents of 0.36 ng/Kg (Seiders et al., 2006, Seiders et al. 2007). By way of
comparison, the EPA National Toxics Rule human health criterion for dioxin/furan in fish tissue is
0.065 ng/Kg. Although the National Toxics Rule criterion is based on human health risks – one in a
million excess lifetime cancer risk – it is used to assess water quality violations. It is not a threshold
for issuing public-health fish consumption advisories.
Metals High levels of arsenic, zinc, lead, and cadmium contaminate much of the bottom sediments in the
Spokane River (Johnson and Norton, 2001). Ecology developed a total maximum daily load
(TMDL) in 1999 that limits zinc, lead, and cadmium discharges to the river (Pelletier, 1998). The
arsenic and lead concentrations prompted WDOH and SRHD to issue an advisory urging people to
reduce contact with shoreline sediments along parts of the river. In 2003, SRHD issued a sediment
advisory for lead and arsenic.

Page 7
Historic mining practices in Idaho‟s Coeur d‟Alene Basin contribute to the lead and zinc
concentrations in the river. The entire basin was designated a Superfund site in 1983 by EPA.
Although cleanup is occurring, recent river sampling at the Idaho-Washington border show that
dissolved zinc and particulate lead concentrations continue to exceed water quality standards. Fish
tissue analysis also showed high levels of lead, zinc, and cadmium from fish collected between the
Idaho-Washington border and Lake Spokane (Serdar 2006).
Wastewater and stormwater carry metals to the river as well. For example, zinc migrates into the
river during storm events when rain washes particulate into the storm drains from galvanized
buildings, stockpiles of galvanized metals, and tire wear from streets and parking lots.
Methods
This study took place according to the methods outline in the Sampling and Analysis Plan (SAP)
and Quality Assurance Project Plan (QAPP) for the Liberty Lake Source Trace Study Regarding
PCB, PBDE, Metals, and Dioxin/Furan (Fernandez and Hamlin, 2008). Deviations from the QAPP
are described and explained below.
Field Sampling The sampling plan included mapping the storm drain system to determine where to sample for
stormwater and storm-drain sediment. Completion of the map was necessary before the stormwater
and storm-drain sediment locations could be determined. Table 1 shows actual sample locations for
all media, parameters measured, and the purpose for taking the sample. Figures B-1 through B-5 in
Appendix B show the sample locations.

Page 8
Table 1. Actual sample locations, purpose, and parameters measured
Location ID Purpose (Determine contribution) Sample Collection Point Field Parameters Lab Parameters
Wastewater
Liberty Lake Wastewater Treatment Plant Influent (WWTP Influent)
Determine presence of PBDE and dioxin/furan during day shift and normal daytime activities. Sample will be taken Wednesday the middle of the workweek to avoid influence of vacation (Wednesday).
12-hr Composite (6a-6p)
Influent line Flow, Dissolved Oxygen, pH
PBDE Dioxin/Furan
12-hr Composite (6:30p-6:30a)
Influent line
AP1-2: Appleway Ave and Liberty Lake Rd
Wastewater predominantly industrial. Grab In-line none PCB, PBDE, Dioxin/Furan, PPMetals, Total Phosphorus, TSS, TDS, TOC, DOC
MI2-2: Mission Ave and Pepper Ln
Wastewater predominantly vehicle maintenance, powder coating, and auto sales.
Grab In-line none Same as above
OR1-4: Maxwell Ave and Ormond Rd
Predominantly new residential with polyvinyl chloride piping (pvc).
Grab In-line none Same as above
ID1-4: Inlet Drive Replaced SR1-3 downstream due to access issues. Predominantly old residential with mixed piping material including brick, clay, pvc, concrete, asbestos cement.
Grab In-line none Same as above
Stormwater
Garry Drive cul-de-sac outfall (Gardens)
New residential (Post 1985) Grab Outfall Temp, Turbidity PCB, PBDE, Dioxin/Furan, PPMetals, Total Phosphorus, TSS, TDS, TOC, DOC, Conductivity
West LL- Zone2 Old residential piped system (Pre-1985) Grab Outfall Temp, Turbidity Same as above
West LL- Zone 3B Old residential piped system (Pre-1985) Grab As water enters catch basin
Temp, Turbidity Same as above
West LL- Zone 3C Old residential piped system (Pre-1985) Grab As water enters catch basin
Temp, Turbidity PCB, PBDE, Dioxin/Furan, PPMetals, Total Phosphorus, TSS, TDS, TOC, DOC
Storm-drain Sediment
West LL- Zone 1 Old residential (Pre-1985) Core Composite Drywell, Catch basin
Depth to sediment Depth of core
PCB, Dioxin/Furan, PBDE, PPMetals, TOC, Grain Size
West LL- Zone2 Old residential (Pre-1985) Core Grab Drywell Depth to sediment Depth of core
Same as above
West LL- Zone 3 Old residential (Pre-1985) Core Composite Drywell, Catch basin
Depth to sediment Depth of core
Same as above

Page 9
Wastewater System
Figure B-1 in Appendix B shows the wastewater sampling locations.
Samples were taken at the LLSWD Waste Water Treatment Plant to determine the presence of
PBDE and dioxin/furan in the system. The LLSWD has data that indicates PCB and metals are
present in the wastewater collection system, so a sample was not collected for these contaminants
at this sampling point.
Two 12-hour composite samples were collected from the influent line by an ISCO automatic
sampling device on Dec. 10 through Dec. 11, 2008 (6 a.m. – 6 p.m., 6:30 p.m. - 6:30 a.m.
respectively). The ISCO sampler pulled a sample every 30 minutes. Bottles were custody-sealed
and placed on ice for transport. Samples were refrigerated at a temperature below 6 degrees
Centigrade. The 6:30 p.m. - 6:30 a.m. sample volume was not sufficient to run total dissolved solids
(TDS). Possible reasons for the small volume are low flow conditions or temporary clogging. Lab
analysis revealed PBDE and dioxin/furan in the water samples so it was not necessary to collect
biosolid samples at a later date. A split sample was taken for the 6 a.m. – 6 p.m. sample.
Samples were collected from four locations within the collection system for reasons described in
Table 1. The exact sampling locations were determined using GIS mapping, LLSWD‟s
knowledge and data, and resident‟s knowledge. Factors taken into account included:
Observed predominant land use
Manhole accessibility
Flow rate (enough to collect a sample using pole sampler)
Samples were collected at the downstream Inlet Drive manhole (ID1-4) instead of the Shoreline
Avenue manhole SR1-3 because the wastewater was not accessible through the manhole. No
sample was collected from Wicomico Beach (W1-1) because the brick/clay line lacked adequate
flow. A new residential sample was not collected at Corrigan Road (ER1-37) because a new
residential sample was collected from Maxwell Avenue (OR1-4). An additional sample was
deemed unnecessary since statistical analysis was not planned. Total phosphorus was added to the
parameter list as requested by the Water Quality Program after the QAPP/SAP was finalized.
Grab samples were collected using a pole grab sampler with a 1-liter glass container obtained from
Ecology‟s Manchester Laboratory (MEL). A new container was used per site. The sampler was
dipped into the flow facing upstream and contents were poured into a 2.5-gallon stainless steel
container. This was repeated until a sufficient sample volume was reached.
The sample was homogenized for one minute using a stainless steel spoon. Dissolved organic
carbon (DOC), total organic carbon (TOC), and total phosphorus sample containers were filled
using a 60 mL polypropylene syringe. The DOC sample was filtered using a 0.45 µm filter. A
small volume of sample was pushed through each filter before adding to the sample bottle. This
reduced the possibility of contamination from the filter or syringe entering the sample bottle.
Filters were exchanged when flow ceased until the container was filled. Except for metals, all
other samples were poured into the appropriate lab containers using a stainless steel funnel to

Page 10
direct the flow. The metals sample container was filled directly from the glass collection container
to avoid cross-contamination from the stainless steel equipment.
Clean-certified sample containers were obtained from MEL using the containers specified in
MEL‟s Lab Manual - 9th
Edition (MEL 2008). Samples were custody-sealed and placed on ice for
transport. Samples were maintained at a temperature below 6 degrees Centigrade.
A replicate sample was collected at the MI2-2 manhole by collecting a separate sample directly
after the first sample. We collected the replicate by collecting one sample directly after the other.
This was consistent with collection methods described in Parsons and Terragraphic‟s city of
Spokane‟s stormwater outfall study in 2007 (Parsons and Terragraphics Inc 2007).
Stormwater System
Stormwater was collected from two piped stormwater systems that discharge to ground (Figures B-2
through B-5). Three samples were collected from the system draining the old residential
neighborhood on the northwest side of Liberty Lake (West LL) (Figures B-3 through B-5). This
system was partially piped. One sample was collected from the system draining the newer Gardens
and Gardens Ridge residential neighborhoods (Gardens) (Figure B-2). Stormwater samples were
collected as discrete grab samples and analyzed separately (see Table 1). The Gardens system
sample site was an outfall located at the Garry Drive cul-de-sac where one discrete grab sample was
collected for analysis. In both cases, there is no map of the pipes in the system.
All water samples were collected following the methods described for wastewater sampling except
for a few modifications. For samples located in West LL-Zone 3B and West LL-Zone 2, the flow
was surficial so the collection point was as the water entered the catch basin. An aluminum foil
weir (dull side in) concentrated the flow for collection in a 1-liter glass, wide-mouth transfer
container. The Gardens outfall discharged several feet above the ground; therefore, the sample
was collected directly into the 2.5-gallon stainless steel container.
Sediment was collected on 10/30 and 10/31/08 from the West LL drainage area. Three samples
were collected for analysis, two composite sediment samples and one discrete core grab sample,
within the West LL drainage area (Table 1). Seven subsamples were composited in West LL-
Zone 1 (Z1-A, etc.) and two subsamples in West LL- Zone 3 (Z3-B, etc.). The subsamples were
taken from all identified manholes that had visible sediment (Figure B-4 and B-5). Only one
location in Zone 2 contained sediment so compositing was not necessary. There was no observed
sediment from the Gardens area.
Core grab samples were collected from drywells using a stainless steel auger. An attempt was
made to collect at least two cores per site to increase the representativeness of the sample. Storm-
drain sediment is heterogeneous in nature. Sediments were placed in a 2.5-gallon stainless steel
container and homogenized using a stainless steel spoon. Each subsample was placed in a half-
gallon certified clean glass container obtained from MEL. Samples were custody-sealed and
placed on ice for transport. Samples were refrigerated at a temperature below 6 degrees
Centigrade.

Page 11
Several samples froze and required thawing before compositing on 11/6/08. The volume of
sample placed in the final composites from each subsample was proportional to the estimated
percent area it drained within the system. The following formula was used to calculate subsample
mass, .
Business Visits Ecology and SRHD compiled a list of businesses by combining several database searches (i.e.,
Department of Revenue, Department of Licensing, and Selectory). The list was narrowed down
using two methods:
Business types likely to contain CoC
Drive-by visual inspection
We cross-referenced using the phone book and drove by some of the locations to confirm the list
accuracy. The list was modified when necessary. SRHD mailed a letter to each business that
explained they would receive a visit within 30 days. The letter offered them the opportunity to
call and set up an appointment that would eliminate the inconvenience of the unannounced visit.
A spreadsheet was also provided, requesting a list of possible hazardous materials at their site.
SRHD filled out a checklist that focused on indoor and outdoor pollution-generating activities
during the on-site visit. Once completed, the business received a letter explaining the findings and
options for improvement. If problems were identified, a 30-day timeline was provided before a
follow-up visit to allow them sufficient time to address the areas of concern. This continued until
the business resolved the issues. Businesses that did not make requested corrections and had a
potential for risk to human health or the environment were referred to Ecology for follow-up
action.
Laboratory Analysis MEL contracted with Pacific Rim Laboratories to analyze samples for PCB congeners,
dioxin/furan, and grain size. MEL analyzed samples for all remaining analyses as outlined in
Table 2.

Page 12
Table 2. Analytical methods, reporting limits, and holding times
Analyte Matrix Analytical
Method Preservative Lab Reporting Limit or
MQL Holding Times
PBDE congener water EPA 8270 Cool to 4˚C MEL 0.002-0.005 µg/L (209, 0.01-0.05 µg/L)
1 year
soil/sediment 1-5 µg/Kg (209, 2-5 µg/Kg)
PCB congener water EPA 1668A Cool to 4˚C Contract 0.01-0.5 ng/L 1 year
TSS water EPA 160.2; SM 2540D
Cool to 4˚C MEL 1 mg/L 7 days
Dioxins/Furan water EPA 1613B Cool to 4˚C Contract As defined in EPA 1613A for each
congener
1 year
soil/sediment
Total Metals: Priority Pollutant list (13 metals)
water EPA methods 200.8 &
245.1; EPA 6020 & 245.5
(water)-Preserved Nitric Acid Cool to 4˚C
MEL As listed in Table 5 on p.130 of MEL’s User Manual, 9
th
Edition
6 months Hg: 28 days soil/sediment
TDS water EPA 160.1 Cool to 4˚C MEL 20 mg/L 7 days
Phosphorus water SM 4500P-F HCL to pH≤ 2 Cool to 4˚C
MEL 1 µg/L 28 days
Grain size soil/sediment PSEP* 1986B Cool to 4˚C Contract NA NA
TOC/DOC water EPA 415.1 SM 5310B
HCL to pH≤ 2 Cool to 4˚C
MEL 1 mg/L 28 days
TOC soil PSEP-TOC; 1986B
Cool to 4˚C MEL 0.1% 28 days
Conductivity water EPA 120.1 Cool to 4˚C MEL 1 mhos/cm @ 25ºC 28 days
NA = not applicable MQL = measurement quality limit
Data Quality The quality control (QC) procedures routinely used by MEL and their contractors were followed for
this project. Case narratives are available from the author (see inside front cover for contact
information). Lab measurement quality objectives (MQOs) for this project stated in the QAPP
(2008) were met with a few exceptions. Those exceptions are described below in the Laboratory
Quality Control Section.
MQOs for field quality control were not specified in the QAPP. Part of this project included
determining how much contamination would be present with low-level analysis and what results
would be acceptable in relation to field quality control. This was decided after the QAPP/SAP had
been written. We listed the type and quantity of field quality control samples we would collect
during this pilot. We collected all required samples except:
A field rinsate blank was not collected for metals analysis to determine whether there was cross-
contamination from using stainless steel for collecting sediment for metals analysis.
The dioxin/furan rinsate blank was lost.
The field rinsate blank for metals will need to be collected and analyzed during future sampling to
remove potential bias.

Page 13
Wastewater and storm water are heterogeneous by nature and known to produce interference during
lab analysis, requiring some data to be qualified. This heterogeneity can also cause increased
variability in replicate samples. The data generated during this pilot study can be used for source
tracing.
The rinsate blank and field blank contamination was of concern and is discussed below. Some
decontamination procedures include a hexane rinse after the acetone rinse. Because of the risk
hexane poses to human health, an additional acetone rinse will be included during future
decontamination. Furthermore, we will use various lab grade de-ionized and carbon-filtered water
and test to make sure the water was not causing contamination issues. In turn, clean-certified
bottles could contribute to contamination. We will investigate this possibility as well.
Laboratory Quality Control
MEL provided case narratives with summaries on the following procedures completed:
analytical method
holding times
tuning
calibrations
method blanks
matrix spikes
laboratory control samples
surrogate recoveries
internal standards
duplicates
any discrepancies and corrections made after review of the contract lab‟s case narratives.
A case narrative includes any problems encountered during the analysis. It should include
definitions of all data qualifiers or flags. Any deviations of QC results outside of laboratory
acceptance limits should be described with the corrections taken by the lab. In addition, any factor
that could affect sample results should be discussed.
The following flags were used by Manchester Lab to qualify the data where appropriate:
J = The analyte was positively identified; the associated numerical value is the
approximate concentration of the analyte in the sample.
U = The analyte was analyzed for, but was not detected above the reported sample
quantitation limit.
UJ = The analyte was not detected above the reported sample quantitation limit; however,
the reported quantitation limit is approximate and may or may not represent the actual
limit of quantitation necessary to accurately and precisely measure the analyte in the
sample.
N = The analysis indicates the presence of an analyte for which there is presumptive
evidence to make a “tentative identification.”
Page 14
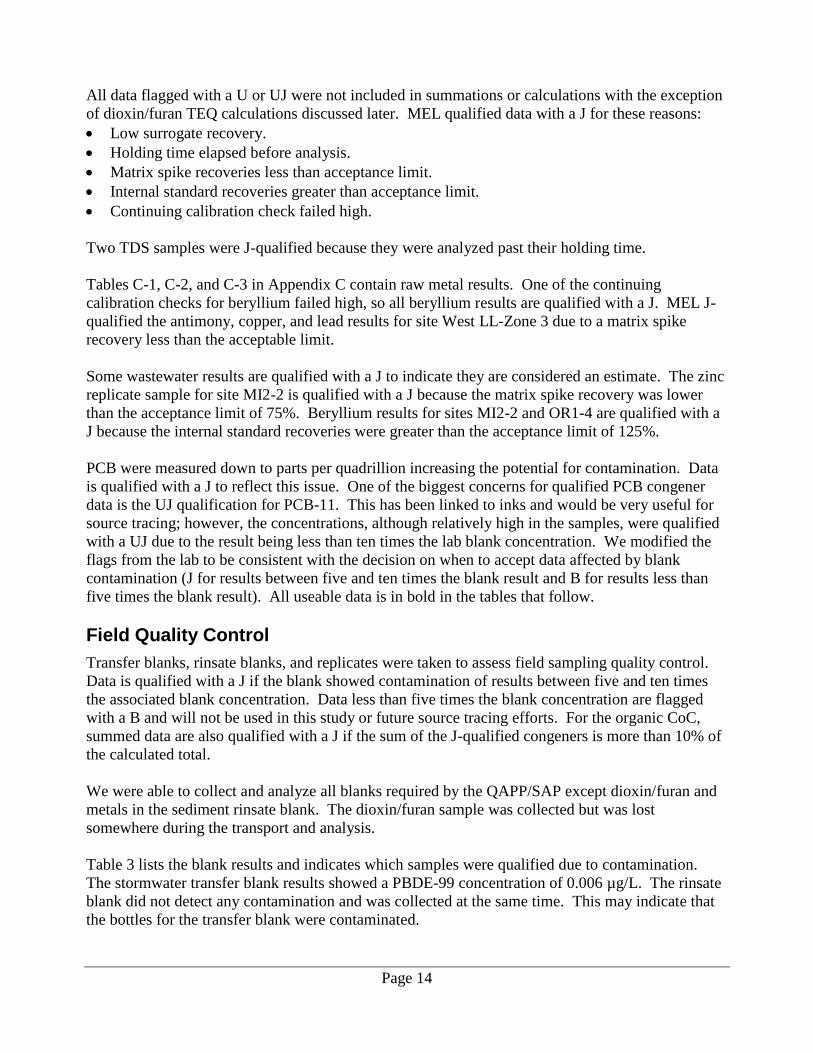
All data flagged with a U or UJ were not included in summations or calculations with the exception
of dioxin/furan TEQ calculations discussed later. MEL qualified data with a J for these reasons:
Low surrogate recovery.
Holding time elapsed before analysis.
Matrix spike recoveries less than acceptance limit.
Internal standard recoveries greater than acceptance limit.
Continuing calibration check failed high.
Two TDS samples were J-qualified because they were analyzed past their holding time.
Tables C-1, C-2, and C-3 in Appendix C contain raw metal results. One of the continuing
calibration checks for beryllium failed high, so all beryllium results are qualified with a J. MEL J-
qualified the antimony, copper, and lead results for site West LL-Zone 3 due to a matrix spike
recovery less than the acceptable limit.
Some wastewater results are qualified with a J to indicate they are considered an estimate. The zinc
replicate sample for site MI2-2 is qualified with a J because the matrix spike recovery was lower
than the acceptance limit of 75%. Beryllium results for sites MI2-2 and OR1-4 are qualified with a
J because the internal standard recoveries were greater than the acceptance limit of 125%.
PCB were measured down to parts per quadrillion increasing the potential for contamination. Data
is qualified with a J to reflect this issue. One of the biggest concerns for qualified PCB congener
data is the UJ qualification for PCB-11. This has been linked to inks and would be very useful for
source tracing; however, the concentrations, although relatively high in the samples, were qualified
with a UJ due to the result being less than ten times the lab blank concentration. We modified the
flags from the lab to be consistent with the decision on when to accept data affected by blank
contamination (J for results between five and ten times the blank result and B for results less than
five times the blank result). All useable data is in bold in the tables that follow.
Field Quality Control
Transfer blanks, rinsate blanks, and replicates were taken to assess field sampling quality control.
Data is qualified with a J if the blank showed contamination of results between five and ten times
the associated blank concentration. Data less than five times the blank concentration are flagged
with a B and will not be used in this study or future source tracing efforts. For the organic CoC,
summed data are also qualified with a J if the sum of the J-qualified congeners is more than 10% of
the calculated total.
We were able to collect and analyze all blanks required by the QAPP/SAP except dioxin/furan and
metals in the sediment rinsate blank. The dioxin/furan sample was collected but was lost
somewhere during the transport and analysis.
Table 3 lists the blank results and indicates which samples were qualified due to contamination.
The stormwater transfer blank results showed a PBDE-99 concentration of 0.006 µg/L. The rinsate
blank did not detect any contamination and was collected at the same time. This may indicate that
the bottles for the transfer blank were contaminated.

Page 15
Table 3. Field quality control blank samples and the associated data flagged
Sample type Date Collected Analyte Results Congener
Results Flagged
Stormwater Transfer Blank (TB)
11/7/09 Total Phosphorus ND (<0.005 mg/L)
---
Stormwater TB 11/7/09 PP Metals ND ---
Stormwater TB 11/7/09 Dioxin/Furan as 2,3,7,8-TCDD
ND ---
Stormwater TB 11/7/09 Total PCB congener 197.3 pg/L West LL-Zone 3C West LL-Zone 3B West LL-Zone 2 Gardens
Stormwater TB 11/7/09 Total PBDE 0.006 µg/L West LL-Zone 3C Gardens
Wastewater TB 2/19/09 Dioxin/Furan as 2,3,7,8-TCDD
ND ---
Wastewater TB 2/19/09 Total PBDE ND ---
Wastewater TB 2/19/09 Total PCB congener 95.7 pg/L AP1-2 MI2-2 and Rep. SR1-2 OR1-4
Wastewater TB 2/19/09 PP Metals ND ---
Sediment Decontamination Rinsate Blank (RB)
11/6/08 Dioxin/Furan as 2,3,7,8-TCDD
Sample lost ---
Sediment RB 11/6/08 Total PBDE ND ---
Sediment RB 11/6/08 Total PCB congener 549.8 pg/L ---
Sediment RB 11/6/08 PP Metals Not analyzed ---
Sediment RB 11/6/08 Total Phosphorus ND (<0.005 mg/L)
---
Replicate samples were also collected to verify homogeneity (or total variability) of samples.
Sample precision is reported as relative percent difference (RPD) for pairs of data. RPD is the
absolute difference between the sample pair divided by their mean times 100. Table 4 shows the
RPD for field samples. Select individual congeners and totals were used to assess total variability.
Replicates were not collected for the general parameters TOC, DOC, TDS, TSS, or grain size.
RPDs ranged from 2.3% to 90.9%. Eleven of the 25 RPDs were not applicable because the sample
and/or the replicate were below the detection limit. Of the 14 RPDs above detection limits, seven
RPDs fell below 50% and seven were above 50%. The MI2-2 wastewater replicate contained all 7
RPDs above 50%.
This increased variability was expected for the MI2-2 wastewater replicate. The variability for the
MI2-2 sample is most likely due to a visible change in flow in the main pipe while collecting the
second grab sample immediately after the first indicating the source contributions from that pipe
were different. Wastewater water is heterogeneous in nature also contributing to the variability.
Although it can be argued that this may not qualify as a replicate because of this observation, this
was collected as a field replicate so will be reported as such.

Page 16
Table 4. Field quality control replicate samples and percent RPD
Sample Type Analyte Media Sample Replicate Average %RPD
WWTP Influent 2,3,7,8 – TCDD (pg/L) water 1.9 2.17 2.04 13.3
WWTP Influent PBDE total (ug/L) water 0.156 0.148 0.152 5.3
WWTP Influent PBDE-47 (ug/L) water 0.044 J 0.041 J 0.042 J 7.0
MI2-2 wastewater 2,3,7,8-TCDD (pg/L) water 0.5 U 0.5 U NA NA
MI2-2 wastewater OCDD (pg/L) water 15.4 8.4 11.9 58.8
MI2-2 wastewater PBDE total (ug/L) water 0.262 J 0.092 J 0.177 96
MI2-2 wastewater PBDE – 47 (ug/L) water 0.072 0.027 0.050 90.9
MI2-2 wastewater PCB total (pg/L) water 5275 J 3624 J 4450 J 37.1
MI2-2 wastewater PCB-77 (pg/L) water 10 UJ 10 UJ NA NA
MI2-2 wastewater PCB-126 (pg/L) water 15.8 10 UJ NA NA
MI2-2 wastewater PCB-169 (pg/L) water 10 UJ 10 UJ NA NA
MI2-2 wastewater PCB-11 (pg/L) water 462 200 J 331 79.2
MI2-2 wastewater Antimony (ug/L) water 0.53 0.2 U NA NA
MI2-2 wastewater Arsenic (ug/L) water 3.07 3.00 3.04 2.3
MI2-2 wastewater Beryllium (ug/L) water 0.10 J 0.10 U NA NA
MI2-2 wastewater Cadmium (ug/L) water 0.12 0.10 U NA NA
MI2-2 wastewater Chromium (ug/L) water 1.48 0.82 1.15 57
MI2-2 wastewater Copper (ug/L) water 45.3 32.7 39.0 32.3
MI2-2 wastewater Lead (ug/L) water 0.95 0.45 0.70 71
MI2-2 wastewater Mercury (ug/L) water 0.05 U 0.05 U NA NA
MI2-2 wastewater Nickel (ug/L) water 1.90 1.00 1.45 62.1
MI2-2 wastewater Selenium (ug/L) water 0.58 0.50 U NA NA
MI2-2 wastewater Silver (ug/L) water 0.10 U 0.10 U NA NA
MI2-2 wastewater Thallium (ug/L) water 0.10 U 0.10 U NA NA
MI2-2 wastewater Zinc (ug/L) water 136 77.7 J 107 54.5
West LL – Zone 1 2,3,7,8-TCDD (ng/Kg) sediment 1.1 0.82 0.96 29.2
J = The analyte was positively identified. The resulting concentration is an estimate. NA = not applicable U = Not detected at the sample quantitation limit shown Bold = A detected compound

Page 17
Results and Discussion
Table 5 provides a summary of CoC concentration ranges found in stormwater, wastewater, and
sediment.
Table 5. Range of concentrations found in stormwater, wastewater, and sediment
Parameter Stormwater (µg/L) Wastewater (µg/L) Storm-drain
Sediment (mg/Kg)
Min Max Min Max Min Max
Total PBDE (µg/Kg sediment) 0.0008 0.073 0.139 1.079 5.9 10.9
Total PCB (ng/L for water; ng/Kg sediment)
0.4582 8.4154 1.9634 12.3662 4.78 13.6
Dioxin/Furan (TEQ in pg/L water; TEQ in ng/Kg sediment)
1.61 8.14 0.22 10.49 2.1 9.09
Total Phosphorus 557 956 4920 8230 NA NA
Antimony <0.2 0.72 <0.2 0.62 0.16 0.3
Arsenic 0.41 4.57 2.64 3.17 9.87 11.6
Beryllium <0.10 0.19 <0.10 0.10 0.44 0.49
Cadmium <0.10 0.18 <0.10 0.13 0.18 0.508
Chromium 0.55 11.8 0.82 9.41 12 24.6
Copper 1.09 13.9 32.7 101 13.4 43.8
Lead 0.31 16.6 0.45 1.58 22.3 43.1
Mercury <0.05 <0.05 <0.05 0.101 0.014 0.055
Nickel 0.33 7.9 1.00 16.9 10.7 18.5
Selenium <0.50 <0.50 <0.50 0.94 0.38 0.5
Silver <0.10 <0.10 <0.10 1.61 0.064 0.49
Thallium <0.10 <0.10 <0.10 <0.10 0.12 0.16
Zinc 61.1 130 77.7 180 152 220
Conventional Parameters
Storm-drain Sediment TOC, Percent Solids, and Grain Size Sediment was analyzed for TOC, percent solids, and grain size (Table 6). Percent fines were
calculated by summing the silt and clay fractions. The organic contaminants and some of the metals
have been associated with the fine fraction of sediment.
The percent of total organic carbon was similar in all three old residential samples. The percent
fines varied greatly ranging from 5.77% to 35.1%. This differs from the catch basin sediment
sampling conducted in 2007 (Parsons and Terragraphics Inc 2007) where fines were less than 1% of
the total sediment collected. This is likely due to where the samples were collected. In-line
sediment collection does not allow for an extended residence time where sediment particles can
settle out of the water. Catch basins increase retention time of water allowing smaller and lighter
fine particles to settle out. Drywells act as filters and adsorb compounds as they pass through.

Page 18
Table 6. Grain size, total solids and TOC results for storm-drain sediment composites (%)
Site ID TOC Total
Solids Gravel Sand Silt Clay Fines
(clay+silt)
West LL – Zone 1 4.11 73.6 33.4 49.5 16.5 4.2 20.7
West LL – Zone 2 3.54 65.4 54.6 48.6 4.26 1.51 5.77
West LL – Zone 3 3.76 64.1 22.4 48.6 27.8 7.25 35.1
Stormwater Five general parameters were collected because they may assist with source contribution if found to
associate with the CoC (Table 7). Any associations found are discussed in the CoC sections below.
All general parameters were higher in the old neighborhood. The largest differences were seen in
conductivity, turbidity, TSS, and TDS. This may be due to the higher percentage of unpaved
surfaces in the old neighborhood. West LL – Zone 2 had the highest TOC and DOC. The catch
basins and outfall drywell contained significant amounts of plant matter and the drywell had a
strong hydrogen sulfide odor.
Table 7. Stormwater results for conductivity, DOC, TOC, TDS, TSS, and turbidity in mg/L, except where noted
Analyte West LL- Zone 3C
West LL- Zone 2
West LL- Zone 3B
WestLL Mean (Old
Residential)
Gardens (New
Residential) Stormwater
Range
Conductivity (umhos/cm)
--- 155 117 136 25.8 25.8 - 155
TOC 17.1 121 31.5 56.5 37.3 17.1 - 121
DOC 13.5 115 29.7 52.7 30.9 13.5 - 115
TSS 12 140 370 174 4 4 - 370
TDS 60 211 94 122 13 13 - 211
Turbidity (NTU)
28.4 29.2 279 112 5.17 5.17 - 279
Stormwater samples were not collected from industrial locations. Liberty Lake offered only one
industrial stormwater sampling opportunity of interest. A sample was not collected from this
location due to possibly interfering with on-going compliance issues with the facility. Future
sampling in Spokane will include individual industrial facilities to help fill this data gap. A total of
23 parameters were analyzed. Samples were collected from new and old residential neighborhoods
to determine relative contributions.
Wastewater
In-line Conventional parameters were analyzed for the four wastewater pipe samples collected throughout the
system as shown in Figure B-1 (Table 8). The wastewater results for TSS, TOC, and DOC differ
from the stormwater numbers in that the ranges are narrower and fall within the stormwater ranges.
TDS has a narrower range as well, but all four values are above the range for the stormwater results.

Page 19
Table 8. TOC, DOC, TSS, and TDS concentrations for wastewater pipe samples in mg/L
Site ID TSS TDS TOC DOC
AP1-2 161 443 105 86.2
OR1-4 114 342 J 101 104
SR1-2 172 329 J 65.6 67.6
MI2-2 95 361 115 92.8
Waste Water Treatment Plant The volume of night (6:30 p.m. – 6:30 a.m.) influent was insufficient to collect a TDS sample for
analysis, possibly due to clogging or low flow. TOC, DOC, and TSS were lower for the nighttime
sample. The unknown factor that caused the low sample volume for the night influent sample
prevents us from making any generalized conclusions about the difference in concentrations from
the day influent sample (Table 9). It should be noted that the DOC and TOC concentrations for the
day (6:00 a.m. – 6:00 p.m.) influent sample are several times higher than the highest concentrations
found in both stormwater and wastewater.
The LLSWD provided the following data [temperature, pH, and average dissolved oxygen (DO) as
well as total 12-hour flow in million gallons (MG)] in Table 10 for the sampled time periods.
Although flow was lower during the night sampling event, all other parameters were similar.
Table 9. TOC, DOC, TSS, and TDS concentrations for Liberty Lake Sewer and Water District wastewater treatment plant influent 12-hour composite samples in mg/L
Site ID DOC TDS TOC TSS
Influent Day 485 364* 532 179*
Influent Night 71.8 Not analyzed 88.5 138
*Average of result and lab duplicate
Table 10. LLSWD wastewater treatment plant pH, DO, temperature, and flow averages for December 10 and 11, 2008
Site ID pH DO (mg/L) Temp (C) 12-Hr Flow (MG)
Influent Day 8.27 3.2 15.7 0.351
Influent Night 8.49 3.8 16.3 0.238

Page 20
Table 11. PBDE values by matrix
Site ID PBDE Total
Storm-drain Sediment in µg/Kg dw
West LL-Zone 1 10.9
West LL-Zone 2 6.8 U
West LL-Zone 3 5.9
Stormwater in µg/L
West LL-Zone 2 0.0482
West LL-Zone 3B 0.0058
West LL-Zone 3C 0.073
Gardens 0.0008 J
Wastewater in µg/L
Influent Day 1,2
0.150 J
Influent Night1 0.139 J
AP1-2 0.316 J
MI2-2 0.262
MI2-2 Rep. 0.092
MI2-2 Mean 0.177
OR1-4 1.079 J
SR1-2 0.355 J 112-hour composite sample;
2Average of two
replicates Bold = A detected compound U = Not detected at the sample quantitation limit shown J = An estimated concentration B = Result less than five times the field blank.
PBDE Table 11 shows the analytical results for PBDE in all
three matrices sampled. The number of samples and
the heterogeneous nature of all matrices sampled do not
allow us to make statistically significant conclusions
about PBDE. This is true for all matrices and all CoC.
The most notable observations are:
PBDE were found in most samples.
Concentrations were consistently higher in the
wastewater system compared to the stormwater.
More PBDE congeners were found in the
wastewater than stormwater. The increased
number of congeners may be due to the additional
octaBDE formulation products or from breakdown
of PBDE-209 by bacteria in wastewater. In
addition, stormwater exposure to ultraviolet light
(UV) may also be a factor. UV breaks down
PBDE-209, PBDE-153, PBDE-154, and PBDE-
183 to various degrees.
PBDE may be accumulating in the storm-drain
sediment.
Interferences will need to be corrected to reduce
the amount of qualified data; however, the nature
of the matrix may not allow for less variability.
PBDE were higher in concentration than PCB.
Storm-drain Sediment PBDE storm-drain sediment results can be found in table C-4 in Appendix C. PBDE sediment
concentrations ranged from non-detect to 10.9 µg/Kg dry wt. Only three congeners were found,
which include 47, 99, and 100. These congeners are associated with the penta formulation used in
polyurethane foam for upholstered furniture and rigid insulation. They are known to volatilize and
travel long distances via air masses before redepositing on the ground (Wania and Dugani, 2002).
Interestingly, we detected BDE-209 in the stormwater entering these systems but did not find it in
the sediment. We did however, find BDE-100 in storm-drain sediment, which was not detected in
the stormwater. This may be a sign of debromination in the sediments or movement of BDE-209
through the drywell base. Another explanation may be that the detection limits for BDE-100 in
water are too high thus some congeners show up in sediment after temporal accumulation.

Page 21
Figure 3. Storm-drain sediment results for PBDE in µg/Kg dw.
Researchers have linked TSS with PBDE concentrations, which is supported by the limited data
collected for this project; however, it is also believed PBDE in sediment are associated with the fine
fraction, less than 62 microns (Kersten and Smedes, 2002). In our limited sampling, this association
is not as clear.
Table 12 shows the storm-drain sediment results along with the percent fines and TOC. When
compared to marine sediment samples collected by King County, both Zone 1 and Zone 3
concentrations exceed the marine sediment range maximum of 3.18 µg/Kg DW (KCDNRP, 2009).
In both cases, percent fines are higher in our samples. Because PBDE are associated with fine
sediment, the higher percent fines could explain our higher concentrations.
Table 12. Total PBDE storm-drain sediment results, percent fines, and percent TOC
West LL-Zone 1 West LL-Zone 2 West LL- Zone 3
PBDE Total (µg/Kg DW) 10.9 6.8 U 5.9
TOC (%) 4.11 3.54 3.76
Fines (%) 20.7 5.77 35.05
U = not detected at the sample quantitation limit shown.
Stormwater
All stormwater samples contained some PBDE (Table C-5), but the transfer blank also contained
PBDE. PBDE-99 results were not used for this reason as described in the Quality Control Section
(data is qualified with a B). The PBDE-47 and PBDE-209 were present in two samples (Figure 4).
It is important to note that two of the four results were higher in concentration than all stormwater
samples collected from the city of Spokane in 2007 (Parsons and Terragraphics Inc 2007); however,
they did not detect PBDE-209, which is the main reason for the high concentrations. Their
concentrations for PBDE-47 were higher than any sample from Liberty Lake.
0
2
4
6
8
10
12
WestLL-Zone 1 West LL- Zone 3
Co
nce
ntr
atio
n in
ug/
Kg
dw
PBDE Storm-drain Sediment
Results
PBDE-47
PBDE-99
PBDE-100
PBDE total

Page 22
It is also worth noting that the old residential concentrations were all higher than the new residential
concentrations. The new residential area is mostly concrete and asphalt, while the old areas were
unpaved or without sidewalks. The amount of sediment and debris within the old neighborhoods
was much higher than in the new. Further sampling is needed to gain a better understanding of the
difference. It may be worth comparing drainage catchments in Spokane that differ in age and in
their paved surface areas.
Figure 4. PBDE results in stormwater.
Wastewater All wastewater samples contained some PBDE at high concentrations relative to the stormwater
results (Figure 5, Table C-6). Additional congeners were detected including BDE-153, BDE-154,
and BDE-183. These congeners are linked with the pentaBDE and octaBDE formulations. The
new residential waste contained more PBDE than any other branch that included industrial and old
residential. Possible explanations, although not observed, could be a slug of water may have passed
through during sampling that was of a higher concentration than usual (furniture cleaning wash
water, for example).
Both composite day and night samples at the treatment plant were lower than all but the second
replicate sample from MI2-2. Either we happened to choose branches that contained higher levels
of the PBDE, or concentrations change throughout the day and we may have chosen a time of day
when discharge is the highest. The exact reason for this anomaly is unclear. Follow up sampling
could include additional branch samples at different locations and treatment plant samples at
different times of day. This should be taken into account and tested in the city of Spokane.
0
0.02
0.04
0.06
0.08
West LL-Zone 2 West LL-Zone 3B West LL-Zone 3C Gardens
Stormwater Results for PBDE in µg/L
PBDE- 47 PBDE-209 PBDE total

Page 23
Figure 5. Wastewater results for PBDE *Average of duplicates.
PCB The Liberty Lake study area does not have any known current or historical point source PCB
contamination, so it seemed like the ideal location to begin to understand the local urban
“background” concentrations. Basically, all conditions are similar to the city of Spokane except the
lack of extensive industry and the knowledge that there should not be a current or historical point
source contributing to the media sampled.
We cross-referenced PCB with the 303(d) listings on Ecology‟s Water Quality Assessment for
Washington internet mapping tool and found that Liberty Lake was listed as a 303(d) impaired
water body for PCB. This listing was determined based on two fish tissue composite samples (5-10
fish), one from 2001 and one from 2005. A wider view of Spokane County showed at least three
other lakes also received the 303(d) listing without a known or suspected source. Expanding the
search to the whole state, it is estimated that 75% of all sites tested for fish tissue PCB
concentrations exceed water quality criteria and are listed as 303(d) impaired water bodies. Art
Johnson with Ecology is in the process of releasing a publication that attempts to explain this
phenomenon (Johnson, 2008).
For Liberty Lake, this may be due to several factors that are not linked to historical contamination.
For example, any of the following could contribute to contamination:
Stormwater runoff from streets with electrical transformers or other PCB-containing material
(caulking, etc).
Residential sewage leakage.
Aerial deposition.
Stocked fish contaminated with PCB from maternal or paternal transport.
0.000
0.200
0.400
0.600
0.800
1.000
1.200
Influent Day*
Influent Night
AP1-2 MI2-2* OR1-4 SR1-2
Sanitary Sewer Results for PBDE in µg/L
PBDE-47
PBDE-99
PBDE-100
PBDE-153
PBDE-154
PBDE-183
PBDE-209
PBDE total

Page 24
PCB congener results can be found in Appendix C (Table C-7). PCB were found at low levels in all
samples collected. The highest water concentration measured was from the older residential
neighborhood wastewater. Data are presented as totals and summed homologues in this section.
Homologues are the sum of the congeners with similar numbers of chlorine atoms. For example,
MonoPCB equals 1 chlorine atom, DiPCB equals two chlorine atoms, and so forth.
Storm-drain Sediment We found PCB in all three storm-drain sediment samples (Table 13). Concentrations ranged from
4.78 – 13.6 µg/Kg dry weight (DW). A similar source tracing study is underway by the Lower
Duwamish Waterway Group for PCB and other contaminants (WindWard Environmental LLC
2007). They calculated the urban background concentration from various locations for PCB (e.g.,
Green river sediment and a collection of urban bays). It ranged from 21 – 135 µg/Kg DW, which is
above the concentrations we found in Liberty Lake.
These concentrations, in conjunction with the stormwater data, indicate a low-level source of PCB
that accumulates in the sediment.
Table 13. Storm-drain sediment results for PCB in µg/Kg DW
Parameter WestLL - Zone 1* WestLL - Zone 2 WestLL - Zone 3*
MonoPCB 0.003 U 0.003 U 0.0143
DiPCB 0.0131 0.0144 0.0498
TriPCB 0.0043 0.044 J 0.0644
TetraPCB 0.0967 0.604 J 0.575
PentaPCB 1.33 2.76 3.78
HexaPCB 1.94 2.01 4.50
HeptaPCB 1.06 0.79 3.65
OctaPCB 0.26 0.19 0.82
NonaPCB 0.0507 0.032 0.048
DecaPCB 0.0266 0.0358 0.133
Total PCB 4.78 6.48 J 13.6
*Composite U = Not detected at the sample quantitation limit shown J = An estimated concentration
Stormwater Total PCB concentrations in stormwater ranged from 458.2 to 8415.4 pg/L (Table 14). All
stormwater samples exceeded the 170 pg/L NTR criterion for the protection of human health.
Therefore, they also exceeded the significantly lower Spokane Tribal PCB standard of 3.37 pg/L,
which applies to the Spokane River downstream of Long Lake Dam. None of the samples violated
the freshwater acute or chronic Toxics Substances Criteria found in table 240(3) of the Water
Quality Standards for Surface Waters of the State of Washington.
The PCB stormwater concentration median was 5.04 ng/L, which is lower than the median
concentration of 7.71 ng/L found in the 2007 Spokane PCB stormwater project completed by Parsons
and Terragraphics Inc in 2007 (Parsons and Terragraphics Inc. 2007). The PCB stormwater
concentration mean was 4.62 ng/L, which is well below Parsons and Terragraphics mean of 22.5 ng/L.

Page 25
Table 14. Stormwater results for PCB in pg/L
West LL-Zone 2 West LL-Zone 3B West LL-Zone 3C Gardens
MonoPCB 11.1 10 UJ 10 UJ 10 U
DiPCB 438.3 638.5 10 UJ 481.2
TriPCB 692.9 611.5 128.6 930.4 J
TetraPCB 735.5 931.4 87 352.8 J
PentaPCB 2496.2 2612.9 157.3 J 20.9
HexaPCB 2883.7 1522 50.2 10 U
HeptaPCB 773.5 986.6 35.1 10 U
OctaPCB 261.5 286.1 10 UJ 10 U
NonaPCB 77.8 143.1 10 UJ 10 U
DecaPCB 44.9 84.2 10 UJ 10 U
Total PCB 8415.4 7816.3 458.2 J 1785.3 J
Bold = Visual aid for detected compounds; UJ = Estimated detection limit
Figure 6 shows a visual comparison of percent homologues for the stormwater and storm-drain
sediment. Total PCB results were dominated by the tetra, penta, hexa, and hepta PCB congener
groups. The congeners with the lesser number of chlorine atoms do not appear to be as prevalent in
the storm-drain sediment as they are in the stormwater. This may indicate they readily pass through
the drywell or are dechlorinated and broken down into other compounds.
0.00
10.00
20.00
30.00
40.00
50.00
60.00
70.00
80.00
90.00
100.00
% P
CB
Ho
mo
logu
e G
rou
p
Percent of each PCB homologue group for stormwater and storm-drain sediment
MoPCB (1-Cl)
DiPCB (2-Cl)
TriPCB (3-Cl)
TetraPCB (4-Cl)
PentaPCB (5-Cl)
HexaPCB (6-Cl)
HeptaPCB (7-Cl)
OctaPCB (8-Cl)
NonaPCB (9-Cl)
DecaPCB (10-Cl)
Figure 6. Percent contribution pattern of PCB congener homologue groups per site for stormwater and storm-drain sediment.

Page 26
Wastewater Results for wastewater PCB concentration totals ranged from 1963.4 – 12366.2 pg/L (Table 15).
The average concentration in the wastewater was slightly higher than stormwater, 6534.2 pg/L
versus 4618.7 pg/L respectively. Further sampling may show a different trend since our sample
number is small.
A visual comparison of homologue groups of storm and wastewater samples shows a relatively
similar pattern for all but the Gardens stormwater sample (Figures 7 and 8). The Gardens sample is
from the newer residential area consisting of concrete vaults, sidewalks, and pavement. The
remaining three stormwater samples come from older residential with paved and unpaved roads,
and intermittent sidewalks. The lighter di, tri, and tetra homologues dominate the Gardens‟ new
residential stormwater, while the old residential wastewater and stormwater include a larger suite
with penta, hexa, and hepta in similar percentages as the lighter homologues that dominated the
Gardens sample.
Table 15. Wastewater results for PCB in pg/L
Parameter
AP1-2 (industrial)
MI2-2* (industrial)
SR1-2 (old residential)
OR1-4 (new residential)
MonoPCB 10 UJ 8.3 33.9 10 UJ
DiPCB 223.9 380.7 505.9 653.4
TriPCB 308.9 644.9 1586.6 1097.6
TetraPCB 418.6 521.6 2297.3 1504.8
PentaPCB 289.1 885.2 3779 1645
HexaPCB 370.1 1067 2785.5 1326.1
HeptaPCB 277.3 537 1241.2 920.1
OctaPCB 75.5 208.1 90.4 64.9
NonaPCB 10 UJ 193.3 46.4 46.5
DecaPCB 10 UJ 103 10 UJ 46.5
Total PCB 1963.4 J 4548.9 J 12366.2 7258.4
* Average of two field replicates. Bold = Visual aid for detected compounds UJ = Estimated detection limit B = Result less than five times blank contamination.

Page 27
Figure 7. Comparison of stormwater and wastewater results for PCB homologue groups. * Average of two field replicates.
0
500
1000
1500
2000
2500
3000
3500
4000
West LL - Zone 3C
(old residential stormwater)
West LL - Zone 3B
(old residential stormwater)
West LL - Zone 2 (old residential
stormwater)
Gardens (new residential
stormwater)
SR1-2 (old residential sanitary sewer)
OR1-4 (new residential sanitary sewer)
AP1-2 (mixed)
MI2-2* (industrial)
Co
nce
ntr
atio
n (
pg/
L)
Sample Site
PCB congener group concentrations for storm and sewer water (pg/L)
MonoPCB
DiPCB
TriPCB
TetraPCB
PentaPCB
HexaPCB
HeptaPCB
OctaPCB
NonaPCB
DecaPCB

Page 28
Figure 8. Comparison of the percent PCB homologue groups contributing to a sample of stormwater and wastewater. * Average of two field
replicates.
0%
10%
20%
30%
40%
50%
60%
70%
80%
90%
100%
West LL - Zone 3C
(old residential stormwater)
West LL - Zone 3B
(old residential stormwater)
West LL - Zone 2 (old residential
stormwater)
Gardens (new residential
stormwater)
SR1-2 (old residential sanitary sewer)
OR1-4 (new residential sanitary sewer)
AP1-2 (mixed)
MI2-2* (industrial)
% P
CB
Ho
mo
logu
e G
rou
p
Sample Site
Percent of each PCB homologue group in storm and sewer water MonoPCB
DiPCB
TriPCB
TetraPCB
PentaPCB
HexaPCB
HeptaPCB
OctaPCB
NonaPCB
DecaPCB

Page 29
Dioxin/Furan We analyzed for the 17 co-planar congeners thought to be the most toxic forms, 10 furan and 7
dioxin compounds. We then calculated each site‟s Toxic Equivalency (TEQ) by summing the
products of each congener result by the 2005 World Health Organization‟s (WHO) toxic
equivalency factors (TEF) (Van den Berg et al., 2005). Ecology‟s Environmental Assessment
Program guidance suggests all non-detect results be assigned as zero for purposes of summing and
TEQ calculation (Table 16). For the purposes of providing all possible data for this report, table C-
8 in Appendix C includes three calculated TEQs where the non-detected (ND) congeners, those
flagged with a U or UJ, were included in the calculation as follows:
ND = 0; lower bound
ND = 1/2 detection limit; mid bound
ND = detection limit; upper bound
Table C-8 includes all raw dioxin/furan data.
Table 16. Dioxin/Furan TEQs for the Liberty Lake study area
Site ID 2,3,7,8-TCDD TEQ (ND = 0)
Stormwater in pg/L
Storm-Zone 2 2.70
Storm-Zone 3B 5.25
Storm-Zone 3C 1.61
Gardens 8.14
Storm-drain Sediment in ng/Kg dw
*Alpine-Zone 1 9.09
Wright-Zone 2 2.10
Lilac-Zone 3 7.26
Wastewater in pg/L
Influent Day 10.49
Influent Day 2.32
Influent Day** 6.40
Influent Night 0.22
AP1-2 (industrial) 1.54
MI2-2 (Industrial) 0.005
MI2-2 (Industrial) 0.062
MI2-2*** (Industrial) 0.034
SR1-2 (old residential) 1.86
OR1-4 (new residential) 0.187
* Composite **Average of duplicate ***Average of replicate
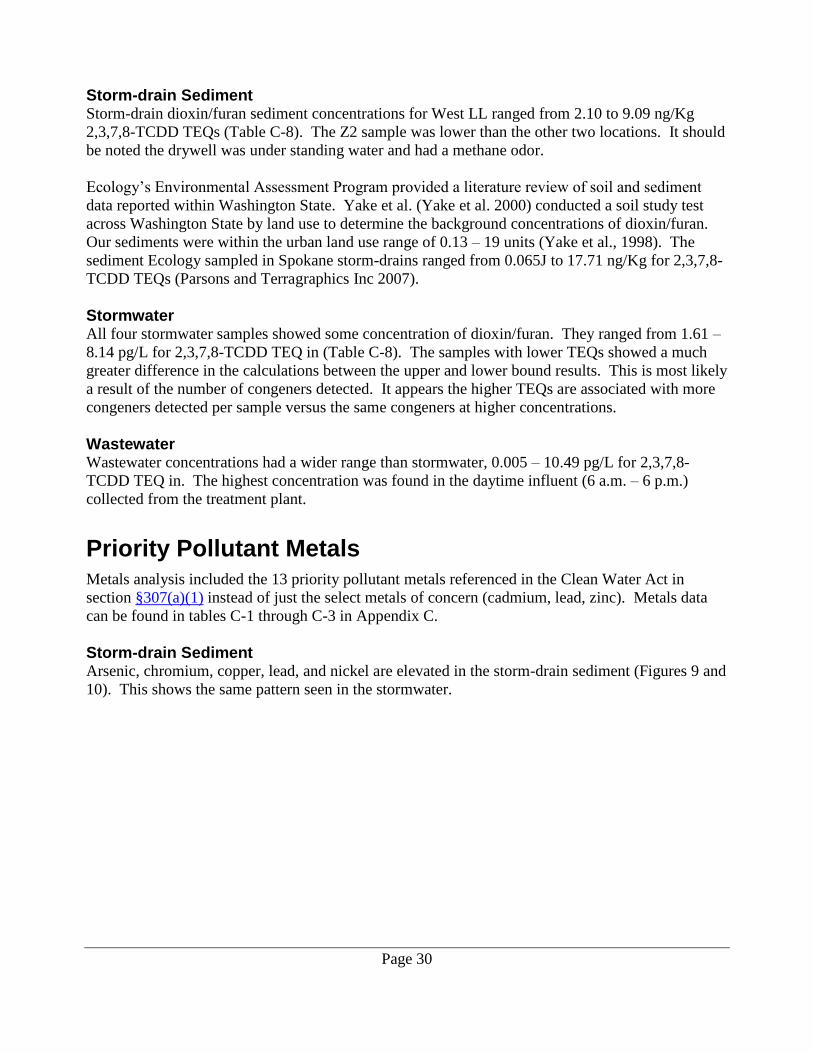
Page 30
Storm-drain Sediment Storm-drain dioxin/furan sediment concentrations for West LL ranged from 2.10 to 9.09 ng/Kg
2,3,7,8-TCDD TEQs (Table C-8). The Z2 sample was lower than the other two locations. It should
be noted the drywell was under standing water and had a methane odor.
Ecology‟s Environmental Assessment Program provided a literature review of soil and sediment
data reported within Washington State. Yake et al. (Yake et al. 2000) conducted a soil study test
across Washington State by land use to determine the background concentrations of dioxin/furan.
Our sediments were within the urban land use range of 0.13 – 19 units (Yake et al., 1998). The
sediment Ecology sampled in Spokane storm-drains ranged from 0.065J to 17.71 ng/Kg for 2,3,7,8-
TCDD TEQs (Parsons and Terragraphics Inc 2007).
Stormwater All four stormwater samples showed some concentration of dioxin/furan. They ranged from 1.61 –
8.14 pg/L for 2,3,7,8-TCDD TEQ in (Table C-8). The samples with lower TEQs showed a much
greater difference in the calculations between the upper and lower bound results. This is most likely
a result of the number of congeners detected. It appears the higher TEQs are associated with more
congeners detected per sample versus the same congeners at higher concentrations.
Wastewater Wastewater concentrations had a wider range than stormwater, 0.005 – 10.49 pg/L for 2,3,7,8-
TCDD TEQ in. The highest concentration was found in the daytime influent (6 a.m. – 6 p.m.)
collected from the treatment plant.
Priority Pollutant Metals Metals analysis included the 13 priority pollutant metals referenced in the Clean Water Act in
section §307(a)(1) instead of just the select metals of concern (cadmium, lead, zinc). Metals data
can be found in tables C-1 through C-3 in Appendix C.
Storm-drain Sediment Arsenic, chromium, copper, lead, and nickel are elevated in the storm-drain sediment (Figures 9 and
10). This shows the same pattern seen in the stormwater.

Page 31
Figure 9. Total recoverable metal concentrations in storm-drain sediment.
Figure 10. Total recoverable zinc concentrations in storm-drain sediment.
Stormwater All of the 13 priority pollutant metals were detected in at least two sites except mercury, selenium,
silver, and thallium (Figures 11 and 12). When averaged, the metal concentrations from the old
residential areas exceeded the concentration from the new residential site for all metals detected
except zinc (Figure 12, Table C-3). This may be the result of more galvanized materials being used
and/or more tire wear on the asphalt in the newer neighborhood; however, the sample number is too
low and further sampling will need to be conducted to determine the source. As a comparison, the
industrial stormwater permit total zinc limit is 117 µg/L. The old residential sample is the only
concentration to exceed that limit at 130 µg/L.
0
5
10
15
20
25
30
Metal concentrations in storm-drain sediments (mg/Kg)
West LL-Zone 1
West LL-Zone 2
West LL-Zone 3
0
50
100
150
200
250
West LL-Zone 1 West LL-Zone 2 West LL-Zone 3
Zin
c C
on
c (
mg
/Kg
)
Zinc concentrations in storm-drain sediments

Page 32
Arsenic, chromium, copper, lead, and nickel all show a higher concentration in the old residential
neighborhood than the new (Figure 13). Cadmium is very low which may indicate residential
neighborhoods are not a significant source of this metal to stormwater or the river. Further
sampling is needed to confirm this theory.
Figure 11. Total recoverable metals data for stormwater.
Figure 12. Total recoverable zinc concentrations in stormwater.
0 2 4 6 8
10 12 14 16 18 20
Concentr
ation in µ
g/L
Total metals concentrations in stormwater collected from the Liberty Lake Study Area
Gardens Residential West LL-Zone 2
West LL-Zone 3B West LL-Zone 3C
130 110
84 61.1
0 20 40 60 80
100 120 140
Conc. µ
g/L
Total zinc concentration in stormwater collected from
Liberty Lake

Page 33
Figure 13. Comparison of old residential versus new residential metals concentrations.
Wastewater Levels of copper, lead, mercury, nickel, selenium, silver, and zinc are generally higher in
wastewater than in stormwater (Figures 14 and 15). All but thallium was present in at least one
sample. Cadmium was present near the detection limit for all samples.
Figure 14. Total recoverable metal results for wastewater sample.
0
2
4
6
8
10
12
14
Concentr
ation in µ
g/L
Average old residential stormwater total metal concentrations vs. new residential
Gardens Residential (New) West LL (Old)
0
2
4
6
8
10
12
14
16
18
AP1-2 SR1-2 OR1-4 MI2-2*
Total Metals in Sewer Water (µg/L)
Antimony
Arsenic
Beryllium
Cadmium
Chromium
Lead
Mercury
Nickel
Selenium
Silver

Page 34
Figure 15. Total recoverable zinc and copper results for wastewater samples.
Phosphorus Total phosphorus was collected to assist the Water Quality Program. Results can be found in the
Appendix (Tables C-9 and C-10).
Business Visits SRHD completed 20 initial business visits in the Liberty Lake study area. Two visits resulted in
proper cleanup. At one location, the facility moved scrap metal, car batteries, and other automotive
materials inside and under cover. This eliminated stormwater contact with metal-bearing materials,
oils, and greases. Although not related to a particular CoC, the inspector also found oil
contamination on gravel that ended in cleanup and proper disposal. The remaining visits resulted in
occasional minor recommendations.
Conclusions
This study helped us gain a better understanding of urban concentrations in stormwater, storm-drain
sediment, and wastewater within the Liberty Lake area; however, the number of samples taken will
not provide us with a statistically-based representative urban „background‟ concentration.
All CoC were found in all media.
Wastewater and stormwater ranges for organic CoC have similar pattern: PBDE (ppb) > PCB
(ppt) > Dioxin/Furan (ppq)
Storm-drain sediment range for organic CoC (ppb): PBDE ≈ PCB > Dioxin/Furan
All media ranges have similar pattern for CoC metals: zinc > lead > cadmium
0
20
40
60
80
100
120
140
160
180
200
AP1-2 SR1-2 OR1-4 MI2-2*
Total Zinc and Copper concentrations in µg/L
Copper
Zinc

Page 35
PBDE
Higher in wastewater than stormwater.
Stormwater contribution is not always reflected in storm-drain sediment.
PCB
Similar in wastewater and stormwater.
Similar concentrations to PBDE in sediment.
Higher in residential wastewater than mixed industrial wastewater.
Higher in old residential wastewater than new residential.
Dioxin/Furan
Higher in stormwater than wastewater.
Highest concentration in new residential stormwater.
Cadmium
Similar in wastewater and stormwater.
Higher in old residential stormwater than new residential stormwater.
Lead
Higher in stormwater than wastewater.
Higher in old residential stormwater than new residential stormwater.
Zinc
Slightly higher in wastewater than stormwater.
Higher in new residential stormwater than old residential stormwater.
Other Conclusions
Sampling methods were validated and possible areas of contamination were determined. PBDE
contamination found in our blanks may be due to glassware, mixing container, or blank water
contamination. We will continue to run blanks to isolate and help determine the cause. This
will include labware blanks and rinsate blanks along with our standard blanks. PCB
contamination in the rinsate showed decontamination procedures may need to be more
thorough. We are considering adding an additional acetone rinse. According to Pacific Rim,
often times PCB blank contamination is from sample bottles received from the lab instead of the
water, but neither can be ruled out at this point.
Dioxin/furan are detectable in wastewater and stormwater using EPA Method 1613B. This
finding can be used to detect this contaminant in stormwater outfalls and for in-line branch
source tracing in wastewater and stormwater pipes if sediment collection is not possible.
Additional safety equipment should be purchased to perform sampling on busy thoroughfares.
LLSWD provided staff and equipment to safely sample on Appleway Ave.

Page 36
Recommendations
Source Identification All contaminants were found in residential stormwater and wastewater at low levels. Further outfall
and wastewater sampling will determine whether the hydrology of the Spokane River in combination
with point and non-point sources explain some of our elevated levels compared to the rest of
Washington State, especially for PBDE. Hydrologic features such as aquifer interchange and
decreased channel flow around Nine Mile and Lake Spokane may be a factor. River sediment
movement and the affects of aquifer water chemistry and temperature would be useful information for
understanding our CoC issues.
More data is needed to determine whether we should continue sampling TSS, TOC, TDS, and DOC
in water to assist with source tracing. Additional comparisons such as congener patterns may be
useful in determining a source.
Total PBDE have a large range of values for stormwater and wastewater. The large PBDE
wastewater range may indicate a source from wastewaters from new residential neighborhoods, but
more data is needed.
PBDEs
Finding PBDE-209 in some stormwater samples indicates there may be a current source of
PBDE from residential neighborhoods. ATSDR says if PBDE-209 is present, we are most
likely near a source (ATSDR 2004). The detection limit for stormwater PBDE-209 for
Ecology‟s 2007 study (Parsons and Terragraphics Inc 2007) was two times as high as those for
this study (~0.050 µg/L vs. ~0.025 µg/L respectively). One sample collected for this study was
below the detection limit of the previous study indicating the previous studies PBDE-209
detection limit may have prevented it from identifying an outfall for up-the-pipe source tracing.
Results from this study suggest drainage catchments in Spokane that differ in their age and
paved surface areas should be investigated for clues to source identification.
Sampling of wastewater treatment plant effluent will be important in determining how much of
a source they are to the river.
Air deposition may be a cause of stormwater contamination and future sampling should focus
on determining the contribution of this non-point source.
Broaden idea of source tracing to include the following:
Better understand river sediment movement and aquifer chemistry effects on CoC
movement in the river to better understand the link of fish tissue concentrations to source
location.
Sample more outfalls multiple times to increase accuracy and determine seasonal variation.

Page 37
Focus on wastewater sources to reduce concentration in influent, mostly residential
(education) and possibly business sectors associated with residential work (laundromats,
carpet cleaners, furniture shops, re-upholsterers, etc.).
Determine influence of local and long-range air deposition on stormwater collection systems
and river concentrations.
PCB PCB were found everywhere, but at low levels. The Parsons and Terragraphics 2007
stormwater study showed several basins at substantially higher concentrations including CSO34
and Union Basin. We should begin our source tracing efforts in these basins.
Dioxin/Furan
If future Spokane sampling results are found to be similar to this study‟s results, then overall
concentrations will be within the typical background range for Washington State (Yake et al
2000). We may need to focus on river hydrology if that is the case.
Include influent and effluent monitoring for dioxin/furan during large storm events and the rainy
seasons in the city of Spokane‟s wastewater treatment plant permit. Sampling indicated
stormwater may be a larger source than wastewater for this contaminant.
Metals Zinc may be more of an issue in newer residential neighborhoods. We noted more galvanized
housing materials and paved surface area that could increase tire wear. One focus for future
sampling should be on building materials and to continue looking at newer residential
neighborhoods to understand their relative contributions.
Industrial areas should still be sampled for source identification.
General Recommendations
More data points are needed to increase confidence in the results, better define variability of
target contaminants, and to determine background urban concentration ranges.
Turbidity should be included in field measurements when collecting stormwater samples to
assist with source tracing.
Hardness will also need to be collected in conjunction with metals analysis to assist with
determining compliance with the Water Quality Standards.
Develop and validate an in-line sediment trap for stormwater to collect data over time. We have
begun testing an in-line storm-sediment trap that may produce a better picture of the overall
contribution from a catchment for those contaminants that adsorb to particulates. This would
enhance the water sampling, but it will not be a replacement. Previous semi-permeable membrane
device sampling in the Spokane River along with other studies from around the world show
congeners within a particular contaminant group have variable physicochemical characteristics thus
some will adsorb to sediment while others will remain in the dissolved phase under the same

Page 38
conditions. In turn, variable conditions within the same catchment (new source release, changing
acidity, other contaminants, TSS, TOC) may alter where a congener partitions from one storm or
flush to the next.
Purchase a separate, large capacity refrigerator in a designated space where hazardous chemicals
are acceptable to store. The refrigerator in the Sample Prep room froze our sediment samples
and does not have the storage capacity we need for large volumes of samples. This location also
does not allow hazardous material storage (e.g., acetone, nitric acid).
Develop agreement with jurisdictional local authority for assistance with confined spaced entry
work for sediment collection in pipes when necessary.
Purchase additional safety equipment for working on busy thoroughfares (cones, vehicle
flashing utility light, reflective rain gear, directional or „Men at Work‟ signs).
References
Agency for Toxic Substances and Disease Registry (ATSDR). 2000. Toxicological Profile for
Polychlorinated Biphenyls (PCB). U.S. Department of Health and Human Services, Public Health
Service, Atlanta, GA.
Agency for Toxic Substances and Diesease Registry (ATSDR). 2004. Toxicological Profile for
Polybrominated Biphenyls and Polybrominated Diphenyl Ethers (PBB and PBDE). U.S.
Department of Health and Human Services, Public Health Service, Atlanta, GA.
BSEF. 2002. An introduction to brominated flame retardants. Brussels, Belgium: Bromine Science
and Environmental Forum, 1-28.
Ecology. 1995. Department of Ecology 1993-94 Investigation of PCB in the Spokane River.
Washington Department of Ecology, Olympia, WA. Publication No. 95-310.
Fernandez, A. and T. Hamlin. 2008. Sampling and Analysis Plan (SAP) and Quality Assurance
Project Plan (QAPP) for the Liberty Lake Source Trace Study Regarding PCB, PBDE, Metals, and
Dioxin/Furan. Washington Department of Ecology, Olympia, WA.
Hopkins, B.S., D.K. Clark, M. Schlender, and M. Stinson. 1985. Basic Water Monitoring Program:
Fish Tissue and Sediment Sampling for 1984. Washington Department of Ecology, Olympia, WA.
Publication No. 85-7.
Jack, R. and M. Roose. 2002. Analysis of Fish Tissue from Long Lake (Spokane River) for PCB and
Selected Metals. Washington Department of Ecology, Olympia, WA. Publication No. 02-03-049.
Johnson, A. 2001. An Ecological Hazard Assessment for PCB in the Spokane River. Washington
State Department of Ecology, Olympia, WA. Publication No. 01-03-015.

Page 39
Johnson, A., 2008. Quality Assurance Project Plan: PCB and Dioxin Levels in Resident Fish from
Washington Background Lakes and Rivers. Washington State Department of Ecology, Olympia,
WA. Publication No. 08-03-102. http://www.ecy.wa.gov/biblio/0803102.html
Johnson, A. and D. Norton. 2001. Chemical Analysis and Toxicity Testing of Spokane River
Sediments Collected in October 2000. Washington Department of Ecology, Olympia, WA.
Publication No. 01-03-019.
Johnson, A and N. Olsen, 2001. Analysis and Occurrence of Polybrominated Diphenyl Ethers in
Washington State Freshwater Fish. Article in Archives of Environmental Contamination and
Toxicology 41, 339-344.
Johnson, A., K. Seiders, C. Deligeannis, K. Kinney, P. Sandvik, B. Era-Miller and D. Alkire, 2006.
PBDE Flame Retardants in Washington Rivers and Lakes: Concentrations in Fish and Waste, 2005-
06. Washington Department of Ecology, Olympia, WA. Publication No. 06-03-027
Kersten, M., and Smedes, F. 2002. Normalization procedures for sediment contaminants in spatial
and temporal trend monitoring - a critical review, J. Environ. Monit., 4: 109–115.
King County Department of Natural Resources & Parks (KCDNRP), 2009. 2005-2007 Water
Quality Status Report for Marine Waters: Section 4. Summary of Sediment Monitoring Data.
http://your.kingcounty.gov/dnrp/library/2009/kcr2020/Section-4.pdf.
MEL, 2008. Manchester Environmental Laboratory Lab Users Manual, Ninth Edition. Manchester
Environmental Laboratory, Washington State Department of Ecology, Manchester, WA.
Panero, M., S. Boehme, and G. Munoz. 2005. Pollution Prevention and Management Strategies for
Polychlorinated Biphenyls in the New York/New Jersey Harbor. New York Academy of Sciences,
New York, NY.
Parsons and Terragraphics, Inc, 2007. Spokane River PCB TMDL Stormwater Loading Analysis
Final Technical Report. Prepared by Parsons for USEPA Region 10 and Washington State
Department of Ecology, Manchester, WA. http://www.ecy.wa.gov/biblio/0703055.html
Peele, C. 2004. Washington State Polybrominated Diphenyl Ethers (PBDE) Chemical Action Plan:
Final Plan. Washington Department of Ecology, Olympia, WA. Publication No. 05-07-048.
Pelletier, G. 1998. Cadmium, Lead, and Zinc in the Spokane River Recommendations for TMDL
and Waste Load Allocations. Washington Department of Ecology, Olympia, WA. Publication No.
98-329.
PSEP (Puget Sound Estuary Program), 1986. Recommended Protocols for Measuring Conventional
Sediment Variables in Puget Sound. Prepared for U.S. Environmental Protection Agency Region
10, Office of Puget Sound, Seattle, WA and Puget Sound Water Quality Authority, Olympia, WA.
Prepared by Tetra Tech, Inc., Bellevue, WA. Minor revisions in 2003. 43 pages.

Page 40
Seiders, K., C. Deligeannis, and K. Kinney. 2006. Washington State Toxics Monitoring Program:
Toxic Contaminants in Fish Tissue and Surface Water in Freshwater Environments, 2003.
Washington Department of Ecology, Olympia, WA. Publication No. 06-03-019.
Seiders, K., C. Deligeannis, and P. Sandvik, 2007. Washington State Toxics Monitoring Program:
Contaminants in Fish Tissue from Freshwater Environments in 2004 and 2005. Washington State
Department of Ecology, Olympia, WA. Publication No. 07-03-024.
www.ecy.wa.gov/biblio/0703024.html
Serdar, D., and A. Johnson, 2006b. PCB, PBDE, and Selected Metals in Spokane River Fish, 2005.
WA. St. Dept. of Ecology Olympia, WA. Publication No. 06-03-025.
http://www.ecy.wa.gov/pubs/0603025.pdf
Serdar, D., K. Kinney, and P. Hallinan, 2006a. Spokane River PCBs Total Maximum Daily Load
Study (DRAFT report). WA. St. Dept. of Ecology Olympia, WA. Publication No. 06-03-024.
http://www.ecy.wa.gov/biblio/0603024.html
Toxics Investigations Section. 1995. Department of Ecology 1993-94 Investigation of PCB in the
Spokane River. Environmental Investigations and Laboratory Services Program, Olympia, WA.
USEPA. 2008. Method 1668B: Chlorinated Biphenyl Congeners in Water, Soil, Sediment,
Biosolids, and Tissue by HRGC/HRMS. U.S. Environmental Protection Agency, Office of Water,
Office of Science and Technology, Engineering and Analysis Division (4303T), Washington, DC.
Publication No. EPA-821-R-08-020.
USGS. 2003. Surface-Water/Ground-Water Interaction of the Spokane River and Spokane
Valley/Rathdrum Prairie Aquifer, Idaho and Washington. U.S. Geological Survey and U.S.
Department of the Interior, Reston, VA. Water Resources Investigations Report 03-4239.
USGS. 2007. Ground-water Flow Model for the Spokane Valley-Rathdrum Prairie Aquifer,
Spokane County, Washington, and Bonner and Kootenai Counties, Idaho. U.S. Geological Survey
and U.S. Department of the Interior, Reston, VA. Scientific Investigations Report 2007-5044.
Van den Berg et al. 2005. The 2005 World Health Organization Re-evaluation of Human and
Mammalian Toxic Equivalency Factors for Dioxin and Dioxin-like compounds.
WAC 173-201A. Water Quality Standards for Surface Waters in the State of Washington
Washington State Department of Ecology, Olympia, WA. www.ecy.wa.gov/laws-rules/ecywac.html
Wania F, Dugani C. 2002. Assessing the long range transport potential of polybrominated diphenyl
ethers: A comparison of four multimedia models. Final report. University of Toronto at
Scarborough, Scarborough, Ontario.
Wilson, C. and D. Norton. 1996. Stormwater sediment trap pilot study. Washington Department of
Ecology, Olympia, WA. Publication No. 96-347.

Page 41
WinWard environmental LLC. 2007. Lower Duwamish Waterway Remedial Investigation.
Prepared for USEPA and Washington State Department of Ecology. Seattle, WA.
Yake B., S. Singleton, and K. Erickson. 1998. Washington State Dioxin Source Assessment.
Washington State Department of Ecology, Olympia, WA. Publication No. 98-320
http://www.ecy.wa.gov/biblio/98320.html
Yake, B., D. Rogowski, L. Goldstein, and G. Pelletier, 2000. Dioxin in Washington State Soils.
Washington State Department of Ecology, Olympia, WA, Publication No. 00-03-045.
Yake, B., S. Singleton, and K. Erickson. 2000. Washington State Dioxin Source Assessment.
Washington State Department of Ecology, Olympia, WA. Publication No. 00-03-044.

Page A-1
Appendices
Appendix A. Glossary, Acronyms, Abbreviations, and Units of Measurement
Glossary
Clean Water Act: A federal act passed in 1972 that contains provisions to restore and maintain the
quality of the nation‟s waters. Section 303(d) of the Clean Water Act establishes the Total
Maximum Daily Load (TMDL) program.
Conductivity: A measure of water‟s ability to conduct an electrical current. Conductivity is
related to the concentration and charge of dissolved ions in water.
Dissolved oxygen (DO): A measure of the amount of oxygen dissolved in water.
National Pollutant Discharge Elimination System (NPDES): National program for issuing,
modifying, revoking and reissuing, terminating, monitoring, and enforcing permits, and imposing
and enforcing pretreatment requirements under the Clean Water Act. The NPDES program
regulates discharges from wastewater treatment plants, large factories, and other facilities that use,
process, and discharge water back into lakes, streams, rivers, bays, and oceans.
Nonpoint source: Pollution that enters any waters of the state from any dispersed land-based or
water-based activities, including but not limited to atmospheric deposition, surface water runoff from
agricultural lands, urban areas, or forest lands, subsurface or underground sources, or discharges from
boats or marine vessels not otherwise regulated under the NPDES program. Generally, any
unconfined and diffuse source of contamination. Legally, any source of water pollution that does not
meet the legal definition of “point source” in section 502(14) of the Clean Water Act.
Parameter: Water quality constituent being measured (analyte). A physical, chemical, or
biological property whose values determine environmental characteristics or behavior.
pH: A measure of the acidity or alkalinity of water. A low pH value (0 to 7) indicates that an acidic
condition is present, while a high pH (7 to 14) indicates a basic or alkaline condition. A pH of 7 is
considered to be neutral. Since the pH scale is logarithmic, a water sample with a pH of 8 is ten times
more basic than one with a pH of 7.
Point source: Sources of pollution that discharge at a specific location from pipes, outfalls, and
conveyance channels to a surface water. Examples of point source discharges include municipal
wastewater treatment plants, municipal stormwater systems, industrial waste treatment facilities,
and construction sites that clear more than 5 acres of land.
Pollution: Such contamination, or other alteration of the physical, chemical, or biological properties,
of any waters of the state. This includes change in temperature, taste, color, turbidity, or odor of the
waters. It also includes discharge of any liquid, gaseous, solid, radioactive, or other substance into
any waters of the state. This definition assumes that these changes will, or is likely to, create a
nuisance or render such waters harmful, detrimental, or injurious to (1) public health, safety, or

Page A-2
welfare, or (2) domestic, commercial, industrial, agricultural, recreational, or other legitimate
beneficial uses, or (3) livestock, wild animals, birds, fish, or other aquatic life.
Salmonid: Any fish that belong to the family Salmonidae. Basically, any species of salmon, trout,
or char. www.fws.gov/le/ImpExp/FactSheetSalmonids.htm
Stormwater: The portion of precipitation that does not naturally percolate into the ground or
evaporate but instead runs off roads, pavement, and roofs during rainfall or snow melt. Stormwater
can also come from hard or saturated grass surfaces such as lawns, pastures, playfields, and from
gravel roads and parking lots.
Surface waters of the state: Lakes, rivers, ponds, streams, inland waters, salt waters, wetlands and
all other surface waters and watercourses within the jurisdiction of Washington State.
Total Maximum Daily Load (TMDL): Water cleanup plan. A distribution of a substance in a
waterbody designed to protect it from exceeding water quality standards. A TMDL is equal to the
sum of all of the following: (1) individual wasteload allocations for point sources, (2) the load
allocations for nonpoint sources, (3) the contribution of natural sources, and (4) a Margin of Safety
to allow for uncertainty in the wasteload determination. A reserve for future growth is also
generally provided.
Watershed: A drainage area or basin in which all land and water areas drain or flow toward a
central collector such as a stream, river, or lake at a lower elevation.
303(d) list: Section 303(d) of the federal Clean Water Act requires Washington State to
periodically prepare a list of all surface waters in the state for which beneficial uses of the water –
such as for drinking, recreation, aquatic habitat, and industrial use – are impaired by pollutants.
These are water quality limited estuaries, lakes, and streams that fall short of state surface water
quality standards, and are not expected to improve within the next two years.
Acronyms and Abbreviations
Following are acronyms and abbreviations used frequently in this report.
CoC Contaminant of concern
DOC Dissolved organic carbon
Ecology Washington State Department of Ecology
EIM Environmental Information Management database
EPA U.S. Environmental Protection Agency
GIS Geographic Information System software
MEL Manchester Environmental Laboratory
NPDES (See Glossary above)
PBDE polybrominated diphenyl ethers
PCB polychlorinated biphenyls
PBT persistent, bioaccumulative, and toxic substance
RPD Relative percent difference

Page A-3
TDS Total dissolved solids
TMDL (See Glossary above)
TOC Total organic carbon
TSS Total suspended solids
USGS U.S. Geological Survey
WAC Washington Administrative Code
WRIA Water Resources Inventory Area
WWTP Wastewater treatment plant
Units of Measurement
°C degrees centigrade
dw dry weight
ft feet
g gram, a unit of mass
kg kilograms, a unit of mass equal to 1,000 grams.
mg milligrams
mg/Kg milligrams per kilogram (parts per million)
mg/L milligrams per liter (parts per million)
mL milliliters
ng/Kg nanograms per kilogram (parts per trillion)
ng/L nanograms per liter (parts per trillion)
NTU nephelometric turbidity units
pg/L picograms per liter (parts per quadrillion)
µg/Kg micrograms per kilogram (parts per billion)
µg/L micrograms per liter (parts per billion)
μm micrometer
umhos/cm micromhos per centimeter

Page B-1
Appendix B. Figures
Figure B- 1. Wastewater sampling locations.

Page B-2
Figure B- 2. Drainage area of piped stormwater systems in Liberty Lake study area. The Garden system collection point is marked with a .
West LL
Gardens

Page B-3
Figure B- 3. WestLL stormwater sampling subbasins. Stormwater sample locations are marked with a .
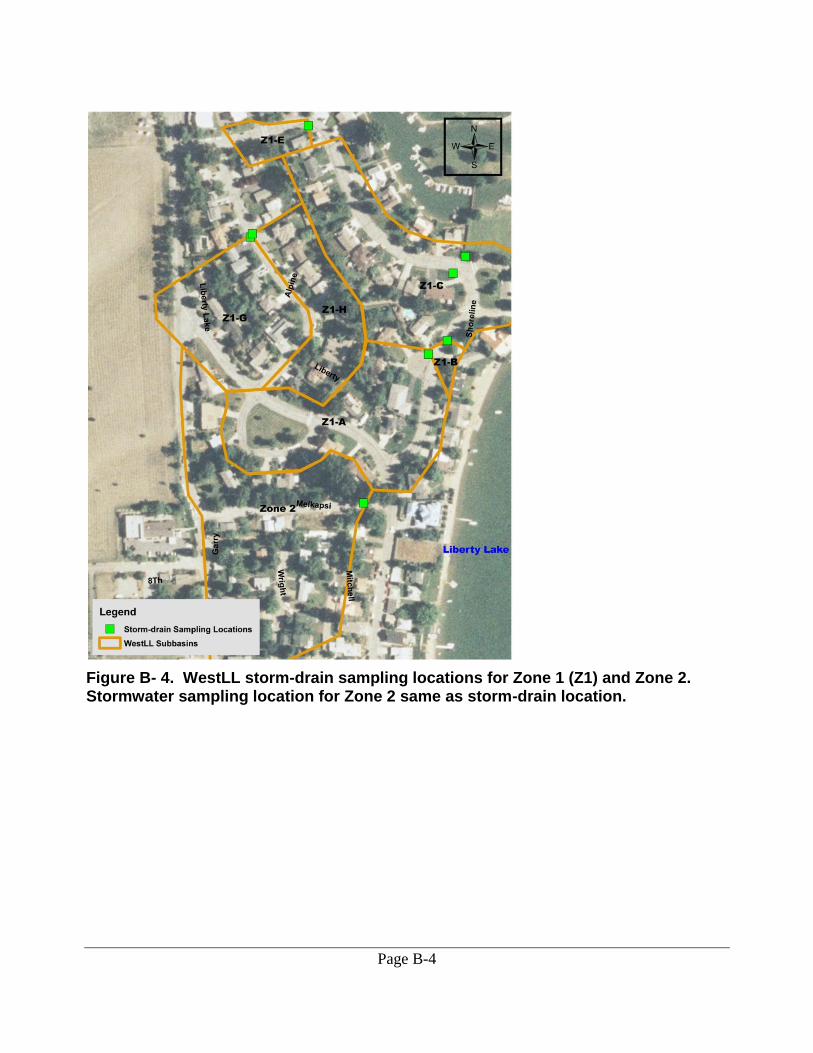
Page B-4
Figure B- 4. WestLL storm-drain sampling locations for Zone 1 (Z1) and Zone 2. Stormwater sampling location for Zone 2 same as storm-drain location.

Page B-5
Figure B- 5. WestLL storm-drain sampling locations for Zone 3 (Z3). Same locations as stormwater samples.

Page C-1
Appendix C. Contaminant Data Table C-1. Total recoverable metal results for storm-drain sediment in mg/Kg
Site ID Antimony Arsenic Beryllium Cadmium Chromium Copper Lead Mercury Nickel Selenium Silver Thallium Zinc
West LL-Zone 1
0.19 11.6 0.44 J 0.42 18.3 25.7 23.8 0.026 12.8 0.5 0.16 0.16 152
West LL-Zone 2
0.16 9.87 0.42 J 0.18 12 13.4 22.3 0.014 10.7 0.38 0.064 0.12 220
West LL-Zone 3
0.3 J 10.4 0.49 J 0.508 24.6 43.8 J 43.1 J 0.055 18.5 0.49 0.49 0.14 169
J = Result is an estimate
Table C-2. Total recoverable metal results for wastewater in µg/L
Site ID Antimony Arsenic Beryllium Cadmium Chromium Copper Lead Mercury Nickel Selenium Silver Thallium Zinc
AP1-2 0.45 3.17 0.10 U 0.12 9.41 101 1.58 0.101 16.9 0.94 0.56 0.10 U 177
SR1-2 0.25 2.64 0.10 U 0.10 1.47 59.3 1.00 0.05 U 1.67 0.50 U 1.61 0.10 U 121
OR1-4 0.62 2.90 0.10 J 0.13 2.03 37.9 1.06 0.05 U 1.61 0.69 0.15 0.10 U 180
MI2-2 Rep 0.2 U 3.00 0.10 U 0.10 U 0.82 32.7 0.45 0.05 U 1.00 0.50 U 0.10 U 0.10 U 77.7 J
MI2-2 0.53 3.07 0.10 J 0.12 1.48 45.3 0.95 0.05 U 1.90 0.58 0.10 U 0.10 U 136
Rep = replicate U = Not detected at the sample quantitation limit shown J = Result is an estimate Bold = Visual aid for detected compounds
Table C-3. Total recoverable metal results for stormwater in µg/L
Site ID Antimony Arsenic Beryllium Cadmium Chromium Copper Lead Mercury Nickel Selenium Silver Thallium Zinc
WestLL-Zone 2
0.69 3.82 0.18 0.18 5.12 13.9 16.6 0.05 U 4.69 0.5 U 0.1 U 0.1 U 110
WestLL-Zone 3B
0.72 4.57 0.19 0.16 11.8 13.3 14.1 0.05 U 7.9 0.5 U 0.1 U 0.1 U 84
WestLL-Zone 3C
0.48 1.74 0.1 U 0.1 U 2.1 10.7 6.62 0.05 U 1.66 0.5 U 0.1 U 0.1 U 61.1
Gardens 0.2 U 0.41 0.1 U 0.1 U 0.55 1.09 0.31 0.05 U 0.33 0.5 U 0.1 U 0.1 U 130
U = Not detected at the sample quantitation limit shown Bold = Visual aid for detected compounds

Page C-2
Table C-4. PBDE storm-drain sediment composite results for West LL in µg/Kg DW. Those values qualified as U and UJ are not reflected in calculated totals.
PBDE Congener West LL-Zone 1 West LL-Zone 2 West LL- Zone 3
PBDE-47 3.8 0.27 U 3.2
PBDE-49 0.26 U 0.27 U 0.77 U
PBDE-66 0.26 U 0.27 U 0.77 U
PBDE-71 0.26 U 0.27 U 0.77 U
PBDE-99 5.5 0.27 U 2.7
PBDE-100 1.6 0.27 U 0.77 U
PBDE-138 0.52 U 0.54 U 1.5 UJ
PBDE-153 0.52 U 0.54 U 1.5 U
PBDE-154 0.52 U 0.54 U 1.5 U
PBDE-183 0.52 U 0.54 U 1.5 U
PBDE-184 0.52 U 0.54 U 1.5 U
PBDE-191 0.52 U 0.54 U 1.5 U
PBDE-209 6.5 U 6.8 U 19.2UJ
PBDE total 10.9 6.8 U 5.9
Bold = Visual aid for detected compounds U = Not detected at the sample quantitation limit shown UJ = Estimated detection limit
Table C-5. PBDE stormwater results in µg/L
Parameter West LL-Zone 2 West LL-Zone 3B West LL-Zone 3C Gardens
PBDE- 47 0.0022 0.0058 0.001 U 0.0008 J
PBDE- 49 0.001 U 0.001 U 0.001 U 0.001 U
PBDE- 66 0.001 U 0.001 U 0.001 U 0.001 U
PBDE- 71 0.001 U 0.001 U 0.001 U 0.001 U
PBDE- 99 0.0016 B 0.0027 B 0.0007 B 0.0005 B
PBDE-100 0.001 U 0.001 U 0.001 U 0.001 U
PBDE-138 0.002 U 0.002 U 0.004 U 0.002 U
PBDE-153 0.002 U 0.002 U 0.002 U 0.002 U
PBDE-154 0.002 U 0.002 U 0.002 U 0.002 U
PBDE-183 0.002 U 0.002 U 0.002 U 0.002 U
PBDE-184 0.002 U 0.002 U 0.004 U 0.002 U
PBDE-191 0.002 U 0.002 U 0.004 U 0.002 U
PBDE-209 0.046 0.025 U 0.073 0.027 U
PBDE total 0.0482 J 0.0058 J 0.073 0.0008 J
Bold = Visual aid for detected compounds U = Not detected at the sample quantitation limit shown UJ = Estimated detection limit J = Result is an estimate B = Result less than five times blank contamination.

Page C-3
Table C-6. PBDE results for Liberty Lake Sewer and Water District wastewater treatment plant influent 12-hour composite samples and in-line wastewater samples in µg/L
*Mean of field replicates Bold = Visual aid for detected compounds U = Not detected at the sample quantitation limit shown Rep = replicate UJ = Estimated detection limit J = Result is an estimate
Parameter Influent
Day Influent Day Rep
*Influent Day
Influent Night AP1-2 MI2-2 MI2-2 Rep. MI2-2* OR1-4 SR1-2
PBDE-47 0.044
J 0.041
J --- 0.042
J 0.02 0.072 0.027 --- 0.27
J 0.11
J
PBDE-49 0.001
UJ 0.001
UJ --- 0.001
UJ 0.004
U 0.004
U 0.004
U --- 0.006
J 0.003
J
PBDE-66 0.001
UJ 0.001
UJ --- 0.001
UJ 0.004
U 0.004
U 0.004
U --- 0.004
UJ 0.004
UJ
PBDE-71 0.001
UJ 0.001
UJ --- 0.001
UJ 0.004
U 0.004
U 0.004
U --- 0.004
UJ 0.004
UJ
PBDE-99 0.041
J 0.037
J --- 0.042
J 0.02 0.077 0.029 --- 0.25
J 0.11
J
PBDE-100 0.0094
J 0.01
J --- 0.0076
J 0.003
J 0.015 0.005 --- 0.045
J 0.02
J
PBDE-138 0.002
UJ 0.002
UJ --- 0.002 UJ 0.009
U 0.009
U 0.008
U --- 0.008
UJ 0.009
UJ
PBDE-153 0.0053
J 0.005
J --- 0.0044
J 0.009
U 0.01 0.003
J --- 0.024
J 0.012
J
PBDE-154 0.0034
J 0.0038
J --- 0.003
J 0.003
J 0.007
J 0.004
J --- 0.014
J 0.009
J
PBDE-183 0.00053
J 0.00051
J --- 0.002 UJ 0.009
U 0.009
U 0.008
U --- 0.008
UJ 0.009
UJ
PBDE-184 0.002
UJ 0.002
UJ --- 0.002 UJ 0.009
U 0.009
U 0.008
U --- 0.008
UJ 0.009
UJ
PBDE-191 0.002
UJ 0.002
UJ --- 0.002 UJ 0.009
U 0.009
U 0.008
U --- 0.008
UJ 0.009
UJ
PBDE-209 0.052
J 0.048
J --- 0.04
J 0.27 0.081 0.024 --- 0.47
J 0.091
J
PBDE Total 0.156
J 0.145
J 0.152
J 0.139
J 0.316
J 0.262 0.092 0.177
1.079
J 0.355
J
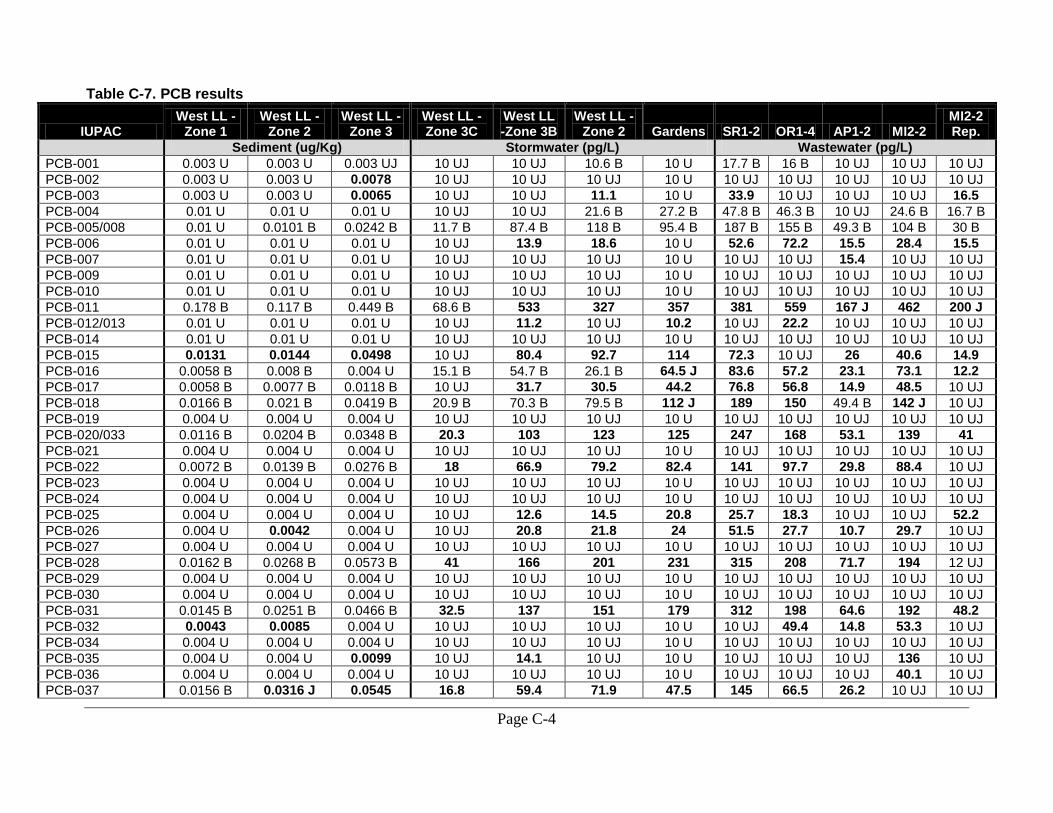
Page C-4
Table C-7. PCB results
IUPAC West LL -
Zone 1 West LL -
Zone 2 West LL -
Zone 3 West LL -Zone 3C
West LL -Zone 3B
West LL -Zone 2 Gardens SR1-2 OR1-4 AP1-2 MI2-2
MI2-2 Rep.
Sediment (ug/Kg) Stormwater (pg/L) Wastewater (pg/L)
PCB-001 0.003 U 0.003 U 0.003 UJ 10 UJ 10 UJ 10.6 B 10 U 17.7 B 16 B 10 UJ 10 UJ 10 UJ
PCB-002 0.003 U 0.003 U 0.0078 10 UJ 10 UJ 10 UJ 10 U 10 UJ 10 UJ 10 UJ 10 UJ 10 UJ
PCB-003 0.003 U 0.003 U 0.0065 10 UJ 10 UJ 11.1 10 U 33.9 10 UJ 10 UJ 10 UJ 16.5
PCB-004 0.01 U 0.01 U 0.01 U 10 UJ 10 UJ 21.6 B 27.2 B 47.8 B 46.3 B 10 UJ 24.6 B 16.7 B
PCB-005/008 0.01 U 0.0101 B 0.0242 B 11.7 B 87.4 B 118 B 95.4 B 187 B 155 B 49.3 B 104 B 30 B
PCB-006 0.01 U 0.01 U 0.01 U 10 UJ 13.9 18.6 10 U 52.6 72.2 15.5 28.4 15.5
PCB-007 0.01 U 0.01 U 0.01 U 10 UJ 10 UJ 10 UJ 10 U 10 UJ 10 UJ 15.4 10 UJ 10 UJ
PCB-009 0.01 U 0.01 U 0.01 U 10 UJ 10 UJ 10 UJ 10 U 10 UJ 10 UJ 10 UJ 10 UJ 10 UJ
PCB-010 0.01 U 0.01 U 0.01 U 10 UJ 10 UJ 10 UJ 10 U 10 UJ 10 UJ 10 UJ 10 UJ 10 UJ
PCB-011 0.178 B 0.117 B 0.449 B 68.6 B 533 327 357 381 559 167 J 462 200 J
PCB-012/013 0.01 U 0.01 U 0.01 U 10 UJ 11.2 10 UJ 10.2 10 UJ 22.2 10 UJ 10 UJ 10 UJ
PCB-014 0.01 U 0.01 U 0.01 U 10 UJ 10 UJ 10 UJ 10 U 10 UJ 10 UJ 10 UJ 10 UJ 10 UJ
PCB-015 0.0131 0.0144 0.0498 10 UJ 80.4 92.7 114 72.3 10 UJ 26 40.6 14.9
PCB-016 0.0058 B 0.008 B 0.004 U 15.1 B 54.7 B 26.1 B 64.5 J 83.6 57.2 23.1 73.1 12.2
PCB-017 0.0058 B 0.0077 B 0.0118 B 10 UJ 31.7 30.5 44.2 76.8 56.8 14.9 48.5 10 UJ
PCB-018 0.0166 B 0.021 B 0.0419 B 20.9 B 70.3 B 79.5 B 112 J 189 150 49.4 B 142 J 10 UJ
PCB-019 0.004 U 0.004 U 0.004 U 10 UJ 10 UJ 10 UJ 10 U 10 UJ 10 UJ 10 UJ 10 UJ 10 UJ
PCB-020/033 0.0116 B 0.0204 B 0.0348 B 20.3 103 123 125 247 168 53.1 139 41
PCB-021 0.004 U 0.004 U 0.004 U 10 UJ 10 UJ 10 UJ 10 U 10 UJ 10 UJ 10 UJ 10 UJ 10 UJ
PCB-022 0.0072 B 0.0139 B 0.0276 B 18 66.9 79.2 82.4 141 97.7 29.8 88.4 10 UJ
PCB-023 0.004 U 0.004 U 0.004 U 10 UJ 10 UJ 10 UJ 10 U 10 UJ 10 UJ 10 UJ 10 UJ 10 UJ
PCB-024 0.004 U 0.004 U 0.004 U 10 UJ 10 UJ 10 UJ 10 U 10 UJ 10 UJ 10 UJ 10 UJ 10 UJ
PCB-025 0.004 U 0.004 U 0.004 U 10 UJ 12.6 14.5 20.8 25.7 18.3 10 UJ 10 UJ 52.2
PCB-026 0.004 U 0.0042 0.004 U 10 UJ 20.8 21.8 24 51.5 27.7 10.7 29.7 10 UJ
PCB-027 0.004 U 0.004 U 0.004 U 10 UJ 10 UJ 10 UJ 10 U 10 UJ 10 UJ 10 UJ 10 UJ 10 UJ
PCB-028 0.0162 B 0.0268 B 0.0573 B 41 166 201 231 315 208 71.7 194 12 UJ
PCB-029 0.004 U 0.004 U 0.004 U 10 UJ 10 UJ 10 UJ 10 U 10 UJ 10 UJ 10 UJ 10 UJ 10 UJ
PCB-030 0.004 U 0.004 U 0.004 U 10 UJ 10 UJ 10 UJ 10 U 10 UJ 10 UJ 10 UJ 10 UJ 10 UJ
PCB-031 0.0145 B 0.0251 B 0.0466 B 32.5 137 151 179 312 198 64.6 192 48.2
PCB-032 0.0043 0.0085 0.004 U 10 UJ 10 UJ 10 UJ 10 U 10 UJ 49.4 14.8 53.3 10 UJ
PCB-034 0.004 U 0.004 U 0.004 U 10 UJ 10 UJ 10 UJ 10 U 10 UJ 10 UJ 10 UJ 10 UJ 10 UJ
PCB-035 0.004 U 0.004 U 0.0099 10 UJ 14.1 10 UJ 10 U 10 UJ 10 UJ 10 UJ 136 10 UJ
PCB-036 0.004 U 0.004 U 0.004 U 10 UJ 10 UJ 10 UJ 10 U 10 UJ 10 UJ 10 UJ 40.1 10 UJ
PCB-037 0.0156 B 0.0316 J 0.0545 16.8 59.4 71.9 47.5 145 66.5 26.2 10 UJ 10 UJ

Page C-5
IUPAC West LL -
Zone 1 West LL -
Zone 2 West LL -
Zone 3 West LL -Zone 3C
West LL -Zone 3B
West LL -Zone 2 Gardens SR1-2 OR1-4 AP1-2 MI2-2
MI2-2 Rep.
Sediment (ug/Kg) Stormwater (pg/L) Wastewater (pg/L)
PCB-038 0.004 U 0.004 U 0.004 U 10 UJ 10 UJ 10 UJ 10 U 10 UJ 10 UJ 10 UJ 10 UJ 10 UJ
PCB-039 0.004 U 0.004 U 0.004 U 10 UJ 10 UJ 10 UJ 10 U 10 UJ 10 UJ 10 UJ 10 UJ 10 UJ
PCB-040 0.0051 0.0113 0.003 UJ 10 UJ 19.7 10 UJ 10 U 10 UJ 24.6 13 10 UJ 10 UJ
PCB-041 0.003 U 0.0043 0.003 UJ 10 UJ 10 UJ 10 UJ 10 U 23.9 12.6 10 UJ 10 UJ 10 UJ
PCB-042 0.0059 0.0128 0.003 UJ 10 UJ 29.6 30.2 10 U 47.9 44.6 13.9 10 UJ 10 UJ
PCB-043/049 0.0158 B 0.0334 0.0616 J 10 UJ 81.7 67.8 49.2 210 146 36.8 84.3 10 UJ
PCB-044 0.0285 B 0.0619 J 0.107 25.3 118 104 62.1 302 201 58.2 109 51.4
PCB-045 0.0042 0.0071 0.003 U 10 UJ 16.6 10 UJ 10 U 39.6 28 10 UJ 20.5 10 UJ
PCB-046 0.003 U 0.0037 0.003 UJ 10 UJ 10 UJ 10 UJ 10 U 14.1 10 UJ 10 UJ 10 UJ 10 UJ
PCB-047/048 0.0043 B 0.008 B 0.0142 B 10 UJ 26.6 24.4 19.7 82.1 65.1 21.8 45.8 10 UJ
PCB-050 0.003 U 0.003 U 0.003 UJ 10 UJ 10 UJ 10 UJ 10 U 10 UJ 10 UJ 10 UJ 10 UJ 10 UJ
PCB-051 0.003 U 0.003 U 0.003 UJ 10 UJ 10 UJ 10 UJ 10 U 20 23.1 10 UJ 10 UJ 10 UJ
PCB-052/069 0.0402 B 0.0829 J 0.003 UJ 32.1 B 145 112 65.1 J 434 265 73.2 145 74.1
PCB-053 0.0047 0.0073 0.003 UJ 10 UJ 10 UJ 10 UJ 10 U 10 UJ 25.9 10 UJ 10 UJ 10 UJ
PCB-054 0.003 U 0.003 U 0.003 UJ 10 UJ 10 UJ 10 UJ 10 U 10 UJ 10 UJ 10 UJ 10 UJ 10 UJ
PCB-055 0.003 U 0.003 U 0.003 UJ 10 UJ 10 UJ 10 UJ 10 U 10 UJ 10 UJ 10 UJ 10 UJ 10 UJ
PCB-056 0.0282 0.0503 0.003 UJ 12.9 58.3 58.1 11.4 87.8 38.6 17.4 34.7 10 UJ
PCB-057 0.003 U 0.003 U 0.003 UJ 10 UJ 10 UJ 10 UJ 10 U 10 UJ 10 UJ 10 UJ 10 UJ 10 UJ
PCB-058 0.0051 0.0033 0.0204 10 UJ 10 UJ 10 UJ 10 U 10 UJ 10 UJ 10 UJ 10 UJ 10 UJ
PCB-059 0.003 U 0.0045 0.003 UJ 10 UJ 10 UJ 10 UJ 10 U 10 UJ 10 UJ 10 UJ 10 UJ 10 UJ
PCB-060 0.0142 0.026 0.003 UJ 10 UJ 10 UJ 30.7 10 U 58.8 54.3 17.1 19.1 10 UJ
PCB-061 0.003 U 0.003 U 0.003 UJ 10 UJ 10 UJ 10 UJ 10 U 10 UJ 10 UJ 10 UJ 10 UJ 10 UJ
PCB-062 0.003 U 0.003 U 0.003 UJ 10 UJ 10 UJ 10 UJ 10 U 10 UJ 10 UJ 10 UJ 10 UJ 10 UJ
PCB-063 0.003 U 0.003 U 0.003 UJ 10 UJ 10 UJ 10 UJ 10 U 10 UJ 10 UJ 10 UJ 10 UJ 10 UJ
PCB-064/072 0.0137 B 0.0317 J 0.0563 12.4 61.5 49.7 27.6 108 73.2 26.5 10 UJ 10 UJ
PCB-065/075 0.003 U 0.003 U 0.003 UJ 10 UJ 26.6 24.4 19.5 82.1 10 UJ 10 UJ 10 UJ 10 UJ
PCB-066 0.0299 UJ 0.08 0.095 24.3 93.3 10 UJ 28.7 182 129 38.9 55.1 99.4
PCB-067 0.003 U 0.003 U 0.003 UJ 10 UJ 10 UJ 10 UJ 10 U 10 UJ 10 UJ 10 UJ 10 UJ 10 UJ
PCB-068 0.003 U 0.003 U 0.003 UJ 10 UJ 10 UJ 10 UJ 10 U 10 UJ 10 UJ 10 UJ 10 UJ 10 UJ
PCB-070 0.0407 B 0.118 0.135 10 UJ 152 151 46.5 364 206 51.3 74.3 113
PCB-071 0.0069 0.0152 0.0289 10 UJ 31.2 10 UJ 10 U 61.5 40.1 12.9 10 UJ 10 UJ
PCB-073 0.003 U 0.003 U 0.003 UJ 10 UJ 10 UJ 10 UJ 10 U 10 UJ 10 UJ 10 UJ 10 UJ 10 UJ
PCB-074 0.0125 B 0.0371 0.0404 12.1 51.2 53.3 23 162 114 37.6 47.1 70.4
PCB-076 0.003 U 0.003 0.003 UJ 10 UJ 10 UJ 10 UJ 10 U 10 UJ 10 UJ 10 UJ 10 UJ 10 UJ
PCB-077 0.0177 0.0332 0.0304 10 UJ 20.1 29.9 10 U 17.5 13.7 10 UJ 10 UJ 10 UJ

Page C-6
IUPAC West LL -
Zone 1 West LL -
Zone 2 West LL -
Zone 3 West LL -Zone 3C
West LL -Zone 3B
West LL -Zone 2 Gardens SR1-2 OR1-4 AP1-2 MI2-2
MI2-2 Rep.
Sediment (ug/Kg) Stormwater (pg/L) Wastewater (pg/L)
PCB-078 0.003 U 0.003 U 0.003 UJ 10 UJ 10 UJ 10 UJ 10 U 10 UJ 10 UJ 10 UJ 10 UJ 10 UJ
PCB-079 0.003 U 0.003 U 0.003 UJ 10 UJ 10 UJ 10 UJ 10 U 10 UJ 10 UJ 10 UJ 10 UJ 10 UJ
PCB-080 0.003 U 0.003 U 0.003 UJ 10 UJ 10 UJ 10 UJ 10 U 10 UJ 10 UJ 10 UJ 10 UJ 10 UJ
PCB-081 0.0047 0.0103 0.003 UJ 10 UJ 10 UJ 10 UJ 10 U 10 UJ 10 UJ 10 UJ 10 UJ 10 UJ
PCB-082 0.0289 0.03 UJ 0.03 UJ 10 UJ 10 UJ 58.7 10 U 62.7 65.2 10 UJ 10 UJ 10 UJ
PCB-083 0.0113 0.03 UJ 0.03 UJ 10 UJ 10 UJ 10 UJ 10 U 10 UJ 10 UJ 10 UJ 10 UJ 10 UJ
PCB-084 0.0263 0.0648 0.0618 10 UJ 10 UJ 54.2 10 U 95.5 10 UJ 10 UJ 10 UJ 10 UJ
PCB-085 0.0414 0.03 UJ 0.03 UJ 10 UJ 85.9 64 10 U 71.6 31.2 10 UJ 10 UJ 10 UJ
PCB-086/097/117 0.0587 0.149 0.17 10 UJ 121 123 10 U 167 97.4 10 UJ 10 UJ 76.8
PCB-087/115 0.0658 0.184 0.194 18.2 133 133 10 U 217 115 10 UJ 53.5 10 UJ
PCB-088 0.003 U 0.03 UJ 0.03 UJ 10 UJ 10 UJ 10 UJ 10 U 10 UJ 10 UJ 10 UJ 10 UJ 10 UJ
PCB-089 0.003 U 0.03 UJ 0.03 UJ 10 UJ 10 UJ 10 UJ 10 U 10 UJ 10 UJ 10 UJ 10 UJ 10 UJ
PCB-090 0.003 U 0.03 UJ 0.03 UJ 10 UJ 10 UJ 10 UJ 10 U 10 UJ 10 UJ 10 UJ 10 UJ 182
PCB-091 0.0306 0.03 UJ 0.129 10 UJ 10 UJ 54.8 10 U 62.6 10 UJ 10 UJ 10 UJ 10 UJ
PCB-092 0.086 0.134 0.247 10 UJ 117 10 UJ 10 U 10 UJ 56.2 10 UJ 10 UJ 10 UJ
PCB-093/095/098/102 0.162 0.366 0.678 39.3 B 355 321 25.1 B 515 247 73 J 96.1 J 78 J
PCB-094 0.003 U 0.03 UJ 0.03 UJ 10 UJ 10 UJ 10 UJ 10 U 10 UJ 10 UJ 10 UJ 10 UJ 10 UJ
PCB-096 0.003 U 0.03 UJ 0.03 UJ 10 UJ 10 UJ 10 UJ 10 U 10 UJ 10 UJ 10 UJ 10 UJ 10 UJ
PCB-099 0.0566 0.156 0.17 18.5 113 134 10 U 229 119 10 UJ 29.4 10 UJ
PCB-100 0.003 U 0.03 UJ 0.03 UJ 10 UJ 10 UJ 10 UJ 10 U 10 UJ 10 UJ 10 UJ 10 UJ 10 UJ
PCB-101 0.154 0.382 0.44 49.5 B 315 329 43.3 B 632 253 85.7 116 174
PCB-103 0.003 U 0.03 UJ 0.03 UJ 10 UJ 10 UJ 10 UJ 10 U 10 UJ 41.6 10 UJ 10 UJ 10 UJ
PCB-104 0.003 U 0.03 UJ 0.03 UJ 10 UJ 10 UJ 10 UJ 10 U 10 UJ 10 UJ 10 UJ 10 UJ 10 UJ
PCB-105 0.0838 0.208 0.186 22.7 10 UJ 185 10 U 163 59 38.2 75.5 82.8
PCB-106 0.003 U 0.03 UJ 0.03 UJ 10 UJ 10 UJ 10 UJ 10 U 10 UJ 10 UJ 10 UJ 10 UJ 10 UJ
PCB-107/108 0.0143 0.03 UJ 0.0328 10 UJ 10 UJ 26.2 10 U 10 UJ 10 UJ 10 UJ 10 UJ 10 UJ
PCB-109 0.003 U 0.03 UJ 0.03 UJ 10 UJ 10 UJ 10 UJ 10 U 10 UJ 10 UJ 10 UJ 10 UJ 10 UJ
PCB-110 0.334 0.754 1.14 60.2 J 572 658 29.4 B 514 202 10 UJ 97.8 170
PCB-111 0.003 U 0.03 UJ 0.03 UJ 10 UJ 10 UJ 10 UJ 10 U 10 UJ 10 UJ 10 UJ 10 UJ 10 UJ
PCB-112/119 0.0034 0.03 UJ 0.03 UJ 10 UJ 10 UJ 10 UJ 10 U 10 UJ 22.5 10 UJ 10 UJ 10 UJ
PCB-113 0.003 U 0.03 UJ 0.03 UJ 10 UJ 10 UJ 10 UJ 10 U 10 UJ 10 UJ 10 UJ 10 UJ 10 UJ
PCB-114 0.0061 0.03 UJ 0.03 UJ 10 UJ 10 UJ 11 10 U 10 UJ 10 UJ 10 UJ 10 UJ 10 UJ
PCB-116/125 0.003 U 0.03 UJ 0.03 UJ 10 UJ 10 UJ 10 UJ 10 U 10 UJ 10 UJ 10 UJ 10 UJ 10 UJ
PCB-118 0.149 0.359 0.33 37.7 223 329 20.9 432 186 92.2 160 231

Page C-7
IUPAC West LL -
Zone 1 West LL -
Zone 2 West LL -
Zone 3 West LL -Zone 3C
West LL -Zone 3B
West LL -Zone 2 Gardens SR1-2 OR1-4 AP1-2 MI2-2
MI2-2 Rep.
Sediment (ug/Kg) Stormwater (pg/L) Wastewater (pg/L)
PCB-120 0.003 U 0.03 UJ 0.03 UJ 10 UJ 578 10 UJ 10 U 520 10 UJ 10 UJ 98.8 10 UJ
PCB-121 0.003 U 0.03 UJ 0.03 UJ 10 UJ 10 UJ 10 UJ 10 U 45 18.6 10 UJ 10 UJ 10 UJ
PCB-122 0.0038 0.03 UJ 0.03 UJ 10 UJ 10 UJ 10 UJ 10 U 10 UJ 10 UJ 10 UJ 10 UJ 10 UJ
PCB-123 0.0043 0.03 UJ 0.03 UJ 10 UJ 10 UJ 10 UJ 10 U 30.4 90.5 10 UJ 21.3 10 UJ
PCB-124 0.0072 0.03 UJ 0.03 UJ 10 UJ 10 UJ 15.3 10 U 10 UJ 10 UJ 10 UJ 10 UJ 11.6
PCB-126 0.0056 0.03 UJ 0.03 UJ 10 UJ 10 UJ 10 UJ 10 U 22.2 40.8 10 UJ 15.8 10 UJ
PCB-127 0.003 U 0.03 UJ 0.03 UJ 10 UJ 10 UJ 10 UJ 10 U 10 UJ 10 UJ 10 UJ 10 UJ 10 UJ
PCB-128 0.121 0.03 UJ 0.264 11 123 193 10 U 10 UJ 10 UJ 10 UJ 10 UJ 49.5
PCB-129 0.0196 0.0393 0.03 UJ 10 UJ 38.1 37.7 10 U 10 UJ 10 UJ 10 UJ 10 UJ 10 UJ
PCB-130 0.0281 0.0482 0.0738 10 UJ 10 UJ 50.8 10 U 10 UJ 10 UJ 10 UJ 10 UJ 25.1
PCB-131 0.0058 0.03 UJ 0.03 UJ 10 UJ 10 UJ 10 UJ 10 U 10 UJ 10 UJ 10 UJ 10 UJ 10 UJ
PCB-132 0.17 0.03 UJ 0.421 26.8 179 265 10 U 202 64.9 10 UJ 66.7 43.1
PCB-133 0.0046 0.03 UJ 0.03 UJ 10 UJ 10 UJ 10 UJ 10 U 10 UJ 10 UJ 10 UJ 10 UJ 10 UJ
PCB-134 0.0198 0.03 UJ 0.0518 10 UJ 10 UJ 34.8 10 U 10 UJ 10 UJ 10 UJ 10 UJ 10 UJ
PCB-135 0.0526 0.0633 0.144 10 UJ 10 UJ 57.4 10 U 54 10 UJ 10 UJ 10 UJ 10 UJ
PCB-136 0.0509 0.03 UJ 0.153 10 UJ 54.4 62 10 U 79.2 10 UJ 10 UJ 10 UJ 10 UJ
PCB-137 0.0242 0.0412 0.03 UJ 10 UJ 10 UJ 47.2 10 U 29.9 16.8 10 UJ 10 UJ 26.2
PCB-138 0.331 0.585 0.757 51.8 B 384 657 26.6 B 522 259 128 175 357
PCB-139/149 0.334 0.425 0.903 45.5 B 13 UJ 425 39.6 B 501 199 70.7 186 191
PCB-140 0.003 U 0.03 UJ 0.03 UJ 10 UJ 10 UJ 10 UJ 10 U 10 UJ 10 UJ 10 UJ 10 UJ 10 UJ
PCB-141 0.0629 0.0851 0.137 10 UJ 68.7 82.1 10 U 94.8 27.2 10 UJ 10 UJ 10 UJ
PCB-142 0.003 U 0.03 UJ 0.03 UJ 10 UJ 10 UJ 10 UJ 10 U 10 UJ 10 UJ 10 UJ 10 UJ 10 UJ
PCB-143 0.003 U 0.03 UJ 0.03 UJ 10 UJ 10 UJ 10 UJ 10 U 10 UJ 10 UJ 10 UJ 10 UJ 10 UJ
PCB-144 0.0158 0.03 UJ 0.051 10 UJ 10 UJ 10 UJ 10 U 10 UJ 10 UJ 10 UJ 10 UJ 10 UJ
PCB-145 0.003 U 0.03 UJ 0.03 UJ 10 UJ 10 UJ 10 UJ 10 U 10 UJ 10 UJ 10 UJ 10 UJ 10 UJ
PCB-146 0.0532 0.0648 0.03 UJ 10 UJ 59.3 81.5 10 U 79.9 40.2 10 UJ 10 UJ 78.1
PCB-147 0.0047 0.03 UJ 0.03 UJ 10 UJ 10 UJ 10 UJ 10 U 10 UJ 10 UJ 10 UJ 10 UJ 10 UJ
PCB-148 0.003 U 0.03 UJ 0.206 10 UJ 73.1 10 UJ 10 U 107 10 UJ 10 UJ 17.8 10 UJ
PCB-150 0.003 U 0.03 UJ 0.03 UJ 10 UJ 10 UJ 10 UJ 10 U 10 UJ 17.9 10 UJ 10 UJ 10 UJ
PCB-151 0.0744 0.086 0.248 10 UJ 10 UJ 72.7 10 U 151 43.6 10 UJ 10 UJ 46.8
PCB-152 0.003 U 0.03 UJ 0.03 UJ 10 UJ 10 UJ 10 UJ 10 U 10 UJ 10 UJ 10 UJ 10 UJ 10 UJ
PCB-153 0.3 0.405 0.639 43.1 B 338 440 28.3 B 626 319 137 154 432
PCB-154 0.003 U 0.03 UJ 0.03 UJ 10 UJ 10 UJ 10 UJ 10 U 10 UJ 10 UJ 10 UJ 10 UJ 10 UJ
PCB-155 0.003 U 0.03 UJ 0.03 UJ 10 UJ 10 UJ 10 UJ 10 U 23.8 196 10 UJ 10 UJ 10 UJ
PCB-156 0.0365 0.0649 0.0611 10 UJ 43.9 63.8 10 U 69.6 43.7 34.4 30 39.5

Page C-8
IUPAC West LL -
Zone 1 West LL -
Zone 2 West LL -
Zone 3 West LL -Zone 3C
West LL -Zone 3B
West LL -Zone 2 Gardens SR1-2 OR1-4 AP1-2 MI2-2
MI2-2 Rep.
Sediment (ug/Kg) Stormwater (pg/L) Wastewater (pg/L)
PCB-157 0.0092 0.03 UJ 0.03 UJ 10 UJ 17.5 20.8 10 U 10 UJ 10 UJ 10 UJ 10 UJ 10 UJ
PCB-158 0.039 0.0736 0.092 10 UJ 10 UJ 80.4 10 U 51.8 18.9 10 UJ 20.5 10 UJ
PCB-159 0.003 U 0.03 UJ 0.03 UJ 10 UJ 10 UJ 10 UJ 10 U 10 UJ 10 UJ 10 UJ 10 UJ 10 UJ
PCB-160 0.003 U 0.03 UJ 0.03 UJ 10 UJ 10 UJ 10 UJ 10 U 10 UJ 10 UJ 10 UJ 10 UJ 10 UJ
PCB-161 0.003 U 0.03 UJ 0.03 UJ 10 UJ 10 UJ 10 UJ 10 U 10 UJ 10 UJ 10 UJ 10 UJ 10 UJ
PCB-162 0.003 U 0.03 UJ 0.03 UJ 10 UJ 10 UJ 10 UJ 10 U 10 UJ 10 UJ 10 UJ 10 UJ 10 UJ
PCB-163/164 0.164 0.03 UJ 0.298 12.4 143 185 10 U 172 69.7 10 UJ 58.6 105
PCB-165 0.003 U 0.03 UJ 0.03 UJ 10 UJ 10 UJ 10 UJ 10 U 10 UJ 10 UJ 10 UJ 10 UJ 10 UJ
PCB-166 0.003 U 0.03 UJ 0.03 UJ 10 UJ 10 UJ 10 UJ 10 U 10 UJ 10 UJ 10 UJ 10 UJ 10 UJ
PCB-167 0.0153 0.0305 0.03 UJ 10 UJ 10 UJ 27.5 10 U 21.5 10.2 10 UJ 10 UJ 32
PCB-168 0.003 U 0.03 UJ 0.03 UJ 10 UJ 10 UJ 10 UJ 10 U 10 UJ 10 UJ 10 UJ 10 UJ 10 UJ
PCB-169 0.003 U 0.03 UJ 0.03 UJ 10 UJ 10 UJ 10 UJ 10 U 10 UJ 10 UJ 10 UJ 10 UJ 10 UJ
PCB-170 0.0936 0.0883 0.273 10 UJ 104 84.1 10 U 80.2 34.5 24.2 61.1 33.5
PCB-171 0.034 0.03 UJ 0.0912 10 UJ 22.8 26.2 10 U 36.4 10 UJ 10 UJ 10 UJ 10 UJ
PCB-172 0.0205 0.03 UJ 0.0726 10 UJ 10 UJ 21.5 10 U 10 UJ 10 UJ 10 UJ 10 UJ 10 UJ
PCB-173 0.003 U 0.03 UJ 0.03 UJ 10 UJ 10 UJ 10 UJ 10 U 10 UJ 10 UJ 10 UJ 10 UJ 10 UJ
PCB-174 0.146 0.115 0.499 10 UJ 144 97.2 10 U 162 10 UJ 10 UJ 39 10 UJ
PCB-175 0.003 U 0.03 UJ 0.03 UJ 10 UJ 10 UJ 10 UJ 10 U 10 UJ 10 UJ 10 UJ 10 UJ 10 UJ
PCB-176 0.014 0.03 UJ 0.0563 10 UJ 10 UJ 10 UJ 10 U 27.2 10 UJ 10 UJ 10 UJ 10 UJ
PCB-177 0.0745 0.0615 0.265 10 UJ 74.2 48.5 10 U 81.4 10 UJ 10 UJ 10 UJ 64.2
PCB-178 0.0299 0.03 UJ 0.0752 10 UJ 10 UJ 14.5 10 U 46 10 UJ 10 UJ 10 UJ 10 UJ
PCB-179 0.0567 0.0371 0.237 10 UJ 10 UJ 32.4 10 U 94.4 10 UJ 10 UJ 10 UJ 10 UJ
PCB-180 0.304 0.272 1.08 22.3 350 257 10 U 372 209 93.8 227 265
PCB-181 0.003 U 0.03 UJ 0.03 UJ 10 UJ 10 UJ 10 UJ 10 U 10 UJ 10 UJ 10 UJ 10 UJ 10 UJ
PCB-182/187 0.166 0.127 0.624 12.8 190 105 10 U 225 72.9 48.4 134 189
PCB-183 0.0645 0.0579 0.227 10 UJ 75.5 52.2 10 U 96.9 43.2 13.7 45 10 UJ
PCB-184 0.003 U 0.03 UJ 0.03 UJ 10 UJ 10 UJ 10 UJ 10 U 10 UJ 549 10 UJ 10 UJ 10 UJ
PCB-185 0.016 0.03 UJ 0.0682 10 UJ 10 UJ 10.8 10 U 10 UJ 10 UJ 10 UJ 10 UJ 10 UJ
PCB-186 0.003 U 0.03 UJ 0.03 UJ 10 UJ 10 UJ 10 UJ 10 U 10 UJ 10 UJ 10 UJ 10 UJ 10 UJ
PCB-188 0.003 U 0.03 UJ 0.03 UJ 10 UJ 10 UJ 10 UJ 10 U 10 UJ 10 UJ 10 UJ 10 UJ 10 UJ
PCB-189 0.0049 0.03 UJ 0.03 UJ 10 UJ 10 UJ 10 UJ 10 U 10 UJ 10 UJ 10 UJ 10 UJ 10 UJ
PCB-190 0.0263 0.0317 0.0806 10 UJ 26.1 24.1 10 U 19.7 11.5 16.8 16.2 10 UJ
PCB-191 0.0042 0.03 UJ 0.03 UJ 10 UJ 10 UJ 10 UJ 10 U 10 UJ 10 UJ 10 UJ 10 UJ 10 UJ
PCB-192 0.003 U 0.03 UJ 0.03 UJ 10 UJ 10 UJ 10 UJ 10 U 10 UJ 10 UJ 10 UJ 10 UJ 10 UJ
PCB-193 0.003 U 0.03 UJ 0.03 UJ 10 UJ 10 UJ 10 UJ 10 U 10 UJ 10 UJ 80.4 10 UJ 10 UJ

Page C-9
IUPAC West LL -
Zone 1 West LL -
Zone 2 West LL -
Zone 3 West LL -Zone 3C
West LL -Zone 3B
West LL -Zone 2 Gardens SR1-2 OR1-4 AP1-2 MI2-2
MI2-2 Rep.
Sediment (ug/Kg) Stormwater (pg/L) Wastewater (pg/L)
PCB-194 0.036 0.0601 0.152 10 UJ 73.5 51.5 10 U 10 UJ 10 UJ 21 37.9 10 UJ
PCB-195 0.0222 0.03 UJ 0.0711 10 UJ 23.3 21.3 10 U 10 UJ 10 UJ 10 UJ 10 UJ 10 UJ
PCB-196 0.0435 0.03 UJ 0.0853 10 UJ 27 10 UJ 10 U 10 UJ 10 UJ 17.2 33.2 10 UJ
PCB-197 0.003 U 0.03 UJ 0.03 UJ 10 UJ 10 UJ 10 UJ 10 U 10 UJ 10 UJ 10 UJ 10 UJ 10 UJ
PCB-198 0.003 U 0.03 UJ 0.03 UJ 10 UJ 10 UJ 66.8 10 U 10 UJ 10 UJ 10 UJ 10 UJ 10 UJ
PCB-199 0.0918 0.0908 0.273 10 UJ 108 70 10 U 90.4 39.1 17.1 138 10 UJ
PCB-200 0.003 U 0.03 UJ 0.0346 10 UJ 10 UJ 10 UJ 10 U 10 UJ 10 UJ 10 UJ 10 UJ 10 UJ
PCB-201 0.0109 0.03 UJ 0.03 UJ 10 UJ 10 UJ 10 UJ 10 U 10 UJ 10 UJ 10 UJ 10 UJ 10 UJ
PCB-202 0.0148 0.03 UJ 0.0564 10 UJ 10 UJ 10 UJ 10 U 10 UJ 10 UJ 10 UJ 49.5 10 UJ
PCB-203 0.0356 0.0427 0.152 10 UJ 54.3 51.9 10 U 10 UJ 25.8 20.2 94.2 63.3
PCB-204 0.003 U 0.03 UJ 0.03 UJ 10 UJ 10 UJ 10 UJ 10 U 10 UJ 10 UJ 10 UJ 10 UJ 10 UJ
PCB-205 0.0047 0.03 UJ 0.03 UJ 10 UJ 10 UJ 10 UJ 10 U 10 UJ 10 UJ 10 UJ 10 UJ 10 UJ
PCB-206 0.0343 0.032 0.03 UJ 10 UJ 95.5 51.1 10 U 46.4 46.5 10 UJ 270 10 UJ
PCB-207 0.0055 0.03 UJ 0.03 UJ 10 UJ 10 UJ 10 UJ 10 U 10 UJ 10 UJ 10 UJ 13.5 10 UJ
PCB-208 0.0109 0.03 UJ 0.048 10 UJ 47.6 26.7 10 U 10 UJ 10 UJ 10 UJ 103 10 UJ
PCB-209 0.0266 0.0358 0.133 10 UJ 84.2 44.9 10 U 10 UJ 10 UJ 10 UJ 206 10 UJ
*Composite Bold = Visual aid for detected compounds U = Not detected at the sample quantitation limit shown UJ = Estimated detection limit J = Result is an estimate B = Result less than five times blank contamination.

Page C-10
Table C-8. Dioxin/Furan 17 co-planar congener results and TEQ calculations Sediment 2,3,7,8-TCDD TEQs in ng/Kg dw. The lower bound value is the least protective estimate where the non-detected compounds are assigned a value of zero. The upper bound is the most protective TEQ where the non-detected compounds are assigned a concentration equal to the detection limit.
Location
2,3
,7,8
-TC
DF
1,2
,3,7
,8-
PeC
DF
2,3
,4,7
,8-
PeC
DF
1,2
,3,4
,7,8
-
HxC
DF
1,2
,3,6
,7,8
-
HxC
DF
2,3
,4,6
,7,8
-
HxC
DF
1,2
,3,7
,8,9
-
HxC
DF
1,2
,3,4
,6,7
,8-
Hp
CD
F
1,2
,3,4
,7,8
,9-
Hp
CD
F
OC
DF
2,3
,7,8
-
TC
DD
1,2
,3,7
,8-
PeC
DD
1,2
,3,4
,7,8
-
HxC
DD
1,2
,3,6
,7,8
-
HxC
DD
1,2
,3,7
,8,9
-
HxC
DD
1,2
,3,4
,6,7
,8-
Hp
CD
D
OC
DD
Lo
wer
Bo
un
d
(ND
=0)
Mid
Bo
un
d
(ND
=1/2
DL
)
Up
per
Bo
un
d
(ND
=D
L)
Stormwater in pg/L
WestLL-Zone 2
1.69 1.79 1.34 2.04 2.2 2.57 1 U
14.9 2.76 22.6 0.5 U
1 U
1 U
1 U
5.62 53.5 381 2.7 3.6 4.5
WestLL-Zone 3B
1.37 1.86 1.97 1.66 2.79 1.8 2.39 14.6 1 U
24.6 0.5 U
2.38 1 U
1 U
3.99 56.8 331 5.25 5.6 5.96
WestLL-Zone 3C
0.56 1 U 1 U 1 U 1 U 1.49 1 U 5.83 1 U 2 U 0.5 U
1.01 1 U 1 U 1 U 30.3 109 1.61 2.33 3.05
Gardens 0.69 2.43 3.2 2.73 2.09 4.09 3.97 1
U 1 U
7.45 1.51 3.3 2.19 2.45 3.47 11.1 39 8.14 8.15 8.16
Storm-drain Sediment in ng/Kg DW
Alpine-Zone 1*
0.39 0.95 0.5 U
1.39 1.72 2.31 0.5 31.9 N
2.53 88.1 1.1 3.83 3.7 8.05 6.48 188 1810 9.09 9.19 9.29
Alpine Zone 1 Rep*
0.3 0.72 0.5 U
1.06 1.41 2.09 0.5 U
21.4 N
1.54 60.7 0.82 3.13 2.85 5.93 4.77 151 1380 7.98 8.08 8.18
Wright-Zone 2
0.44 0.5 U
0.5 U
0.61 0.7 1.08 0.5 U
7.03 0.7 U
10.5 0.2 U
0.72 0.79 2.49 1.78 44.8 241 2.1 2.31 2.52
Lilac- Zone 3*
0.68 0.79 0.89 2.11 1.78 3.32 0.56 25.8 1.79 61.8 0.3 1.87 2.58 6.46 6.02 177 1290 7.26 7.26 7.26
Wastewater in pg/L
Influent Day*
0.64 3.1 2.5 1.89 1.84 2.25 2.26 1 U
1 U
12.3 1.9 5.69 2.7 3.19 4.4 10.1 104 10.49 10.5 10.5
Influent Day Rep*
0.64 1 U
1 U
1 U
1 U
1 U
1 U
1 U
1 U
8.42 2.17 1 U
1 U
1 U
1 U
6.09 65.3 2.32 3.34 4.37
Influent Night*
0.5 U
1 U
1 U
1 U
1 U
1 U
1 U
1 U
1 U
3.86 0.5 U
1 U
1 U
1.64 1 U
4.16 27.9 0.22 1.47 2.72

Page C-11
Location 2,3
,7,8
-TC
DF
1,2
,3,7
,8-
PeC
DF
2,3
,4,7
,8-
PeC
DF
1,2
,3,4
,7,8
-
HxC
DF
1,2
,3,6
,7,8
-
HxC
DF
2,3
,4,6
,7,8
-
HxC
DF
1,2
,3,7
,8,9
-
HxC
DF
1,2
,3,4
,6,7
,8-
Hp
CD
F
1,2
,3,4
,7,8
,9-
Hp
CD
F
OC
DF
2,3
,7,8
-
TC
DD
1,2
,3,7
,8-
PeC
DD
1,2
,3,4
,7,8
-
HxC
DD
1,2
,3,6
,7,8
-
HxC
DD
1,2
,3,7
,8,9
-
HxC
DD
1,2
,3,4
,6,7
,8-
Hp
CD
D
OC
DD
Lo
wer
Bo
un
d
(ND
=0)
Mid
Bo
un
d
(ND
=1/2
DL
)
Up
per
Bo
un
d
(ND
=D
L)
AP1-2 0.72 1
U 1 U
1 U
1 U
1 U
1 U
1 U
1 U
2 U
0.5 U
1.18 1 U
2.52 1 U
2.94 22.2 1.54 2.27 2.99
MI2-2 0.5 U
1 U
1 U
1 U
1 U
1 U
1 U
1 U
1 U
2 U
0.5 U
1 U
1 U
1 U
1 U
1 U
15.4 0.005 1.31 2.62
MI2-2D 0.59 1
U 1 U
1 U
1 U
1 U
1 U
1 U
1 U
2 U
0.5 U
1 U
1 U
1 U
1 U
1 U
8.84 0.062 1.34 2.62
SR1-2 0.5 U
1 U
1 U
1 U
1 U
1 U
1 U
1 U
1 U
5.4 0.5 U
1.65 1 U
1 U
1.26 6.35 53 1.86 2.61 3.36
OR1-4 0.89 1.54 1
U 1 U
1 U
1 U
1 U
1 U
1 U
8.28 0.5 U
1 U
1 U
1 U
1 U
3.93 33.9 0.187 1.45 2.71
* Composite ND = non-detect DL = detection limit Rep = replicate Bold = Visual aid for detected compounds U = Not detected at the sample quantitation limit shown N = Tentatively identified Table C-9. Total phosphorus results from stormwater
Location tP (mg/L)
Gardens 0.044
West LL-Zone 2 0.778
West LL-Zone 3B 0.956
West LL-Zone 3C 0.557
West LL Avg 0.764
Table C-10. Total phosphorus results from wastewater
Sample ID tP (mg/L)
AP1-2 8.1
MI2-2 7.76
OR1-4 8.23
SR1-2 4.92