liberty insurance corporation report of... · liberty insurance corporation as at december 31, ......
TRANSCRIPT
Liberty Insurance Corporation
Financial Statements December 31, 2012 and 2011 and Independent Auditors’ Report SyCip Gorres Velayo & Co.

*SGVFS001357*
INDEPENDENT AUDITORS’ REPORT The Stockholders and the Board of Directors Liberty Insurance Corporation Report on the Financial Statements We have audited the accompanying financial statements of Liberty Insurance Corporation, which comprise the statements of financial position as at December 31, 2012 and 2011, and the statements of comprehensive income, statements of changes in equity and statements of cash flows for the years then ended, and a summary of significant accounting policies and other explanatory information. Management’s Responsibility for the Financial Statements Management is responsible for the preparation and fair presentation of these financial statements in accordance with Philippine Financial Reporting Standards, and for such internal control as management determines is necessary to enable the preparation of financial statements that are free from material misstatement, whether due to fraud or error. Auditors’ Responsibility Our responsibility is to express an opinion on these financial statements based on our audits. We conducted our audits in accordance with Philippine Standards on Auditing. Those standards require that we comply with ethical requirements and plan and perform the audit to obtain reasonable assurance about whether the financial statements are free from material misstatement. An audit involves performing procedures to obtain audit evidence about the amounts and disclosures in the financial statements. The procedures selected depend on the auditor’s judgment, including the assessment of the risks of material misstatement of the financial statements, whether due to fraud or error. In making those risk assessments, the auditor considers internal control relevant to the entity’s preparation and fair presentation of the financial statements in order to design audit procedures that are appropriate in the circumstances, but not for the purpose of expressing an opinion on the effectiveness of the entity’s internal control. An audit also includes evaluating the appropriateness of accounting policies used and the reasonableness of accounting estimates made by management, as well as evaluating the overall presentation of the financial statements. We believe that the audit evidence we have obtained is sufficient and appropriate to provide a basis for our audit opinion.
SyCip Gorres Velayo & Co. 6760 Ayala Avenue 1226 Makati City Philippines
Phone: (632) 891 0307 Fax: (632) 819 0872 www.sgv.com.ph BOA/PRC Reg. No. 0001, December 28, 2012, valid until December 31, 2015 SEC Accreditation No. 0012-FR-3 (Group A), November 15, 2012, valid until November 16, 2015
A member firm of Ernst & Young Global Limited

*SGVFS001357*
- 2 -
Opinion In our opinion, the financial statements present fairly, in all material respects, the financial position of Liberty Insurance Corporation as at December 31, 2012 and 2011, and its financial performance and its cash flows for the years then ended in accordance with Philippine Financial Reporting Standards. Report on the Supplementary Information Required Under Revenue Regulations 19-2011 and 15-2010 Our audits were conducted for the purpose of forming an opinion on the basic financial statements taken as a whole. The supplementary information required under Revenue Regulations 19-2011 and 15-2010 in Notes 26 and 27 to the financial statements, respectively, is presented for purposes of filing with the Bureau of Internal Revenue and is not a required part of the basic financial statements. Such information is the responsibility of the management of Liberty Insurance Corporation. The information has been subjected to the auditing procedures applied in our audit of the basic financial statements. In our opinion, the information is fairly stated in all material respects in relation to the basic financial statements taken as a whole. SYCIP GORRES VELAYO & CO. Arnel F. De Jesus Partner CPA Certificate No. 43285 SEC Accreditation No. 0075-AR-3 (Group A), February 14, 2013, valid until February 13, 2016 Tax Identification No. 152-884-385 BIR Accreditation No. 08-001998-15-2012, June 19, 2012, valid until June 18, 2015 PTR No. 3669673, January 2, 2013, Makati City March 20, 2013

*SGVFS001357*
LIBERTY INSURANCE CORPORATION STATEMENTS OF FINANCIAL POSITION December 31 2012 2011
ASSETS
Cash and Cash Equivalents (Notes 4 and 21) P=24,422,354 P=12,513,402
Insurance Receivables - net (Notes 5 and 21) 84,736,561 91,840,969
Financial Assets (Notes 6 and 21) Held-to-maturity investments 53,359,182 45,518,316 Available-for-sale financial assets 26,700,576 20,761,091 Loans and receivables 8,371,523 10,269,787
Reinsurance Assets (Notes 7 and 11) 80,875,123 45,622,149
Deferred Acquisition Costs (Note 8) 13,714,604 11,473,226
Investment Properties (Note 9) 76,501,788 76,501,788
Property and Equipment - net (Note 10) 7,189,271 6,990,245
Other Assets (Note 21) 9,376,878 4,751,922 P=385,247,860 P=326,242,895
LIABILITIES AND EQUITY
Liabilities Insurance contract liabilities (Notes 11 and 21) P=140,411,263 P=91,766,688 Insurance payables (Notes 12 and 21) 7,012,107 6,981,962 Accounts payable and other liabilities (Notes 13 and 21) 12,490,880 7,197,182 Deferred reinsurance commissions (Note 8) 5,964,062 5,504,202 Net pension liability (Note 19) 2,084,592 2,074,103 Deferred tax liabilities - net (Note 20) 105,329 294,327 168,068,233 113,818,464
Equity Capital stock (Note 14) 175,000,000 150,800,000 Additional paid-in capital 2,239 2,239 Deposits for future stock subscriptions (Note 14) – 14,200,000 Revaluation reserve on available-for-sale financial assets
(Note 6) (4,138,086) (3,374,891) Retained earnings 46,315,474 50,797,083 217,179,627 212,424,431 P=385,247,860 P=326,242,895 See accompanying Notes to Financial Statements.
*SGVFS001357*
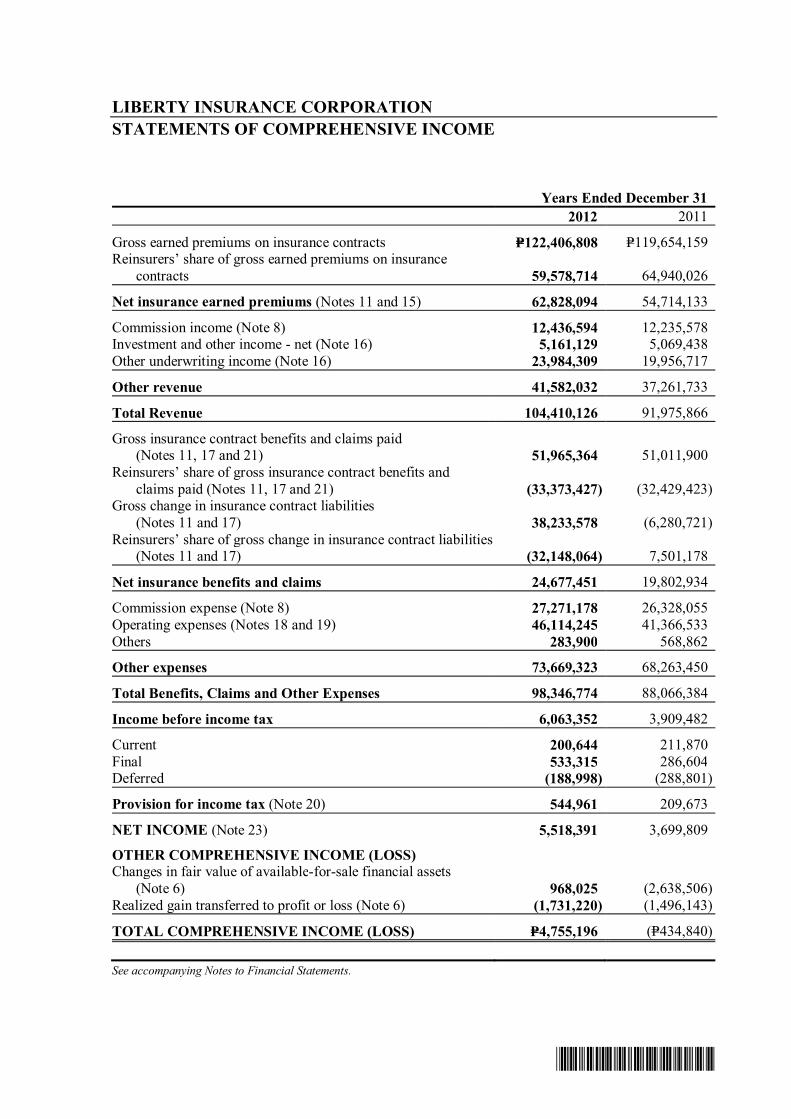
LIBERTY INSURANCE CORPORATION
STATEMENTS OF COMPREHENSIVE INCOME Years Ended December 31 2012 2011
Gross earned premiums on insurance contracts P=122,406,808 P=119,654,159 Reinsurers’ share of gross earned premiums on insurance
contracts 59,578,714 64,940,026
Net insurance earned premiums (Notes 11 and 15) 62,828,094 54,714,133
Commission income (Note 8) 12,436,594 12,235,578 Investment and other income - net (Note 16) 5,161,129 5,069,438 Other underwriting income (Note 16) 23,984,309 19,956,717
Other revenue 41,582,032 37,261,733
Total Revenue 104,410,126 91,975,866
Gross insurance contract benefits and claims paid (Notes 11, 17 and 21) 51,965,364 51,011,900
Reinsurers’ share of gross insurance contract benefits and claims paid (Notes 11, 17 and 21) (33,373,427) (32,429,423)
Gross change in insurance contract liabilities (Notes 11 and 17) 38,233,578 (6,280,721)
Reinsurers’ share of gross change in insurance contract liabilities (Notes 11 and 17) (32,148,064) 7,501,178
Net insurance benefits and claims 24,677,451 19,802,934
Commission expense (Note 8) 27,271,178 26,328,055 Operating expenses (Notes 18 and 19) 46,114,245 41,366,533 Others 283,900 568,862
Other expenses 73,669,323 68,263,450
Total Benefits, Claims and Other Expenses 98,346,774 88,066,384
Income before income tax 6,063,352 3,909,482
Current 200,644 211,870 Final 533,315 286,604 Deferred (188,998) (288,801)
Provision for income tax (Note 20) 544,961 209,673
NET INCOME (Note 23) 5,518,391 3,699,809
OTHER COMPREHENSIVE INCOME (LOSS) Changes in fair value of available-for-sale financial assets
(Note 6) 968,025 (2,638,506) Realized gain transferred to profit or loss (Note 6) (1,731,220) (1,496,143)
TOTAL COMPREHENSIVE INCOME (LOSS) P=4,755,196 (P=434,840) See accompanying Notes to Financial Statements.
*SGVFS001357*
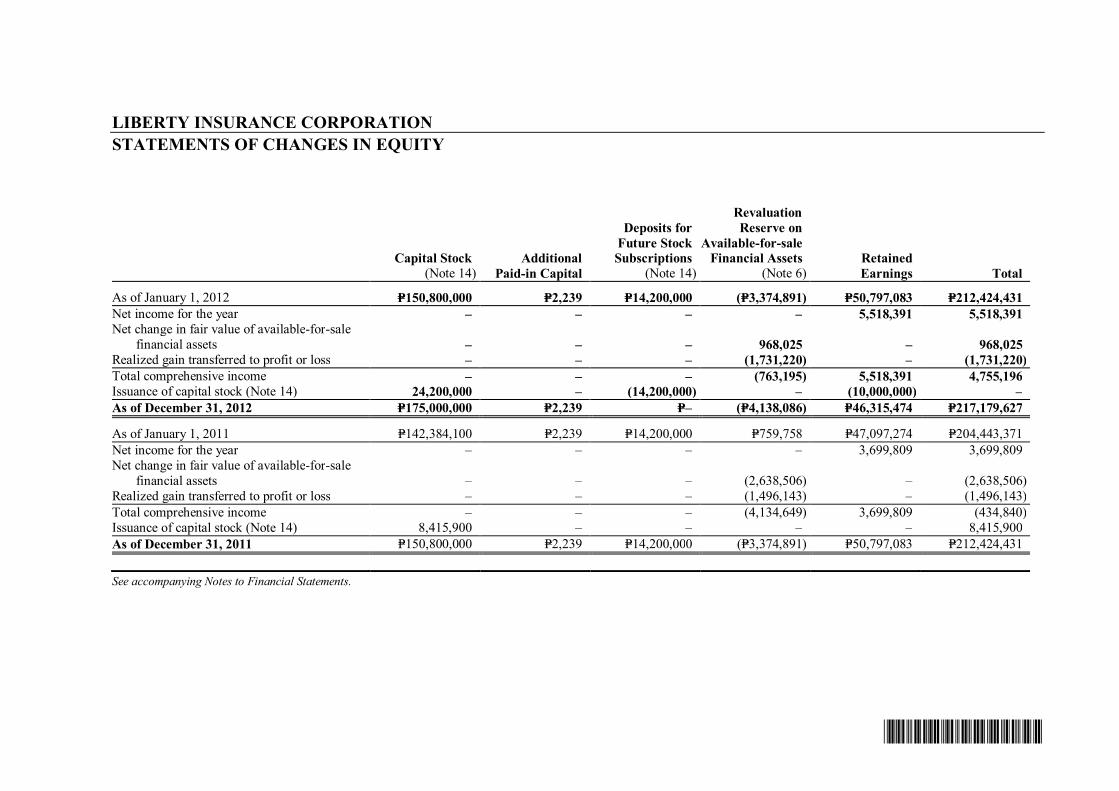
LIBERTY INSURANCE CORPORATION STATEMENTS OF CHANGES IN EQUITY
Capital Stock
(Note 14) Additional
Paid-in Capital
Deposits for Future Stock Subscriptions
(Note 14)
Revaluation Reserve on
Available-for-sale Financial Assets
(Note 6) Retained Earnings Total
As of January 1, 2012 P=150,800,000 P=2,239 P=14,200,000 (P=3,374,891) P=50,797,083 P=212,424,431 Net income for the year – – – – 5,518,391 5,518,391 Net change in fair value of available-for-sale
financial assets – – – 968,025 – 968,025 Realized gain transferred to profit or loss – – – (1,731,220) – (1,731,220) Total comprehensive income – – – (763,195) 5,518,391 4,755,196 Issuance of capital stock (Note 14) 24,200,000 – (14,200,000) – (10,000,000) – As of December 31, 2012 P=175,000,000 P=2,239 P=– (P=4,138,086) P=46,315,474 P=217,179,627
As of January 1, 2011 P=142,384,100 P=2,239 P=14,200,000 P=759,758 P=47,097,274 P=204,443,371 Net income for the year – – – – 3,699,809 3,699,809 Net change in fair value of available-for-sale
financial assets – – – (2,638,506) – (2,638,506) Realized gain transferred to profit or loss – – – (1,496,143) – (1,496,143) Total comprehensive income – – – (4,134,649) 3,699,809 (434,840) Issuance of capital stock (Note 14) 8,415,900 – – – – 8,415,900 As of December 31, 2011 P=150,800,000 P=2,239 P=14,200,000 (P=3,374,891) P=50,797,083 P=212,424,431 See accompanying Notes to Financial Statements.
*SGVFS001357*
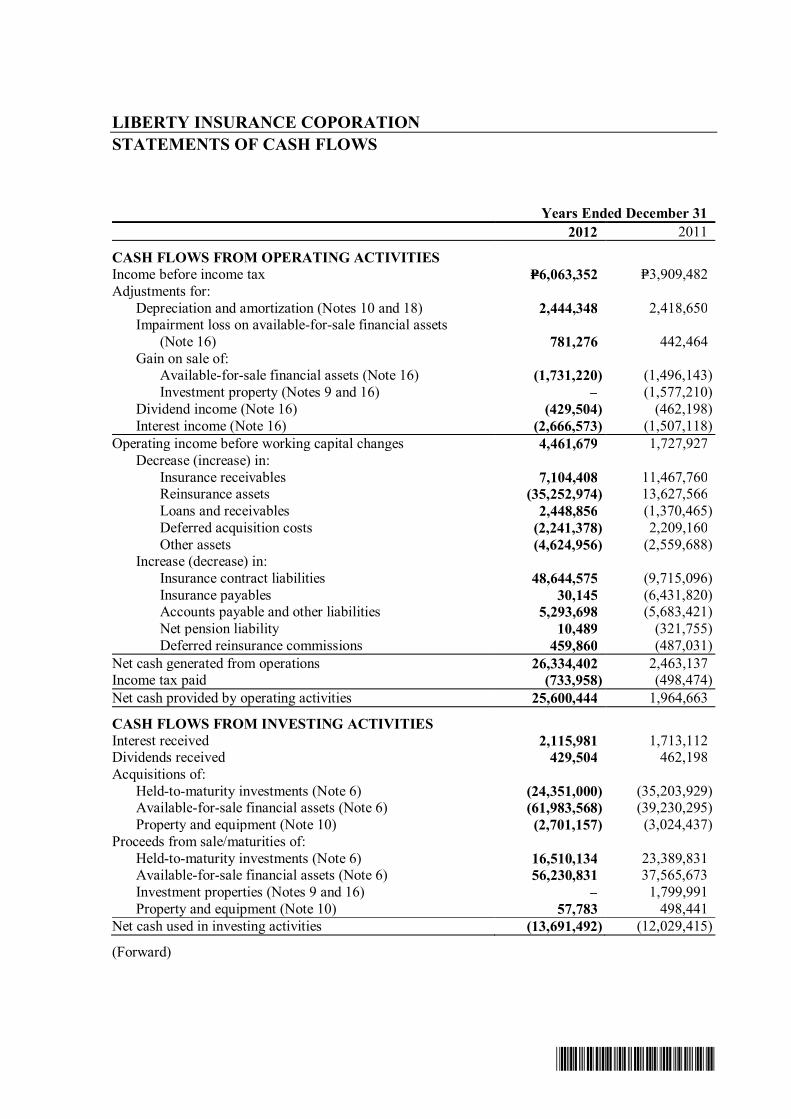
LIBERTY INSURANCE COPORATION STATEMENTS OF CASH FLOWS Years Ended December 31 2012 2011
CASH FLOWS FROM OPERATING ACTIVITIES Income before income tax P=6,063,352 P=3,909,482 Adjustments for: Depreciation and amortization (Notes 10 and 18) 2,444,348 2,418,650 Impairment loss on available-for-sale financial assets (Note 16) 781,276 442,464 Gain on sale of: Available-for-sale financial assets (Note 16) (1,731,220) (1,496,143) Investment property (Notes 9 and 16) – (1,577,210) Dividend income (Note 16) (429,504) (462,198) Interest income (Note 16) (2,666,573) (1,507,118) Operating income before working capital changes 4,461,679 1,727,927 Decrease (increase) in: Insurance receivables 7,104,408 11,467,760 Reinsurance assets (35,252,974) 13,627,566 Loans and receivables 2,448,856 (1,370,465) Deferred acquisition costs (2,241,378) 2,209,160 Other assets (4,624,956) (2,559,688) Increase (decrease) in: Insurance contract liabilities 48,644,575 (9,715,096) Insurance payables 30,145 (6,431,820) Accounts payable and other liabilities 5,293,698 (5,683,421) Net pension liability 10,489 (321,755) Deferred reinsurance commissions 459,860 (487,031) Net cash generated from operations 26,334,402 2,463,137 Income tax paid (733,958) (498,474) Net cash provided by operating activities 25,600,444 1,964,663
CASH FLOWS FROM INVESTING ACTIVITIES Interest received 2,115,981 1,713,112 Dividends received 429,504 462,198 Acquisitions of: Held-to-maturity investments (Note 6) (24,351,000) (35,203,929) Available-for-sale financial assets (Note 6) (61,983,568) (39,230,295) Property and equipment (Note 10) (2,701,157) (3,024,437) Proceeds from sale/maturities of: Held-to-maturity investments (Note 6) 16,510,134 23,389,831 Available-for-sale financial assets (Note 6) 56,230,831 37,565,673 Investment properties (Notes 9 and 16) – 1,799,991 Property and equipment (Note 10) 57,783 498,441 Net cash used in investing activities (13,691,492) (12,029,415)
(Forward)

*SGVFS001357*
- 2 - Years Ended December 31 2012 2011
CASH FLOW FROM FINANCING ACTIVITY Proceeds from issuance of shares P=– P=8,415,900
NET INCREASE IN CASH AND CASH EQUIVALENTS 11,908,952 1,648,852
CASH AND CASH EQUIVALENTS AT BEGINNING OF YEAR 12,513,402 14,162,254
CASH AND CASH EQUIVALENTS AT END OF YEAR (Note 4) P=24,422,354 P=12,513,402
See accompanying Notes to Financial Statements.
*SGVFS001357*
LIBERTY INSURANCE COPORATION NOTES TO FINANCIAL STATEMENTS 1. Corporate Information
Liberty Insurance Corporation (the Company) was incorporated in the Philippines on December 11, 1953. The Company is a member of Jose Cojuangco and Sons Group of Companies.
The Company is engaged in the business of nonlife insurance which includes fire, motor car, marine insurance, personal accident insurance and miscellaneous casualty that are permitted to be sold by a nonlife insurance company in the Philippines.
The registered office address of the Company is 3rd Floor, Jose Cojuangco and Sons Building, 119 Dela Rosa corner Carlos Palanca Streets, Legaspi Village, Makati City.
The accompanying financial statements were authorized for issue by the Board of Directors (BOD) on March 20, 2013.
2. Summary of Significant Accounting Policies
Basis of Preparation The accompanying financial statements have been prepared on a historical cost basis, except for available-for-sale (AFS) financial assets which have been measured at fair value. The financial statements are measured in Philippine Peso (P=), which is also the Company’s functional and presentation currency. All values are rounded off to the nearest peso unit, unless otherwise indicated.
Statement of Compliance The financial statements of the Company have been prepared in compliance with Philippine Financial Reporting Standards (PFRS).
Changes in Accounting Policies and Disclosures The accounting policies adopted are consistent with those of the previous financial year except for the adoption of the following amended PFRS, which became effective on January 1, 2012. Amendments to PFRS 7, Financial Instruments: Disclosures - Transfers of Financial Assets The amendment requires additional disclosure about financial assets that have been transferred but not derecognized to enable the user of the Company’s financial statements to understand the relationship with those assets that have not been derecognized and their associated liabilities. In addition, the amendment requires disclosures about continuing involvement in derecognized assets to enable the user to evaluate the nature of, and risks associated with, the entity’s continuing involvement in those derecognized assets. The amendment affects disclosures only and has no impact on the Company’s financial position or performance since the Company is not involved in these types of transfers of financial assets.
- 2 -
*SGVFS001357*
PAS 12, Income Taxes - Recovery of Underlying Assets The amendment clarified the determination of deferred tax on investment property measured at fair value. The amendment introduces a rebuttable presumption that deferred tax on investment property measured using the fair value model in PAS 40, Investment Property, should be determined on the basis that its carrying amount will be recovered through sale. Furthermore, it introduces the requirement that deferred tax on non-depreciable assets that are measured using the revaluation model in PAS 16, Property, Plant and Equipment, always be measured on a sale basis of the asset. The amendment did not have significant impact on the Company’s financial position of performance since the Company’s investment properties and property and equipment are measured at cost.
Future Changes in Accounting Policies The Company will adopt the following new and amended standards and interpretations enumerated below when these become effective.
Effective 2013 Amendments to PFRS 7, Financial Instruments: Disclosures - Offsetting Financial Assets and Financial Liabilities These amendments require an entity to disclose information about rights of set-off and related arrangements (such as collateral agreements). The new disclosures are required for all recognized financial instruments that are offset in accordance with PAS 32. These disclosures also apply to recognized financial instruments that are subject to an enforceable master netting arrangement or ‘similar agreement’, irrespective of whether they are offset in accordance with PAS 32. The amendments require entities to disclose, in a tabular format unless another format is more appropriate, the following minimum quantitative information. This is presented separately for financial assets and financial liabilities recognized at the end of the reporting period:
a) The gross amounts of those recognized financial assets and recognized financial liabilities; b) The amounts that are set off in accordance with the criteria in PAS 32 when determining
the net amounts presented in the statement of financial position; c) The net amounts presented in the statement of financial position; d) The amounts subject to an enforceable master netting arrangement or similar agreement
that are not otherwise included in (b) above, including: i. Amounts related to recognized financial instruments that do not meet some or all of
the offsetting criteria in PAS 32; and ii. Amounts related to financial collateral (including cash collateral); and
e) The net amount after deducting the amounts in (d) from the amounts in (c) above.
The amendments to PFRS 7 are to be retrospectively applied. The amendment will not have a significant impact on the Company’s financial position or performance since the Company has not entered into this type of transaction. The related PFRS 7 disclosure of the Company’s financial assets and liabilities are included in Note 21.
PFRS 10, Consolidated Financial Statements It replaces the portion of PAS 27, Consolidated and Separate Financial Statements that addresses the accounting for consolidated financial statements. It also includes the issues raised in SIC-12, Consolidation - Special Purpose Entities. PFRS 10 establishes a single control model that applies to all entities including special purpose entities. The changes introduced by PFRS 10 will require management to exercise significant judgment to determine which entities are controlled, and therefore, are required to be consolidated by a parent, compared with the requirements in PAS 27. The standard does not apply to the Company since the Company has no investee companies.

- 3 -
*SGVFS001357*
PFRS 11, Joint Arrangements It replaces PAS 31, Interests in Joint Ventures and SIC-13, Jointly-controlled Entities - Non-monetary Contributions by Venturers. PFRS 11 removes the option to account for jointly controlled entities (JCEs) using proportionate consolidation. Instead, JCEs that meet the definition of a joint venture must be accounted for using the equity method. The standard does not apply to the Company since the Company has not entered into any joint arrangements.
PFRS 12, Disclosure of Involvement with Other Entities It includes all of the disclosures that were previously in PAS 27 related to consolidated financial statements, as well as all of the disclosures that were previously included in PAS 31 and PAS 28. These disclosures relate to an entity’s interests in subsidiaries, joint arrangements, associates and structured entities. The standard does not apply to the Company since the Company has no interest in other entities.
PFRS 13, Fair Value Measurement PFRS 13 establishes a single source of guidance under PFRSs for all fair value measurements. PFRS 13 does not change when an entity is required to use fair value, but rather provides guidance on how to measure fair value under PFRS when fair value is required or permitted. This standard should be applied prospectively as of the beginning of the annual period in which it is initially applied. Its disclosure requirements need not be applied in comparative information provided for periods before initial application of PFRS 13. The adoption of this standard will not have a significant impact on its financial position and performance since the Company’s financial assets carried at fair value pertains to quoted shares in an active market.
Amendments to PAS 1, Financial Statement Presentation, Presentation of Items of Other Comprehensive Income (OCI) The amendments to PAS 1 change the grouping of items presented in OCI. Items that can be reclassified (or “recycled”) to profit or loss at a future point in time (for example, upon derecognition or settlement) will be presented separately from items that will never be recycled. The amendments will affect presentation only and will have no impact on the Company’s financial position or performance since the Company’s OCI pertains to only one item which can be recycled to profit or loss upon derecognition.
Amendment to PAS 19, Employee Benefits Amendments to PAS 19 range from fundamental changes such as removing the corridor mechanism and the concept of expected returns on plan assets to simple clarifications and rewording. The revised standard also requires new disclosures such as, among others, a sensitivity analysis for each significant actuarial assumption, information on asset-liability matching strategies, duration of the defined benefit obligation, and disaggregation of plan assets by nature and risk. The amendments become effective for annual periods beginning on or after January 1, 2013. Once effective, the Company has to apply the amendments retroactively to the earliest period presented.
- 4 -
*SGVFS001357*
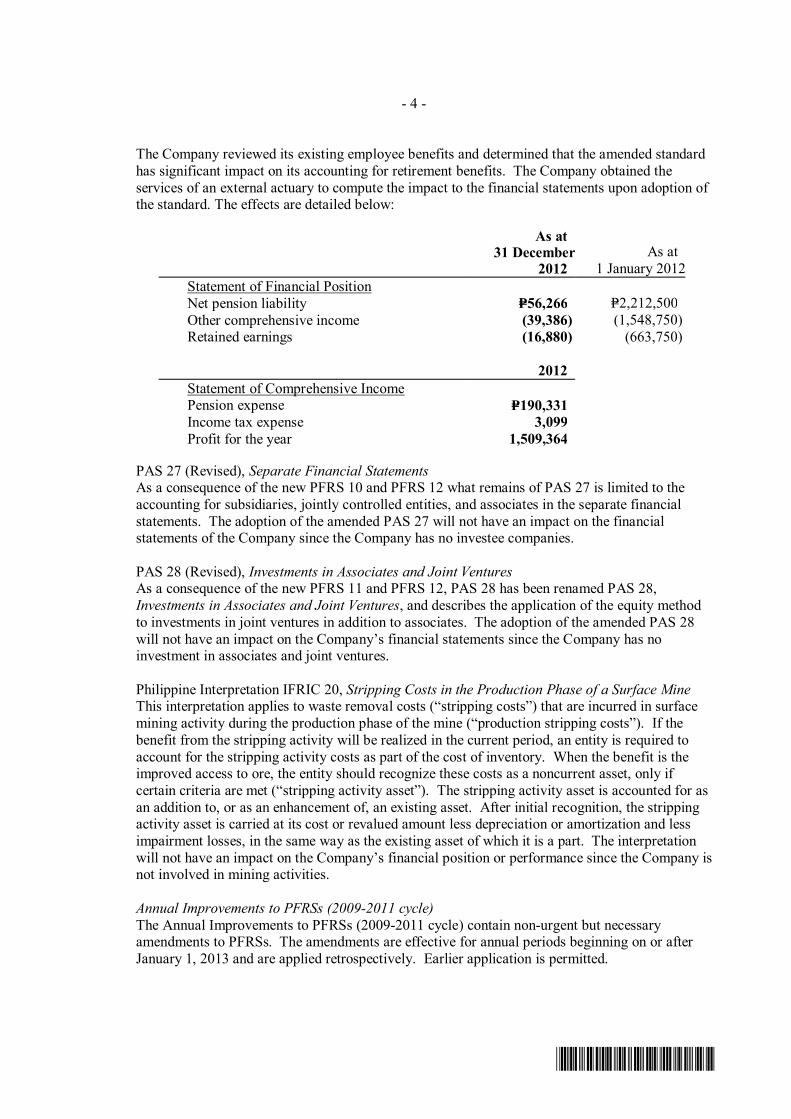
The Company reviewed its existing employee benefits and determined that the amended standard has significant impact on its accounting for retirement benefits. The Company obtained the services of an external actuary to compute the impact to the financial statements upon adoption of the standard. The effects are detailed below:
As at 31 December
2012 As at
1 January 2012Statement of Financial Position Net pension liability P=56,266 P=2,212,500 Other comprehensive income (39,386) (1,548,750) Retained earnings (16,880) (663,750)
2012 Statement of Comprehensive Income Pension expense P=190,331 Income tax expense 3,099 Profit for the year 1,509,364
PAS 27 (Revised), Separate Financial Statements As a consequence of the new PFRS 10 and PFRS 12 what remains of PAS 27 is limited to the accounting for subsidiaries, jointly controlled entities, and associates in the separate financial statements. The adoption of the amended PAS 27 will not have an impact on the financial statements of the Company since the Company has no investee companies.
PAS 28 (Revised), Investments in Associates and Joint Ventures As a consequence of the new PFRS 11 and PFRS 12, PAS 28 has been renamed PAS 28, Investments in Associates and Joint Ventures, and describes the application of the equity method to investments in joint ventures in addition to associates. The adoption of the amended PAS 28 will not have an impact on the Company’s financial statements since the Company has no investment in associates and joint ventures.
Philippine Interpretation IFRIC 20, Stripping Costs in the Production Phase of a Surface Mine This interpretation applies to waste removal costs (“stripping costs”) that are incurred in surface mining activity during the production phase of the mine (“production stripping costs”). If the benefit from the stripping activity will be realized in the current period, an entity is required to account for the stripping activity costs as part of the cost of inventory. When the benefit is the improved access to ore, the entity should recognize these costs as a noncurrent asset, only if certain criteria are met (“stripping activity asset”). The stripping activity asset is accounted for as an addition to, or as an enhancement of, an existing asset. After initial recognition, the stripping activity asset is carried at its cost or revalued amount less depreciation or amortization and less impairment losses, in the same way as the existing asset of which it is a part. The interpretation will not have an impact on the Company’s financial position or performance since the Company is not involved in mining activities. Annual Improvements to PFRSs (2009-2011 cycle) The Annual Improvements to PFRSs (2009-2011 cycle) contain non-urgent but necessary amendments to PFRSs. The amendments are effective for annual periods beginning on or after January 1, 2013 and are applied retrospectively. Earlier application is permitted.
- 5 -
*SGVFS001357*
PFRS 1, First-time Adoption of PFRS - Borrowing Costs The amendment clarifies that, upon adoption of PFRS, an entity that capitalized borrowing costs in accordance with its previous generally accepted accounting principles, may carry forward, without any adjustment, the amount previously capitalized in its opening statement of financial position at the date of transition. Subsequent to the adoption of PFRS, borrowing costs are recognized in accordance with PAS 23, Borrowing Costs. The amendment does not apply to the Company as it is not a first-time adopter of PFRS. PAS 1, Presentation of Financial Statements - Clarification of the requirements for comparative information The amendment clarifies the requirements for comparative information that are disclosed voluntarily and those that are mandatory due to retrospective application of an accounting policy, or retrospective restatement or reclassification of items in the financial statements. An entity must include comparative information in the related notes to the financial statements when it voluntarily provides comparative information beyond the minimum required comparative period. The additional comparative period does not need to contain a complete set of financial statements. On the other hand, supporting notes for the third balance sheet (mandatory when there is a retrospective application of an accounting policy, or retrospective restatement or reclassification of items in the financial statements) are not required. The amendment will not have significant impact on the Company’s financial statements since the comparative information disclosures are already in accordance with the requirements of PAS 1.
PAS 16, Property, Plant and Equipment - Classification of servicing equipment The amendment clarifies that spare parts, stand-by equipment and servicing equipment should be recognized as property, plant and equipment when they meet the definition of property, plant and equipment and should be recognized as inventory, if otherwise. The adoption of the standard will not have an impact on the Company’s financial position or performance since the Company has no inventories that will qualify for recognition as part of property and equipment.
PAS 32, Financial Instruments: Presentation - Tax effect of distribution to holders of equity instruments The amendment clarifies that income taxes relating to distributions to equity holders and to transaction costs of an equity transaction are accounted for in accordance with PAS 12, Income Taxes. The Company will assess impact of this amendment when they enter into specific transactions involving distributions to equity holders. PAS 34, Interim Financial Reporting - Interim financial reporting and segment information for total assets and liabilities The amendment clarifies that the total assets and liabilities for a particular reportable segment need to be disclosed only when the amounts are regularly provided to the chief operating decision maker and there has been a material change from the amount disclosed in the entity’s previous annual financial statements for that reportable segment. The amendment does not apply to the Company since it is not required to issue interim financial reports nor any segment information. Effective in 2014 PAS 32, Financial Instruments: Presentation - Offsetting Financial Assets and Financial Liabilities These amendments to PAS 32 clarify the meaning of “currently has a legally enforceable right to offset” and also clarify the application of the PAS 32 offsetting criteria to settlement systems (such as central clearing house systems) which apply gross settlement mechanisms that are not simultaneous. The amendments affect presentation only and have no impact on the Company’s financial position or performance since the Company does not offset its financial instruments.
- 6 -
*SGVFS001357*
Effective in 2015 PFRS 9 is effective for annual periods beginning on or after January 1, 2015. PFRS 9, as issued, reflects the first phase on the replacement of PAS 39 and applies to the classification and measurement of financial assets and liabilities as defined in PAS 39, Financial Instruments: Recognition and Measurement. Work on impairment of financial instruments and hedge accounting is still ongoing, with a view to replacing PAS 39 in its entirety. PFRS 9 requires all financial assets to be measured at fair value at initial recognition. A debt financial asset may, if the fair value option (FVO) is not invoked, be subsequently measured at amortized cost if it is held within a business model that has the objective to hold the assets to collect the contractual cash flows and its contractual terms give rise, on specified dates, to cash flows that are solely payments of principal and interest on the principal outstanding. All other debt instruments are subsequently measured at fair value through profit or loss. All equity financial assets are measured at fair value either through OCI or profit or loss. Equity financial assets held for trading must be measured at fair value through profit or loss. For FVO liabilities, the amount of change in the fair value of a liability that is attributable to changes in credit risk must be presented in OCI. The remainder of the change in fair value is presented in profit or loss, unless presentation of the fair value change in respect of the liability’s credit risk in OCI would create or enlarge an accounting mismatch in profit or loss. All other PAS 39 classification and measurement requirements for financial liabilities have been carried forward into PFRS 9, including the embedded derivative separation rules and the criteria for using the FVO. The adoption of the first phase of PFRS 9 will have an effect on the classification and will have no effect on the measurement of the Company’s loans and receivables and AFS financial assets, since its loans and receivables are carried at amortized cost, but will potentially have no impact on the classification and measurement of financial liabilities.
Philippine Interpretation IFRIC 15, Agreements for the Construction of Real Estate This interpretation covers accounting for revenue and associated expenses by entities that undertake the construction of real estate directly or through subcontractors which should be applied retroactively and prospectively. The interpretation requires that revenue on construction of real estate be recognized only upon completion, except when such contract qualifies as construction contract to be accounted for under PAS 11, Construction Contracts, or involves rendering of services in which case revenue is recognized based on stage of completion. Contracts involving provision of services with the construction materials and where the risks and reward of ownership are transferred to the buyer on a continuous basis will also be accounted for based on stage of completion. Adoption of the interpretation when it becomes effective will not have any impact on the financial statements of the Company since the Company does not engage in the construction of real estate.
Foreign Currency Transactions and Translations The functional and presentation currency of the Company is the Philippine Peso (P=). Transactions in foreign currencies are initially recorded at the functional currency rate ruling at the date of the transaction. Monetary assets and liabilities denominated in foreign currencies are retranslated at the functional currency rate of exchange ruling at the reporting date. Nonmonetary items that are measured in terms of historical cost in a foreign currency are translated using the exchange rate as at the date of the initial transaction and are not subsequently restated. Nonmonetary items measured at fair value in a foreign currency are translated using the exchange rate at the date when the fair value was determined. All foreign exchange differences are taken to the statement of comprehensive income, except where it relates to equity securities where gains or losses are recognized directly in equity, the gain or loss is then recognized net of the exchange component in equity.

- 7 -
*SGVFS001357*
Cash and Cash Equivalents Cash includes cash on hand and in banks. Cash equivalents are short-term, highly liquid investments that are readily convertible to known amounts of cash with original maturity of three months or less from dates of placement and that are subject to an insignificant risk of changes in value.
Insurance Receivables Insurance receivables are recognized on policy inception dates and measured on initial recognition at the fair value of the consideration receivable for the period of coverage. Subsequent to initial recognition, insurance receivables are measured at amortized cost. The carrying value of insurance receivables is reviewed for impairment whenever events or circumstances indicate that the carrying amount may not be recoverable, with the impairment loss recorded in profit or loss.
Insurance receivables are derecognized under the derecognition criteria of financial assets.
Financial Instruments Date of recognition Financial instruments are recognized in the statement of financial position when the Company becomes a party to the contractual provisions of the instrument. Purchases or sales of financial assets that require delivery of assets within the time frame established by regulation or convention in the marketplace are recognized on the trade date.
Initial recognition of financial instruments Financial instruments are recognized initially at fair value. Except for financial instruments at FVPL, the initial measurement of financial assets includes transaction costs. The Company classifies its financial assets in the following categories: AFS financial assets, HTM investments and loans and receivables. The Company classifies its financial liabilities into other financial liabilities. The classification depends on the purpose for which the investments were acquired and whether they are quoted in an active market. Management determines the classification of its investments at initial recognition and, where allowed and appropriate, re-evaluates such designation at every reporting date.
Determination of fair value The fair value for financial instruments traded in active markets at the reporting date is based on their quoted market prices or dealer price quotations (bid price for long positions and ask price for short positions), without any deduction for transaction costs. When current bid and ask prices are not available, the price of the most recent transaction provides evidence of the current fair value as long as there has not been a significant change in economic circumstances since the time of the transaction.
For all other financial instruments not listed in an active market, the fair value is determined by using appropriate valuation techniques. Valuation techniques include net present value techniques, comparison to similar instruments for which observable current market prices exist, option pricing models, and other relevant valuation models. Any difference noted between the fair value and the transaction price is recognized in the statement of comprehensive income, unless it qualifies for recognition as some type of asset or liability.
- 8 -
*SGVFS001357*
Fair value hierarchy The Company uses the following hierarchy for determining and disclosing the fair values of financial instruments by valuation technique:
Level 1: quoted (unadjusted) prices in active markets for identical assets or liabilities Level 2: other techniques for which all inputs which have a significant effect on the recorded fair
value are observable in the market, either directly or indirectly Level 3: techniques which uses inputs which have a significant effect on the recorded fair value
that are not based on observable market data.
Day 1 difference Where the transaction price in a non-active market is different from the fair value from other observable current market transactions in the same instrument or based on a valuation technique whose variables include only data from observable market, the Company recognizes the difference between the transaction price and fair value (a ‘Day 1’ profit or loss) in the statement of comprehensive income unless it qualifies for recognition as some other type of asset. In cases where an unobservable data is used, the difference between the transaction price and model value is only recognized in the statement of comprehensive income when the inputs become observable or when the instrument is derecognized. For each transaction, the Company determines the appropriate method of recognizing the ‘Day 1’ profit or loss amount.
Loans and receivables Loans and receivables are financial assets with fixed or determinable payments and fixed maturities that are not quoted in an active market. They are not entered into with the intention of immediate or short-term resale and are not classified as financial assets held for trading, designated as AFS or FVPL. This accounting policy relates to the statement of financial position captions “Cash and cash equivalents”, “Insurance receivables”, “Loans and receivables”, and “Reinsurance assets”.
After initial measurement, the loans and receivables are subsequently measured at amortized cost using the effective interest rate method, less allowance for impairment. Amortized cost is calculated by taking into account any discount or premium on acquisition and fees that are an integral part of the effective interest rate. The amortization is included in the “Investment and other income” account in the statement of comprehensive income. The losses arising from impairment of such loans and receivables are recognized in profit or loss.
HTM investments HTM investments are quoted nonderivative financial assets with fixed or determinable payments and fixed maturities which the Company’s management has a positive intention and ability to hold to maturity. Where the Company sells other than an insignificant amount of HTM investments, the entire category would be tainted and reclassified as AFS financial assets. After initial measurement, these investments are subsequently measured at amortized cost using the effective interest rate method, less any impairment in value. Amortized cost is calculated by taking into account any discount or premium on acquisition and fees that are integral part of the effective interest rate. Gains and losses are recognized in profit or loss when the HTM investments are derecognized and impaired, as well as through the amortization process. The losses arising from impairment of such investments are recognized in profit or loss.

- 9 -
*SGVFS001357*
AFS financial assets AFS financial assets are those which are designated as such or do not qualify to be classified as designated at FVPL, HTM or loans and receivables. They are purchased and held indefinitely, and may be sold in response to liquidity requirements or changes in market conditions. After initial measurement, AFS financial assets are subsequently measured at fair value. The effective yield component of AFS debt securities, as well as the impact of restatement on foreign currency-denominated AFS debt securities, is reported in earnings. Interest earned on holding AFS financial assets are reported as interest income using the effective interest rate. Dividends earned on holding AFS financial assets are recognized in profit or loss when the right to receive the payment has been established. The unrealized gains and losses arising from the fair valuation of AFS financial assets are reported as ‘Revaluation reserve on available-for-sale financial assets’ in the equity section of the statement of financial position. The losses arising from impairment of such investments are recognized in profit or loss. When the security is disposed of, the cumulative gain or loss previously recognized in other comprehensive income is recognized as realized gains or losses in profit or loss.
When the fair value of AFS financial assets cannot be measured reliably because of lack of reliable estimates of future cash flows and discount rates necessary to calculate the fair value of unquoted equity instruments, these investments are carried at cost.
Other financial liabilities Issued financial instruments or their components, which are not designated at FVPL are classified as other financial liabilities, where the substance of the contractual arrangement results in the Company having an obligation either to deliver cash or another financial asset to the holder, or to satisfy the obligation other than by the exchange of a fixed amount of cash or another financial asset for a fixed number of own equity shares.
After initial measurement, other financial liabilities are subsequently measured at amortized cost using the effective interest rate method. Amortized cost is calculated by taking into account any discount or premium on the issue and fees that are an integral part of the effective interest rate. Any effects of restatement of foreign currency-denominated liabilities are recognized in profit or loss.
This accounting policy applies primarily to the Company’s “Insurance contract liabilities”, “Insurance payables” and “Accounts payable and other liabilities” that meet the above definition (other than liabilities covered by other accounting standards, such as pension liability and income tax payable).
Offsetting Financial assets and financial liabilities are offset and the net amount is reported in the statement of financial position if, and only if, there is a currently enforceable legal right to offset the recognized amounts and there is an intention to settle on a net basis, or to realize the asset and settle the liability simultaneously.
Impairment of Financial Assets The Company assesses at each reporting date whether there is objective evidence that a financial asset or a group of financial assets is impaired.

- 10 -
*SGVFS001357*
A financial asset or a group of financial assets is deemed to be impaired if, and only if, there is objective evidence of impairment as a result of one or more events that has occurred after the initial recognition of the asset (an incurred ‘loss event’) and that loss event (or events) has an impact on the estimated future cash flows of the financial asset or the group of financial assets that can be reliably estimated. Evidence of impairment may include indications that the borrower or a group of borrowers is experiencing significant financial difficulty, default or delinquency in interest or principal payments, the probability that they will enter bankruptcy or other financial reorganization, and where observable data indicate that there is measurable decrease in the estimated future cash flows, such as changes in arrears or economic conditions that correlate with defaults.
Financial assets carried at amortized cost For financial assets carried at amortized cost, the Company first assesses whether objective evidence of impairment exists for financial assets that are individually significant, or collectively for financial assets that are not individually significant. If the Company determines that no objective evidence of impairment exists for individually assessed financial asset, whether significant or not, it includes the asset in a group of financial assets with similar credit risk characteristics and collectively assesses for impairment. Assets that are individually assessed for impairment and for which an impairment loss is, or continues to be recognized, are not included in a collective assessment for impairment.
If there is an objective evidence that an impairment loss has been incurred, the amount of the loss is measured as the difference between the asset’s carrying amount and the present value of the estimated future cash flows. The present value of the estimated future cash flows is discounted at the financial asset’s original effective interest rate. If a loan has a variable interest rate, the discount rate for measuring any impairment loss is the current effective interest rate, adjusted for the original credit risk premium. The carrying amount of the asset is reduced through the use of an allowance account and the amount of loss is charged to profit or loss. If, in a subsequent period, the amount of the estimated impairment loss decreases because of an event occurring after the impairment was recognized, the previously recognized impairment loss is reversed. Any subsequent reversal of an impairment loss is recognized in profit or loss, to the extent that the carrying value of the asset does not exceed its amortized cost at the reversal date.
Time value is generally not considered when the effect of discounting is not material. The calculation of the present value of the estimated future cash flows of a collateralized financial asset reflects the cash flows that may result from foreclosure less costs for obtaining and selling the collateral, whether or not foreclosure is probable.
For the purpose of a collective evaluation of impairment, financial assets are grouped on the basis of credit risk characteristics such as past-due status and term.
AFS financial assets carried at fair value For equity investments classified as AFS financial assets, impairment indicators would include a significant or prolonged decline in the fair value of an investment below its cost or where other objective evidence of impairment exists. Where there is evidence of impairment, the cumulative loss (measured as the difference between the acquisition cost and the current fair value, less any impairment loss on that financial asset previously recognized in profit or loss) is removed from the statement of comprehensive income and recognized in the profit or loss. Impairment losses on equity investments are not reversed through profit or loss. Increases in fair value after impairment are recognized in the statement of comprehensive income.
- 11 -
*SGVFS001357*
AFS investments carried at cost If there is objective evidence that an impairment loss has been incurred on an unquoted equity instrument that is not carried at fair value because its fair value cannot be reliably measured, or on a derivative asset that is linked to and must be settled by delivery of such unquoted equity instrument, the amount of the loss is measured as the difference between the asset’s carrying amount and the present value of estimated future cash flows discounted at the current market rate of return for a similar financial asset.
Derecognition of Financial Assets and Liabilities Financial asset A financial asset (or, where applicable a part of a financial asset or part of a group of similar financial assets) is derecognized where:
• the right to receive cash flows from the asset have expired; • the Company retains the right to receive cash flows from the asset, but has assumed an
obligation to pay them in full without material delay to a third party under a ‘pass-through’ arrangement; or
• the Company has transferred its right to receive cash flows from the asset and either (a) has transferred substantially all the risks and rewards of the asset, or (b) has neither transferred nor retained substantially all the risks and rewards of the asset, but has transferred control of the asset.
When the Company has transferred its right to receive cash flows from an asset or has entered into a ‘pass-through’ arrangement and has neither transferred nor retained substantially all the risks and rewards of the asset nor transferred control of the asset, the asset is recognized to the extent of the Company’s continuing involvement in the asset. Continuing involvement that takes the form of a guarantee over the transferred asset is measured at the lower of the original carrying amount of the asset and the maximum amount of the consideration that the Company could be required to repay.
Financial liability A financial liability is derecognized when the obligation under the liability is discharged, cancelled, or has expired. Where an existing financial liability is replaced by another from the same lender on substantially different terms, or the terms of an existing liability are substantially modified, such an exchange or modification is treated as a derecognition of the original liability and the recognition of a new liability, and the difference in the respective carrying amounts is recognized in profit or loss.
Reinsurance The Company cedes insurance risk in the normal course of business for all of its businesses. Reinsurance assets include balances recoverable from reinsurance companies. Amounts recoverable from reinsurers are estimated in a manner consistent with the outstanding claims provision or settled claims associated with the reinsurer’s policies and are in accordance with the related reinsurance contract.
Reinsurance assets are reviewed for impairment at each reporting date or more frequently when an indication of impairment arises during the reporting year. Impairment occurs when there is objective evidence as a result of an event that occurred after initial recognition of the reinsurance asset that the Company may not receive all outstanding amounts due under the terms of the contract and the event has a reliably measurable impact on the amounts that the Company will receive from the reinsurers. The impairment loss is recorded in profit or loss.
- 12 -
*SGVFS001357*
Ceded reinsurance arrangements do not relieve the Company from its obligations to policyholders.
The Company also assumes reinsurance risk in the normal course of business for insurance contracts. Premiums and claims on assumed reinsurance are recognized in profit or loss as income and expenses in the same manner as they would be if the reinsurance were considered direct business, taking into account the product classification of the reinsured business. Reinsurance liabilities represent balances due to reinsurance companies. Amounts payable are estimated in a manner consistent with the associated reinsurance contract.
Premiums and claims are presented on a gross basis for both ceded and assumed reinsurance.
Reinsurance assets or liabilities are derecognized when the contractual rights are extinguished or expired or when the contract is transferred to another party.
Deferred Acquisition Costs (DAC) Costs that vary with and are primarily related to the acquisition of new and renewal insurance contracts are deferred and charged against income using the 24th method except for marine cargo where the DAC pertains to the commissions for the last two months of the year. The unamortized acquisition costs are shown in the assets section of the statement of financial position as “Deferred acquisition costs”. Reinsurance commissions are deferred and shown in the liabilities section of the statement of financial position as “Deferred reinsurance commissions”, subject to the same amortization method as the related acquisition costs.
Investment Properties Property held for long term rental yields or for capital appreciation, or for both, is classified as investment property. These properties are initially measured at cost, which includes transaction costs, but excludes day to day servicing costs. Subsequently, at each reporting date, such properties are carried at cost less impairment losses, if any.
Transfers are made to investment property when, and only when, there is a change in use, evidenced by the end of owner occupation or commencement of an operating lease to another party. Transfers are made from investment property when, and only when, there is a change in use, evidenced by commencement of owner occupation or commencement of development with a view to sale.
For a transfer from investment property to owner occupied property, the deemed cost for subsequent accounting is the fair value at the date of change in use. If owner occupied property becomes an investment property, the Company accounts for such property in accordance with the policy stated under property and equipment up to the date of the change in use.
Investment property is derecognized when it has been disposed of, or when permanently withdrawn from use and no future benefit is expected from its disposal. Any gain or loss on the retirement or disposal of investment properties is recognized in the profit or loss in the year of derecognition.
Property and Equipment Property and equipment are stated at cost, less accumulated depreciation and amortization and any allowance for impairment in value. The initial cost of property and equipment comprises its purchase price and any directly attributable costs of bringing the asset to its working condition and location for its intended use. Subsequent costs are included in the asset’s carrying amount or recognized as a separate asset, as appropriate, only when it is probable that future economic benefits associated with the item will flow to the Company and the cost of the item can be

- 13 -
*SGVFS001357*
measured reliably. All other repairs and maintenance expenses are charged to profit or loss during the reporting period in which they are incurred.
Depreciation and amortization are computed using the straight-line method over the estimated useful lives of the properties, or the term of the lease, whichever is shorter, for leasehold improvements, as follows:
Years Transportation equipment 5 Leasehold improvements 10 Computer equipment 5 Office furniture, fixtures and equipment 5
The assets’ residual values, useful lives and depreciation and amortization method are reviewed periodically to ensure that the method, residual value and period of depreciation and amortization are consistent with the expected pattern of economic benefits from items of property and equipment.
An item of property and equipment is derecognized upon disposal or when no future economic benefits are expected to arise from the continued use of the asset. Any gain or loss arising on derecognition of the asset (calculated as the difference between the net disposal proceeds and the carrying amount of the item) is included in profit or loss in the year the item is derecognized.
Impairment of Nonfinancial Assets The Company assesses at each reporting date whether there is an indication that an asset may be impaired. If any such indication exists, or when annual impairment testing for an asset is required, the Company makes an estimate of the asset’s recoverable amount. An asset’s recoverable amount is the higher of an asset’s or cash generating unit’s fair value less costs to sell and its value in use and is determined for an individual asset, unless the asset does not generate cash inflows that are largely independent of those from other assets or groups of assets. Where the carrying amount of an asset exceeds its recoverable amount, the asset is considered impaired and is written down to its recoverable amount. In assessing value in use, the estimated future cash flows are discounted to their present value using a pre-tax discount rate that reflects current market assessments of the time value of money and the risks specific to the asset. Impairment losses of continuing operations are recognized in the statement of income in those expense categories consistent with the function of the impaired asset.
An assessment is made at each reporting date as to whether there is any indication that previously recognized impairment losses may no longer exist or may have decreased. If any such indication exists, the recoverable amount is estimated. A previously recognized impairment loss is reversed only if there has been a change in the assumptions used to determine the asset’s recoverable amount since the last impairment loss was recognized. If such is the case, the carrying amount of the asset is increased to its recoverable amount. That increased amount cannot exceed the carrying amount that would have been determined, net of depreciation and amortization, had no impairment loss been recognized for the asset in prior years. Such reversal is recognized in the statement of income unless the asset is carried at revalued amount, in which case, the reversal is treated as a revaluation increase. After such reversal, the depreciation and amortization charge is adjusted in future periods to allocate the asset’s revised carrying amount, less any residual value, on a systematic basis over its remaining useful life.

- 14 -
*SGVFS001357*
Product Classification Insurance contracts Insurance contracts are defined as those contracts under which the Company (the insurer) accepts significant insurance risk from another party (the policyholders) by agreeing to compensate the policyholders if a specified uncertain future event (the insured event) adversely affects the policyholder. As a general guideline, the Company defines significant insurance risk, by comparing benefits paid with benefits payable if the insured event did not occur. Insurance contracts can also transfer financial risk. Financial risk is the risk of a possible future change in one or more of a specified interest rate, security price, commodity price, foreign exchange rate, index of price or rates, a credit rating or credit index or other variable.
Once a contract has been classified as an insurance contract, it remains an insurance contract for the remainder of its lifetime, even if the insurance risk reduces significantly during this period, unless all rights and obligations are extinguished or has expired.
Insurance contract liabilities Insurance contract liabilities are recognized when contracts are entered into and premiums are charged.
Provision for unearned premiums The proportion of written premiums, gross of commissions payable to intermediaries, attributable to subsequent periods or to risks that have not yet expired is deferred as provision for unearned premiums. The change in the provision for unearned premiums is taken to the statement of income in the order that revenue is recognised over the period of risk. Further provisions are made to cover claims under unexpired insurance contracts which may exceed the unearned premiums and the premiums due in respect of these contracts.
Claims provision and incurred but not reported (IBNR) losses Outstanding claims are based on the estimated ultimate cost of all claims incurred but not settled at the statement of financial position date, whether reported or not, together with related claims handling costs and reduction for the expected value of salvage and other recoveries. Delays can be experienced in the notification and settlement of certain types of claims, therefore the ultimate cost of which cannot be known with certainty at the reporting date. The liability is not discounted for the time value of money and includes provision for claims reported and claims IBNR. The provision for claims liability is based on the independent adjusters’ report on the individual claims and the provision for claims IBNR is calculated based on time experience. No provision for equalization or catastrophic reserves is recognized. The liabilities are derecognized when the contract is discharged, cancelled or has expired.
Liability adequacy test At each reporting date, liability adequacy tests are performed to ensure the adequacy of insurance contract liabilities, net of related DAC. In performing the test, current best estimates of future cash flows, claims handling and policy administration expenses are used. Changes in expected claims that have occurred, but which have not been settled, are reflected by adjusting the liability for claims and future benefits. Any inadequacy is immediately charged to profit or loss by establishing an unexpired risk provision for losses arising from the liability adequacy tests.

- 15 -
*SGVFS001357*
Equity Capital stock Capital stock is measured at par value for all shares issued. When the Company issues shares in excess of par, the excess is recognized as additional paid-in capital (APIC).
Deposit for future stock subscription Deposits for future stock subscriptions (DFSS) represent the amount paid by the stockholders for future stock issuances of the Company. DFSS is measured at par value. DFSS is transferred to the respective capital stock account upon approval of the Securities and Exchange Commissions (SEC) of the Company’s application for increase in its authorized capital stock.
Retained earnings Retained earnings represent the cumulative balance of net income or loss of the Company, net of any dividend distribution.
Pension Cost Pension cost is actuarially determined using the projected unit credit method. This method reflects services rendered by employees up to the date of valuation and incorporates assumptions concerning employees’ projected salaries. Actuarial valuations are conducted with sufficient regularity, with option to accelerate when significant changes to underlying assumptions occur. Pension cost includes current service cost, interest cost, recognized actuarial gains and losses and the effect of any curtailment or settlement.
The net pension liability recognized in the statement of financial position in respect of the defined benefit pension plans is the present value of the defined benefit obligation at the reporting date less the fair value of the plan assets. The defined benefit obligation is calculated annually by independent actuary using the projected unit credit method. The present value of the defined benefit obligation is determined by using risk-free interest rates of government bonds that have terms to maturity approximating the terms of the related pension liability or applying a single weighted average discount rate that reflects the estimated timing and amount of benefit payments.
Actuarial gains and losses is recognized in profit or loss if the cumulative unrecognized actuarial gains and losses at the end of the previous reporting period exceeded the greater of 10% of the present value of defined benefit obligation or 10% of the fair value of plan assets. These gains and losses are recognized over the expected average remaining working lives of the employees participating in the plan.
Revenue Recognition Revenue is recognized to the extent that it is probable that the economic benefits will flow to the Company and the revenue can be reliably measured. The following specific recognition criteria must also be met before revenue is recognized:
Premiums Premiums from short-duration insurance contracts are recognized as revenue over the period of the contracts using the 24th method, except for marine cargo where the provision for unearned premiums pertains to the premiums for the last two months of the year. The gross premiums written for marine cargo insurance policies for the first ten months of the year and the last two months of the preceding year are recognized as premium income in the current year. The portion of the premiums written that relate to the unexpired periods of the policies at reporting date and the last two months of marine cargo policies is accounted for as provision for unearned premiums and is presented under “Insurance contract liabilities” in the liabilities section of the statement of financial position. The related reinsurance premiums that pertain to the unexpired periods at

- 16 -
*SGVFS001357*
reporting date are accounted for as deferred reinsurance premiums shown under “Reinsurance assets” in the assets section of the statement of financial position. The net changes in these accounts between reporting dates are charged against or credited to income for the year.
Commission income Commissions earned from short-duration insurance contracts are recognized as revenue over the period of the contracts using the 24th method except for the marine cargo where the deferred reinsurance commissions for the last two months of the year are considered earned the following year. The portion of the commissions that relate to the unexpired periods of the policies at each reporting dates are accounted for as “Deferred reinsurance commissions” and presented in the liabilities section of the statement of financial position.
Interest income Interest income is recognized in the statement of income as it accrues, taking into account the effective yield of the asset. Interest income includes the amortization of any discount or premium using the effective interest rate.
Other income Other income from other sources is recognized when earned. Other underwriting income Other underwriting income from other sources is recognized when earned.
Dividend income Dividend income is recognized when the shareholders’ right to receive the payment is established.
Costs and Expenses Costs and expenses Costs and expenses are decreases in economic benefits during the accounting period in the form of outflows or decrease of assets or incurrence of liabilities that result in decrease in equity, other than those relating to distributions to equity participants. Expenses are recognized in the profit or loss in the period these are incurred.
Benefits and claims Benefits and claims consist of benefits and claims paid to policyholders, which include changes in the valuation of insurance contract liabilities, except for changes in the provision for unearned premiums which are recorded in insurance revenue. It further includes internal and external claims handling costs that are directly related to the processing and settlement of claims. Amounts receivable in respect of salvage and subrogation are also considered. General insurance claims are recorded on the basis of notifications received. Commission expense Commissions are recognized as expense over the period of the contracts using the 24th method. The portion of the commissions that relates to the unexpired periods of the policies at the end of the reporting period is accounted for as “Deferred acquisition cost” in the assets section of the statement of financial position.

- 17 -
*SGVFS001357*
Leases The determination of whether an arrangement is, or contains a lease, is based on the substance of the arrangement and requires an assessment of whether the fulfillment of the arrangement is dependent on the use of a specific asset or assets and the arrangement conveys a right to use the asset. A reassessment is made after inception of the lease only if one of the following applies:
a. There is a change in contractual terms, other than a renewal or extension of the arrangement; b. A renewal option is exercised or extension granted, unless that term of the renewal or
extension was initially included in the lease term; c. There is a change in the determination of whether fulfillment is dependent on a specified asset;
or d. There is a substantial change to the asset.
Where a reassessment is made, lease accounting shall commence or cease from the date when the change in circumstances gave rise to the reassessment for scenarios a, c or d above, and at the date of renewal or extension period for scenario b.
Company as a lessee Leases where the lessor retains substantially all the risks and benefits of ownership of the asset are classified as operating leases. Operating lease payments are recognized as expense in the statement of income on a straight-line basis over the lease term. Minimum lease payments are recognized on a straight-line basis while the variable rent is recognized as an expense based on the terms of the lease contract.
Provisions Provisions are recognized when the Company has a present obligation (legal or constructive) as a result of a past event, it is probable that an outflow of resources embodying economic benefits will be required to settle the obligation, and a reliable estimate can be made of the amount of the obligation. Where the Company expects some or all of a provision to be reimbursed, for example, under an insurance contract, the reimbursement is recognized as a separate asset but only when the reimbursement is virtually certain. The expense relating to any provision is presented in profit or loss, net of any reimbursement. If the effect of the time value of money is material, provisions are determined by discounting the expected future cash flows at a pre-tax rate that reflects current market assessments of the time value of money and, where appropriate, the risks specific to the liability. Where discounting is used, the increase in the provision due to the passage of time is recognized as an interest expense.
Contingencies Contingent liabilities are not recognized in the financial statements but are disclosed unless the possibility of an outflow of resources embodying economic benefits is remote. Contingent assets are not recognized but are disclosed in the financial statements when an inflow of economic benefits is probable.
Income Tax Income tax for the year consists of current and deferred tax. Income tax is determined in accordance with Philippine tax laws. Income tax is recognized in the statement of comprehensive income, except to the extent that it relates to items recognized directly in equity or other comprehensive income. Tax on these items is recognized in the statement of comprehensive income.
- 18 -
*SGVFS001357*
Current tax Current tax assets and liabilities for the current and prior periods are measured at the amount expected to be recovered from or paid to the taxation authorities. The tax rates and tax laws used to compute the amount are those that have been enacted or substantially enacted as at the reporting date.
Deferred tax Deferred tax is provided, using the liability method, on all temporary differences at the reporting date between the tax bases of assets and liabilities and their carrying amounts for financial reporting purposes.
Deferred tax liabilities are recognized for all taxable temporary differences. Deferred tax assets are recognized for all deductible temporary differences, carryforward of unused tax credits from the excess of minimum corporate income tax (MCIT) over the regular income tax, and unused net operating loss carryover (NOLCO), to the extent that it is probable that sufficient taxable profit will be available against which the deductible temporary differences and carryforward of unused tax credits from MCIT and unused NOLCO can be utilized. Deferred income tax, however, is not recognized on temporary differences that arise from the initial recognition of an asset or liability in a transaction that is not a business combination and, at the time of the transaction, affects neither the accounting income nor taxable income or loss.
The carrying amount of deferred tax assets is reviewed at each reporting date and reduced to the extent that it is no longer probable that sufficient taxable profit will be available to allow all or part of the deferred income tax asset to be utilized. Unrecognized deferred tax assets are reassessed at each reporting date and are recognized to the extent that it has become probable that future taxable profit will allow all or part of the deferred tax assets to be recovered.
Deferred tax assets and liabilities are measured at the tax rate that is applicable to the period when the asset is realized or the liability is settled, based on tax rates (and tax laws) that have been enacted or substantially enacted as at the reporting date. Movements in the deferred income tax assets and liabilities arising from changes in tax rates are charged against or credited to operations for the period.
Current tax and deferred tax relating to items recognized as other comprehensive income is also recognized per each component in the statement of comprehensive income.
Deferred tax assets and deferred tax liabilities are offset if a legally enforceable right exists to set off current tax assets against current tax liabilities and deferred taxes related to the same taxable entity and the same taxation authority.
Value-Added Tax (VAT) Revenue, expenses and assets are recognized net of the amount of sales tax except: • where the tax incurred on a purchase of assets or services is not recoverable from the tax
authority, in which case the tax is recognized as part of the cost of acquisition of the asset or as part of the expense item as applicable; and,
• receivables and payables that are stated with the amount of tax included.
The net amount of tax recoverable from, or payable to, the tax authority is included as part of receivables or payables in the statement of financial position.

- 19 -
*SGVFS001357*
Events After the Reporting Period Any post year-end events that provide additional information about the Company’s position at the reporting date (adjusting event) are reflected in the financial statements. Post year-end events that are not adjusting events, if any, are disclosed in the financial statements when material.
3. Significant Accounting Judgments and Estimates
Below are the estimates and judgments used in preparing the Company’s financial statements. These estimates and judgments affect the reported amounts of assets and liabilities and contingent liabilities at the reporting date as well as affecting the reported income and expenses for the year. These estimates are based on management’s best knowledge based on historical experiences for future expectations and judgment of information and financial data as at the date the financial statements are approved. Although these estimates are believed to be reasonable under the circumstances, the actual outcome may differ from these estimates, possibly significantly, in future periods when subject to changes.
Estimates and judgments are continually evaluated and are based on historical experience and other factors, including expectations of future events that are believed to be reasonable under the circumstances.
Judgments Operating leases The Company has entered into property leases for its operations. The Company has determined that the lessor retains all the significant risks and rewards of ownership of these properties which are being leased on operating leases.
Financial assets not quoted in an active market The Company classifies financial assets by evaluating, among others, whether the asset is quoted or not in an active market. Included in the evaluation on whether a financial asset is quoted in an active market is the determination on whether quoted prices are readily and regularly available, and whether those prices represent actual and regularly occurring market transactions on an arm’s length basis.
Estimates Claims liabilities arising from insurance contracts For nonlife insurance contracts, estimates have to be made both for the expected ultimate cost of claims reported at the reporting date and for the expected ultimate cost of the IBNR claims at the reporting date. It can take a significant period of time before the ultimate claims cost can be established with certainty and for some type of policies, IBNR claims form the majority of the claims provision. The primary technique adopted by management in estimating the cost of notified and IBNR claims, is that of using past claim settlement trends to predict future claims settlement trends. At each reporting date, prior year claims estimates are assessed for adequacy and changes made are charged to provision. Nonlife insurance claims provisions are not discounted for the time value of money.
The main assumption underlying the estimation of the claims provision is that a Company’s past claims development experience can be used to project future claims development and hence ultimate claims costs. Historical claims development is mainly analyzed by accident years, but can also be further analyzed by significant business lines and claim types. Large claims are usually separately addressed, either by being reserved at the face value of loss adjuster estimates or separately projected in order to reflect their future development. In most cases, no explicit
- 20 -
*SGVFS001357*
assumptions are made regarding future rates of claims inflation or loss ratios. Instead, the assumptions used are those implicit in the historical claims development data on which the projections are based.
The carrying value of total provision for outstanding claims and IBNR amounted to P=80.19 million and P=41.95 million as of December 31, 2012 and 2011, respectively (see Note 11).
Fair value of financial instruments Where the fair values of financial assets and financial liabilities recorded on the statement of financial position cannot be derived from active markets, they are determined using a variety of valuation techniques that include the use of mathematical models. The input to these models is taken from observable markets where possible, but where this is not feasible, a degree of judgment is required in establishing fair values.
The Company carries certain financial assets at fair value, which requires extensive use of accounting estimates and judgments. Fair value determinations for financial assets and liabilities are based generally on listed or quoted market prices. If prices are not readily determinable or if liquidating the positions is reasonably expected to affect market prices, fair value is based on either internal valuation models or management’s estimate of amounts that could be realized under current market conditions, assuming an orderly liquidation over a reasonable period of time. While significant components of fair value were determined using verifiable objective evidence (i.e., foreign exchange rates, interest rates, volatility rates), the amount of changes in fair value of these financial assets and liabilities would affect profit or loss and other comprehensive income.
The carrying value of AFS financial assets is P=26.70 million and P=20.76 million as of December 31, 2012 and 2011, respectively (see Note 6).
Fair values of investment properties The value of the parcels of land was arrived using the Market Data Approach. In this approach, the value of the land is based on sales and listings of comparable property registered within the vicinity. The technique of this approach requires the establishment of comparable property by reducing reasonable comparative sales and listings to a common denominator. This is done by adjusting the difference between the subject property and actual sales and listings regarded as comparable. The properties used as basis of comparison are situated within the immediate vicinity of the subject properties.
Impairment of financial assets The Company determines that AFS equity investments are impaired when there has been a significant or prolonged decline in the fair value below its cost or where other objective evidence of impairment exists. This determination of what is significant or prolonged decline requires judgment. The Company treats ‘significant’ generally as 30% or more or ‘prolonged’ greater than 12 months. In addition, the Company evaluates other factors, including the normal volatility in the share price for quoted equities and the future cash flows and the discount factors for unquoted equities. Impairment may be appropriate when there is evidence of deterioration in the financial health of the investee, the industry and sector performance, like changes in technology, and operational and financing cash flows.
The Company reviews its loans and receivables at each reporting date to assess whether an allowance for impairment should be recorded in profit or loss. In particular, judgment by management is required in the estimation of the amount and timing of future cash flows when determining the level of allowance required. Such estimates are based on assumptions about a number of factors and actual results may differ, resulting in future changes to the allowance.

- 21 -
*SGVFS001357*
The level of this allowance is evaluated by management on the basis of factors that affect the collectibility of the accounts. These factors include, but are not limited to age of balances, financial status of counterparties, payment behavior and known market factors. The Company reviews the age and status of receivables, and identifies accounts that are to be provided with allowance on a regular basis.
In addition to specific allowance against individually significant loans and receivables, the Company also makes a collective impairment allowance against exposures which, although not specifically identified as requiring a specific allowance, have a greater risk of default than when originally granted.
The amount and timing of recorded expenses for any period would differ if the Company made different judgments or utilized different estimates. An increase in allowance for doubtful accounts would increase recorded expenses and decrease net income.
The related balances of financial assets as of December 31 follow:
2012 2011 Insurance receivables - net (Note 5) P=84,736,561 P=91,840,969 AFS financial assets (Note 6) 26,700,576 20,761,901 HTM investments (Note 6) 53,359,182 45,518,316 Loans and receivables (Note 6) 8,371,523 10,269,787 P=173,167,842 P=168,390,973
As of December 31, 2012 and 2011, allowance for doubtful accounts amounted to P=0.21 million (see Note 5).
Estimated useful lives of property and equipment and investment properties The Company reviews annually the estimated useful lives of property and equipment and investment properties, based on the period over which the assets are expected to be available for use. It is possible that future results of operations could be materially affected by changes in these estimates. A reduction in the estimated useful lives of property and equipment and investment properties would increase recorded depreciation and amortization expense and decrease the related asset accounts.
As of December 31, 2012 and 2011, property and equipment amounted to P=7.19 million and P=6.99 million, respectively, while investment properties amounted to P=76.50 million (see Notes 9 and 10).
Impairment of nonfinancial assets The Company assesses impairment on assets (property and equipment and investment properties) whenever events or changes in circumstances indicate that the carrying amount of an asset may not be recoverable. The factors that the Company considers important which could trigger an impairment review include the following:
• significant underperformance relative to expected historical or projected future operating
results; • significant changes in the manner of use of the acquired assets or the strategy for overall
business; and • significant negative industry or economic trends.
- 22 -
*SGVFS001357*
The Company recognizes an impairment loss whenever the carrying amount of an asset exceeds its recoverable amount. Recoverable amount is estimated for an individual asset or, if it is not possible, for the cash-generating unit to which the asset belongs.
The recoverable amount is the higher of fair value less costs to sell and its value in use, determined on an individual asset (cash generating unit) basis, unless the individual asset (cash generating unit) does not generate cash flows that are largely independent from those of other assets or group of assets (group of cash generating units).
As of December 31, 2012, the carrying value of property and equipment and investment properties amounted to P=7.19 million and P=76.50 million, respectively. As of December 31, 2011, the carrying value of property and equipment and investment properties amounted to P=6.99 million and P=76.50 million, respectively (see Notes 9 and 10).
Pension and other employee benefits The determination of pension obligation and other employee benefits is dependent on the selection of certain assumptions used in calculating such amounts. Those assumptions include, among others, discount rates, expected return on plan assets and salary increase rates. Due to the long term nature of these plans, such estimates are subject to significant uncertainty.
Those assumptions are described in Note 19 and include, among others, discount rates, expected returns on plan assets and rates of salary increase. While the Company believes that the assumptions are reasonable and appropriate, significant differences in actual experience or significant changes in assumptions materially affect retirement obligations. Please see Note 19 for the related balances.
Recognition of deferred tax assets Deferred tax assets are recognized for all deductible temporary differences to the extent that it is probable that taxable profit will be available against which these can be utilized. Significant management judgment is required to determine the amount of deferred tax assets that can be recognized. These assets are periodically reviewed for realization. Periodic reviews cover the nature and amount of deferred income and expense items, expected timing when assets will be used or liabilities will be required to be reported, reliability of historical profitability of businesses expected to provide future earnings and tax planning strategies which can be utilized to increase the likelihood that tax assets will be realized.
The Company recognized deferred tax assets amounting to P=5.02 million and P=3.73 million as of December 31, 2012 and 2011 since management believes that the related tax benefits will be realized in the future (see Note 20). Deferred tax assets pertaining to NOLCO and MCIT were not recognized in the books because the management believes that it is not probable that taxable profits will be available against which these can be utilized (see Note 20).

- 23 -
*SGVFS001357*
4. Cash and Cash Equivalents
This account consists of:
2012 2011 Cash on hand P=1,157,271 P=195,000 Cash in banks 17,978,865 12,318,402 Short-term deposits 5,286,218 – P=24,422,354 P=12,513,402
Cash in banks earns interest at the respective bank deposit rates. Short-term deposits are made for varying periods depending on the immediate cash requirements of the Company and earned interest with rates ranging from 0.83% to 2.75% in 2012 and 4.20% to 4.61% in 2011.
5. Insurance Receivables
This account consists of:
2012 2011 Premiums receivable P=53,311,453 P=48,456,507 Reinsurance recoverable on paid losses 22,583,540 35,022,761 Due from ceding companies 7,995,160 7,467,565 Funds held by ceding companies 1,059,191 1,106,919 84,949,344 92,053,752 Less: allowance for doubtful accounts 212,783 212,783 P=84,736,561 P=91,840,969
The reinsurance recoverable on paid losses pertains to amounts recoverable from the reinsurers in respect of claims already paid by the Company.
Funds held by ceding companies pertain to amounts withheld by ceding companies as collateral for possible reinsurance payments.
The following tables show the aging information of insurance receivables:
December 31, 2012
Less than 3 months 3-6 months 6-12 months
More than 12 months Total
Premiums receivable P=34,541,083 P=18,770,370 P=– P=– P=53,311,453 Reinsurance recoverable on paid losses 5,307,132 4,358,622 8,468,828 4,448,958 22,583,540 Due from ceding companies 1,577,895 2,439,129 1,998,780 1,979,356 7,995,160 Funds held by ceding companies – – – 1,059,191 1,059,191 P=41,426,110 P=25,568,121 P=10,467,608 P=7,487,505 P=84,949,344

- 24 -
*SGVFS001357*
December 31, 2011
Less than 3 months 3-6 months 6-12 months
More than 12 months Total
Premiums receivable P=31,572,843 P=16,883,664 P=– P=– P=48,456,507 Reinsurance recoverable on paid losses 8,755,691 7,004,552 12,257,966 7,004,552 35,022,761 Due from ceding companies 1,493,513 2,866,891 1,120,135 1,987,026 7,467,565 Funds held by ceding companies – – – 1,106,919 1,106,919 P=41,822,047 P=26,755,107 P=13,378,101 P=10,098,497 P=92,053,752
As of December 31, 2012 and 2011, the Company provided allowance for doubtful accounts on its premiums receivable amounting to P=0.21 million. The impairment assessment has been determined on an individual basis. There were no movements in the allowance for doubtful accounts in 2012 and 2011.
6. Financial Assets
The Company’s financial assets are summarized by measurement categories as follows:
2012 2011 HTM investments P=53,359,182 P=45,518,316 AFS financial assets 26,700,576 20,761,091 Loans and receivables 8,371,523 10,269,787 P=88,431,281 P=76,549,194
The assets included in each of the categories above are detailed below:
AFS financial assets
AFS financial assets pertain to quoted and unquoted equity securities. Details are as follows:
2012 2011 Quoted securities - at fair value Listed equity securities: Common shares P=21,008,576 P=20,694,091 Preferred shares 5,662,000 37,000 Unquoted securities - at cost Common shares 30,000 30,000 Total AFS financial assets recognized in the statements of financial position P=26,700,576 P=20,761,091
The cost of the quoted and unquoted equity securities are as follows:
2012 2011 Quoted securities - at cost Listed equity securities: Common shares P=25,146,662 P=24,068,982 Preferred shares 5,662,000 37,000 Unquoted securities - at cost Common shares 30,000 30,000 Total AFS financial assets at cost P=30,838,662 P=24,135,982

- 25 -
*SGVFS001357*
As of December 31, 2012 and 2011, the “Revaluation reserve on AFS financial assets” recorded in equity amounted to P=4.14 million and P=3.37 million, respectively.
The movements in this account follow:
2012 2011 Balance at the beginning of the year (P=3,374,891) P=759,758 Revaluation reserve recognized in other comprehensive income 186,749 (3,080,970) Realized gain transferred to profit or loss (1,731,220) (1,496,143) Impairment loss (Note 16) 781,276 442,464 Balance at the end of the year (P=4,138,086) (P=3,374,891)
HTM investments
HTM investments pertain to peso-denominated government securities. Details as of and for the years ended December 31, 2012 and 2011 follow:
2012 2011 Fair value P=58,113,862 P=34,156,936 Carrying value 53,359,182 45,518,316 Coupon rate 4.88% to 7.38% 5.00% to 7.38% Interest income earned (Note 16) P=2,164,269 P=1,071,454
The outstanding HTM investments will mature starting August 01, 2012 to August 19, 2020.
The carrying values of AFS financial assets and HTM investments have been determined as follows:
HTM AFS At December 31, 2010 P=33,704,218 P=22,177,439 Additions 35,203,929 39,230,295 Disposals/maturities (23,389,831) (37,565,673) Fair value loss recognized in other comprehensive
income – (4,134,649) Fair value gain transferred to profit or loss (Note 16) – 1,496,143 Impairment loss (Note 16) – (442,464) At December 31, 2011 45,518,316 20,761,091 Additions 24,351,000 61,983,568 Disposals/maturities (16,510,134) (56,230,832) Fair value loss recognized in other comprehensive
income – (763,195) Fair value gain transferred to profit or loss (Note 16) – 1,731,220 Impairment loss (Note 16) – (781,276) At December 31, 2012 P=53,359,182 P=26,700,576
In 2012 and 2011, impairment loss recognized pertains to investments in various listed equity shares amounting to P=0.78 million and P=0.44 million, respectively.
- 26 -
*SGVFS001357*
Loans and receivables
This account consists of the following:
2012 2011 Accounts receivable P=4,280,441 P=4,293,130 Receivables from employees (Note 22) 3,370,878 4,680,395 Accrued interest income 720,204 169,612 Mortgage loans – 1,126,650 P=8,371,523 P=10,269,787
As of December 31, 2012 and 2011, the Company’s receivables from employees, accounts receivable, mortgage loans and accrued interest income are all due within one year. Accrued interest income pertains mainly to interest accrued arising from cash and cash equivalents, HTM investments and short-term investments.
7. Reinsurance Assets
This account consists of the following:
2012 2011 Reinsurance recoverable on unpaid losses (Note 11) P=52,597,301 P=20,449,237 Deferred reinsurance premiums (Note 11) 28,277,822 25,172,912 P=80,875,123 P=45,622,149
8. Deferred Acquisition Costs and Deferred Reinsurance Commissions
The details of deferred acquisition costs net of deferred reinsurance commissions follow:
2012 2011 Deferred acquisition costs At January 1 P=11,473,226 P=13,682,386 Cost deferred during the year 29,512,556 24,118,895 Amortization during the year (27,271,178) (26,328,055) At December 31 P=13,714,604 P=11,473,226 2012 2011 Deferred reinsurance commissions At January 1 P=5,504,202 P=5,991,233 Income deferred during the year 12,896,454 11,748,547 Income earned during the year (12,436,594) (12,235,578) At December 31 P=5,964,062 P=5,504,202 P=7,750,542 P=5,969,024
- 27 -
*SGVFS001357*
9. Investment Properties
The movements in this account follow:
2012 2011Balance at the beginning of the year P=76,501,788 P=76,724,569Disposals – (222,781)Balance at the end of the year P=76,501,788 P=76,501,788
This account consists of parcels of land acquired by the Company from its borrowers in default and contributions from shareholders. The fair value of the Company’s investment properties amounted to P=117,537,000 based on fair valuations dated November 29, 2006 to January 10, 2013. The Company’s investment properties were valued by independent professionally qualified appraisers on various dates from November 29, 2006 to January 10, 2013. Management believes that the fair values of these investment properties approximates their fair values as of December 31, 2012 and 2011 since there were no major developments in the area where the investment properties are located. The fair value represents the amount at which the assets could be exchanged between a knowledgeable, willing buyer and knowledgeable, willing seller in an arm’s length transaction at the date of valuation.
The fair values of the parcels of land were arrived using the Market Data Approach. In this approach, the value of the land is based on sales and listings of comparable property registered within the vicinity. The technique of this approach requires the establishment of comparable property by reducing reasonable comparative sales and listings to a common denominator. This is done by adjusting the difference between the subject property and actual sales and listings regarded as comparable. The properties used as basis of comparison are situated within the immediate vicinity of the subject properties.
In 2011, a parcel of land situated in Municipality of San Mateo, Rizal with an original cost of P=0.22 million was sold for P=1.80 million. The gain on sale of investment property amounting to P=1.58 million is included in the statements of comprehensive income (see Note 16).
10. Property and Equipment
The rollforward analysis of this account follows:
December 31, 2012
Transportation
Equipment Leasehold
ImprovementsComputer
Equipment
Office Furniture,
Fixtures and Equipment Total
Cost At January 1, 2012 P=5,456,364 P=887,177 P=10,453,159 P=3,364,087 P=20,160,787 Additions 1,080,000 42,753 1,377,644 200,760 2,701,157 Disposals – (26,422) (314,090) (85,219) (425,731) At December 31, 2012 6,536,364 903,508 11,516,713 3,479,628 22,436,213 Accumulated depreciation and
amortization At January 1, 2012 4,050,282 301,917 6,622,716 2,195,627 13,170,542 Depreciation and amortization 415,890 86,450 1,645,817 296,191 2,444,348 Disposal – (3,004) (306,590) (58,354) (367,948) At December 31, 2012 4,466,172 385,363 7,961,943 2,433,464 15,246,942 Net book value P=2,070,192 P=518,145 P=3,554,770 P=1,046,164 P=7,189,271
- 28 -
*SGVFS001357*
December 31, 2011
Transportation
Equipment Leasehold
ImprovementsComputer
Equipment
Office Furniture,
Fixtures and Equipment Total
Cost At January 1, 2011 P=5,056,364 P=688,136 P=9,796,536 P=3,014,099 P=18,555,135 Additions 900,000 227,194 1,500,982 396,261 3,024,437 Disposals (500,000) (28,153) (844,359) (46,273) (1,418,785) At December 31, 2011 5,456,364 887,177 10,453,159 3,364,087 20,160,787 Accumulated depreciation and
amortization At January 1, 2011 3,766,939 229,754 5,721,232 1,954,311 11,672,236 Depreciation and amortization 308,548 83,170 1,739,343 287,589 2,418,650 Disposal (25,205) (11,007) (837,859) (46,273) (920,344) At December 31, 2011 4,050,282 301,917 6,622,716 2,195,627 13,170,542 Net book value P=1,406,082 P=585,260 P=3,830,443 P=1,168,460 P=6,990,245
Depreciation and amortization expense charged against operations amounted to P=2.44 million and P=2.42 million in 2012 and 2011, respectively (see Note 18).
In 2011, the Company disposed various property and equipment with above original cost of P=1.42 million. The total proceeds from the sale amounted to P=0.50 million.
11. Insurance Contract Liabilities and Reinsurance Assets
Short-term nonlife insurance liabilities may be analyzed as follows:
Insurance contract
liabilities
Reinsurers’ share of
liabilities (Note 7)
Net 2012
Insurance contract
liabilities
Reinsurers’ share of
liabilities (Note 7)
Net 2011
Provision for claims reported by policyholders P=79,398,688 P=52,570,591 P=26,828,097 P=41,442,500 P=20,439,658 P=21,002,842
Provision for IBNR losses 789,191 26,710 762,481 511,801 9,579 502,222 Outstanding claims provision 80,187,879 52,597,301 27,590,578 41,954,301 20,449,237 21,505,064 Provision for unearned
premiums 60,223,384 28,277,822 31,945,562 49,812,387 25,172,912 24,639,475 Total insurance contract
liabilities P=140,411,263 P=80,875,123 P=59,536,140 P=91,766,688 P=45,622,149 P=46,144,539
Provisions for claims reported by policyholders and IBNR may be analyzed as follows:
Insurance contract
liabilities
Reinsurers’ share of
liabilities (Note 7)
Net 2012
Insurance contract
liabilities
Reinsurers’ share of
liabilities (Note 7)
Net 2011
At January 1 P=41,954,301 P=20,449,237 P=21,505,064 P=48,235,022 P=27,950,415 P=20,284,607 Claims incurred during the
year 89,921,552 65,504,360 24,417,192 44,880,681 24,924,488 19,956,193 Claims paid during the year -
net of salvage and subrogation (Note 17) (51,965,364) (33,373,427) (18,591,937) (51,011,900) (32,429,423) (18,582,477)
Increase (decrease) in IBNR 277,390 17,131 260,259 (149,502) 3,757 (153,259) At December 31 P=80,187,879 P=52,597,301 P=27,590,578 P=41,954,301 P=20,449,237 P=21,505,064
- 29 -
*SGVFS001357*
Provision for unearned premiums may be analyzed as follows:
Insurance contract
liabilities
Reinsurers’ share of
liabilities (Note 7)
Net 2012
Insurance contract
liabilities
Reinsurers’ share of
liabilities (Note 7)
Net 2011
At January 1 P=49,812,387 P=25,172,912 P=24,639,475 P=53,246,761 P=31,299,300 P=21,947,461 New policies written during
the year (Note 15) 132,817,805 62,683,624 70,134,181 116,219,785 58,813,638 57,406,147 Premiums earned during the
year (Note 15) (122,406,808) (59,578,714) (62,828,094) (119,654,159) (64,940,026) (54,714,133) At December 31 P=60,223,384 P=28,277,822 P=31,945,562 P=49,812,387 P=25,172,912 P=24,639,475
12. Insurance Payables
This account consists of:
2012 2011 Due to reinsurers and ceding companies P=1,683,549 P=2,277,162 Funds held for reinsurers 5,328,558 4,704,800 P=7,012,107 P=6,981,962
The rollforward analysis of insurance payables follows:
Due to reinsurers
and ceding companies
Funds held for reinsurers Total
At December 31, 2011 P=8,627,909 P=4,785,873 P=13,413,782 Arising during the year 12,344,765 4,704,800 17,049,565 Paid/Utilized (18,695,512) (4,785,873) (23,481,385) At December 31, 2011 P=2,277,162 P=4,704,800 P=6,981,962 Arising during the year 22,260,748 5,328,558 27,589,306 Paid/Utilized (22,854,361) (4,704,800) (27,559,161) At December 31, 2012 P=1,683,549 P=5,328,558 P=7,012,107
13. Accounts Payable and Other Liabilities
This account consists of:
2012 2011 Collateral Bonds P=4,595,524 P=– Deferred output VAT 3,660,089 1,090,157 Taxes payable 2,845,970 4,290,226 Accrued expenses 1,004,851 1,163,934 Output VAT 192,718 554,667 Accounts payable 191,728 98,198 P=12,490,880 P=7,197,182

- 30 -
*SGVFS001357*
Collateral bonds pertains to cash that is deposited and held by the Company to secure the obligations under the bond issued. Taxes payable pertain to withholding taxes, documentary stamps and fire service tax payable.
Accounts payable pertains to payable to government agencies.
Accounts payable pertains to accounts payable and accrued expenses generally have 30- to 60- day terms.
14. Equity
The Company’s capital stock consists of:
2012 2011 Shares Amount Shares Amount Common stock - P=100 par value Authorized: At January 1 and December 31 3,000,000 P=300,000,000 3,000,000 P=300,000,000 Issued and outstanding: At January 1 1,508,000 P=150,800,000 1,423,841 P=142,384,100 Issuance of shares 242,000 24,200,000 84,159 8,415,900 At December 31 1,750,000 P=175,000,000 1,508,000 P=150,800,000
The balance of P=14,200,000 recorded as DFSS as of December 31, 2011 pertains to the unapplied portion of the parcels of land acquired by the Company as capital infusion in 2009.
The BOD approved the conversion of the DFSS to capital stock and the issuance of stock dividend amounting to P=14,200,000 and P=10,000,000, respectively, on August 24, 2011 and October 26, 2011, respectively. On May 15, 2012 and on May 10, 2012, the SEC approved the Company’s application for the conversion of its DFSS to capital stock and the issuance of stock dividend amounting to P=14,200,000 and P=10,000,000, respectively.
In 2012, the Company issued additional 242,000 and 84,159 shares, respectively to its existing stockholders at P=100 per share for a total of P=24,200,000 and P=8,415,900, respectively.

- 31 -
*SGVFS001357*
15. Net Insurance Earned Premiums
Gross earned premiums on insurance contracts and reinsurers’ share of gross earned premiums on insurance contracts consist of the following:
2012 2011 Gross premiums on insurance contracts: Direct insurance P=130,427,712 P=112,801,808 Assumed reinsurance 2,390,093 3,417,977 Total gross premiums on insurance contracts (Note 11) 132,817,805 116,219,785 Gross change in provision for unearned premiums (Note 11) (10,410,997) 3,434,374 Total gross earned premiums on insurance
contracts 122,406,808 119,654,159 Reinsurers’ share of gross premiums on insurance
contracts: Direct insurance 61,555,615 57,998,422 Assumed reinsurance 1,128,009 815,216 Total reinsurers’ share of gross premiums on
insurance contracts (Note 11) 62,683,624 58,813,638 Reinsurers’ share of gross change in provision for
unearned premiums (Note 11) (3,104,910) 6,126,388 Total reinsurers’ share of gross earned premiums on insurance contracts 59,578,714 64,940,026 Total net insurance earned premiums P=62,828,094 P=54,714,133
16. Investment and Other Income – net
This account consists of:
2012 2011 Interest income: HTM investments (Note 6) P=2,164,269 P=1,071,454 Short-term investments 337,568 304,697 Mortgage loans – 74,100 Cash and cash equivalents 164,736 56,867 Gain on sale of: AFS financial assets (Note 6) 1,731,220 1,496,143 Investment property (Note 9) – 1,577,210 Interest on loans to employees 1,115,108 469,233 Dividend income 429,504 462,198 Impairment loss on AFS financial assets (Note 6) (781,276) (442,464) P=5,161,129 P=5,069,438
Other underwriting income pertains to income from various sources including its share in insurance pool.

- 32 -
*SGVFS001357*
17. Net Insurance Benefits and Claims
Gross insurance contract benefits and claims paid consist of the following:
2012 2011 Insurance contract benefits and claims paid: Direct insurance P=49,143,574 P=50,336,755 Assumed reinsurance 2,821,790 675,145 Total insurance contract benefits and
claims paid (Note 11)
P=51,965,364 P=51,011,900
Reinsurers’ share of gross insurance contract benefits and claims paid consist of the following:
2012 2011 Reinsurers’ share of insurance contract benefits and claims paid: Direct insurance P=31,072,289 P=30,896,475 Assumed reinsurance 2,301,138 1,532,948 Total reinsurers’ share of insurance contract benefits and claims paid (Note 11) P=33,373,427 P=32,429,423
Gross change in insurance contract liabilities:
2012 2011 Change in provision for claims reported: Direct insurance P=34,114,001 (P=6,834,571) Assumed reinsurance 3,842,187 703,352 Change in provision for IBNR 277,390 (149,502) Total gross change in insurance contract liabilities
(Note 11) P=38,233,578 (P=6,280,721)
Reinsurers’ share of gross change in insurance contract liabilities:
2012 2011 Reinsurers’ share of gross insurance contract liabilities: Direct insurance P=32,130,933 (P=7,504,935) Reinsurers’ share of change in provision for IBNR 17,131 3,757 Total reinsurers’ share of gross change in insurance
contract liabilities (Note 11) P=32,148,064 (P=7,501,178)

- 33 -
*SGVFS001357*
18. Operating Expenses
This account consists of:
2012 2011 Salaries and employee benefits (Note 19) P=29,639,078 P=24,004,317 Rent (Note 24) 4,291,226 3,960,876 Depreciation and amortization (Note 10) 2,444,348 2,418,650 Directors’ fees 1,245,000 1,620,000 Transportation and travel 1,182,209 1,017,779 Professional and technical development 766,487 694,255 Taxes, licenses and fees 735,701 814,865 Entertainment, amusement and recreation 686,168 690,915 Printing and office supplies 680,844 678,184 Communication and postage 677,321 853,275 Janitorial and messengerial services 552,485 541,189 Professional fees 511,194 681,560 Light and water 488,633 482,457 Repairs and maintenance 457,331 422,584 Advertising 262,638 215,882 Association dues 148,977 186,510 Donation and contributions 126,850 112,350 Insurance 20,237 38,627 Fringe benefit 17,412 17,412 Miscellaneous 1,180,106 1,914,846 P=46,114,245 P=41,366,533
19. Retirement Plan
The Company has a funded, tax qualified, noncontributory, defined benefit pension plan covering substantially all of its regular employees. The benefits are based on years of service and compensation on the last year of employment.
The components of pension expense in the “Salaries and employee benefits” under operating expenses in the statements of comprehensive income follow:
2012 2011 Current service cost P=1,744,970 P=957,245 Interest cost 1,138,922 1,355,071 Expected return on plan assets (958,734) (834,071) Actuarial loss recognized 10,331 – P=1,935,489 P=1,478,245

- 34 -
*SGVFS001357*
The components of net pension liability in the statements of financial position are as follow:
2012 2011 Present value of obligation P=20,592,314 P=20,265,510 Fair value of plan assets 18,451,456 15,978,907 2,140,858 4,286,603 Unrecognized net actuarial loss (56,266) (2,212,500) P=2,084,592 P=2,074,103
Changes in the present value of the defined benefit obligation follow:
2012 2011 At beginning of year P=20,265,510 P=15,106,701 Current service cost 1,744,970 957,245 Interest cost 1,138,922 1,355,071 Benefits paid (430,389) (382,332) Actuarial loss (gain) on obligation (2,126,699) 3,228,825 At end of year P=20,592,314 P=20,265,510
Changes in the fair value of plan assets are as follow:
2012 2011 At beginning of year P=15,978,907 P=13,345,129 Expected return 958,734 834,071 Contributions 1,925,000 1,800,000 Benefits paid (430,389) (382,332) Actuarial gain on plan assets 19,204 382,039 At end of year P=18,451,456 P=15,978,907
Actual return on plan assets P=977,938 P=1,216,110
Changes in unrecognized net actuarial gain (loss) follow:
2012 2011 At beginning of year (P=2,212,500) P=634,286 Actuarial gain (loss) on obligation 2,126,699 (3,228,825) Actuarial gains on plan assets 19,204 382,039 Actuarial loss recognized 10,331 – At end of year (P=56,266) (P=2,212,500)
The principal assumptions used to determine pension benefits for the Company follow:
2012 2011 Discount rate 5.62% 5.62% Salary rate increase 5.00% 5.00% Expected return on plan assets 6.00% 6.00%

- 35 -
*SGVFS001357*
Amounts for the current and previous years follow:
2012 2011 2010 2009 2008 Defined benefit obligation P=20,592,314 P=20,265,510 P=15,106,701 P=14,425,890 P=13,197,870 Plan assets 18,451,456 15,978,907 13,345,129 11,510,444 10,021,583 Deficit 2,140,858 4,286,603 1,761,572 2,915,446 3,176,287
Experience adjustment on plan assets amounted to P=19,204 and P=382,039 in 2012 and 2011, respectively, while, experience adjustment on plan liabilities amounted to P=2,168,596 and P=3,025,774 in 2012 and 2011, respectively.
20. Income Tax
The components of the Company’s net deferred tax liability consist of the tax effects of the following:
2012 2011 Deferred tax assets on: Excess of provision for unearned premiums per
books over tax basis P=2,267,664 P=1,240,882 Deferred reinsurance commissions 1,789,219 1,651,260 Allowance for doubtful accounts 63,835 63,835 Accrued retirement 625,378 622,231 Provision for IBNR losses 228,744 150,667 Unamortized pension cost 48,608 – Total deferred tax assets 5,023,448 3,728,875 Deferred tax liabilities on: Deferred acquisition costs 4,114,381 3,441,968 Excess of deferred reinsurance premiums
per books over tax basis 1,014,396 581,234 Total deferred tax liabilities 5,128,777 4,023,202 Net deferred tax assets (liabilities) (P=105,329) (P=294,327)
The reconciliation of statutory income tax rate to effective income tax rate follows:
2012 2011 Tax at statutory income tax rate 30.00% 30.00% Add (deduct) tax effects of: Change in unrecognized deferred tax asset on NOLCO and MCIT (22.89) 16.85 Income subjected to final taxes (12.96) (27.25) Dividend income (2.13) (3.55) Nondeductible expenses 3.87 0.16 Expired NOLCO 13.10 (10.78) Effective income tax 8.99% 5.36%
- 36 -
*SGVFS001357*
As of December 31, 2012, the unexpired excess of MCIT over the normal tax which can be claimed as a deduction against income tax due, are as follows:
Year Incurred MCIT Expiry Date 2012 P=200,644 December 31, 2015 2011 211,870 December 31, 2014 2010 214,409 December 31, 2013 P=626,923
As of December 31, 2012, details of NOLCO which can be claimed as deduction from future taxable income are as follows:
Year Incurred NOLCO Expiry Year 2012 P=– December 31, 2015 2011 75,000 December 31, 2014 2010 1,190,055 December 31, 2013 P=1,265,055
The movements in NOLCO are as follows:
2012 2011 At January 1 P=15,297,480 P=15,222,480 Addition – 75,000 Applied (2,647,322) – Expired (11,385,103) – P=1,265,055 P=15,297,480
The movements in MCIT are as follows:
2012 2011 At January 1 P=685,277 P=473,407 Addition 200,644 211,870 Expired (258,998) – P=626,923 P=685,277
Deferred tax assets on NOLCO amounting to P=379,517 and P=4,589,244 as of December 31, 2012 and 2011, respectively, and MCIT amounting to P=188,077 and P=205,583 as of December 31, 2012 and 2011, respectively, have not been recognized since management believes that the benefits will not be realized prior to their expiry dates.
21. Management of Capital, Insurance and Financial Risks
Governance Framework The primary objective of the Company’s risk and financial management framework is to ensure that the risks related to the Company are managed through a systematic and consistent risk management process. The Company recognizes the critical importance of having efficient and effective risk management systems in place.

- 37 -
*SGVFS001357*
The Company is guided by its standard operating procedures and internal control procedures designed to ensure attainment of the Company’s objectives. Currently, the Company has no separate risk management policies since these are incorporated within the standard operating and internal control procedures. Also, risk management includes the Company entering into treaty agreements, which more or less limits the risk acceptance.
Regulatory Framework Regulators are interested in protecting the rights of the policyholders and maintain close vigil to ensure that the Company is satisfactorily managing affairs for their benefit. At the same time, the regulators are also interested in ensuring that the Company maintains appropriate solvency position to meet liabilities arising from claims and that the risk levels are at acceptable levels.
The operations of the Company are subject to the regulatory requirements of the IC. Such regulations not only prescribe approval and monitoring of activities but also impose certain restrictive provisions (e.g., margin of solvency to minimize the risk of default and insolvency on the part of the insurance companies to meet the unforeseen liabilities as these arise, fixed capitalization requirements, risk-based capital (RBC) requirements).
Capital Management Framework The Company maintains a certain level of capital to ensure sufficient solvency margins and to adequately protect the policyholders. The level of capital maintained is usually higher than the minimum capital requirements set by the regulators as imposed under Department of Finance Order (DO) 27-06 and the amount computed under the RBC Model.
The Company reviews the capital requirements through monthly computation of the Margin of Solvency (MOS) and the RBC which are regularly communicated to the major shareholders. With this procedure, shareholders are forewarned in anticipation of the IC requirements of additional capital infusion. Shareholders are well updated with these externally imposed capital requirements since these are being discussed during annual BOD meetings. They have shown their commitment to comply with this regulation, same as prior years when they willingly infused additional cash as the need arose.
MOS Under the Insurance Code (the Code), a nonlife insurance company doing business in the Philippines shall maintain, at all times, an MOS equal to P=500,000 or 10% of the total amount of its net premiums written during the preceding year, whichever is higher. The MOS shall be the excess of the value of its admitted assets (as defined under the same Code), exclusive of its paid-up capital, over the amount of its liabilities, unearned premiums, and reinsurance reserves. Net provision for unearned premiums as of December 31, 2012 and 2011, determined in accordance with the same Code for purposes of MOS, amounted to P=27,768,003 and P=22,440,651, respectively. In the accompanying financial statements, the net provision for unearned premiums as of December 31, 2012 amounted to P=31,945,562, computed as provision for unearned premiums of P=60,223,384 less deferred reinsurance premiums of P=28,277,822, while the net provision for unearned premiums as of December 31, 2011 amounted to P=24,639,475, computed as provision for unearned premiums of P=49,812,387 less deferred reinsurance premiums of P=25,172,912 (see Note 11).

- 38 -
*SGVFS001357*
The estimated amounts of non-admitted assets as of December 31, 2012 and 2011, as defined under the Code, which are included in the accompanying statements of financial position, follow:
2012 2011 Premiums in course of collection (direct) P=1,590,028 P=4,044,593 Deferred acquisition costs 13,714,604 11,064,604 Property and equipment - net 3,634,501 3,159,802 Accounts receivable 4,280,441 4,293,129 Other assets 6,684,534 4,949,221 P=29,904,108 P=27,511,349
As of December 31, 2012 and 2011, the Company’s MOS, based on its estimate, amounted to P=28,058,002 and P=21,447,894, respectively, for which the Company is in excess by P=22,317,387 and P=16,076,187 of the required MOS of P=5,371,707 and P=5,740,615, respectively.
The final amount of the MOS can only be determined after the accounts of the Company have been examined by the IC, particularly with respect to the determination of admitted and non-admitted assets.
Fixed Capitalization Requirements DO 27-06 provides for the capitalization requirements for life, nonlife, and reinsurance. Under this order, the minimum paid-up capital requirements vary depending on the minimum statutory net worth of the insurance company. The statutory net worth shall include the Company’s paid-up capital, capital in excess of par value, contingency surplus, retained earnings and revaluation increments as may be approved by the IC. The minimum paid-up capital is pegged at 50% of the minimum statutory net worth.
On October 29, 2008, the IC issued Circular Letter No. 26-2008, which recalls that in view of the compliance of insurance companies with requirements of Insurance Memorandum Circular (IMC) No. 10-2006, the scheduled increases due December 31, 2008 have been deferred for a year. Hence, the IMC reiterates that by December 31, 2008, insurance companies should comply with the increase previously scheduled for December 31, 2007. Based on this Circular Letter, the required statutory net worth and minimum paid-up capital for the Company amounted to P=500,000,000 and P=250,000,000 as of December 31, 2012 and P=350,000,000 and P=175,000,000 as of December 31, 2011. The Company has complied with the minimum statutory net worth and paid-up capital requirements as of December 31, 2012 and 2011 based on the Company’s own calculation. As of December 31, 2012 and 2011, the Company’s estimated statutory net worth amounted to P=295,388,633 and P=277,795,435, respectively.
On November 28, 2012, the Company’s BOD already approved the increase in the Company’s paid up capital from P=175.00 million to P=250.00 million. On February 5, 2013, the Company has already filed an application with the Insurance Commission (IC) to allow the Company’s stockholders to contribute real property as payment of their subscriptions amounting to P=95.50 million.
Unimpaired capital requirement IMC No. 22-2008 provides that for purposes of determining compliance with the law, rules and regulations requiring that the paid-up capital should remain intact and unimpaired at all times, the statement of financial position should show that the net worth or stockholders’ equity is at least equal to the actual paid-up capital. The Company has complied with the unimpaired capital requirement.
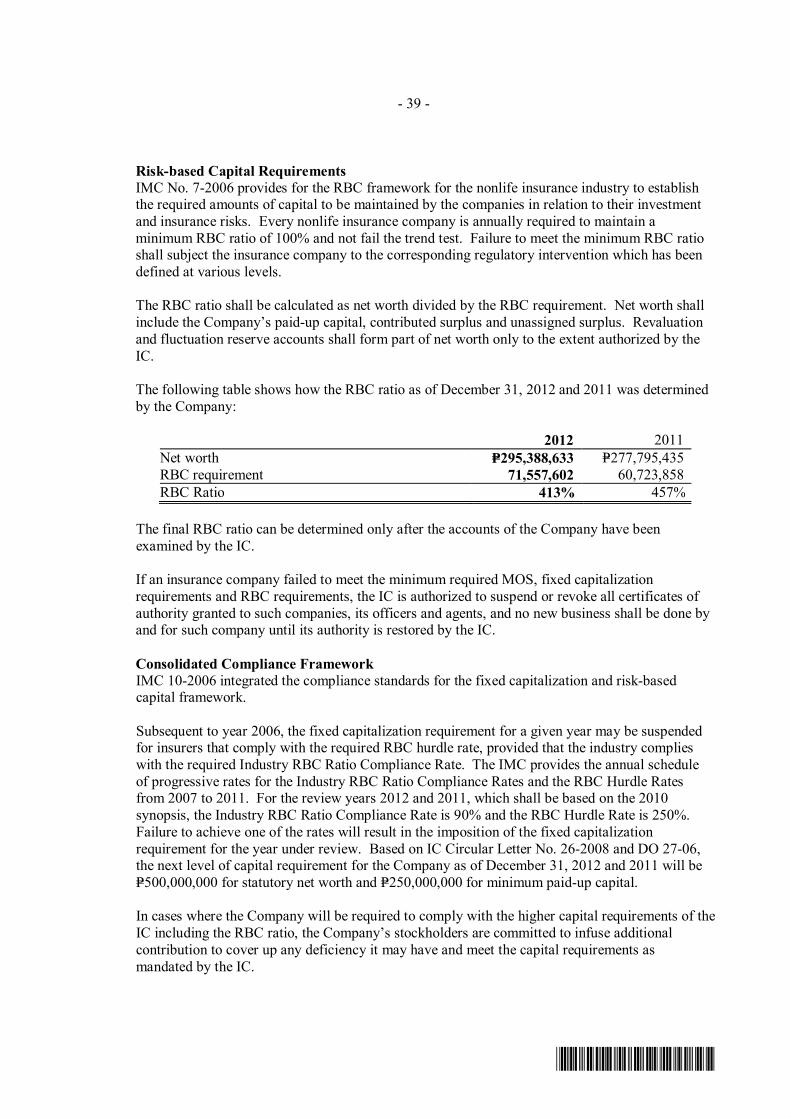
- 39 -
*SGVFS001357*
Risk-based Capital Requirements IMC No. 7-2006 provides for the RBC framework for the nonlife insurance industry to establish the required amounts of capital to be maintained by the companies in relation to their investment and insurance risks. Every nonlife insurance company is annually required to maintain a minimum RBC ratio of 100% and not fail the trend test. Failure to meet the minimum RBC ratio shall subject the insurance company to the corresponding regulatory intervention which has been defined at various levels.
The RBC ratio shall be calculated as net worth divided by the RBC requirement. Net worth shall include the Company’s paid-up capital, contributed surplus and unassigned surplus. Revaluation and fluctuation reserve accounts shall form part of net worth only to the extent authorized by the IC.
The following table shows how the RBC ratio as of December 31, 2012 and 2011 was determined by the Company:
2012 2011 Net worth P=295,388,633 P=277,795,435 RBC requirement 71,557,602 60,723,858 RBC Ratio 413% 457%
The final RBC ratio can be determined only after the accounts of the Company have been examined by the IC.
If an insurance company failed to meet the minimum required MOS, fixed capitalization requirements and RBC requirements, the IC is authorized to suspend or revoke all certificates of authority granted to such companies, its officers and agents, and no new business shall be done by and for such company until its authority is restored by the IC.
Consolidated Compliance Framework IMC 10-2006 integrated the compliance standards for the fixed capitalization and risk-based capital framework.
Subsequent to year 2006, the fixed capitalization requirement for a given year may be suspended for insurers that comply with the required RBC hurdle rate, provided that the industry complies with the required Industry RBC Ratio Compliance Rate. The IMC provides the annual schedule of progressive rates for the Industry RBC Ratio Compliance Rates and the RBC Hurdle Rates from 2007 to 2011. For the review years 2012 and 2011, which shall be based on the 2010 synopsis, the Industry RBC Ratio Compliance Rate is 90% and the RBC Hurdle Rate is 250%. Failure to achieve one of the rates will result in the imposition of the fixed capitalization requirement for the year under review. Based on IC Circular Letter No. 26-2008 and DO 27-06, the next level of capital requirement for the Company as of December 31, 2012 and 2011 will be P=500,000,000 for statutory net worth and P=250,000,000 for minimum paid-up capital.
In cases where the Company will be required to comply with the higher capital requirements of the IC including the RBC ratio, the Company’s stockholders are committed to infuse additional contribution to cover up any deficiency it may have and meet the capital requirements as mandated by the IC.
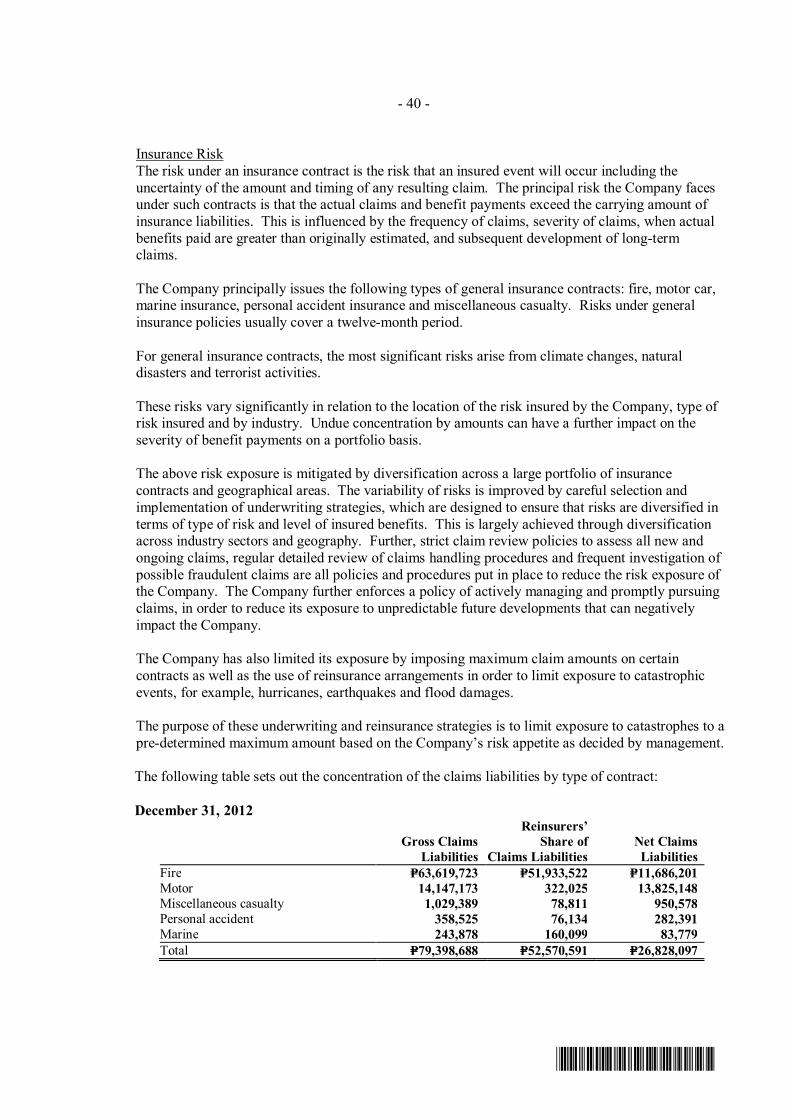
- 40 -
*SGVFS001357*
Insurance Risk The risk under an insurance contract is the risk that an insured event will occur including the uncertainty of the amount and timing of any resulting claim. The principal risk the Company faces under such contracts is that the actual claims and benefit payments exceed the carrying amount of insurance liabilities. This is influenced by the frequency of claims, severity of claims, when actual benefits paid are greater than originally estimated, and subsequent development of long-term claims.
The Company principally issues the following types of general insurance contracts: fire, motor car, marine insurance, personal accident insurance and miscellaneous casualty. Risks under general insurance policies usually cover a twelve-month period.
For general insurance contracts, the most significant risks arise from climate changes, natural disasters and terrorist activities.
These risks vary significantly in relation to the location of the risk insured by the Company, type of risk insured and by industry. Undue concentration by amounts can have a further impact on the severity of benefit payments on a portfolio basis.
The above risk exposure is mitigated by diversification across a large portfolio of insurance contracts and geographical areas. The variability of risks is improved by careful selection and implementation of underwriting strategies, which are designed to ensure that risks are diversified in terms of type of risk and level of insured benefits. This is largely achieved through diversification across industry sectors and geography. Further, strict claim review policies to assess all new and ongoing claims, regular detailed review of claims handling procedures and frequent investigation of possible fraudulent claims are all policies and procedures put in place to reduce the risk exposure of the Company. The Company further enforces a policy of actively managing and promptly pursuing claims, in order to reduce its exposure to unpredictable future developments that can negatively impact the Company.
The Company has also limited its exposure by imposing maximum claim amounts on certain contracts as well as the use of reinsurance arrangements in order to limit exposure to catastrophic events, for example, hurricanes, earthquakes and flood damages.
The purpose of these underwriting and reinsurance strategies is to limit exposure to catastrophes to a pre-determined maximum amount based on the Company’s risk appetite as decided by management.
The following table sets out the concentration of the claims liabilities by type of contract:
December 31, 2012
Gross Claims
Liabilities
Reinsurers’ Share of
Claims Liabilities
Net Claims Liabilities
Fire P=63,619,723 P=51,933,522 P=11,686,201 Motor 14,147,173 322,025 13,825,148 Miscellaneous casualty 1,029,389 78,811 950,578 Personal accident 358,525 76,134 282,391 Marine 243,878 160,099 83,779 Total P=79,398,688 P=52,570,591 P=26,828,097
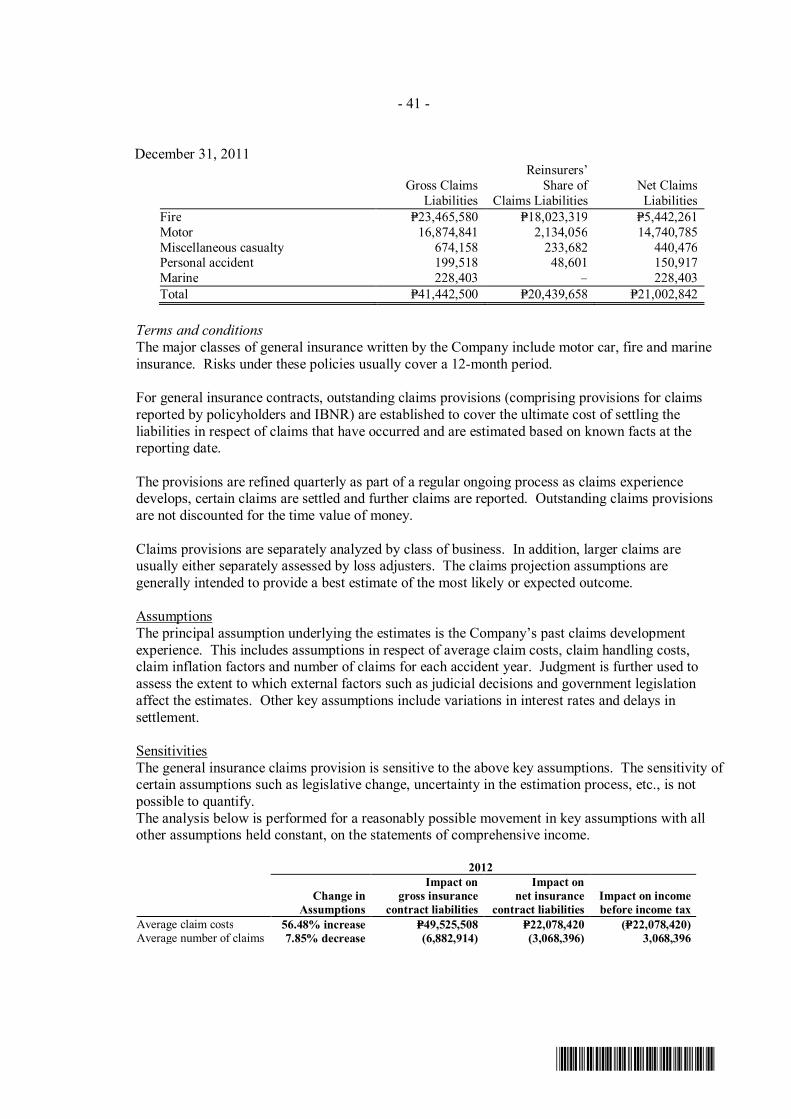
- 41 -
*SGVFS001357*
December 31, 2011
Gross Claims
Liabilities
Reinsurers’ Share of
Claims Liabilities Net Claims Liabilities
Fire P=23,465,580 P=18,023,319 P=5,442,261 Motor 16,874,841 2,134,056 14,740,785 Miscellaneous casualty 674,158 233,682 440,476 Personal accident 199,518 48,601 150,917 Marine 228,403 – 228,403 Total P=41,442,500 P=20,439,658 P=21,002,842
Terms and conditions The major classes of general insurance written by the Company include motor car, fire and marine insurance. Risks under these policies usually cover a 12-month period.
For general insurance contracts, outstanding claims provisions (comprising provisions for claims reported by policyholders and IBNR) are established to cover the ultimate cost of settling the liabilities in respect of claims that have occurred and are estimated based on known facts at the reporting date.
The provisions are refined quarterly as part of a regular ongoing process as claims experience develops, certain claims are settled and further claims are reported. Outstanding claims provisions are not discounted for the time value of money.
Claims provisions are separately analyzed by class of business. In addition, larger claims are usually either separately assessed by loss adjusters. The claims projection assumptions are generally intended to provide a best estimate of the most likely or expected outcome.
Assumptions The principal assumption underlying the estimates is the Company’s past claims development experience. This includes assumptions in respect of average claim costs, claim handling costs, claim inflation factors and number of claims for each accident year. Judgment is further used to assess the extent to which external factors such as judicial decisions and government legislation affect the estimates. Other key assumptions include variations in interest rates and delays in settlement.
Sensitivities The general insurance claims provision is sensitive to the above key assumptions. The sensitivity of certain assumptions such as legislative change, uncertainty in the estimation process, etc., is not possible to quantify. The analysis below is performed for a reasonably possible movement in key assumptions with all other assumptions held constant, on the statements of comprehensive income.
2012
Change in
Assumptions
Impact on gross insurance
contract liabilities
Impact on net insurance
contract liabilities Impact on income before income tax
Average claim costs 56.48% increase P=49,525,508 P=22,078,420 (P=22,078,420) Average number of claims 7.85% decrease (6,882,914) (3,068,396) 3,068,396
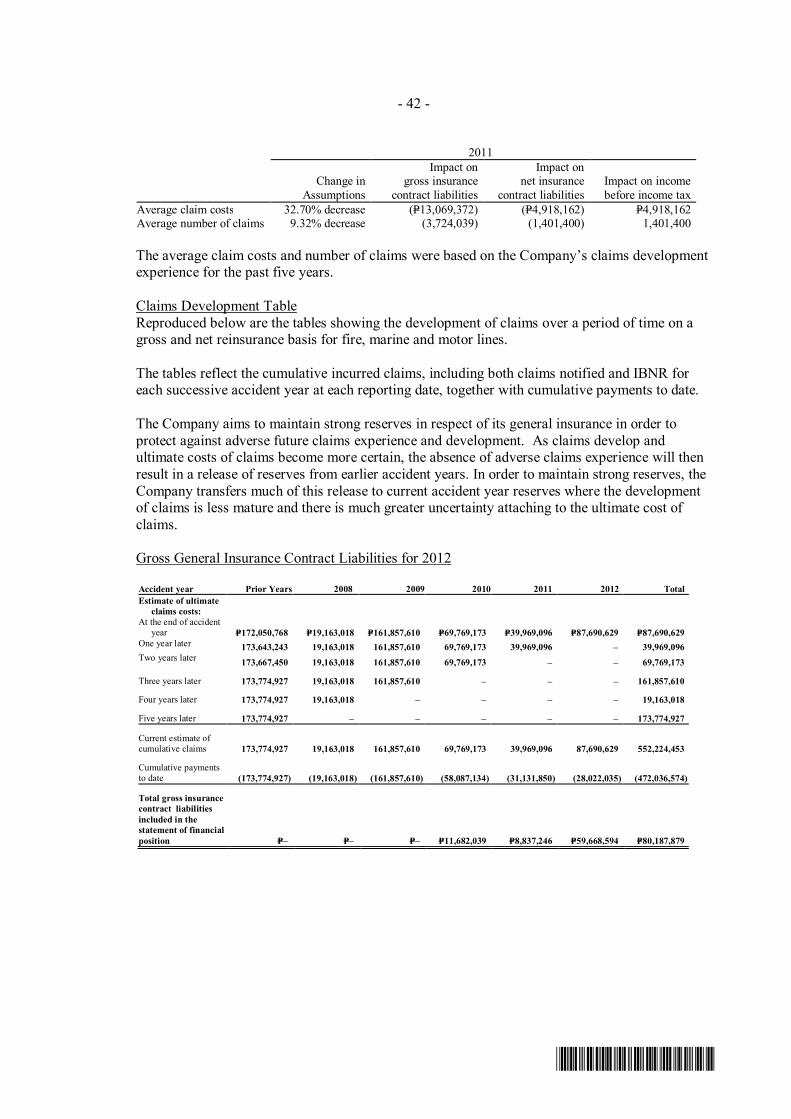
- 42 -
*SGVFS001357*
2011
Change in
Assumptions
Impact on gross insurance
contract liabilities
Impact on net insurance
contract liabilities Impact on income before income tax
Average claim costs 32.70% decrease (P=13,069,372) (P=4,918,162) P=4,918,162 Average number of claims 9.32% decrease (3,724,039) (1,401,400) 1,401,400
The average claim costs and number of claims were based on the Company’s claims development experience for the past five years.
Claims Development Table Reproduced below are the tables showing the development of claims over a period of time on a gross and net reinsurance basis for fire, marine and motor lines.
The tables reflect the cumulative incurred claims, including both claims notified and IBNR for each successive accident year at each reporting date, together with cumulative payments to date.
The Company aims to maintain strong reserves in respect of its general insurance in order to protect against adverse future claims experience and development. As claims develop and ultimate costs of claims become more certain, the absence of adverse claims experience will then result in a release of reserves from earlier accident years. In order to maintain strong reserves, the Company transfers much of this release to current accident year reserves where the development of claims is less mature and there is much greater uncertainty attaching to the ultimate cost of claims.
Gross General Insurance Contract Liabilities for 2012
Accident year Prior Years 2008 2009 2010 2011 2012 Total Estimate of ultimate
claims costs:
At the end of accident year P=172,050,768 P=19,163,018 P=161,857,610 P=69,769,173 P=39,969,096 P=87,690,629 P=87,690,629
One year later 173,643,243 19,163,018 161,857,610 69,769,173 39,969,096 – 39,969,096 Two years later 173,667,450 19,163,018 161,857,610 69,769,173 – – 69,769,173
Three years later 173,774,927 19,163,018 161,857,610 – – – 161,857,610
Four years later 173,774,927 19,163,018 – – – – 19,163,018
Five years later 173,774,927 – – – – – 173,774,927
Current estimate of cumulative claims 173,774,927 19,163,018 161,857,610 69,769,173 39,969,096 87,690,629 552,224,453
Cumulative payments to date (173,774,927) (19,163,018) (161,857,610) (58,087,134) (31,131,850) (28,022,035) (472,036,574)
Total gross insurance contract liabilities included in the statement of financial position P=– P=– P=– P=11,682,039 P=8,837,246 P=59,668,594 P=80,187,879

- 43 -
*SGVFS001357*
Net General Insurance Contract Liabilities for 2012
Accident year Prior Years 2008 2009 2010 2011 2012 Total Estimate of ultimate
claims costs:
At the end of accident year P=61,017,299 P=6,324,771 P=54,518,548 P=49,789,140 P=15,040,851 P=39,092,392 P= 39,092,392
One year later 62,125,257 6,324,771 54,518,548 49,789,140 15,040,851 – 15,040,851 Two years later 62,110,833 6,324,771 54,518,548 49,789,140 – – 49,789,140 Three years later 62,182,764 6,324,771 54,518,548 – – – 54,518,548 Four years later 62,182,764 6,324,771 – – – – 6,324,771 Five years later 62,182,764 – – – – – 62,182,764 Current estimate of
cumulative claims 62,182,764 6,324,771 54,518,548 49,789,140 15,040,851 39,092,392 226,948,466 Cumulative payments
to date (62,182,764) (6,324,771) (54,518,548) (48,531,671) (13,329,681) (14,470,453) (199,357,888) Total net insurance
contract liabilities included in the statement of financial position P=– P=– P=– P=1,257,469 P=1,711,170 P=24,621,939 P=27,590,578
Financial Instruments Due to the short-term nature of cash and cash equivalents, insurance receivables, loans and other receivables, insurance contract liabilities, insurance payables, and accounts payable and other liabilities, their carrying values reasonably approximate fair values at year-end.
The fair values of AFS financial assets that are actively traded in organized financial markets are determined by reference to quoted market bid prices, at the close of business on the reporting date or the last trading day as applicable. Unquoted AFS financial instruments are carried at cost, less any allowance for impairment loss. The fair values of HTM financial assets were determined using quoted market prices.
Due to long term nature of the HTM investments, its carrying value differs from its fair value. The fair value of HTM investments is based on the quoted market prices at the end the reporting date. The fair value of HTM investments amounted to P=58.11 million and P=34.16 million as of December 31, 2012 and 2011, respectively (see Note 6).
Fair Value Hierarchy The Company considers its quoted AFS financial assets amounting to P=26.70 million and P=20.76 million as of December 31, 2012 and 2011, respectively, under Level 1 classification. There are no AFS financial assets which have been classified under the Level 2 and 3 categories. During the reporting period ended December 31, 2012 and 2011, there were no transfers between Level 1 and Level 2 fair value measurements and no transfers into and out of Level 3 fair value measurement (see Note 6).
Financial Risk and Management The Company is exposed to financial risk through its financial assets, financial liabilities and insurance liabilities. In particular, the key financial risk that the Company is exposed to is that the proceeds from its financial assets are not sufficient to fund the obligations arising from its insurance contracts. The most important components of this financial risk are credit risk, liquidity risk and market risk.
These risks arise from open positions in interest rate, currency and equity products, all of which are exposed to general and specific market movements.

- 44 -
*SGVFS001357*
Credit risk Credit risk is the risk that one party to a financial instrument will fail to discharge an obligation and cause the other party to incur financial loss.
Prior to extending credit, the Company manages its credit risk by assessing credit quality of its counterparty. The Company also manages its credit risk exposure through credit analysis. This is a process of assessing the credit quality of a counterparty, which is a process that includes judgment.
Credit risk limit is also used to manage credit exposure which specifies maximum credit exposure for each intermediary depending on the size of its portfolio and its ability to meet its obligation based on past experience.
The following table provides information regarding the credit risk exposure of the Company as of December 31, 2012 and 2011:
2012 2011 Cash and cash equivalents (excluding cash on hand) P=23,265,084 P=12,318,402 Insurance receivables: Premiums receivable 53,311,453 48,243,724 Reinsurance recoverable on paid losses 22,583,540 35,022,761 Due from ceding companies 7,995,160 7,467,565 Funds held by ceding companies 1,059,191 1,106,919 HTM investments 53,359,182 45,518,316 Loans and receivables Receivables from employees 3,370,878 4,680,395 Accounts receivable 4,280,441 4,293,130 Mortgage loans – 1,126,650 Accrued interest income 720,204 169,612 Reinsurance assets 52,597,301 20,449,237 Total P=222,542,434 P=180,396,711
The table below provides information regarding the credit risk exposure of the Company by classifying assets according to the Company’s credit ratings of counterparties.
December 31, 2012 Neither past due nor impaired Past due
High Medium Low or impaired Total Cash and cash equivalents P=24,422,354 P=- P=- P=- P=24,422,354 Insurance receivables: Premiums receivable 33,875,218 17,180,341 665,866 1,590,028 53,311,453 Funds held by ceding companies – 1,059,191 – – 1,059,191 Reinsurance recoverable on paid losses 8,017,157 2,770,025 – 11,856,358 22,643,540 Due from ceding companies 4,477,290 519,685 – 2,998,185 7,995,160 HTM investments 53,359,182 – – – 53,359,182 Loans and receivables: Receivables from employees 3,370,878 – – – 3,370,878 Accounts receivable 4,280,441 – – – 4,280,441 Accrued interest income 720,204 – – – 720,204 P=132,522,724 P=21,529,242 P=665,866 P=16,444,571 P=171,162,403
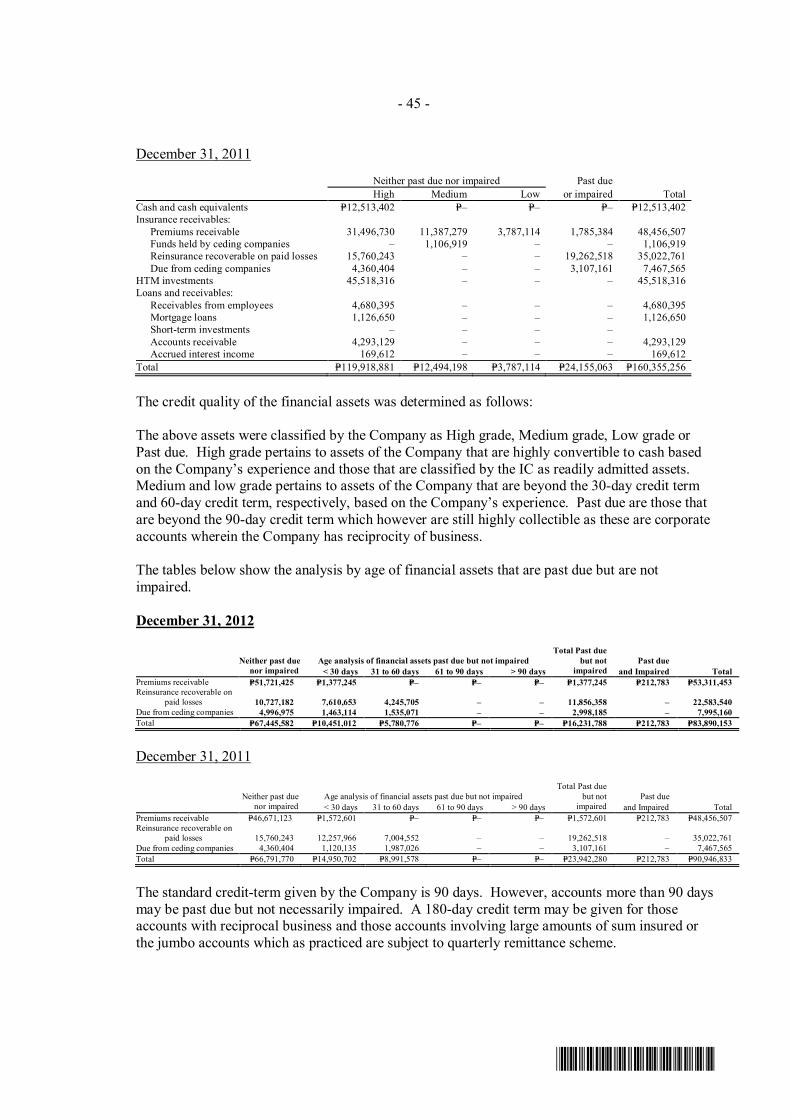
- 45 -
*SGVFS001357*
December 31, 2011 Neither past due nor impaired Past due High Medium Low or impaired Total Cash and cash equivalents P=12,513,402 P=– P=– P=– P=12,513,402 Insurance receivables: Premiums receivable 31,496,730 11,387,279 3,787,114 1,785,384 48,456,507 Funds held by ceding companies – 1,106,919 – – 1,106,919 Reinsurance recoverable on paid losses 15,760,243 – – 19,262,518 35,022,761 Due from ceding companies 4,360,404 – – 3,107,161 7,467,565 HTM investments 45,518,316 – – – 45,518,316 Loans and receivables: Receivables from employees 4,680,395 – – – 4,680,395 Mortgage loans 1,126,650 – – – 1,126,650 Short-term investments – – – – Accounts receivable 4,293,129 – – – 4,293,129 Accrued interest income 169,612 – – – 169,612 Total P=119,918,881 P=12,494,198 P=3,787,114 P=24,155,063 P=160,355,256
The credit quality of the financial assets was determined as follows:
The above assets were classified by the Company as High grade, Medium grade, Low grade or Past due. High grade pertains to assets of the Company that are highly convertible to cash based on the Company’s experience and those that are classified by the IC as readily admitted assets. Medium and low grade pertains to assets of the Company that are beyond the 30-day credit term and 60-day credit term, respectively, based on the Company’s experience. Past due are those that are beyond the 90-day credit term which however are still highly collectible as these are corporate accounts wherein the Company has reciprocity of business.
The tables below show the analysis by age of financial assets that are past due but are not impaired.
December 31, 2012
Neither past due nor impaired
Total Past due but not
impaired
Age analysis of financial assets past due but not impaired Past due < 30 days 31 to 60 days 61 to 90 days > 90 days and Impaired Total Premiums receivable P=51,721,425 P=1,377,245 P=– P=– P=– P=1,377,245 P=212,783 P=53,311,453 Reinsurance recoverable on
paid losses 10,727,182 7,610,653 4,245,705 – – 11,856,358 –
22,583,540 Due from ceding companies 4,996,975 1,463,114 1,535,071 – – 2,998,185 – 7,995,160 Total P=67,445,582 P=10,451,012 P=5,780,776 P=– P=– P=16,231,788 P=212,783 P=83,890,153
December 31, 2011
Neither past due nor impaired
Total Past due but not
impaired
Age analysis of financial assets past due but not impaired Past due < 30 days 31 to 60 days 61 to 90 days > 90 days and Impaired Total Premiums receivable P=46,671,123 P=1,572,601 P=– P=– P=– P=1,572,601 P=212,783 P=48,456,507 Reinsurance recoverable on
paid losses 15,760,243 12,257,966 7,004,552 – – 19,262,518 –
35,022,761 Due from ceding companies 4,360,404 1,120,135 1,987,026 – – 3,107,161 – 7,467,565 Total P=66,791,770 P=14,950,702 P=8,991,578 P=– P=– P=23,942,280 P=212,783 P=90,946,833
The standard credit-term given by the Company is 90 days. However, accounts more than 90 days may be past due but not necessarily impaired. A 180-day credit term may be given for those accounts with reciprocal business and those accounts involving large amounts of sum insured or the jumbo accounts which as practiced are subject to quarterly remittance scheme.
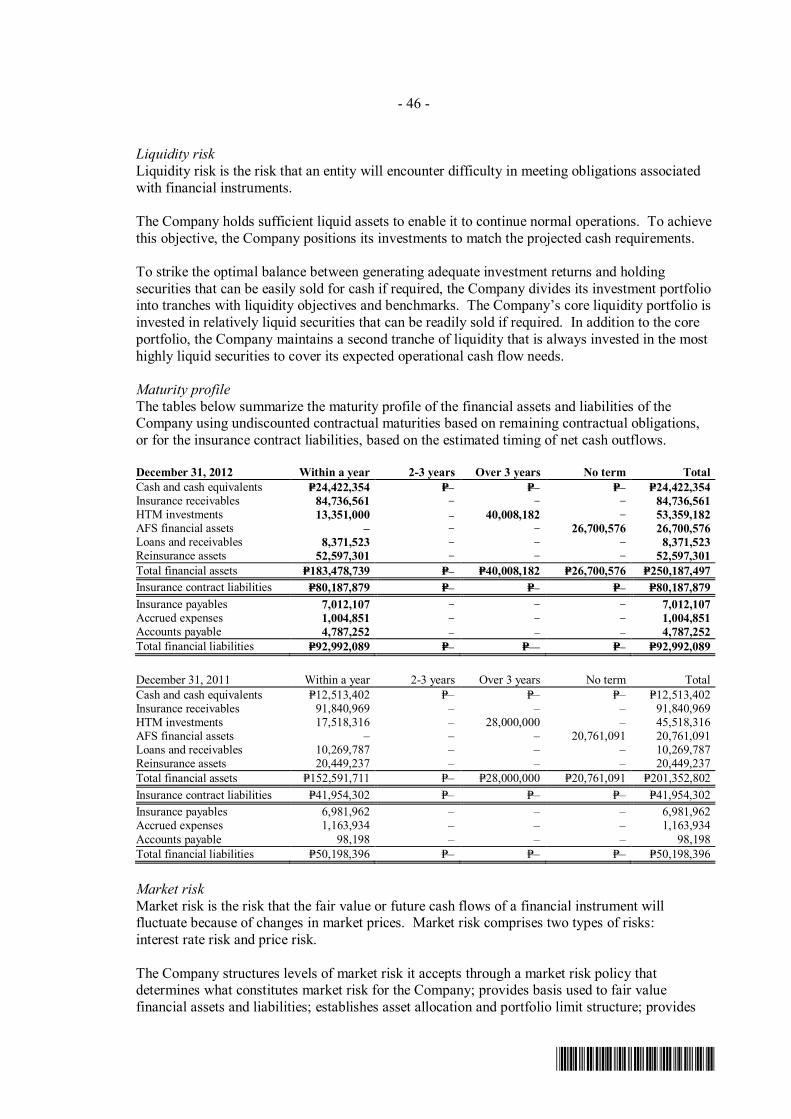
- 46 -
*SGVFS001357*
Liquidity risk Liquidity risk is the risk that an entity will encounter difficulty in meeting obligations associated with financial instruments.
The Company holds sufficient liquid assets to enable it to continue normal operations. To achieve this objective, the Company positions its investments to match the projected cash requirements.
To strike the optimal balance between generating adequate investment returns and holding securities that can be easily sold for cash if required, the Company divides its investment portfolio into tranches with liquidity objectives and benchmarks. The Company’s core liquidity portfolio is invested in relatively liquid securities that can be readily sold if required. In addition to the core portfolio, the Company maintains a second tranche of liquidity that is always invested in the most highly liquid securities to cover its expected operational cash flow needs.
Maturity profile The tables below summarize the maturity profile of the financial assets and liabilities of the Company using undiscounted contractual maturities based on remaining contractual obligations, or for the insurance contract liabilities, based on the estimated timing of net cash outflows. December 31, 2012 Within a year 2-3 years Over 3 years No term Total Cash and cash equivalents P=24,422,354 P=– P=– P=– P=24,422,354 Insurance receivables 84,736,561 – – – 84,736,561 HTM investments 13,351,000 – 40,008,182 – 53,359,182 AFS financial assets – – – 26,700,576 26,700,576 Loans and receivables 8,371,523 – – – 8,371,523 Reinsurance assets 52,597,301 – – – 52,597,301 Total financial assets P=183,478,739 P=– P=40,008,182 P=26,700,576 P=250,187,497 Insurance contract liabilities P=80,187,879 P=– P=– P=– P=80,187,879 Insurance payables 7,012,107 – – – 7,012,107 Accrued expenses 1,004,851 – – – 1,004,851 Accounts payable 4,787,252 – – – 4,787,252 Total financial liabilities P=92,992,089 P=– P=–– P=– P=92,992,089
December 31, 2011 Within a year 2-3 years Over 3 years No term Total Cash and cash equivalents P=12,513,402 P=– P=– P=– P=12,513,402 Insurance receivables 91,840,969 – – – 91,840,969 HTM investments 17,518,316 – 28,000,000 – 45,518,316 AFS financial assets – – – 20,761,091 20,761,091 Loans and receivables 10,269,787 – – – 10,269,787 Reinsurance assets 20,449,237 – – – 20,449,237 Total financial assets P=152,591,711 P=– P=28,000,000 P=20,761,091 P=201,352,802 Insurance contract liabilities P=41,954,302 P=– P=– P=– P=41,954,302 Insurance payables 6,981,962 – – – 6,981,962 Accrued expenses 1,163,934 – – – 1,163,934 Accounts payable 98,198 – – – 98,198 Total financial liabilities P=50,198,396 P=– P=– P=– P=50,198,396
Market risk Market risk is the risk that the fair value or future cash flows of a financial instrument will fluctuate because of changes in market prices. Market risk comprises two types of risks: interest rate risk and price risk.
The Company structures levels of market risk it accepts through a market risk policy that determines what constitutes market risk for the Company; provides basis used to fair value financial assets and liabilities; establishes asset allocation and portfolio limit structure; provides

- 47 -
*SGVFS001357*
diversification benchmarks by type of instrument; sets out the net exposure limits by each counterparty or group of counterparties and industry segments; establishes control over hedging activities; reports market risk exposures; monitors compliance with market risk policy; and reviews market risk policy for pertinence and changing environment.
Interest rate risk Interest rate risk is the risk that the value of a financial instrument will fluctuate because of changes in interest rates. The Company’s HTM investments bear fixed interest rates and therefore the Company is exposed to fair value interest rate risk but not to cash flow interest rate risk.
The following table shows the information relating to the Company’s financial instruments that are exposed to fair value interest rate risk presented by maturity profile.
Interest Maturity Rates Within a year 2-3 years Over 3 years Total HTM debt securities 2012 4.88%-7.38% P=13,351,000 P=– P=40,008,182 P=53,359,182 2011 5.00%-7.38% 17,518,316 – 28,000,000 45,518,316
The analysis below is performed for reasonably possible movements in interest rates, with all other variables held constant, showing the impact on revaluing HTM investments. The correlation of variables will have a significant effect in determining the ultimate impact on interest rate risk, but to demonstrate the impact due to changes in variables, variables had to be changed on an individual basis.
Change in variables Impact on income before tax December 31, 2012 December 31, 2011
+100 basis points (P=2,164,633) (P=874,152) -100 basis points P=2,339,519 P=930,333
There is no impact on the Company’s equity other than those already affecting net income.
In 2012 and 2011, the Company determined the reasonably possible change in interest rates using the daily percentage changes in weighted average yield rates of outstanding securities for the past two years.
Price risk The Company’s price risk exposure at year-end relates to financial assets and liabilities whose values will fluctuate as a result of changes in market prices, principally AFS equity securities.
Such investment securities are subject to price risk due to changes in market values of instruments arising either from factors specific to individual instruments or their issuers or factors affecting all instruments traded in the market.
The Company’s market risk policy requires it to manage such risks by setting and monitoring objectives and constraints on investments, diversification plan, limits on investment in each sector and market, and careful and planned use of derivative instruments.
The analysis below is performed for reasonably possible movements in Philippine Stock Exchange index (PSEi) with all other variables held constant, showing the impact on OCI (that reflects adjustments on changes in fair value of AFS financial assets).

- 48 -
*SGVFS001357*
December 31, 2012
Market Indices Change in Variable Impact on OCI PSEi +24.88% P=4,541,169 PSEi -24.88% (P=4,541,169)
December 31, 2011
Market Indices Change in Variable Impact on OCI PSEi +34.89% P=6,274,527 PSEi -34.89% (P=6,274,527)
The reasonably possible movements in PSEi are based on the Company’s stock composite index for the past three years.
22. Related Party Transactions Compensation of key management personnel by benefit type follows:
2012 2011 Short-term employee benefits P=7,230,000 P=7,058,500 Post-employment benefits 605,000 543,500 P=7,835,000 P=7,602,000
There are no agreements between the Company and any of its directors and key officers providing for benefits upon termination of employment, except for such benefits to which they may be entitled under the Company’s retirement plan.
Salary loans to key management personnel included under the caption “Receivables from employees” amounted to P=0.9 million and P=1.78 million as of December 31, 2012 and 2011 (see Note 6).
2012
Category Amount of transaction for the
whole year
Outstanding Balance
Terms Conditions
Receivable from employees P=1,350,000 P=900,000 Non-interest bearing; due and
demandableUnsecured, no
impairment 2011
Category Amount of transaction for the
whole year
Outstanding Balance
Terms Conditions
Receivable from employees P=1,100,000 P=1,775,000 Non-interest bearing; due and
demandableUnsecured, no
impairment
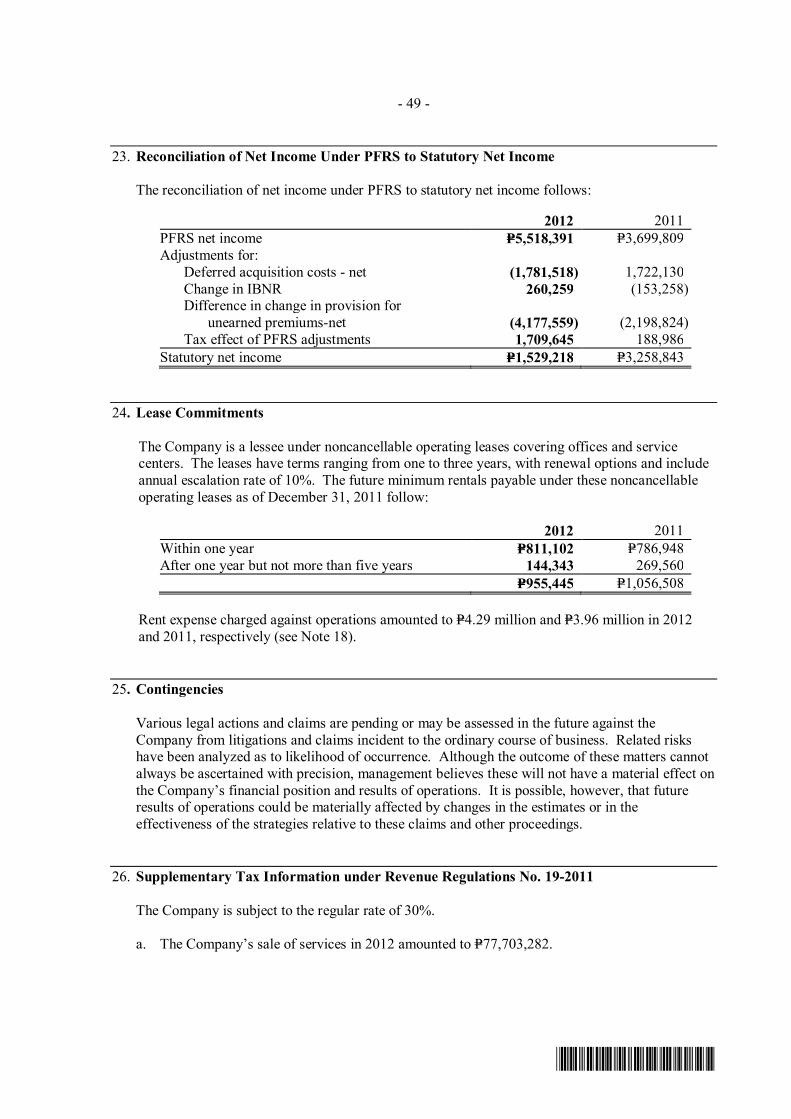
- 49 -
*SGVFS001357*
23. Reconciliation of Net Income Under PFRS to Statutory Net Income
The reconciliation of net income under PFRS to statutory net income follows:
2012 2011 PFRS net income P=5,518,391 P=3,699,809 Adjustments for: Deferred acquisition costs - net (1,781,518) 1,722,130 Change in IBNR 260,259 (153,258) Difference in change in provision for
unearned premiums-net (4,177,559) (2,198,824) Tax effect of PFRS adjustments 1,709,645 188,986 Statutory net income P=1,529,218 P=3,258,843
24. Lease Commitments
The Company is a lessee under noncancellable operating leases covering offices and service centers. The leases have terms ranging from one to three years, with renewal options and include annual escalation rate of 10%. The future minimum rentals payable under these noncancellable operating leases as of December 31, 2011 follow:
2012 2011 Within one year P=811,102 P=786,948 After one year but not more than five years 144,343 269,560 P=955,445 P=1,056,508
Rent expense charged against operations amounted to P=4.29 million and P=3.96 million in 2012 and 2011, respectively (see Note 18).
25. Contingencies
Various legal actions and claims are pending or may be assessed in the future against the Company from litigations and claims incident to the ordinary course of business. Related risks have been analyzed as to likelihood of occurrence. Although the outcome of these matters cannot always be ascertained with precision, management believes these will not have a material effect on the Company’s financial position and results of operations. It is possible, however, that future results of operations could be materially affected by changes in the estimates or in the effectiveness of the strategies relative to these claims and other proceedings.
26. Supplementary Tax Information under Revenue Regulations No. 19-2011
The Company is subject to the regular rate of 30%. a. The Company’s sale of services in 2012 amounted to P=77,703,282.

- 50 -
*SGVFS001357*
b. The Company’s cost of services in 2012 are as follows:
Regular Direct charges - Commission expense P=29,512,556 Direct charges - Salaries and wages 27,703,589 Direct charges - Net insurance benefits and claims 24,417,193 Direct charges - Rent 4,291,226 Direct charges - Depreciation 2,444,348 Direct charges - Transportation 1,182,209 Direct charges - Entertainment, amusement and recreation 686,168 Direct charges - Printing supplies 680,844 Direct charges - Communication 677,321 Direct charges - Light and water 488,633 Direct charges - Taxes and licenses 402,491 Direct charges - Other underwriting expense 283,900 Total cost of services P=92,770,478
c. The Company’s non-operating exempt and regular other income in 2012 are as follows:
Other underwriting income P=23,984,309 Other income 1,115,108 Total other taxable income not subject to final tax P=25,099,417
d. The itemized deductions of the Company in 2012 are as follows:
Regular NOLCO P=2,647,322 Pension cost 1,762,972 Directors’ fees 1,245,000 Professional and technical development 766,487 Janitorial and messengerial services 552,485 Professional fees 511,194 Repairs and maintenance 457,331 Taxes and licenses 333,210 Advertising 262,638 Association dues 148,977 Charitable contributions 126,850 Insurance 20,237 Fringe benefits 17,412 Miscellaneous 1,180,106 Total itemized deductions P=10,032,221
e. The taxes and licenses paid and claimed by the Company as itemized deductions in 2012
amounted to P=333,210.

- 51 -
*SGVFS001357*
27. Supplementary Tax Information under Revenue Regulations 15-2010
In compliance with the requirements set forth by RR 15-2010, hereunder are the information on taxes, duties and license fees paid or accrued during the taxable year.
VAT The Company is a VAT-registered with VAT output tax declaration of P=19,015,172 for the year based on the amount reflected in the Net premiums earned of P=158,459,767.
The Company has no zero-rated and VAT exempt sales of goods and services in 2012.
The amount of input VAT taxes claimed is broken down as follows:
Balance at beginning of the year P=− Current year’s purchases: Services lodged under other accounts 10,847,293 Input VAT applied to Output VAT (10,847,293) Claims for tax credit/refund and other adjustments − Balance at end of the year P=−
The Company has no importation in 2012. The Company has no claims for tax credit/refund in 2012.
Documentary Stamp Tax (DST) The DST paid/accrued on the following transaction is:
Transaction Amount DST Policies of insurances P=130,427,712 P=20,684,317
Other Taxes and License Fees for 2012 This includes all other taxes, local and national, including real estate taxes, license and permit fees lodged under the ‘General expenses’ section in the statement of comprehensive income. Details consist of the following:
Local Real estate tax, licenses and fees P=286,491 Business permit 333,210 Insurance commission-supervision and examination fee 115,000 VAT renewal fee 1,000 P=735,701
Importations The Company did not incur any excise tax in 2012.

- 52 -
*SGVFS001357*
Withholding Taxes The amount of withholding taxes paid and accrued for the year amounted to:
Withholding taxes on compensation and benefits P=4,475,309 Expanded withholding taxes 7,441,134 P=11,916,443
Tax Contingencies The Company has no deficiency tax assessments or any tax cases, litigation, and/or prosecution in courts or bodies outside the Bureau of Internal Revenue as of December 31, 2012.