liberation technology - mobile phones and political ... · motivation can digital ict foster...
TRANSCRIPT
Liberation technologyMobile Phones and Political Mobilization in Africa
Marco Manacorda Andrea Tesei
QMUL, CEP (LSE), CEPR & IZA QMUL & CEP (LSE)
March 2015
Manacorda & Tesei (2015) Liberation technology March 2015 1 / 47

Motivation
Can digital ICT foster political mobilization and advance political freedom? (The
Economist 2007, Diamond 2012)
I Spread information, foster communication and coordination
I Ability to reach large audiences, decentralized, open-access
Manacorda & Tesei (2015) Liberation technology March 2015 2 / 47

Motivation
Mobile phones: forefront of the political battleground
Activists (Mozambique 2010) Government (Ukraine 2014)
Manacorda & Tesei (2015) Liberation technology March 2015 3 / 47

Motivation
Mobile phones: forefront of the political battleground
Activists (Mozambique 2010) Government (Ukraine 2014)
Manacorda & Tesei (2015) Liberation technology March 2015 3 / 47

Contribution
Africa
1 Theater of some of most spectacular episodes of political mobilization
2 Reasons for grievance and high rates of political exclusion
3 Continent with fastest adoption of mobile phone technology (2012: 700
million users)
Unique, novel and detailed geo-referenced micro-data 1998-2012 for all of Africa
1 Licensed data on mobile phone coverage 2G/3G/4G
2 Big data on protests (GDELT)
3 Additional small data sets on protests (ACLED, SCAD)
4 Auxiliary geographical, economic and social data at 55 X 55 km level
Manacorda & Tesei (2015) Liberation technology March 2015 4 / 47

Contribution
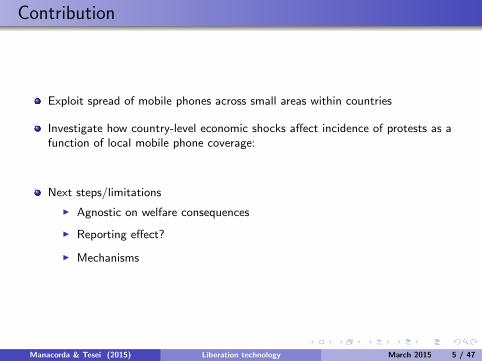
Exploit spread of mobile phones across small areas within countries
Investigate how country-level economic shocks affect incidence of protests as afunction of local mobile phone coverage:
Next steps/limitations
I Agnostic on welfare consequences
I Reporting effect?
I Mechanisms
Manacorda & Tesei (2015) Liberation technology March 2015 5 / 47

Contribution
Exploit spread of mobile phones across small areas within countries
Investigate how country-level economic shocks affect incidence of protests as afunction of local mobile phone coverage:
Next steps/limitations
I Agnostic on welfare consequences
I Reporting effect?
I Mechanisms
Manacorda & Tesei (2015) Liberation technology March 2015 5 / 47

Literature
Media
I Information provision fosters civic political participation (Gerber et al.2009, Gentzkow et al. 2011)
I Common knowledge and coordination overcome collective action problem(DiPasquale and Glaeser 1998, Madestam et al. 2013, Olson 2009Yanagizawa-Drott 2015)
I Propaganda and surveillance (Della Vigna and Gentzkow 2009, DellaVignaand Kaplan 2007, Diamond 2010, Durante et al. 2014, Enikolopov et al.2010, Yanagizawa-Drott 2015)
I Political disaffection (Bauernschuster et al., 2014, Gentzkow 2006, Olken2009)
I Government accountability and transparency (Besley and Burgess 2002,Enikolopov et al. 2013, Reinikka and Svensson 2010, Snyder andStromberg 2010)
I Economic and social empowerment (Acker 2010, Acker and Mbiti 2010)
Manacorda & Tesei (2015) Liberation technology March 2015 6 / 47

Literature
Economic conditions
I Poor economic conditions associated to great mobilization (Campante and
Chor 2012, 2014, DiPasquale and Glaeser 1998)
Insurgency, conflict and mobile phones (Pierskalla and Hollenbach 2013, Shapiro
and Weidmann 2012)
Manacorda & Tesei (2015) Liberation technology March 2015 7 / 47

Data: Grid cells
10,650, cells of 55 x 55 km at the equator (3,025 sq. km) (Tollefsen et al.2012).
Large array of cross-sectional socio-economic and other characteristics, incl.population.
Pop.= 84,300 individuals (100 to 5,000,000)
Assign cells spanning over multiple countries to country occupying greatest area
Analysis run on cell X year
Manacorda & Tesei (2015) Liberation technology March 2015 8 / 47

Data: Mobile Phone Coverage
Licensed data on mobile phone signal coverage (GSMA)
GSM standard: 96% of African market share
Geo-referenced: 1 to 23 km on the ground
Yearly coverage, 1998-2012 (excl. Somalia)
2G/3G/4G
10 p.p. increase in population coverage: 3.7 p.p. increase in take-up (ITU)
Link cell and protest data at level of cell assuming population uniformlydistributed within cells
Manacorda & Tesei (2015) Liberation technology March 2015 9 / 47

2G Diffusion, 1998-2012
Manacorda & Tesei (2015) Liberation technology March 2015 10 / 47

2G Diffusion, Nigeria 1998-2012
Manacorda & Tesei (2015) Liberation technology March 2015 11 / 47

Spread of mobile phone technology across the continent(% pop. in reach of signal)
Manacorda & Tesei (2015) Liberation technology March 2015 12 / 47

Data: Political mobilization
Global Database on Events, Location and Tone (GDELT 1.0, Leetaru andSchrodt 2013)
Big Data on political events and actions: 300 million daily observations1979-2013
The Guardian
Machine-coded from digital(ized) newswires
Example of automated coding
Sources: Africa News, Agence France Press, Xinhua, Associated Press Online,Associated Press Worldstream, BBC Monitoring, United Press International,Washington Post, Google News (from 2003) etc. in both English and vernacular(no social media)
Manacorda & Tesei (2015) Liberation technology March 2015 13 / 47

Data: Political mobilization
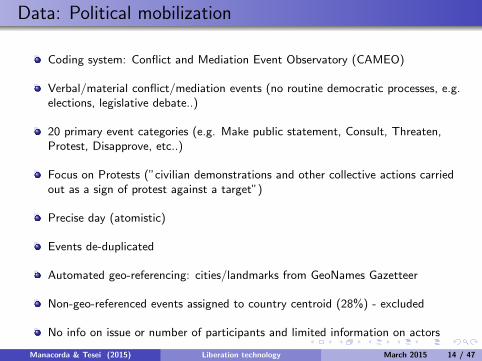
Coding system: Conflict and Mediation Event Observatory (CAMEO)
Verbal/material conflict/mediation events (no routine democratic processes, e.g.elections, legislative debate..)
20 primary event categories (e.g. Make public statement, Consult, Threaten,Protest, Disapprove, etc..)
Focus on Protests (”civilian demonstrations and other collective actions carriedout as a sign of protest against a target”)
Precise day (atomistic)
Events de-duplicated
Automated geo-referencing: cities/landmarks from GeoNames Gazetteer
Non-geo-referenced events assigned to country centroid (28%) - excluded
No info on issue or number of participants and limited information on actors
Manacorda & Tesei (2015) Liberation technology March 2015 14 / 47

Data: Political mobilization
Coding system: Conflict and Mediation Event Observatory (CAMEO)
Verbal/material conflict/mediation events (no routine democratic processes, e.g.elections, legislative debate..)
20 primary event categories (e.g. Make public statement, Consult, Threaten,Protest, Disapprove, etc..)
Focus on Protests (”civilian demonstrations and other collective actions carriedout as a sign of protest against a target”)
Precise day (atomistic)
Events de-duplicated
Automated geo-referencing: cities/landmarks from GeoNames Gazetteer
Non-geo-referenced events assigned to country centroid (28%) - excluded
No info on issue or number of participants and limited information on actors
Manacorda & Tesei (2015) Liberation technology March 2015 14 / 47

Cairo, 2011
Manacorda & Tesei (2015) Liberation technology March 2015 15 / 47

Data: political mobilization
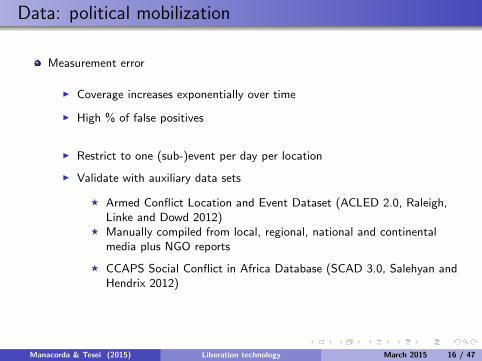
Measurement error
I Coverage increases exponentially over time
I High % of false positives
I Restrict to one (sub-)event per day per location
I Validate with auxiliary data sets
F Armed Conflict Location and Event Dataset (ACLED 2.0, Raleigh,Linke and Dowd 2012)
F Manually compiled from local, regional, national and continentalmedia plus NGO reports
F CCAPS Social Conflict in Africa Database (SCAD 3.0, Salehyan andHendrix 2012)
F Specialized geo-referenced data set on protests in Africa compiledfrom Agence France Press and Associated Press
Manacorda & Tesei (2015) Liberation technology March 2015 16 / 47

Data: political mobilization
Measurement error
I Coverage increases exponentially over time
I High % of false positives
I Restrict to one (sub-)event per day per location
I Validate with auxiliary data sets
F Armed Conflict Location and Event Dataset (ACLED 2.0, Raleigh,Linke and Dowd 2012)
F Manually compiled from local, regional, national and continentalmedia plus NGO reports
F CCAPS Social Conflict in Africa Database (SCAD 3.0, Salehyan andHendrix 2012)
F Specialized geo-referenced data set on protests in Africa compiledfrom Agence France Press and Associated Press
Manacorda & Tesei (2015) Liberation technology March 2015 16 / 47

Descriptive Statistics. Protests - micro data
Number obs. Fraction Number of sources Number of Articles Number of days
GDELT (1998-2012)
Demonstrations 48,871 62.31 4.12 21.06 1.50
Riots 12,961 16.53 3.79 19.28 1.29
Strikes 6,731 8.58 2.41 11.83 1.21
Others 9,869 12.58 4.19 21.77 1.35
Total 78,432 100 3.92 20.06 1.41
ACLED (1998-2012)
Total 9,152 100 1.21
SCAD (1998-2011)
Demonstrations 5,621 25.31 2.64
Riots 16,585 74.69 3.11
Total 22,206 100 2.84
Manacorda & Tesei (2015) Liberation technology March 2015 17 / 47

Descriptive Statistics. Main variables - cell level
Avg. Std. Dev. Min. Max.
Population (1000s) 84.32 266.78.5 0 12,860
Mobile Phone 2G Coverage (%) 0.43 0.42 0 1
Mobile Phone 3G Coverage (%) 0.02 0.09 0 1
Protests per 100, 000 pop.− GDELT 0.58 6.56 0 10,0000
Protests per 100, 000 pop.− ACELD 0.07 0.642 0 1,146.13
Protests per 100, 000 pop.− SCAD 0.17 4.76 0 10,166.5
Manacorda & Tesei (2015) Liberation technology March 2015 18 / 47

Protests per capita - GDELT (logs, net of country andtime effects)
Manacorda & Tesei (2015) Liberation technology March 2015 19 / 47

Protests per capita - GDELT, ACLED, SCAD (logs, net ofcountry and time effects
Manacorda & Tesei (2015) Liberation technology March 2015 20 / 47

Protests per capita and mobile phone coverage acrosscountries
Manacorda & Tesei (2015) Liberation technology March 2015 21 / 47

Protests per capita - GDELT vs ACLED - within countryvariation
Manacorda & Tesei (2015) Liberation technology March 2015 22 / 47
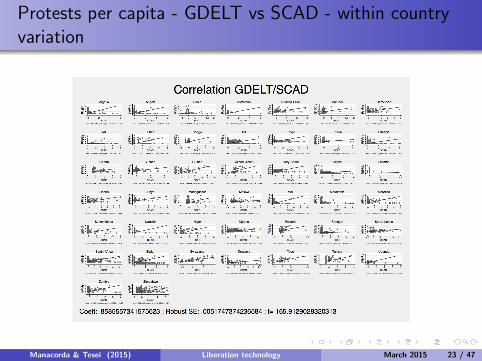
Protests per capita - GDELT vs SCAD - within countryvariation
Manacorda & Tesei (2015) Liberation technology March 2015 23 / 47

Descriptive Statistics. Main variables by cells
Avg. Std. Dev. Min. Max.
Per Capita Income (USD 2005) 2,299.0 2,707.2 208.7 15,300.6
Border Distance (100 km) 1.73 1.47 0 10.54
Capital Distance (100 km) 3.57 3.35 0.04 19.48
Travel Time nearest city pop. ≥ 20K (hours) 4.42 3.77 0.16 106.9
Travel Time nearest city pop. ≥ 50K (hours) 4.21 3.69 0 102.2
Coast(dummy) 0.15 0.36 0 1
Primary Roads (100 km) 0.87 0.99 0 5.22
Primary Roads Paved (100 km) 0.49 0.72 0 4.66
Primary Roads Good Conditions (100 km) 0.26 0.49 0 3.80
Secondary Roads (100 km) 1.42 1.10 0 6.40
Electricity Network (100 km) 0.86 1.18 0 7.55
Infant Mortality Rate (1, 000) 8.91 3.71 1 20.31
Mountain (%) 0.23 0.32 0 1
Forest (%) 0.23 0.25 0 1
Irrigated (%) 0.08 0.17 0 0.87
Diamonds (dummy) 0.03 0.18 0 1
Minerals (dummy) 0.22 0.42 0 1
Oil (dummy) 0.13 0.33 0 1
Temperature (Celsius degrees) 23.12 4.25 4.06 31.41
Precipitation (mm.) 876.2 487.5 69.39 3,296.4
Drought (n. of years) 1.44 1.25 0 11
Distance from drought (100 km) 1.74 0.56 0 4.56
Flashrate (per Km2 per year) 17.32 13.80 0 163.1
Country GDP growth (%) 0.049 0.041 -0.33 0.63
Manacorda & Tesei (2015) Liberation technology March 2015 24 / 47

Time-Series Relation between GDP Growth and Protest
Lower opportunity cost and greater grievances during recessions
Manacorda & Tesei (2015) Liberation technology March 2015 25 / 47

Specification and identification
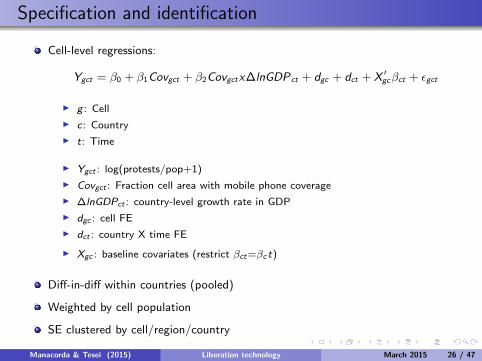
Cell-level regressions:
Ygct = β0 + β1Covgct + β2Covgctx∆lnGDPct + dgc + dct + X ′gcβct + εgct
I g : Cell
I c: Country
I t: Time
I Ygct : log(protests/pop+1)
I Covgct : Fraction cell area with mobile phone coverage
I ∆lnGDPct : country-level growth rate in GDP
I dgc : cell FE
I dct : country X time FE
I Xgc : baseline covariates (restrict βct=βc t)
Diff-in-diff within countries (pooled)
Weighted by cell population
SE clustered by cell/region/country
Manacorda & Tesei (2015) Liberation technology March 2015 26 / 47
Specification and identification
Cell-level regressions:
Ygct = β0 + β1Covgct + β2Covgctx∆lnGDPct + dgc + dct + X ′gcβct + εgct
I g : Cell
I c: Country
I t: Time
I Ygct : log(protests/pop+1)
I Covgct : Fraction cell area with mobile phone coverage
I ∆lnGDPct : country-level growth rate in GDP
I dgc : cell FE
I dct : country X time FE
I Xgc : baseline covariates (restrict βct=βc t)
Diff-in-diff within countries (pooled)
Weighted by cell population
SE clustered by cell/region/country
Manacorda & Tesei (2015) Liberation technology March 2015 26 / 47
Baseline Regressions
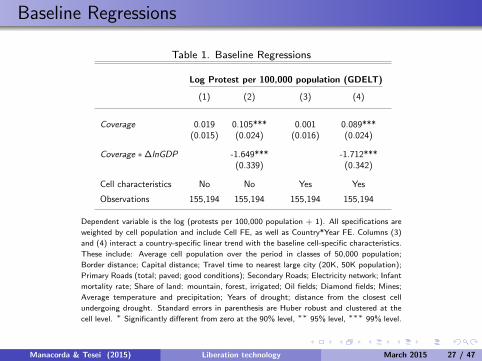
Table 1. Baseline Regressions
Log Protest per 100,000 population (GDELT)
(1) (2) (3) (4)
Coverage 0.019 0.105*** 0.001 0.089***(0.015) (0.024) (0.016) (0.024)
Coverage ∗ ∆lnGDP -1.649*** -1.712***(0.339) (0.342)
Cell characteristics No No Yes Yes
Observations 155,194 155,194 155,194 155,194
Dependent variable is the log (protests per 100,000 population + 1). All specifications are
weighted by cell population and include Cell FE, as well as Country*Year FE. Columns (3)
and (4) interact a country-specific linear trend with the baseline cell-specific characteristics.
These include: Average cell population over the period in classes of 50,000 population;
Border distance; Capital distance; Travel time to nearest large city (20K, 50K population);
Primary Roads (total; paved; good conditions); Secondary Roads; Electricity network; Infant
mortality rate; Share of land: mountain, forest, irrigated; Oil fields; Diamond fields; Mines;
Average temperature and precipitation; Years of drought; distance from the closest cell
undergoing drought. Standard errors in parenthesis are Huber robust and clustered at the
cell level. ∗ Significantly different from zero at the 90% level, ∗∗ 95% level, ∗∗∗ 99% level.
Manacorda & Tesei (2015) Liberation technology March 2015 27 / 47

Baseline Regressions
Table 1B. Baseline Regressions (ACLED and SCAD)
Log Protest per 100,000 pop. (ACLED) Log Protest per 100,000 pop. (SCAD)
(1) (2) (3) (4) (5) (6) (7) (8)
Coverage 0.009 0.030** -0.001 0.019 0.014 0.041* 0.025 0.052**(0.006) (0.013) (0.006) (0.014) (0.015) (0.021) (0.017) (0.023)
Coverage ∗ ∆lnGDP -0.408* -0.385* -0.513* -0.513*(0.222) (0.226) (0.272) (0.276)
Cell characteristics No No Yes Yes No No Yes Yes
Observations 155,194 155,194 155,194 155,194 144,857 144,857 144,857 144,857
Manacorda & Tesei (2015) Liberation technology March 2015 28 / 47

Magnitude of effects
5 p.p. fall in GDP growth associated to increase in yearly protest/days per capitadifferential between areas with and without coverage of 8%
Similar effects with and without large set of controls
Similar effects in GDELT, ACLED and SCAD
Manacorda & Tesei (2015) Liberation technology March 2015 29 / 47

Additional Regressions
Table 3. Additional Regressions
Log Protest per 100,000 (GDELT)
Exclude capital Below/Above 0 3G 2G and 3G
(1) (2) (3) (4))
Coverage 0.051** 0.091***(0.023) (0.024)
Coverage ∗ ∆lnGDP -0.941*** -1.732***(0.314) (0.338)
Coverage 3G 0.493*** 0.497***(0.190) (0.188)
Coverage 3G ∗ ∆lnGDP -0.092 -0.065(0.257) (0.240)
Coverage ∗ ∆lnGDP|<0 -2.190***(0.651)
Coverage ∗ ∆lnGDP|≥0 -0.814***(0.245)
Coverage ∗ I (∆lnGDP ≥ 0) -0.001***(0.000)
Cell characteristics Yes Yes Yes Yes
Observations 154,504 155,194 155,194 155,194
See footnote Table 1
ACLED and SCAD
Manacorda & Tesei (2015) Liberation technology March 2015 30 / 47

Magnitude of effects
Stronger in - but not driven by - capital cities
Asymmetric effect: largely associated to recessions
Effect of 3G at low levels of growth but interaction not significant
Manacorda & Tesei (2015) Liberation technology March 2015 31 / 47

Magnitude of effects
Stronger in - but not driven by - capital cities
Asymmetric effect: largely associated to recessions
Effect of 3G at low levels of growth but interaction not significant
Manacorda & Tesei (2015) Liberation technology March 2015 31 / 47

Magnitude of effects
Stronger in - but not driven by - capital cities
Asymmetric effect: largely associated to recessions
Effect of 3G at low levels of growth but interaction not significant
Manacorda & Tesei (2015) Liberation technology March 2015 31 / 47

Magnitude of effects
Stronger in - but not driven by - capital cities
Asymmetric effect: largely associated to recessions
Effect of 3G at low levels of growth but interaction not significant
Manacorda & Tesei (2015) Liberation technology March 2015 31 / 47

Estimates by country
Manacorda & Tesei (2015) Liberation technology March 2015 32 / 47

Country Covariates
Country Covariates
Source Coverage Years Mean Std. Dev.
Economic Characteristics
lnGDP World Bank 1998-2012 6.470 0.988
Gini Index World Bank Different years (max 5) 42.27 7.82
Education Characteristics
Literacy Rate World Bank 2000, 2005, 2010 59.92 16.81
Secondary Education World Bank 2000, 2005, 2010 26.79 17.6
Tertiary Education World Bank 2000, 2005, 2010 4.21 3.45
Business Characteristics
Days start business World Bank Different years (max 3) 22.97 15.02
Ease business World Bank 2012 143 39.58
Institutional Characteristics
Polity2 Polity IV (Marshall and Gurr) 1998-2012 1.063 4.244
Manacorda & Tesei (2015) Liberation technology March 2015 33 / 47

Country Covariates
Table 2. Country Covariates
Economy Education Business Institutions
(1) (2) (3) (4))
Gini Index -0.045 -0.109 -0.070 -0.214*(0.103) (0.101) (0.095) (0.108)
lnGDP 0.320 0.441 0.434 0.534(0.243) (0.315) (0.353) (0.331)
Literacy Rate -0.019 -0.043 0.002(0.031) (0.034) (0.038)
Secondary Education 0.028 0.002 -0.023(0.030) (0.054) (0.051)
Tertiary Education -0.356*** -0.426*** -0.476***(0.104) (0.098) (0.093)
Days start business -0.128** -0.213***(0.050) (0.059)
Ease business -0.009 0.021(0.018) (0.021)
Polity2 0.183*(0.102)
Polity2 sq. 0.072*(0.035)
Observations 45 45 45 45
Dependent variable: estimated coefficient of Coverage ∗∆lnGDP. Regressions weighted
by the inverse of square of standard error.
Manacorda & Tesei (2015) Liberation technology March 2015 34 / 47
Magnitude of effects
Responsiveness to mobile phone coverage is higher in:
I Countries with greater fraction of highly educated individuals: a 1 s.d. risein fraction of pop. with tertiary education (3.45) increases the interactioncoefficient by 1.5, roughly a doubling of the effect
I Countries with more red tape: a 1 s.d. in the number of days to open anactivity (15) increases the interaction coefficient by 3, roughly two timesthe effect
I In weak autocratic countries (u-shaped, min at Polity2 score -1.3), a 1 s.d.
increase (fall) in polity score (4.24) from pure autocracies (democracies)
roughly doubles the effect
Manacorda & Tesei (2015) Liberation technology March 2015 35 / 47

Instrumentation
Coverage possibly endogenous
Demand and supply determinants of coverage in Sub-Saharan Africa (Acker and
Mbiti 2012, Buys et al 2009:
I PopulationI IncomeI CompetitionI Electricity grid
I Installation and maintenance costs: accessibility (elevation, slope, distance from
main road, distance from the nearest large city)
Likely not excludable
Lightning strikes: damage mobile phones infrastructure and negatively affectconnectivity, acting on both supply and demand (Andersen et al. 2012, Andersenand Dalgaard 2013, ITU 1997, 2003)
Manacorda & Tesei (2015) Liberation technology March 2015 36 / 47

Flash density in Africa
Manacorda & Tesei (2015) Liberation technology March 2015 37 / 47

Instrumentation
Instrument Covgct by Zgct
Zgct = FgcxCovct
Fgc=average cell flash density
Covt=continent-wide trend in coverage
Covgct = δ0 + δ1Zgct + δ2Zgctx∆lnGDPct + dgc + dct + X ′gcδct + egct
Covgctx∆lnGDPct = γ0 + γ1Zgct + γ2Zgctx∆lnGDPct + dgc + dct + X ′gcγct + vgct
Manacorda & Tesei (2015) Liberation technology March 2015 38 / 47

First Stage
Table 4. First Stage Regressions
Mobile Phone Percentage Coverage (GSMA)
Covgct Covgct Covgct ∗ ∆lnGDPct Covgct Covgct Covgct ∗ ∆lnGDPct
(1) (2) (3) (4) (5) (6)
Flashrate -0.002 -0.002 0.000* -0.004** -0.005*** 0.000(0.001) (0.001) (0.000) (0.002) (0.002) (0.000)
Flashrate ∗ ∆lnGDP 0.006 -0.005** 0.012 -0.006**(0.008) (0.002) (0.008) (0.003)
Cell characteristics No No No Yes Yes Yes
F-statistic 1.31 1.25 3.08 4.54 4.45 3.90
Observations 159,194 159,194 159,194 159,194 159,194 159,194
Dependent variable is 2G/3G percentage coverage in the cell. The explanatory variable is the average cell flash densityinteracted by the continent-wide trend in coverage. All specifications include Cell FE, as well as Country*Year FE.Columns (4)-(6) interact a country-specific linear trend with the baseline cell-specific characteristics. These include:Average cell population over the period in classes of 50,000 population; Border distance; Capital distance; Traveltime to nearest large city (20K, 50K population); Primary Roads (total; paved; good conditions); Secondary Roads;Electricity network; Infant mortality rate; Share of land: mountain, forest, irrigated; Oil fields; Diamond fields; Mines;Average temperature and precipitation; Years of drought; distance from the closest cell undergoing drought. Standarderrors in parenthesis are Huber robust and clustered at the cell level. ∗ Significantly different from zero at the 90%level, ∗∗ 95% level, ∗∗∗ 99% level.
Manacorda & Tesei (2015) Liberation technology March 2015 39 / 47

Magnitude of effects
Predicts a differential expansion of coverage in cells 1 s.d. of flash rates (13.79)apart of 5.5 p.p. over entire period
Manacorda & Tesei (2015) Liberation technology March 2015 40 / 47

Instrumental Variable
Table 5. Instrumental Variable Regressions
Log Protest per 100,000 (GDELT)
GDELT ACLED SCAD
(1) (2) (3) (4) (5) (6)
Coverage -0.441 0.215 -0.272 0.001 -0.113 -0.137(0.431) (0.380) (0.227) (0.191) (0.576) (0.518)
Coverage ∗ ∆lnGDP -7.480*** -3.106** 0.300(2.819) (1.593) (2.207)
A-R p-value [0.01] [0.05] [0.94]
Cell characteristics Yes Yes Yes Yes Yes Yes
Observations 155,194 155,194 155,194 155,194 144,857 144,857
Dependent variable is the log (protests per 100,000 population + 1). The endogenous variableCoverage is instrumented by Fgc ∗ Covt , where Fgc is the average cell flash density and Covtis the continent-wide trend in coverage. In square brackets are reported the p-values basedon the Anderson-Rubin test of statistical significance. A key property of the test is that it isrobust to weak instruments. The version of the test we implement is robust to heteroskedasticityand arbitrary within-cell correlation of the residuals (Andrews and Stock, 2005). All specificationsinclude Cell FE and Country*Year FE. All columns interact a country-specific linear trend with thebaseline cell-specific characteristics. These include: Border distance; Capital distance; Travel timeto nearest large city (20K, 50K, 100K, 500K); Primary Roads (total; paved; good conditions);Secondary Roads; Infant mortality rate; Share of land: mountain, forest, irrigated; Oil fields;Diamond fields; Mines; Ethno-linguistic fragmentation. Standard errors in parenthesis are Huberrobust and clustered at the cell level. ∗ Significantly different from zero at the 90% level, ∗∗
95% level, ∗∗∗ 99% level.
Manacorda & Tesei (2015) Liberation technology March 2015 41 / 47

Magnitude of effects
IV estimates roughly 5 times OLS
Seems to suggest coverage negatively associated to protests, possibly due toomitted variables
Measurement error
Manacorda & Tesei (2015) Liberation technology March 2015 42 / 47

Magnitude of effects
IV estimates roughly 5 times OLS
Seems to suggest coverage negatively associated to protests, possibly due toomitted variables
Measurement error
Manacorda & Tesei (2015) Liberation technology March 2015 42 / 47

Magnitude of effects
IV estimates roughly 5 times OLS
Seems to suggest coverage negatively associated to protests, possibly due toomitted variables
Measurement error
Manacorda & Tesei (2015) Liberation technology March 2015 42 / 47

Conclusions
We use unique data on protest and mobile phone coverage to show previouslyundocumented causal effect of mobile phone technology on political mobilization
In line with economic theory, we find a negative relation between economicgrowth and the level of protest
Political mobilization magnified by mobile phone availability
If anything OLS underestimated
Strong support for mobile activism argument
Ongoing work:
I Channels: information, coordination? Returns to participation? Empowerment?Increasing reporting?
I Validate instrument: placebo tests
Manacorda & Tesei (2015) Liberation technology March 2015 43 / 47

Additional Regressions
Table 3B. Additional Regressions (ACLED and SCAD)
Log Protest per 100,000 (ACLED) Log Protest per 100,000 (SCAD)
Exclude capital Below/Above 0 3G 2G and 3G Exclude capital Below/Above 0 3G 2G and 3G
(1) (2) (3) (4) (5) (6) (7) (8)
Coverage 0.012 0.019 0.053*** 0.051**(0.008) (0.013) (0.019) (0.023)
Coverage ∗ ∆lnGDP -0.209* -0.391* -0.457** -0.503*(0.114) (0.220) (0.214) (0.276)
Coverage 3G 0.291*** 0.291*** 0.033 0.032(0.109) (0.109) (0.102) (0.102)
Coverage 3G ∗ ∆lnGDP -0.500*** -0.494*** -0.919 -0.860(0.162) (0.158) (0.927) (0.897)
Coverage ∗ ∆lnGDP|<0 -0.485 -2.407***(0.657) (0.650)
Coverage ∗ ∆lnGDP|≥0 -0.175* 0.338(0.103) (0.209)
Coverage ∗ I (∆lnGDP ≥ 0) -0.000*** 0.000(0.000) (0.000)
Cell characteristics Yes Yes Yes Yes Yes Yes Yes Yes
Observations 154,504 155,194 155,194 155,194 144,214 144,857 144,857 144,857
See footnote Table 1
Back
Manacorda & Tesei (2015) Liberation technology March 2015 44 / 47

The Guardian
4/27/2014 GDELT: a big data history of life, the universe and everything | News | theguardian.com
http://www.theguardian.com/news/datablog/2013/apr/12/gdelt-global-database-events-location 1/4
Search
GDELT itemises every event in history in a huge database. Free Syrian Army fighters take cover as they exchange firewith regime forces in Aleppo. Photograph: James Lawler Duggan/AFP/Getty Images
Everybody is searching for bigger and bigger data: how about this? A comprehensivelist of every event in human history.
It matters because historians have long feared that we live in a digital dark ages where our history will have vanished when future generations try to look back on theseelectronic decades.
GDELT: a big data history of life, theuniverse and everythingThe Global Data on Events, Location and Tone promises to bethe ultimate big database and an amazing tool for datajournalists. But what is it?• Download the data• More data journalism and data visualisations from the Guardian
Back
Manacorda & Tesei (2015) Liberation technology March 2015 45 / 47
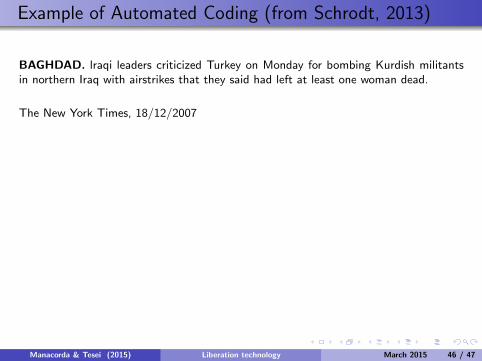
Example of Automated Coding (from Schrodt, 2013)
BAGHDAD. lraqi leaders criticized Turkey on Monday for bombing Kurdish militantsin northern Iraq with airstrikes that they said had left at least one woman dead.
The New York Times, 18/12/2007
First event:
Event Code: 111 (DEMAND: Criticize or denounce)Source: IRQ GOVTarget: TUR
Second event:
Event Code: 195 (ASSAULT: Conduct suicide, car, or other non-militarybombing)Source: TURTarget: IRQKRD REB
Back
Manacorda & Tesei (2015) Liberation technology March 2015 46 / 47
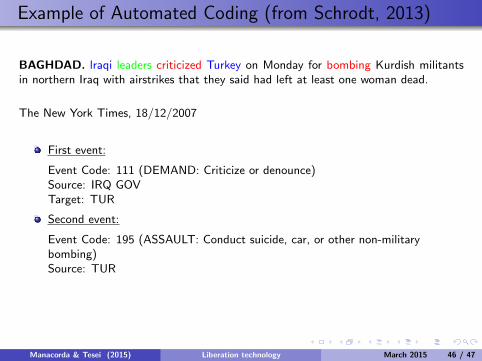

Example of Automated Coding (from Schrodt, 2013)
BAGHDAD. lraqi leaders criticized Turkey on Monday for bombing Kurdish militantsin northern Iraq with airstrikes that they said had left at least one woman dead.
The New York Times, 18/12/2007
First event:
Event Code: 111 (DEMAND: Criticize or denounce)
Source: IRQ GOVTarget: TUR
Second event:
Event Code: 195 (ASSAULT: Conduct suicide, car, or other non-militarybombing)Source: TURTarget: IRQKRD REB
Back
Manacorda & Tesei (2015) Liberation technology March 2015 46 / 47

Example of Automated Coding (from Schrodt, 2013)
BAGHDAD. lraqi leaders criticized Turkey on Monday for bombing Kurdish militantsin northern Iraq with airstrikes that they said had left at least one woman dead.
The New York Times, 18/12/2007
First event:
Event Code: 111 (DEMAND: Criticize or denounce)Source: IRQ
GOVTarget: TUR
Second event:
Event Code: 195 (ASSAULT: Conduct suicide, car, or other non-militarybombing)Source: TURTarget: IRQKRD REB
Back
Manacorda & Tesei (2015) Liberation technology March 2015 46 / 47

Example of Automated Coding (from Schrodt, 2013)
BAGHDAD. lraqi leaders criticized Turkey on Monday for bombing Kurdish militantsin northern Iraq with airstrikes that they said had left at least one woman dead.
The New York Times, 18/12/2007
First event:
Event Code: 111 (DEMAND: Criticize or denounce)Source: IRQ GOV
Target: TUR
Second event:
Event Code: 195 (ASSAULT: Conduct suicide, car, or other non-militarybombing)Source: TURTarget: IRQKRD REB
Back
Manacorda & Tesei (2015) Liberation technology March 2015 46 / 47

Example of Automated Coding (from Schrodt, 2013)
BAGHDAD. lraqi leaders criticized Turkey on Monday for bombing Kurdish militantsin northern Iraq with airstrikes that they said had left at least one woman dead.
The New York Times, 18/12/2007
First event:
Event Code: 111 (DEMAND: Criticize or denounce)Source: IRQ GOVTarget: TUR
Second event:
Event Code: 195 (ASSAULT: Conduct suicide, car, or other non-militarybombing)Source: TURTarget: IRQKRD REB
Back
Manacorda & Tesei (2015) Liberation technology March 2015 46 / 47

Example of Automated Coding (from Schrodt, 2013)
BAGHDAD. lraqi leaders criticized Turkey on Monday for bombing Kurdish militantsin northern Iraq with airstrikes that they said had left at least one woman dead.
The New York Times, 18/12/2007
First event:
Event Code: 111 (DEMAND: Criticize or denounce)Source: IRQ GOVTarget: TUR
Second event:
Event Code: 195 (ASSAULT: Conduct suicide, car, or other non-militarybombing)
Source: TURTarget: IRQKRD REB
Back
Manacorda & Tesei (2015) Liberation technology March 2015 46 / 47
Example of Automated Coding (from Schrodt, 2013)
BAGHDAD. lraqi leaders criticized Turkey on Monday for bombing Kurdish militantsin northern Iraq with airstrikes that they said had left at least one woman dead.
The New York Times, 18/12/2007
First event:
Event Code: 111 (DEMAND: Criticize or denounce)Source: IRQ GOVTarget: TUR
Second event:
Event Code: 195 (ASSAULT: Conduct suicide, car, or other non-militarybombing)Source: TUR
Target: IRQKRD REB
Back
Manacorda & Tesei (2015) Liberation technology March 2015 46 / 47

Example of Automated Coding (from Schrodt, 2013)
BAGHDAD. lraqi leaders criticized Turkey on Monday for bombing Kurdish militantsin northern Iraq with airstrikes that they said had left at least one woman dead.
The New York Times, 18/12/2007
First event:
Event Code: 111 (DEMAND: Criticize or denounce)Source: IRQ GOVTarget: TUR
Second event:
Event Code: 195 (ASSAULT: Conduct suicide, car, or other non-militarybombing)Source: TURTarget: IRQKRD
REB
Back
Manacorda & Tesei (2015) Liberation technology March 2015 46 / 47

Example of Automated Coding (from Schrodt, 2013)
BAGHDAD. lraqi leaders criticized Turkey on Monday for bombing Kurdish militantsin northern Iraq with airstrikes that they said had left at least one woman dead.
The New York Times, 18/12/2007
First event:
Event Code: 111 (DEMAND: Criticize or denounce)Source: IRQ GOVTarget: TUR
Second event:
Event Code: 195 (ASSAULT: Conduct suicide, car, or other non-militarybombing)Source: TURTarget: IRQKRD REB
Back
Manacorda & Tesei (2015) Liberation technology March 2015 46 / 47

Additional Data
1 Auxiliary data:I Grids of 0.5 x 0.5 decimal degree resolution (from PRIOGRID). Approximately 55
x 55 kilometres at the equator. 10,409 cells
F Population (CIESIN, 1995, 2000, 2005)
F Border and capital distance (PRIOGRID, 2000)
F Travel time to nearest large city (20K, 50K) (Harvest Choice/IFPRI, 2000)
F Share of mountains (UNEP, 2002), forests (Globcover, 2009), irrigated land(FAO, 2000)
F Infant mortality rate (SEDAC, 2000)
F Oilfields (PRIO, 2007), diamond fields (PRIO, 2005)
F Primary roads, secondary roads (ADB/AICD, 2008)
F Electricity transmission network (ADB/AICD, 2008)
F Mines (U.S. Geology Survey, 2005)
F Flashrate density (NASA, avg. 1995-2010)
F Temperature and Precipitation (NOAA 2011, avg. 1946-2008)
F Years of drought and distance from closest cell undergoing drought (NOAA
2011, avg. 1946-2008)
I Country GDP growth (from World Bank and PWT 8.0)
Manacorda & Tesei (2015) Liberation technology March 2015 47 / 47