liberalization of the chilean electricity system and its effects on environmental performance hugh...
TRANSCRIPT

LIBERALIZATION OF THE CHILEAN ELECTRICITY SYSTEM AND ITS EFFECTS ON
ENVIRONMENTAL PERFORMANCE
Hugh Rudnick, P.Universidad Católica de Chile, Departamento de Ingeniería Eléctrica.Raúl O’Ryan, Universidad de Chile, Departamento de Ingeniería Industrial.
Rodrigo Bravo, Universidad de Chile, Departamento de Ingeniería Industrial.
GRENELEM PROJECT
Santiago, Chile, September 2001
Universidad de Chile Pontificia Universidad Católica de Chile
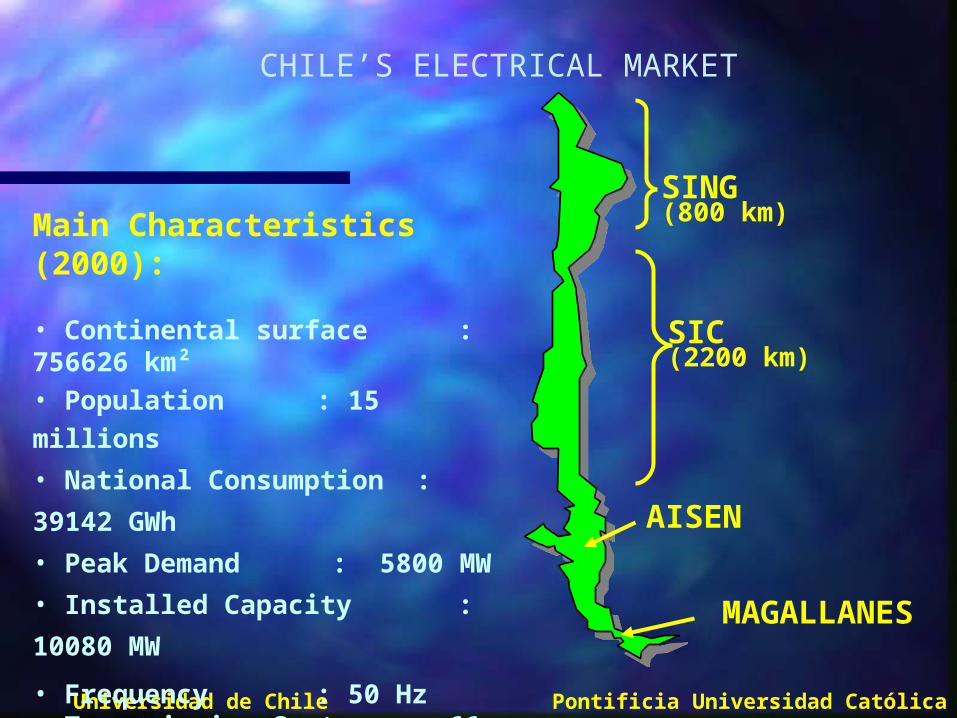
SING(800 km)
SIC(2200 km)
AISEN
MAGALLANES
Universidad de Chile Pontificia Universidad Católica de Chile
Main Characteristics (2000):
• Continental surface : 756626 km²• Population : 15 millions
• National Consumption : 39142 GWh
• Peak Demand : 5800 MW
• Installed Capacity : 10080 MW
• Frequency : 50 Hz• Transmission Systems : 66 kV, 110 kV, 154 kV, 220 kV y 500 kV• Interconnected Systems: (SING, SIC, AISEN, MAGALLANES)
CHILE’S ELECTRICAL MARKET
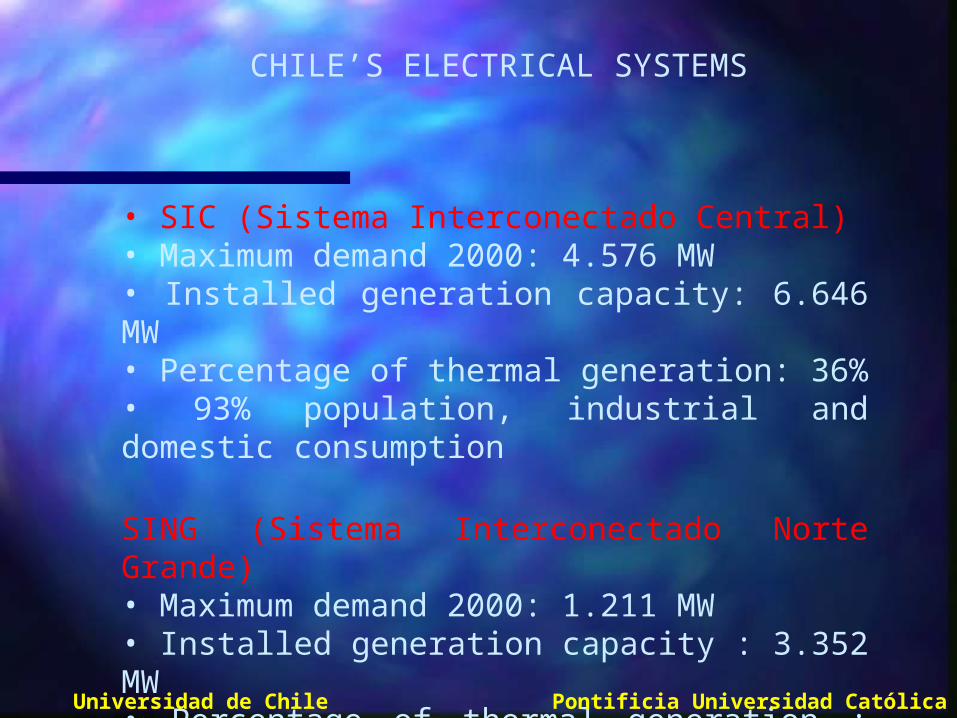
CHILE’S ELECTRICAL SYSTEMS
• SIC (Sistema Interconectado Central)• Maximum demand 2000: 4.576 MW• Installed generation capacity: 6.646 MW• Percentage of thermal generation: 36%• 93% population, industrial and domestic consumption
SING (Sistema Interconectado Norte Grande)• Maximum demand 2000: 1.211 MW• Installed generation capacity : 3.352 MW• Percentage of thermal generation : 99,6%• Large consumers (10 correspond to 75% of demand, largest client 25% total demand)
Universidad de Chile Pontificia Universidad Católica de Chile
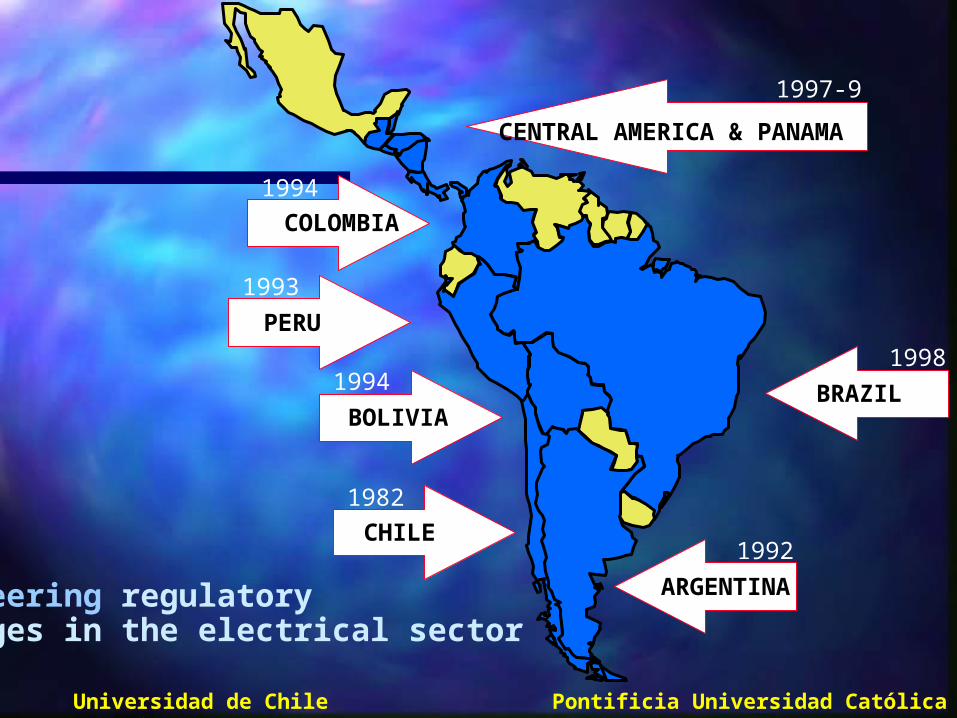
COLOMBIA
1994
PERU
1993
BOLIVIA
1994
CHILE
1982
ARGENTINA
1992
BRAZIL
1998
CENTRAL AMERICA & PANAMA
1997-9
Pioneering regulatory changes in the electrical sector
Universidad de Chile Pontificia Universidad Católica de Chile
1992
1994
1993
1991
1991
1999
>1992
1987
1996
1995
1994
1994
1995
1995
EU
19951989
1996
1995
1998
1982
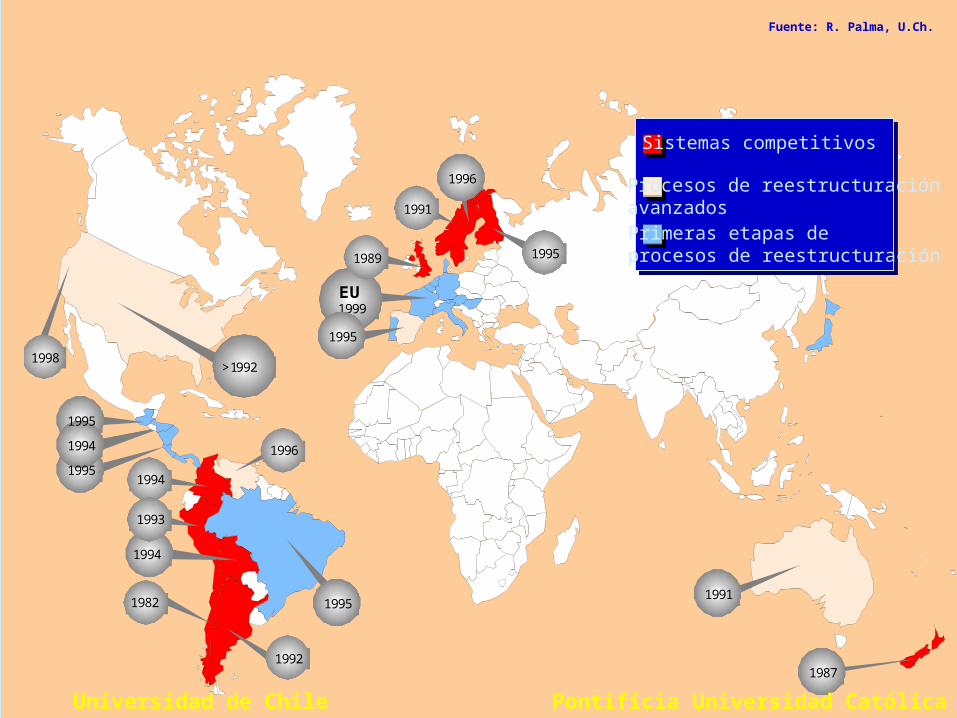
Sistemas competitivos
Procesos de reestructuraciónavanzadosPrimeras etapas deprocesos de reestructuración
Fuente: R. Palma, U.Ch.
Universidad de Chile Pontificia Universidad Católica de Chile
Fuelco Gasco
Genco Genco
Sellco Sellco
Gridco
Waterco Fuelco
Genco Genco
Sellco Sellco
Gridco
Brokeco Brokeco
Buyco Buyco
Lineco Lineco
Brokeco Brokeco
Buyco Buyco
Lineco Lineco
Disco Disco
Cons Cons Cons Cons Cons Cons
Disco Disco
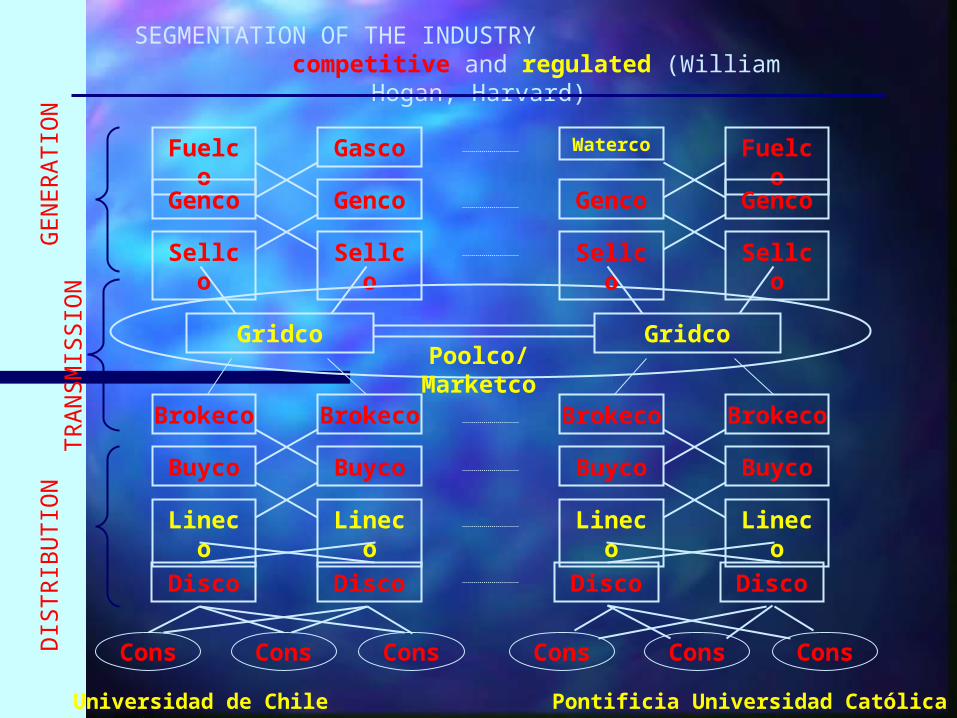
SEGMENTATION OF THE INDUSTRY competitive and regulated (William Hogan, Harvard)
DIS
TR
IBU
TIO
N
Poolco/Marketco
GE
NE
RA
TIO
NT
RA
NS
MIS
SIO
N
Universidad de Chile Pontificia Universidad Católica de Chile

*wholesale market deregulation (unregulated prices for large consumers)
*competition at generation level with centralized generation dispatch (Poolco model)
-Chile, Bolivia, Peru, Brazil, Central America - audited costs
-Argentina- bids with caps-Colombia- unrestricted bids
*short term marginal cost based schemes
ELECTRICITY MARKET REFORMS
Universidad de Chile Pontificia Universidad Católica de Chile

*two part price scheme
-short term energy marginal cost-capacity pricing (adequacy signal)
*nodal pricing (generation-transmission interaction)
*financial bilateral contracts (non physical)
ELECTRICITY MARKET REFORMS
Universidad de Chile Pontificia Universidad Católica de Chile

*regulation in transmission and distribution
*transmission open access regulation, global allocation of network costs, use of system approach, concession required
*incentive based regulation in distribution (yard stick competition, price cap), concession required, obligation to serve, quality of service regulated
ELECTRICITY MARKET REFORMS
Universidad de Chile Pontificia Universidad Católica de Chile

GovernanceGovernance
CDECGenerators
Transmiters
DistribuitorsLarge users
Ministry Economy
Environmental body
Local governmentsSmall users
Antitrust body
SEC
CNE
Universidad de Chile Pontificia Universidad Católica de Chile

0.0%
2.0%
4.0%
6.0%
8.0%
10.0%
12.0%
[Lo
ad y
ear
ly g
row
th]
1986 1987 1988 1989 1990 1991 1992 1993 1994 1995 1996 1997 1998 1999 2000
Chile- yearly growth of energy demand
High load growthHigh load growth
Universidad de Chile Pontificia Universidad Católica de Chile

Investment in the SICInvestment in the SIC
0
1.000
2.000
3.000
4.000
5.000
6.000
7.000
8.000
9.000
1.997 1.998 1.999 2.000 2.001 2.002 2.003 2.004 2.005 2.006
YEAR
DE
MA
ND
(M
W)
DEMAND SUPPLY
PANGUE
LOMA ALTASES
PETROPOWERNEHUENCO
PEUCHENMAMPIL
SAN ISIDRORUCUE
CORTADERAL
RALCOTHERM.
332,4
THERM. 332,42 X THERM.
332,4
Source: CNE Chile
Universidad de Chile Pontificia Universidad Católica de Chile

19,818,8
16,113,6 13,3
12,010,6
9,3
%
26,0
21,9
19,016,2
9,3
17,4
12,5
1987 1988 1989 1990 1991 1992 1993 1994 19950
5
10
15
20
25
30
1987 1988 1989 1990 1991 1992 1993 1994
Chilectra(Santiago)
Edesur(Buenos Aires)
EdelnorEdelnor(Lima)(Lima)
Losses (technical and non technical)
Universidad de Chile Pontificia Universidad Católica de Chile

Energy prices Chile SIC - SING(Oct.1999 values)
0.0010.0020.0030.0040.0050.0060.0070.0080.0090.00
AB
RIL
1983
AB
RIL
1984
AB
RIL
1985
AB
RIL
1986
AB
RIL
1987
AB
RIL
1988
AB
RIL
1989
AB
RIL
1990
AB
RIL
1991
AB
RIL
1992
AB
RIL
1993
AB
RIL
1994
AB
RIL
1995
AB
RIL
1996
AB
RIL
1997
AB
RIL
1998
AB
RIL
1999$
/kW
h
SIC (Alto Jahuel) SING(Antofagasta)
Prices decreasingPrices decreasing
Universidad de Chile Pontificia Universidad Católica de Chile

Universidad de Chile Pontificia Universidad Católica de Chile
WEAKNESSES
-High horizontal integration (generation)
-Vertical integration (generation-transmission-distribution)
-Efficiency increases not transfered to consumers
-Governance problems in pool
-Transmission regulation faces difficulties

Installed Capacity by Interconnected System
0
2000
4000
6000
8000
10000
12000
1990 1991 1992 1993 1994 1995 1996 1997 1998 1999 2000
Year
MW
SING SIC EDELAYSEN EDELMAG AUTOPRODUCTORES
Universidad de Chile Pontificia Universidad Católica de Chile
Evolution of Installed Capacity and Energy Production
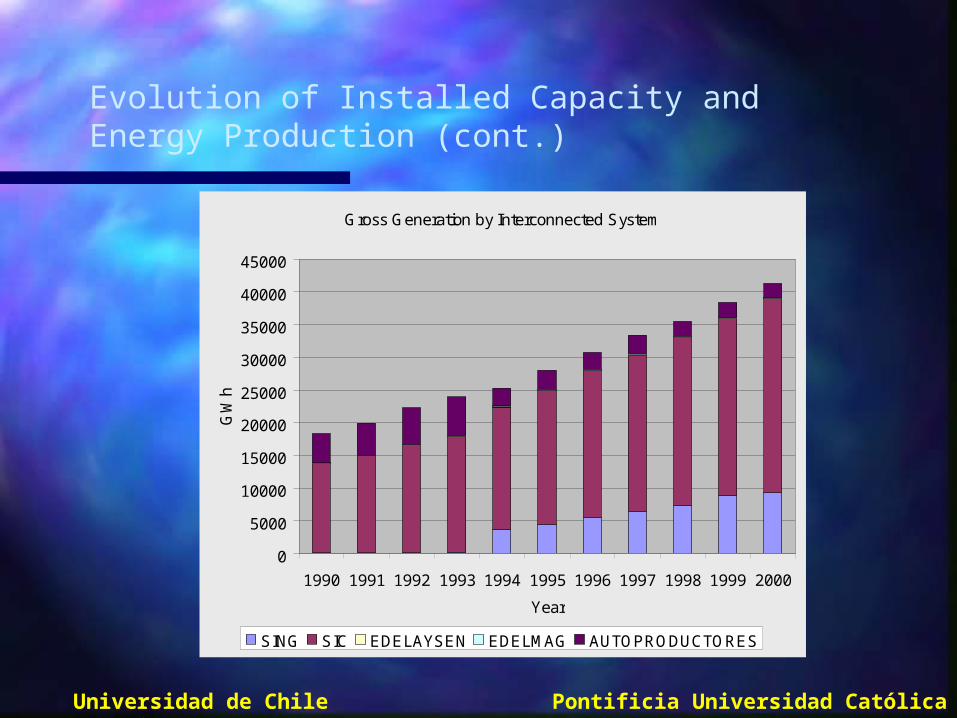
Gross Generation by Interconnected System
0
5000
10000
15000
20000
25000
30000
35000
40000
45000
1990 1991 1992 1993 1994 1995 1996 1997 1998 1999 2000
Year
GW
h
SING SIC EDELAYSEN EDELMAG AUTOPRODUCTORES
Universidad de Chile Pontificia Universidad Católica de Chile
Evolution of Installed Capacity and Energy Production (cont.)

Energy Produced in the Electrical System by Fuel Type
0
5000000
10000000
15000000
20000000
25000000
30000000
35000000
1996 1997 1998 1999 2000
Year
MW
h
Hydro Coal Byomass Natural gas Fuels Pet coke
Universidad de Chile Pontificia Universidad Católica de Chile
Evolution of Energy Use and Emissions

Año 1990 1991 1992 1993 1994 1995 1996 1997 1998 1999 2000
HYDRO 49% 66% 75% 72% 67% 66% 55% 57% 45% 35% 29%
TERMO 51% 34% 25% 28% 33% 34% 45% 43% 55% 65% 71%
Percentage of gross hydroelectric and thermoelectric generation
Universidad de Chile Pontificia Universidad Católica de Chile
Evolution of Energy Use and Emissions

Emissions from large combustion Plants
0
20
40
60
80
100
120
140
160
180
200
1985
1986
1987
1988
1989
1990
1991
1992
1993
1994
1995
1996
1997
1998
1999
Year
NO
x a
nd
SO
x in
Gg
/Ye
ar
CO
2 in
10
2 G
g/Y
ea
r
0
5000
10000
15000
20000
25000
30000
35000
40000
45000
GW
h
CO2 por 100 SO2 NOx Generación Bruta
Universidad de Chile Pontificia Universidad Católica de Chile
Evolution of Energy Use and Emissions

REGULATORY FRAMEWORKS THAT AFFECT THE ENVIRONMENTAL IMPACT OF THE ELECTRICAL
SECTOR
Electrical Law
•Indicative planning: not a guide
•Power plant dispatch: favors polluting sources
Environmental Legislation and the EIA
•Law 19300: Environmental Framework Law
•Law 3.133
•EIA
Universidad de Chile Pontificia Universidad Católica de Chile
Universidad de Chile Pontificia Universidad Católica de Chile
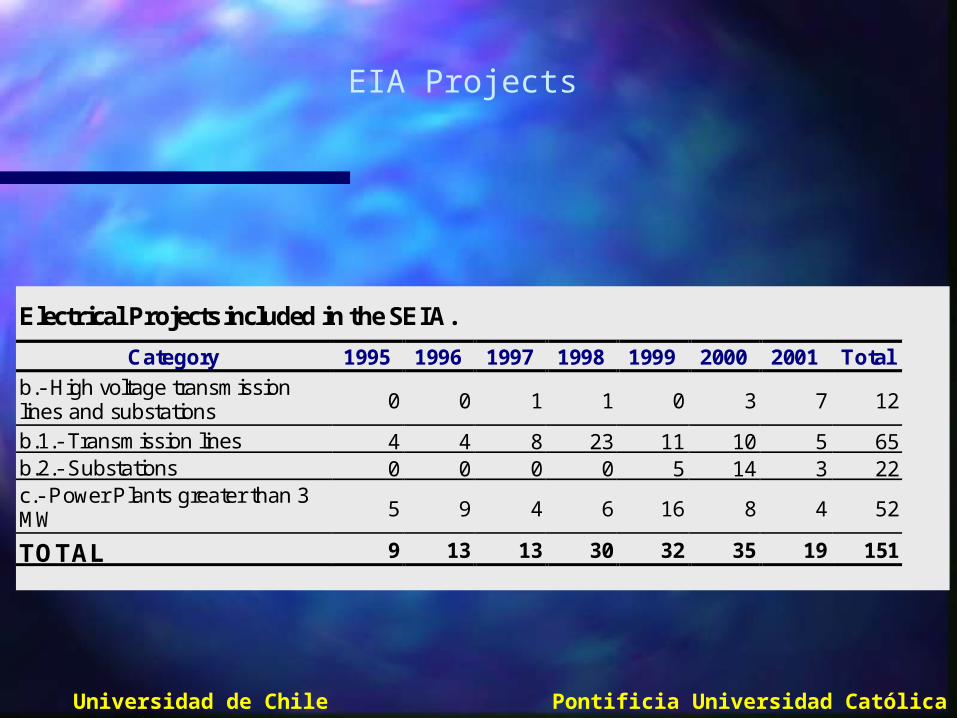
EIA Projects
Electrical Projects included in the SEIA.
Category 1995 1996 1997 1998 1999 2000 2001 Total
b.- High voltage transmissionlines and substations 0 0 1 1 0 3 7 12
b.1.- Transmission lines 4 4 8 23 11 10 5 65b.2.- Substations 0 0 0 0 5 14 3 22c.- Power Plants greater than 3MW 5 9 4 6 16 8 4 52
TOTAL 9 13 13 30 32 35 19 151

ESSENTIAL ISSUES THAT LINK THE ENVIRONMENT AND THE DEREGULATED ELECTRICAL SECTOR
Development of the generation infrastructure
• Plant technology
• Thermal plant location
• Hydro plant development
• Thermal plant fuels
• System operation
Universidad de Chile Pontificia Universidad Católica de Chile

PLANT LOCATION: THE BIO BIO BASIN
Universidad de Chile Pontificia Universidad Católica de Chile
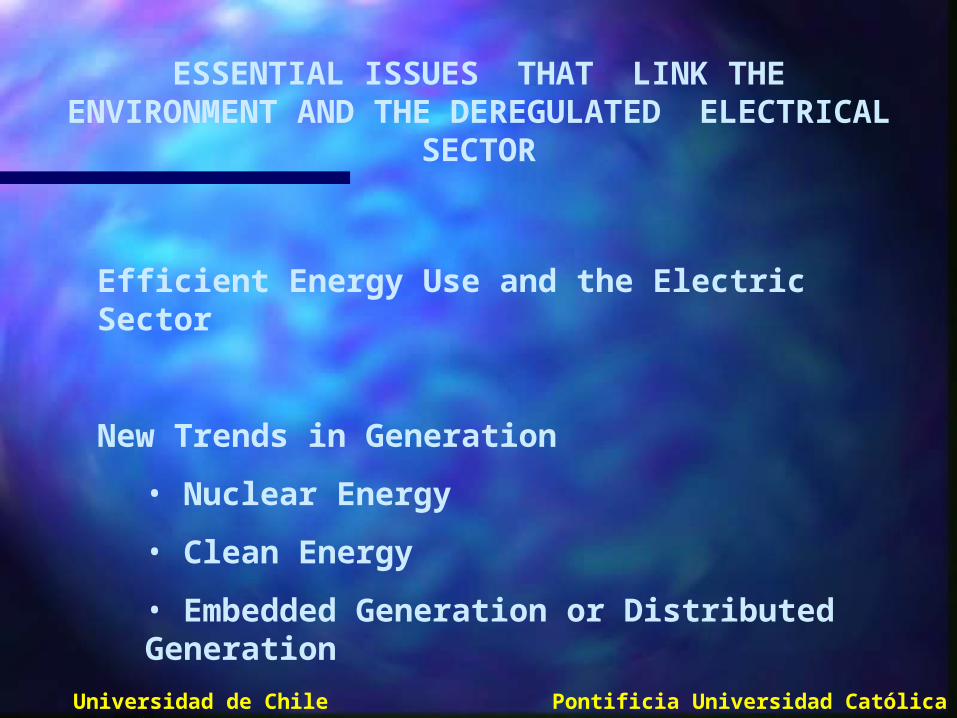
ESSENTIAL ISSUES THAT LINK THE ENVIRONMENT AND THE DEREGULATED
ELECTRICAL SECTOR
Efficient Energy Use and the Electric Sector
New Trends in Generation
• Nuclear Energy
• Clean Energy
• Embedded Generation or Distributed Generation
Universidad de Chile Pontificia Universidad Católica de Chile

IN CONCLUSION
Universidad de Chile Pontificia Universidad Católica de Chile
•CHILE’S ELECTRICAL SYSTEM HAS EXPANDED VERY STRONGLY IN RESPONSE TO THE HIGH ECONOMIC GROWTH RATES OF THE DECADE
•EMISSIONS OF ALL GASES IS INCREASING SIGNIFICANTLY, DESPITE SWITCH TO NATURAL GAS.
•TREND IN GROWTH AND EMISSIONS IS EXPECTED TO CONTINUE.
•TO REDUCE EMISSIONS THERMAL PLANTS MUST BE REPLACED BY LESS POLLUTING SOURCES SUCH AS HYDROELECTRIC POWER PLANTS, OR MORE RADICAL NUCLEAR SOURCES.

IN CONCLUSION
Universidad de Chile Pontificia Universidad Católica de Chile
•A STRONG PUSH IN ENERGY EFFICIENCY MAY HELP, HOWEVER THE POLICIES APPLIED IN THIS LINE OF ACTION HAVE BEEN WEAK.
•CLEAN ENERGIES AND DISTRIBUTED SOURCES CAN HELP TO REDUCE EMISSIONS BUT WILLNOT BE SIGNIFICANT.
•MOREOVER, THE TREND IN THIS DEREGULATED SECTOR SEEMS TO BE GOING IN A DIFFERENT DIRECTION: NATURAL GAS COMBINED CYCLE PLANTS HAVE ACTUALLY DISPLACED SOME HYDROELECTRIC PLANTS.
•DECISIONS ARE BEING TAKEN ON GENERATING TECHNOLOGY,
WITHOUT DUE CONSIDERATION OF SOCIAL COSTS.

IN CONCLUSION
Universidad de Chile Pontificia Universidad Católica de Chile
•THE ENVIRONMENTAL STAKES ARE STILL OUT:•NEW GAS PIPELINES ALSO FEED THE INDUSTRIAL AND DOMESTIC SECTORS. •NATURAL GAS PLANTS HAVE REPLACED COAL PLANTS.
•DISPATCH BY MARGINAL COSTING DOES NOT HELP MUCH, IT IS DIFFICULT TO INCORPORATE ALL SOCIAL COSTS
•COMPANIES SEEKING COMPETITIVE ADVANTAGES ARE EXPLORING THE USE OF CHEAPER MORE POLLUTING FUELS SUCH AS PET-COKE.
•THE AUTHORITY MUST BALANCE EXTRA ENVIRONMENTAL REQUIREMENTS WITH THE ENSUING INCREASE IN ENERGY PRICES. THIS IS NOT AN EASY EQUATION.