liberalization of fdi in retail services: a fast death ... of fdi in retail services: a fast death...
TRANSCRIPT

Liberalization of FDI in Retail Services: a Fast Death Instrument for India?
Csilla LakatosU.S. International Trade Commission
Center for Global Trade Analysis, Purdue University
Tani FukuiU.S. International Trade Commission
October 11, 2012
The views in this presentation are strictly those of the authors and do not represent the opinions of the U.S. International Trade Commission or of any of its commissioners.

Context: FDI Project Map
• Database Construction• Model• Policy Simulation
Data Econometrics Quadratic Optimization
GTAP Model
Policy Simulation
DatabasesQuantified Barriers

BACKGROUND
2

FDI Policy in India• The 1991 economic reforms first liberalized 35 key high‐
priority, highly protected public sectors in manufacturing • Department of Industrial Policy and Promotion, Ministry of
Commerce– Consolidated Foreign Direct Investment Policy– Foreign Investment Promotion Board– Foreign Investment Implementation Authority
• FDI is prohibited in: retail (except single brand), lottery, casinos, chit funds (savings funds), real estate, tobacco, atomic energy and railway transport
3

FDI in Distribution Services in India
• Historical evolution of barriers– Cash & Carry Wholesale Trading: allow 100% foreign ownership since 1997
– Single brand retailing (IKEA, NIKE, APPLE)• 49% foreign ownership since 2006, later fully liberalized in 2011 subject to conditions (30% local sourcing beyond 51%)
– Multi‐brand retailing (Wal‐Mart, Carrefour, Tesco)• Revoke 2011 decision to liberalize as a result of intense social pressure
4

Retail Services Liberalization in India

The distribution sector in numbers ($billions)
Output Exports Value Added Consumption
value % in total value % in total value % in total Value % in total
USA 2895 12% 17 1.2% 1693 13% 1592 16%
China 450 5% 22 1.8% 219 7% 153 13%
India 227 10% 3 1.1% 161 14% 100 14%
East Asia 1438 12% 77 4.8% 830 15% 725 22%
ASEAN 309 11% 18 2.1% 171 14% 120 18%
Aus & NZ 253 13% 7 3.3% 109 13% 135 27%
EU27 2580 8% 130 2.2% 1118 7% 1780 20%
ROW 2071 10% 38 1.1% 1310 13% 1017 16%
World 10224 9% 311 2% 5610 11% 5622 18%
6
Source: GTAP v8

FDI in retailing: pros and cons
Pros– Productivity spillovers
• domestic distribution services • upstream and downstream sectors
– Farmers:• sell directly to organized retailers
– Consumers: • price and quality improvements• access to a wider range of varieties
Cons– Threaten the existence of small retailers in India
– Employment effect: • Each Wal‐Mart worker displaces 1.4 retail workers (Chari and Raghavan, 2012)
• Pushing down wages
7

MODELING FRAMEWORK
8

Motivation
• Develop an integrated framework that makes use of:– Increased data availability on the foreign direct investment and activities of foreign affiliates
– Existing techniques in measuring barriers to FDI• Allow us to quantify the impact of:
– Barriers to investment – Barriers to services trade– Broader policy measures impacting the activities of foreign affiliates
9

GTAP+FDI+MNCs
• Existing Petri (1997), FTAP (Hanslow et al., 2000), the Michigan model (Brown and Stern, 2001), MIRAGE (Bchir et al., 2002) and WorldScan (Lejour et al., 2008)
• Extend the standard, comparative static version of the GTAP model to incorporate– Foreign direct investment– Firms differentiated by location and ownership
• Heterogeneous production technology

The structure of output with foreign commercial presence
Supply of cars in the US
Domestic firms Foreign firms in the US
Affiliates of Japanese MNCs
Affiliates of Korean MNCs ...
FDI e
xten
sion
St
anda
rd G
TA
P m
odel

The structure of investor preferences
Wealth
Domestic investment
Investment in sector 1
Investment in sector 2
Investment in sector 3 ...
Foreign investment
Investment in region 1
Investment in region 2
Investment in sector 1
Investment in sector 2
Investment in sector 3
...
....

DATA SOURCES
13

Data sources
• Create an extended GTAP database that accounts for FDI and foreign affiliates– FDI stocks (bilateral and sector specific) based on Gouel et al (2012)
– Activities of foreign affiliates based on Fukui and Lakatos (2012)
• Sales (bilateral and sector specific)• Value added (bilateral and sector specific)
– Share of domestic ownership: OECD
14

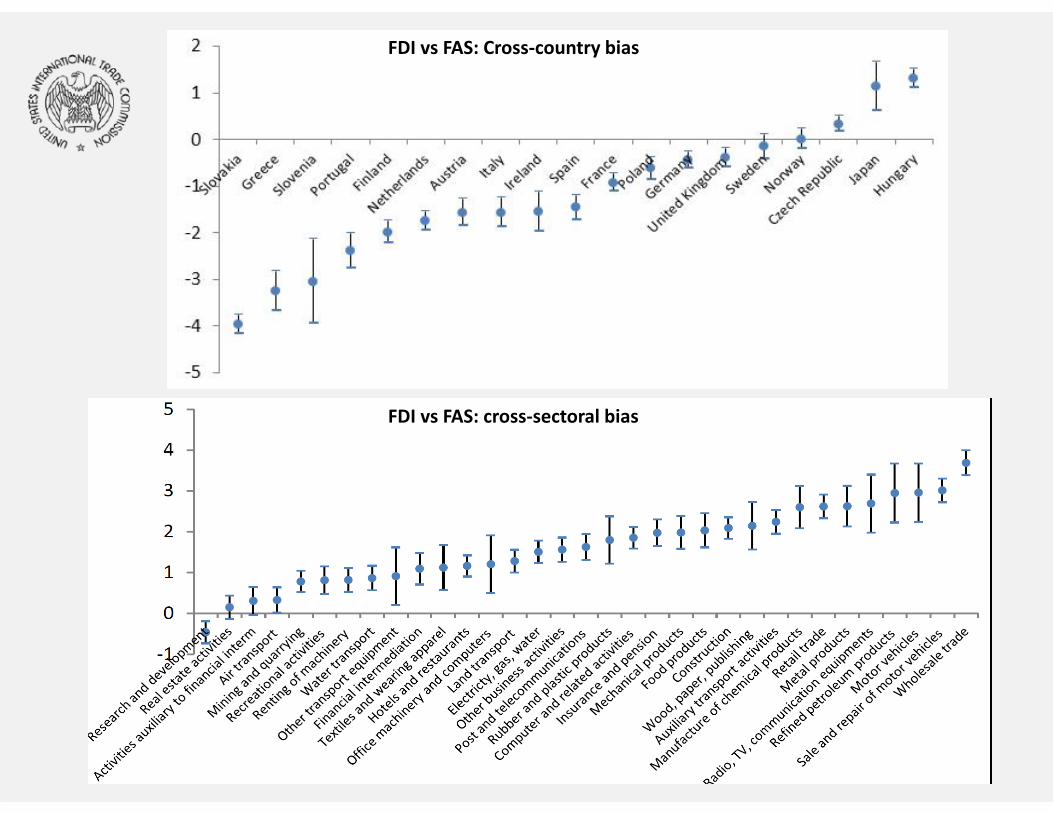
FDI vs Foreign Affiliate Sales
• FDI often used as a proxy for FAS• FDI is a biased predictor (Beugelsdijk et al., 2010)
– Systematic variation by country and by sector• underestimation of foreign affiliate activity in countries with well‐developed financial markets
• FDI in countries that are tax havens generate no actual productive activity
• Sectors that are capital intensive (mining) should see an overestimation of foreign affiliate sales
15
16
FDI vs FAS: Cross‐country bias
FDI vs FAS: cross‐sectoral bias

The composition of FAS
17
68.84
0.02 0 0.5 0.17 0.08
29.93
0.460
10
20
30
40
50
60
70
80
90
100
USA China India EAsia ASEAN AusNz EU27 ROW
FAS: share in total host by source (distribution)
USA China India East ASEAN AusNz EU27 ROW
33.77
0.03 0
20.47
0.19 2.48
42.37
0.70
10
20
30
40
50
60
70
80
90
100
USA China India EAsia ASEAN AusNz EU27 ROW
FAS: share in total host by source (all sectors)
USA China India East ASEAN AusNz EU27 ROW

The composition of FDI stocks
18
13.3
1.3 0
8.8
1.3 0.6
69.6
5.2
0
10
20
30
40
50
60
70
80
90
100
USA China India EAsia ASEAN AusNz EU27 ROW
FDI stocks: share in total host (all sectors)
USA China India East ASEAN AusNz EU27 ROW
3.20 0
16.8
0 0
79.9
0.10
10
20
30
40
50
60
70
80
90
100
USA China India EAsia ASEAN AusNz EU27 ROW
FDI: share in total host (distribution)
USA China India East ASEAN AusNz EU27 ROW

Foreign affiliate’s value addedL/VA
Source countries
USA EU27 China India East Asia ASEAN Aus & Nz RoW
Host cou
ntrie
s
USA 0.609 0.575 0.575 0.558 0.568 0.535 0.568
EU27 0.275 0.452 0.543 0.538 0.611 0.54 0.613
China 0.369 0.469 0.417 0.469 0.43 0.475 0.435
India 0.423 0.394 0.357 0.394 0.355 0.4 0.36
East Asia 0.385 0.658 0.621 0.606 0.619 0.664 0.624
ASEAN 0.316 0.461 0.423 0.408 0.46 0.466 0.426
Aus & Nz 0.209 0.69 0.652 0.637 0.689 0.65 0.655
RoW 0.409 0.487 0.449 0.435 0.486 0.448 0.492
19

Shares of ownership
Share of ownership in distribution (%)
Domestic Foreign
USA 0.76 0.24
China 0.94 0.06
India 0.97 0.03
East 0.84 0.16
ASEAN 0.93 0.07
AusNz 0.90 0.10
EU27 0.92 0.08
ROW 0.88 0.12
20
Source: OECD Statistics on Measuring Globalization and authors’ calculations

MEASURING BARRIERS TO DISTRIBUTION SERVICES
21

Nature of barriers• Distribution services rely heavily on establishing foreign commercial presence
• UNCTAD (1996)– Barriers to entry and establishment
• Closing certain sectors to FDI, minimum capital requirements, restrictions on forms of entry
– Barriers to ownership and control• Restrictions on foreign ownership, compulsory joint ventures, restrictions on licensing foreign technology
– Barriers to the ongoing operations of MNCs• Restrictions on employment of foreign personnel, on imports of capital goods, rules of origin
22

Econometric specification• Regression follows Bergstrand and Egger (2007), and Carr et
al. (2007), with extension to industry data • FAS and FDI stocks from Eurostat database• FDI restrictiveness index from Koyama and Golub, 2006
• r=host; s=source; i=industry; t=time23
irst
ttrstrstrst
rstrst
strt
irtrststirst
irstt
trstrstrst
rstrst
strt
irtrststirst
USUS
USUS
///lnbarriers investmentlnopenness tradelnlanguage commonln
distanceGDP/capitalnGDP/capitalnproductionlnGDPROWlnGDPlnFDI
///lnbarriers investmentlnopenness tradelnlanguage commonln
distanceGDP/capitalnGDP/capitalnproductionlnGDPROWlnGDPlnFAS
87
66
654
3210
87
66
654
3210

24
Index % Sales % FDIUSA 0 0 0EU27 0.013 0.71% 1.88%China 0.238 13.09% 34.38%India 0.394 21.67% 56.91%East Asia 0.087 4.79% 12.57%ASEAN 0.158 8.68% 22.82%Aus & Nz 0.099 5.43% 14.30%ROW 0.075 4.15% 10.83%
OECD (Kalinova et al., 2010)
Restrictiveness index in distribution services
Implied quantity change of reducing barriers to zero
(elasticity = 0.55 sales and 1.44 FDI)

SIMULATIONS
25

Simulations
• Unilateral liberalization of barriers to barriers to foreign commercial presence in India– S1a: removal of 75% of barriers to FDI and foreign affiliates in distribution services in India
– S1b: S1a + 3.8% productivity spillovers to the domestic distribution industry in India
– S1c: S1b + 3.8% exogenous productivity spillovers to upstream (agriculture) supplying industries in India
• Multilateral liberalization of distribution services trade under GATS mode 3
26

RESULTS
27

Output in India
Source country
USA China India East Asia ASEAN Aus & Nz EU27 ROW Total
Agriculture 9.0 13.6 3.8 9.6 9.3 9.0 10.1 9.0 4.0
Mining 0.0 0.0 0.0 0.1 0.0 0.0 0.0 0.0 0.0
Manufacturing ‐0.1 0.0 1.5 ‐0.1 0.0 0.0 ‐0.1 ‐0.1 1.4
Distribution 355.2 54.3 2.2 190.3 63.2 529.5 201.3 55.4 10.9
Transport 0.0 0.0 0.7 0.0 0.0 0.0 0.0 0.0 0.7
Other serv ‐0.1 ‐0.1 0.1 ‐0.1 ‐0.1 ‐0.1 0.0 ‐0.1 0.1
28
Source: authors’ simulations (% change)

Investment in IndiaForeign
investmentDomestic investment
Agriculture 2.18 ‐0.15
Mining ‐0.03 ‐0.04
Manufacturing ‐0.08 0.27
Distribution 13.46 ‐0.19
Transport ‐0.07 0.12
Other services ‐0.06 0.06
29
Source: authors’ simulations (% change)
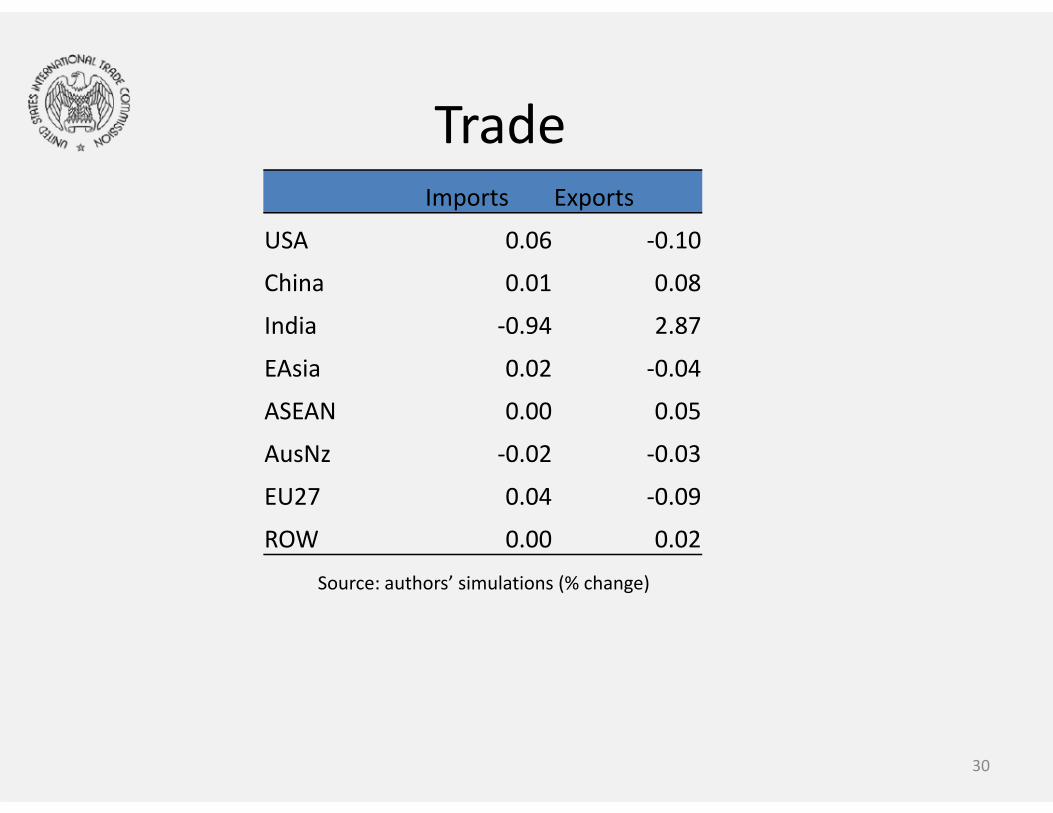
TradeImports Exports
USA 0.06 ‐0.10
China 0.01 0.08
India ‐0.94 2.87
EAsia 0.02 ‐0.04
ASEAN 0.00 0.05
AusNz ‐0.02 ‐0.03
EU27 0.04 ‐0.09
ROW 0.00 0.02
30
Source: authors’ simulations (% change)

Macro Indicators
31
S1a – removal of barriers only
S1c – removal of barriers + productivity spillovers

Conclusion
• GTAP+FDI+MNCs – a powerful framework for considering the impact of a wide range policy instruments
• Future work: gather/incorporate additional data on the activities of foreign affiliates – Exports and imports (intra‐firm trade literature)– Royalty payments– Growth on the extensive margin
• Liberalization of FDI in retail in India: a Fast Death Instrument?
32