lgip quarterly meeting & conference call quarterly meeting & conference call. ... repurchase...
TRANSCRIPT

OFFICE OF THE ARIZONA STATE TREASURER
Nov. 13, 2014
LGIP QUARTERLY MEETING &
CONFERENCE CALL

ARIZONA STATE TREASURER DOUG DUCEY
AGENDA
LGIP Performance
Endowment Performance and Distributions
Pooled Collateral Program
State Cash Flow
Guest Presentation:State Budget Outlook from JLBC
Q & A

ARIZONA STATE TREASURER DOUG DUCEY
INVESTMENT PHILOSOPHY
SAFETYbefore
LIQUIDITYbefore
YIELD
ARIZONA STATE TREASURER DOUG DUCEY
EARNINGS FOR Q1 FY 2015
$33,076,460

LGIP PERFORMANCEQ1 FY2015

ARIZONA STATE TREASURER DOUG DUCEY
Pool 5 – LGIPSAFETY: Distribution of Holdings
(Moody's Ratings)
LIQUIDITY: 85.9% of Assets Mature Within 90 Days YIELD: .08% (Sept. 2014)
Rated AAAf (Highest Rating Available)
$1.1 Billion in Assets as of 9/30/2014
100% Duration Inside 1 year
Diversified Highly Rated Investments Including
Repurchase Agreements, Commercial Paper,
and Government Securities
85.9% of the Assets are Cash Equivalent
Securities

ARIZONA STATE TREASURER DOUG DUCEY
Pool 7 – Gov’t LGIPSAFETY: Distribution of Holdings
(Moody's Ratings)
LIQUIDITY: 78% of Assets Mature Within 90 Days YIELD: .05% (Sept. 2014)
$852 Million in Assets as of 9/30/2014
100% Duration Inside 1 year
100% of the Assets are Guaranteed by the Full
Faith and Credit of the United States of
America
78% of the Assets are Cash Equivalent
Securities
0%
20%
40%
60%
80%
100%
120%
AAA

ARIZONA STATE TREASURER DOUG DUCEY
Pool 500 – Medium Term LGIPSAFETY: Distribution of Holdings
(Moody's Ratings)
LIQUIDITY: 23% of Assets Mature Within 90 Days YIELD: 1.10% (Sept. 2014)
$254 Million in Assets as of 9/30/2014
Net Asset Value (share price) of $1.0315 as of
9/30/2014
50% Duration Inside 1 year
100% of the Assets are Investment Grade or
Better (60% are rated AAA)
Well Diversified Portfolio of Assets With No
More Than 2.5% Exposure to Any Single
Corporate Asset

ARIZONA STATE TREASURER DOUG DUCEY
Pool 700 – Gov’t Medium Term LGIPSAFETY: Distribution of Holdings
(Moody's Ratings)
LIQUIDITY: 27% of Assets Mature Within 90 Days YIELD: Sept: .88%
$165 Million in Assets as of 9/30/2014
Net Asset Value (Share Price) of $1.0047 as of
9/30/2014
38% Duration Inside 1 year
100% of the Assets are Guaranteed by the Full
Faith and Credit of the United State of America
Well Diversified Portfolio of Assets Across All
available U.S. Full Faith and Credit Securities

OFFICE OF THE ARIZONA STATE TREASURER
ENDOWMENT
PERFORMANCEQ1 FY2015
ARIZONA STATE TREASURER DOUG DUCEY
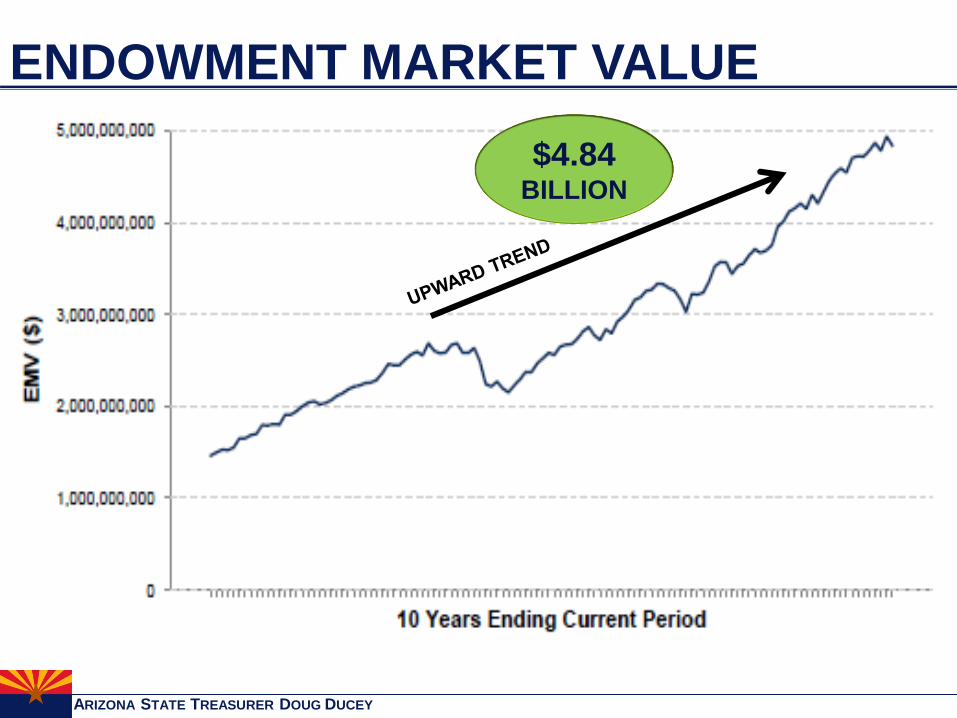
ENDOWMENT MARKET VALUE
$4.84 BILLION

ARIZONA STATE TREASURER DOUG DUCEY
ENDOWMENT UNREALIZED GAINS
-$0.50
$0.00
$0.50
$1.00
$1.50
$2.00
$2.50
De
cem
be
r 2
00
6
Mar
ch 2
00
7
Jun
e 2
007
Sep
tem
be
r 2
007
De
cem
be
r 2
00
7
Mar
ch 2
00
8
Jun
e 2
008
Sep
tem
be
r 2
008
De
cem
be
r 2
00
8
Mar
ch 2
00
9
Jun
e 2
009
Sep
tem
be
r 2
009
De
cem
be
r 2
00
9
Mar
ch 2
01
0
Jun
e 2
010
Sep
tem
be
r 2
010
De
cem
be
r 2
01
0
Mar
ch 2
01
1
Jun
e 2
011
Sep
tem
be
r 2
011
De
cem
be
r 2
01
1
Mar
ch 2
01
2
Jun
e 2
012
Sep
tem
be
r 2
012
De
cem
be
r 2
01
2
Mar
ch 2
01
3
Jun
e 2
013
Sep
tem
be
r 2
013
De
cem
be
r 2
01
3
Mar
ch 2
01
4
Jun
e 2
014
Sep
tem
be
r20
14
Bill
ion
s
Total Endowment Unrealized gains/losses
$1.89 BILLION

ARIZONA STATE TREASURER DOUG DUCEY
ENDOWMENT ASSET ALLOCATION
$1,600.04M
$1,052.42M
$502.79M$1,549.4 million
$1,122.1 million
$542.2 million
Endowment Market Value
$4,839,106,749 as of 9/30/2014

ARIZONA STATE TREASURER DOUG DUCEY
K-12 DISTRIBUTIONS

OFFICE OF THE ARIZONA STATE TREASURER
POOLED COLLATERAL
PROGRAM
ARIZONA STATE TREASURER DOUG DUCEY
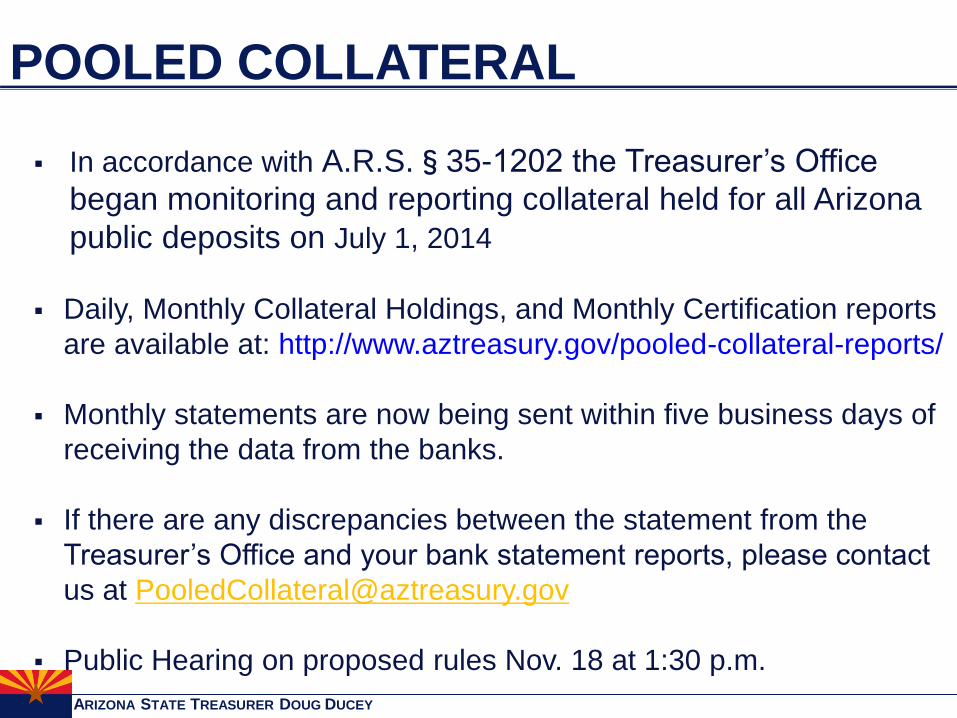
POOLED COLLATERAL
In accordance with A.R.S.§35-1202 the Treasurer’s Office
began monitoring and reporting collateral held for all Arizona
public deposits on July 1, 2014
Daily, Monthly Collateral Holdings, and Monthly Certification reports
are available at: http://www.aztreasury.gov/pooled-collateral-reports/
Monthly statements are now being sent within five business days of
receiving the data from the banks.
If there are any discrepancies between the statement from the
Treasurer’s Office and your bank statement reports, please contact
us at [email protected]
Public Hearing on proposed rules Nov. 18 at 1:30 p.m.

ARIZONA STATE TREASURER DOUG DUCEY
DAILY REPORT

ARIZONA STATE TREASURER DOUG DUCEY
MONTHLY COLLATERAL REPORT

ARIZONA STATE TREASURER DOUG DUCEY
MONTHLY CERTIFICATION REPORT

OFFICE OF THE ARIZONA STATE TREASURER
STATE CASH FLOW
ARIZONA STATE TREASURER DOUG DUCEY
-$1,000
-$500
$0
$500
$1,000
$1,500
$2,000
$2,500
$3,000
Millions
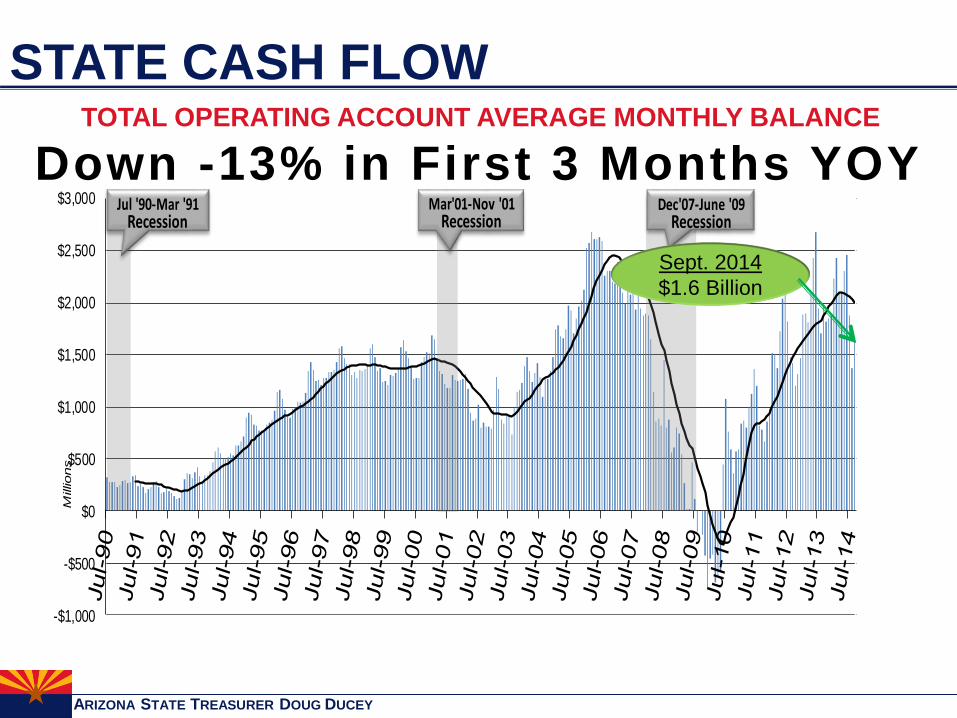
Jul '90-Mar '91Recession
Mar'01-Nov '01Recession
Dec'07-June '09Recession
STATE CASH FLOWTOTAL OPERATING ACCOUNT AVERAGE MONTHLY BALANCE
Sept. 2014
$1.6 Billion
Down -13% in First 3 Months YOY

ARIZONA STATE TREASURER DOUG DUCEY
STATE CASH FLOW
YTD FY 2015 Cash Flow vs. Last Two Fiscal Years

OFFICE OF THE ARIZONA STATE TREASURER
Special Presentation
Richard Stavneak
Director
Joint Legislative Budget Committee

Revenue and Budget UpdateQuarterly Treasurer Meeting
November 13, 2014
JLBC

JLBC 25
Summary of Current Budget Status
At the end of May, the projected current year (’15) ending balance was $130 M – but ‘16 had a $(237) M shortfall
Revenue growth has slowed considerably in the interim, and the new forecast is more cautious
As a result, shortfalls are now projected in both years:
• $(189) M in ‘15 and $(667) M in ‘16
The Superior Court K-12 inflation ruling would further increase the budget gap:
• $(520) M in ‘15 and $(1.0) B in ‘16

JLBC 26
Implications of FAC Update and K-12 Litigation- Does Not Reflect Impact if Litigation Back Payments Are Awarded
Potential Ending Balance Estimates$ in M
After: ’15 ’16
• May Special Session $130 $(237)
• October FAC Update (189) (667)
• FAC Update + K-12 Reset (520) (1,002)
Estimates assume that ‘15 shortfall is resolved with 1-time solutions prior to ’16

JLBC 27
The Caveats
‘14 again demonstrated the challenge in forecasting revenues accurately
• 1% error across 3 years changes balance by $575 M
• Some revenue sources inherently volatile
AZ revenue performance at odds with recent favorable US economic news
• If national momentum is sustained, there is upside potential for AZ by Spring
• Higher growth would help, but not resolve, the shortfall. If growth was a “strong” 7% in ‘16, shortfall declines $(267) M.
JLBC
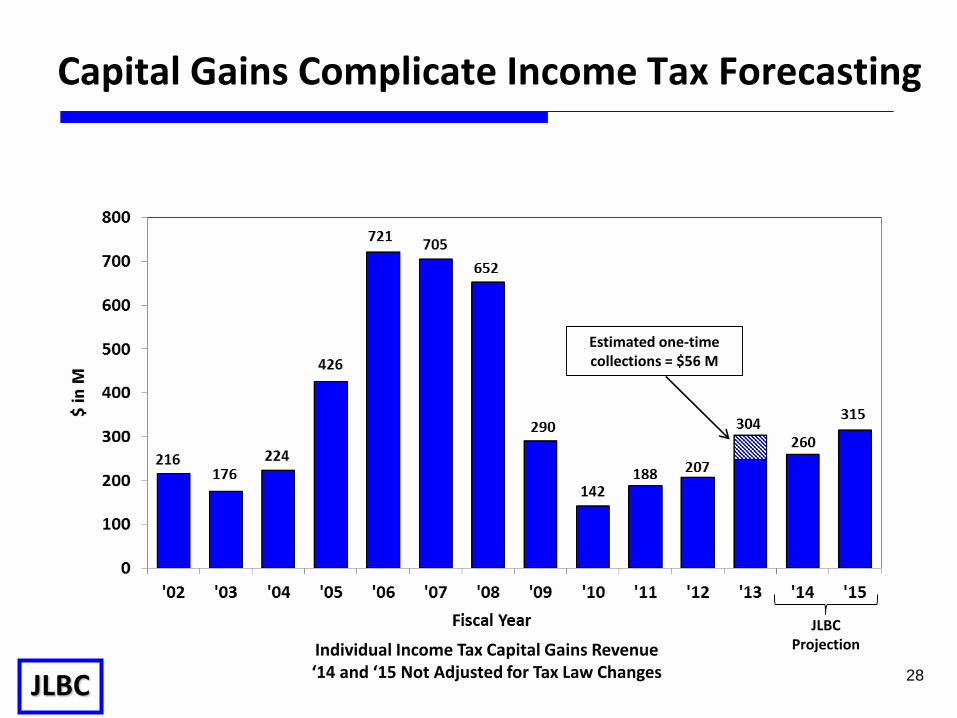
Capital Gains Complicate Income Tax Forecasting
JLBC Projection Individual Income Tax Capital Gains Revenue
‘14 and ‘15 Not Adjusted for Tax Law Changes
Estimated one-time collections = $56 M
28
JLBC 29
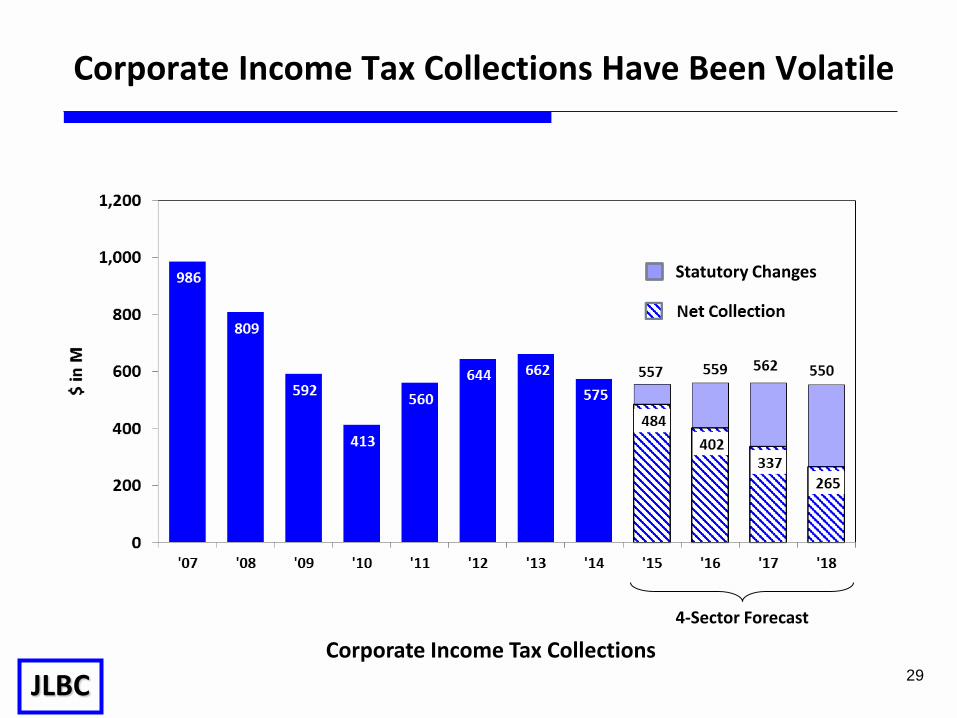
Corporate Income Tax Collections Have Been Volatile
4-Sector Forecast
Statutory Changes
Corporate Income Tax Collections

Revenue Forecast

JLBC 31
Arizona’s Current Economic Challenges- Should We Re-Base Our Long-Term Expectations?
Annual 2% job growth – historical norm of 3.9%
Flat wages
1% - 1.5% population growth – historical norm of 3.1%
18,000 building permits in last year – historical norm of 38,000
U.S. household formation declining
Federal defense contract reductions

JLBC 32
Revenue Growth Near 3% for Last 16 Months
‘14 Budgeted ‘14 Actual’15 1st
Trimester
Sales 5.7% 5.5% 2.7%
Individual Income 3.7% 1.9% 1.6%
Corporate Income (3.5)% (13.1)% 6.7%
Overall 3.9% 2.7% 3.1%
With preliminary October estimates, revenues have been below forecast for 7 consecutive months
‘14 revenues $(86) M short of forecast, ‘15 already $(82) M short of enacted forecast

JLBC 3333
Where Are We Headed Over the Next Few Years?- Four-Sector Consensus Forecast Incorporates
Different Economic Views, Including the FAC
4-sector forecast equally weights:
FAC average
UofA model – base
UofA model – low
JLBC Staff forecast
Remaining revenues (8% of total) are staff forecast
* Includes Big 3 categories of sales tax, individual income and corporate income taxes
JLBC
25%
UA - Low
25%
FAC
Consensus
25%
UA - Base
25%

JLBC 34
Was ‘14 an outlier or a precursor?
3.1% 1st Trimester ‘15 Growth
Higher-than-average chance that forecast improves by Spring
Slow Growth Predicted Through ‘16; 5% in ‘17 & ‘18
Percent Change in Base revenues excluding balance forward, statutory changes, one-time revenues,
and urban revenue sharing

JLBC 35
Phase-In of $226 M of Enacted Tax Reductions
Corporate Rate Reduction/Sales Factor
25% Capital Gains Reduction
1-time Income Tax Indexing
Corporate School Tuition Indexing
Other
Total
‘16
(57)
(12)
(6)
(9)
(16)
(100)
$ in M
‘17
(50)
0
6
(10)
(7)
(61)
‘18
(48)
0
0
(12)
(5)
(65)
By ‘18, revenue base is forecast to be a total of $226 M lower than if no enacted changes

JLBC 36
The Last Decade of General Fund Revenues
Excludes balance forward and other one-time revenues. Includes tax law changes and Urban Revenue Sharing.

Spending Forecast

JLBC
Enacted budget figures have been updated to reflect latest estimated changes to currently active statutory and other funding formulas
Spending estimates assume the continued annual suspension of $374 M of inactive formulas – mostly ADE funding
Assumes continuation of $1.2 B in “rollover” payments
Assumes no discretionary spending increases
3838
Updated ‘16 – ‘18 Spending Projections

JLBC
’16
175
57
(11)
8
(45)
0
(62)
122
$9,451
$336
$9,787
’17
209
117
(8)
(1)
0
30
(6)
341
$9,792
$341
$10,133
’18
162
131
0
0
0
0
3
296
$10,088
$346
$10,434
$ in M
3939
Projected Baseline Spending Changes
K-12 Formula
Medicaid Formula
DCS 1-Time Backlog
ADC Operating
Capital
HURF Shift ($30 M to $60 M)
One-Time/Other
Additional Spending
Total Spending
K-12 Inflation Reset
Revised Total

Projected Ending Balance Estimates

JLBC 4141
Baseline ’15 ’16 ’17 ’18
Balance Forward $577 M -- -- --
Revenues $8.56 B $8.78 B $9.20 B $9.65 B
Spending $9.66 B $9.79 B $10.13 B $10.43 B
Ending Balance $(520) M $(1.0) B $(928) M $(787) M
Includes $336 M K-12 inflation reset
Without reset, ’15 shortfall is $(189) M and ’16 is $(667) M
Does not include $460 M Rainy Day Fund
Updated ’15 – ’18 Ending Balance Projections- October FAC Revenue With Updated Agency Caseload

JLBC 42
The Path from a Healthy Surplus to a Large Shortfall- Even Without the K-12 Litigation
The state never resolved its underlying structural shortfall
When the $900 M 1-cent sales tax ended in ‘13, we replaced it with a $900 M 1-time carryforward in ‘14
Insufficient attention to the statutory 3 year planning estimates --we enacted a ‘15 budget with projected shortfalls of $(237) M in ‘16 and $(490) M in ‘17
3% revenue growth compared to budgeted 4%-5% growth
K-12 litigation
Long term commitments significantly in advance of paying the cost

JLBC 43
Reflects only ongoing revenue and spending
1-cent sales tax and carryforward kept‘12-’14 balanced
The Ongoing Structural Shortfall Helped Create the Current Problem

JLBC 44
How Will the Current Shortfall be Resolved?- In ’08 - ’12, Most of the Solutions were One-time
Budget solutions as share of cumulative $13.4 B shortfall

JLBC 45
Fiscal Policy Goals
Eliminate structural shortfall
Develop multi-year solution with targets – reduce reliance on 1-time solutions over time
Long term goal: set aside 1-time revenues
• Excess ending balances
• Excess capital gains
Dedicate 1-time $ for 1-time purposes
• Rebates
• Operating debt buyback - $84 M annual debt payment
• Infrastructure
• IT Modernization

JLBC 46
California Just Approved Ballot Initiative to Address Volatility
1.5% of annual General Fund revenue will be deposited into Rainy Day Fund
Excess capital gains income tax collections will be deposited into the fund as well
50% of fund will be used to buy down state debts, including unfunded retirement and operating loans
Rainy Day Fund capped at 10% of GF revenue; excess dedicated to infrastructure
Emergency provisions allow deposit requirements to be suspended

JLBC 4747
Appendix A: October 2014 4-Sector Forecast2015 2016 2017 2018
Sales Tax
JLBC Forecast 4.1% 4.5% 4.8% 5.0%
UA – Low 2.8% 3.1% 5.2% 6.2%
UA – Base 5.0% 6.1% 7.3% 7.2%
FAC 4.1% 4.1% 4.9% 4.7%
Average: 4.0% 4.5% 5.6% 5.8%
Individual Income Tax
JLBC Forecast 4.5% 5.4% 5.0% 5.0%
UA – Low 1.2% 2.9% 4.9% 6.2%
UA – Base 3.7% 5.6% 6.3% 7.0%
FAC 3.4% 4.5% 4.6% 4.6%
Average: 3.2% 4.6% 5.2% 5.7%
Corporate Income Tax
JLBC Forecast (3.3)% 1.0% 3.5% 4.5%
UA – Low (1.0)% (0.2)% (6.3)% (10.2)%
UA – Base 1.6% 6.0% 0.1% (7.4)%
FAC (10.3)% (5.9)% 6.3% 6.5%
Average: (3.2)% 0.4% 0.6% (2.0)%
JLBC Weighted Average 3.7% 4.7% 4.8% 5.0%
UA Low Weighted Average 1.8% 2.8% 4.5% 5.7%
UA Base Weighted Average 4.2% 5.9% 6.5% 6.5%
FAC Consensus Weighted Average 2.8% 3.7% 4.8% 4.7%
“Big-3” Weighted Average 3.1% 4.3% 5.2% 5.4%
Consensus Weighted Average* 3.4% 4.1% 5.1% 5.2%
Adjusted Consensus Weighted Average** 2.2% 3.0% 4.4% 4.6%
* Adjusted for small revenue categories
** Adjusted for tax law changes
OFFICE OF THE ARIZONA STATE TREASURER
QUESTIONS?