(lf) - eurobankam.gr · units outstanding interamerican 2 540 183.286 1 963 115.039 - units...
TRANSCRIPT

(LF) A mutual investment fund organised under the laws
of the Grand Duchy of Luxembourg
Semi-Annual Report
(Non audited)
June 30, 2017
No subscription can be received on the basis of financial reports.
Subscriptions are only valid if made on the basis of the current
prospectus accompanied by the latest annual report and the most recent
semi-annual report, if published thereafter. Past performance is not
necessarily an indication of future performance.
R.C.S. Luxembourg: B 115125
R.C.S.K:1689

2
Table of contents
Organisation of the Fund 3
Board of Directors of the Management Company 4
Statement of Net Assets and Statistics 5
Schedule of investments
• (LF) Equity - Global Equities Fund 19
• (LF) Equity - Emerging Europe Fund 22
• (LF) Equity - Greek Equities Fund 25
• (LF) Income Plus $ Fund 27
• (LF) Absolute Return Fund 29
• (LF) Special Purpose Dual Formula Fund 32
• (LF) Special Purpose Blue Chips Protect Fund 33
• (LF) Special Purpose Blue Chips Protect II Fund 34
• (LF) Special Purpose Blue Chips Protect III Fund 35
• (LF) Income Plus (RON) 36
• (LF) Balanced - Active Fund (RON) (has absorbed (LF) Special Purpose - 7.5% Equity Formula (RON) on June 14, 2017) 37
• (LF) Equity - Flexi Style Greece Fund 38
• (LF) Income Plus € Fund (has absorbed (LF) Special Purpose All Weather Plus Fund) on March 29, 2017) 39
• (LF) Greek Government Bond Fund 40
• (LF) Total Return Fund 41
• (LF) Money Market Fund - Reserve 44
• (LF) Global Bond Fund 46
• (LF) Equity - Middle East - North Africa Fund 48
• (LF) Special Purpose Best Performers Fund 50
• (LF) Greek Corporate Bond Fund 51
• (LF) Special Purpose Best Performers II Fund 53
• (LF) Special Purpose Best Performers III Fund 54
• (LF) Special Purpose Best Performers IV Fund 55
• (LF) Special Purpose Best Performers V Fund 56
• (LF) Special Purpose Best Performers VI Fund 57
• (LF) Special Purpose Step Up Formula (RON) Fund 58
Notes to the financial statements 59

3
(LF) Organisation of the Fund
Management Company Eurobank Fund Management Company (Luxembourg) S.A. 5, rue Jean Monnet
L-2180 Luxembourg
Grand Duchy of Luxembourg
Depositary, Administrative, Registrar, Transfer and Luxembourg Paying
and Domiciliation Agent Eurobank Private Bank Luxembourg S.A.
5, rue Jean Monnet
L-2180 Luxembourg
Grand Duchy of Luxembourg
Investment Manager Eurobank Asset Management Mutual Fund Management Company S.A. 10, Stadiou Str.,
GR-105 64 Athens
Greece
Auditor PricewaterhouseCoopers, Société coopérative 2, rue Gerhard Mercator
B.P. 1443
L-1014 Luxembourg
Grand Duchy of Luxembourg
Distributor Eurobank Ergasias S.A. 8, Othonos Street
10557 Athens
Greece

4
Board of Directors of the Management Company
Mr. Theofanis Mylonas Chairman
Chief Executive Officer
Chairman of the Board of Directors
Eurobank Asset Management Mutual Fund Management Company S.A.,
Greece
Mr. Agamemnon Kotrozos Vice Chairman
Chief executive Officer
Eurobank Fund Management Company (Luxembourg) S.A.,
Grand Duchy of Luxembourg
Mr. Georgios Vlachakis Director
Managing Director
Eurobank Fund Management Company (Luxembourg) S.A.,
Grand Duchy of Luxembourg
Mrs. Eleni Koritsa Director
Deputy Chief Executive Officer
Eurobank Asset Management Mutual Fund Management Company S.A.,
Greece
Dr. Dimitrios D. Thomakos Director
Quantitative Advisor
Eurobank Ergasias S.A. and Eurobank Asset Management Mutual Fund Management Company
S.A.,
Greece

Statement of Net Assets
as at June 30, 2017
(LF) (LF) (LF) (LF)
Combined Equity - Global
Equities Fund
Equity - Emerging
Europe Fund
Equity - Greek Equities
Fund
Currency Notes EUR EUR EUR EUR
Assets
Securities portfolio at market value 2 944 293 519.62 23 671 272.74 9 164 462.62 13 312 890.00
Unrealised gain on financial futures 2, 7 371 502.52 - - -
Financial derivative instruments: options, swaps and
forward foreign exchange contracts 2, 7 17 895 589.89 - - -
Cash at bank 2 308 588 172.86 1 982 782.17 452 895.56 722 283.24
Formation expenses 2 11.01 - - -
Receivable on interest and dividends 3 114 080.83 4 709.23 65 746.16 48 504.11
Receivable on securities 322 041.24 - - -
Receivable on subscriptions 177 676.29 23 277.97 - -
Collateral to swap contracts 7 150 750.00 - - -
Other assets 135 257.51 1 762.68 909.10 2 046.25
Total assets 1 275 048 601.76 25 683 804.79 9 684 013.44 14 085 723.60
Liabilities
Unrealised loss on financial futures 2, 7 2 079.16 2 079.16 - -
Financial derivative instruments: options, swaps and
forward foreign exchange contracts 2, 7 92 053.30 - - -
Subscriptions in advance 261 222.43 - - 22 790.00
Other payable and accrued expenses 3 459 859.84 54 850.15 23 781.45 33 192.93
Payable on redemptions 2 138 826.32 523 178.36 28 908.33 8 385.80
Dividend payable 82 969.96 - - -
Collateral to swap contracts 7 20 124 201.00 - - -
Total liabilities 26 161 212.01 580 107.67 52 689.78 64 368.73
0.00
1 248 887 389.75
Total net assets at the end of the period / year 1 248 887 389.75 25 103 697.12 9 631 323.66 14 021 354.87
Information summary
Units outstanding Eurobank 9 933 598.398 4 078 251.122 54 834 501.506
Units outstanding Eurobank I 6 252 989.000 5 332 402.599 3 339 697.733
Units outstanding Eurobank (USD) 727 531.997 11 480.512 -
Units outstanding Postbank - 172 628.004 -
Units outstanding Postbank (BGN) - 27 657.163 -
Units outstanding Interamerican 2 540 183.286 1 963 115.039 -
Units outstanding Interamerican I - - -
Units outstanding Bancpost (EUR) - - -
Units outstanding Bancpost (RON) - 270 824.968 -
Units outstanding Prelium A - - -
Units outstanding Prelium B - - -
Units outstanding Private Banking Class 780 130.236 4 125.413 992 648.899
Units outstanding Private Banking Class (USD) 117 542.233 - -
Units outstanding Private Banking Dis - - -
Net asset value per unit : Eurobank EUR 1.1997 EUR 0.7746 EUR 0.2361
Net asset value per unit : Eurobank I EUR 1.3135 EUR 0.8318 EUR 0.2520
Net asset value per unit : Eurobank (USD) USD 1.3696 USD 14.5058 -
Net asset value per unit : Postbank - EUR 0.7482 -
Net asset value per unit : Postbank (BGN) - BGN 1.4098 -
Net asset value per unit : Interamerican EUR 1.1903 EUR 0.7804 -
Net asset value per unit : Interamerican I - - -
Net asset value per unit : Bancpost (EUR) - - -
Net asset value per unit : Bancpost (RON) - RON 3.4770 -
Net asset value per unit : Prelium A - - -
Net asset value per unit : Prelium B - - -
Net asset value per unit : Private Banking Class EUR 1.1993 EUR 0.7745 EUR 0.2361
Net asset value per unit : Private Banking Class (USD) USD 1.3685 - -
Net asset value per unit : Private Banking Dis - - -
Cost of securities portfolio 918 498 922.38 17 527 145.53 9 322 264.81 10 510 056.84
Total Investments
The accompanying notes form an integral part of these financial statements. 5

Statistics
(LF) (LF) (LF)
Equity - Global
Equities Fund
Equity - Emerging
Europe Fund
Equity - Greek Equities
Fund
Currency EUR EUR EUR
Total net assets at period/year ended:
31/12/2015 33 354 446.80 10 562 795.88 11 778 441.51
31/12/2016 24 809 095.95 13 962 753.77 11 283 780.07
30/06/2017 25 103 697.12 9 631 323.66 14 021 354.87
N.A.V. per unit at period/year ended "Eurobank" unit :
31/12/2015 EUR 1.0797 EUR 0.6473 EUR 0.1877
31/12/2016 EUR 1.1745 EUR 0.8257 EUR 0.1872
30/06/2017 EUR 1.1997 EUR 0.7746 EUR 0.2361
N.A.V. per unit at period/year ended "Eurobank I" unit :
31/12/2015 EUR 1.1659 EUR 0.6816 EUR 0.1957
31/12/2016 EUR 1.2801 EUR 0.8809 EUR 0.1983
30/06/2017 EUR 1.3135 EUR 0.8318 EUR 0.2520
N.A.V. per unit at period/year ended "Eurobank (USD)" unit :
31/12/2015 USD 1.1762 USD 11.5658 -
31/12/2016 USD 1.2386 USD 14.2826 -
30/06/2017 USD 1.3696 USD 14.5058 -
N.A.V. per unit at period/year ended "Postbank" unit :
31/12/2015 - EUR 0.6253 -
31/12/2016 - EUR 0.7976 -
30/06/2017 - EUR 0.7482 -
N.A.V. per unit at period/year ended "Postbank (BGN)" unit :
31/12/2015 - BGN 1.1862 -
31/12/2016 - BGN 1.5054 -
30/06/2017 - BGN 1.4098 -
N.A.V. per unit at period/year ended "Interamerican" unit :
31/12/2015 EUR 1.0755 EUR 0.6497 -
31/12/2016 EUR 1.1669 EUR 0.8308 -
30/06/2017 EUR 1.1903 EUR 0.7804 -
N.A.V. per unit at period/year ended "Private Banking Class " unit :
31/12/2015 EUR 1.0795 - EUR 0.1877
31/12/2016 EUR 1.1742 EUR 0.8256 EUR 0.1872
30/06/2017 EUR 1.1993 EUR 0.7745 EUR 0.2361
N.A.V. per unit at period/year ended "Bancpost (RON) " unit :
31/12/2015 - RON 2.9099 -
31/12/2016 - RON 3.7051 -
30/06/2017 - RON 3.4770 -
N.A.V. per unit at period/year ended "Private Banking Class (USD)" unit :
31/12/2015 USD 1.1753 - -
31/12/2016 USD 1.2377 - -
30/06/2017 USD 1.3685 - -
The accompanying notes form an integral part of these financial statements. 6

Statement of Net Assets
as at June 30, 2017 (continued)
(LF) (LF) (LF) (LF)
Income Plus $ Fund Absolute Return Fund Special Purpose Dual
Formula Fund
Special Purpose
Blue Chips Protect
Fund
Currency Notes USD EUR EUR EUR
Assets
Securities portfolio at market value 2 52 973 466.24 43 003 418.30 19 746 974.19 8 998 110.68
Unrealised gain on financial futures 2, 7 - 328 362.62 - -
Financial derivative instruments: options, swaps and
forward foreign exchange contracts 2, 7 - 140 775.00 - 1 553 466.93
Cash at bank 2 30 983 824.67 25 091 550.95 4 909 683.38 901 661.96
Formation expenses 2 - 8.19 - -
Receivable on interest and dividends 571 246.03 187 117.38 231 011.69 89 788.64
Receivable on securities - - - -
Receivable on subscriptions - 4 979.86 - -
Collateral to swap contracts 7 - - 72 900.00 -
Other assets 7 536.36 7 349.03 2 240.91 722.04
Total assets 84 536 073.30 68 763 561.33 24 962 810.17 11 543 750.25
Liabilities
Unrealised loss on financial futures 2, 7 - - - -
Financial derivative instruments: options, swaps and
forward foreign exchange contracts 2, 7 - - 92 053.30 -
Subscriptions in advance - 5 060.00 - -
Other payable and accrued expenses 52 043.72 681 222.47 208 300.85 18 877.22
Payable on redemptions 289 560.36 632 064.52 17 563.39 32 508.15
Dividend payable - - - -
Collateral to swap contracts 7 - - - 1 579 000.00
Total liabilities 341 604.08 1 318 346.99 317 917.54 1 630 385.37
Total net assets at the end of the period / year 84 194 469.22 67 445 214.34 24 644 892.63 9 913 364.88
Information summary
Units outstanding Eurobank 65 884 722.326 44 025 271.246 - 4 688.612
Units outstanding Eurobank I - 4 771 557.548 2 462 273.160 924 796.979
Units outstanding Eurobank (USD) - - - -
Units outstanding Postbank - 17 776.028 - -
Units outstanding Postbank (BGN) - - - -
Units outstanding Interamerican - - - -
Units outstanding Interamerican I - - - -
Units outstanding Bancpost (EUR) - - - -
Units outstanding Bancpost (RON) - - - -
Units outstanding Prelium A - - - -
Units outstanding Prelium B - - - -
Units outstanding Private Banking Class - 1 586 030.573 - -
Units outstanding Private Banking Class (USD) 2 140 888.372 - - -
Units outstanding Private Banking Dis - - - -
Net asset value per unit : Eurobank USD 1.2377 EUR 1.3364 - EUR 10.6644
Net asset value per unit : Eurobank I - EUR 1.3557 EUR 10.009 EUR 10.6654
Net asset value per unit : Eurobank (USD) - - - -
Net asset value per unit : Postbank - EUR 1.3359 - -
Net asset value per unit : Postbank (BGN) - - - -
Net asset value per unit : Interamerican - - - -
Net asset value per unit : Interamerican I - - - -
Net asset value per unit : Bancpost (EUR) - - - -
Net asset value per unit : Bancpost (RON) - - - -
Net asset value per unit : Prelium A - - - -
Net asset value per unit : Prelium B - - - -
Net asset value per unit : Private Banking Class - EUR 1.3362 - -
Net asset value per unit : Private Banking Class (USD) USD 1.2377 - - -
Net asset value per unit : Private Banking Dis - - - -
Cost of securities portfolio 52 862 983.86 43 224 407.50 19 605 703.59 8 792 009.30
The accompanying notes form an integral part of these financial statements. 7

Statistics
(LF) (LF) (LF) (LF)
Income Plus $ Fund Absolute Return Fund Special Purpose Dual
Formula Fund
Special Purpose
Blue Chips Protect
Fund
Currency USD EUR EUR EUR
Total net assets at period/year ended:
31/12/2015 104 544 255.65 79 724 255.50 29 380 943.84 11 596 527.56
31/12/2016 88 731 910.92 68 205 687.66 25 852 445.04 10 417 779.31
30/06/2017 84 194 469.22 67 445 214.34 24 644 892.63 9 913 364.88
N.A.V. per unit at period/year ended "Eurobank" unit :
31/12/2015 USD 1.2203 EUR 1.3148 EUR 11.0949 EUR 9.5900
31/12/2016 USD 1.2300 EUR 1.321 EUR 11.6832 EUR 10.2339
30/06/2017 USD 1.2377 EUR 1.3364 - EUR 10.6644
N.A.V. per unit at period/year ended "Eurobank I" unit :
31/12/2015 - EUR 1.3282 EUR 9.4974 EUR 9.5852
31/12/2016 - EUR 1.3385 EUR 9.8543 EUR 10.2328
30/06/2017 - EUR 1.3557 EUR 10.009 EUR 10.6654
N.A.V. per unit at period/year ended "Private Banking Class " unit :
31/12/2015 - EUR 1.3148 - -
31/12/2016 - EUR 1.3208 - -
30/06/2017 - EUR 1.3362 - -
N.A.V. per unit at period/year ended "Private Banking Class (USD)" unit :
31/12/2015 USD 1.2202 - -
31/12/2016 USD 1.2299 - -
30/06/2017 USD 1.2377 - -
N.A.V. per unit at period/year ended "Postbank" unit :
31/12/2015 - - -
31/12/2016 - EUR 1.3207 -
30/06/2017 - EUR 1.3359 -
The accompanying notes form an integral part of these financial statements. 8

Statement of Net Assets
as at June 30, 2017 (continued)*1)
(LF) (LF) (LF) (LF)
Special Purpose Blue
Chips Protect II Fund
Special Purpose
Blue Chips Protect
III Fund
Income Plus (RON) Balanced - Active
Fund (RON)
Currency Notes EUR EUR RON RON
Assets
Securities portfolio at market value 2 6 400 645.18 6 986 404.55 64 351 174.00 33 050 782.91
Unrealised gain on financial futures 2, 7 - - - -
Financial derivative instruments: options, swaps and
forward foreign exchange contracts 2, 7 1 069 430.85 1 134 229.13 - -
Cash at bank 2 658 005.50 1 007 555.98 8 643 531.50 3 620 284.05
Formation expenses 2 - - - -
Receivable on interest and dividends 59 672.73 78 014.32 620 802.37 311 922.47
Receivable on securities - - - -
Receivable on subscriptions - - - -
Collateral to swap contracts 7 - - - -
Other assets 529.06 726.00 34 592.00 33 602.73
Total assets 8 188 283.32 9 206 929.98 73 650 099.87 37 016 592.16
Liabilities
Unrealised loss on financial futures 2, 7 - - - -
Financial derivative instruments: options, swaps and
forward foreign exchange contracts 2, 7 - - - -
Subscriptions in advance - - 2 000.00 8 800.00
Other payable and accrued expenses 12 446.24 14 534.44 43 770.47 133 659.59
Payable on redemptions 4 506.33 40 922.59 - 114 068.46
Dividend payable - - - -
Collateral to swap contracts 7 1 101 900.00 1 190 600.00 - -
Total liabilities 1 118 852.57 1 246 057.03 45 770.47 256 528.05
Total net assets at the end of the period / year 7 069 430.75 7 960 872.95 73 604 329.40 36 760 064.11
Information summary
Units outstanding Eurobank 100.000 - - -
Units outstanding Eurobank I 684 561.324 764 860.247 - -
Units outstanding Eurobank (USD) - - - -
Units outstanding Postbank - - - -
Units outstanding Postbank (BGN) - - - -
Units outstanding Interamerican - - - -
Units outstanding Interamerican I - - - -
Units outstanding Bancpost (EUR) - - - -
Units outstanding Bancpost (RON) - - 4 637 020.570 2 166 269.505
Units outstanding Prelium A - - - -
Units outstanding Prelium B - - - -
Units outstanding Private Banking Class - - - -
Units outstanding Private Banking Class (USD) - - - -
Units outstanding Private Banking Dis - - - -
Net asset value per unit : Eurobank EUR 11.9554 - - -
Net asset value per unit : Eurobank I EUR 10.3252 EUR 10.4083 - -
Net asset value per unit : Eurobank (USD) - - - -
Net asset value per unit : Postbank - - - -
Net asset value per unit : Postbank (BGN) - - - -
Net asset value per unit : Interamerican - - - -
Net asset value per unit : Interamerican I - - - -
Net asset value per unit : Bancpost (EUR) - - - -
Net asset value per unit : Bancpost (RON) - - RON 15.8732 RON 16.9693
Net asset value per unit : Prelium A - - - -
Net asset value per unit : Prelium B - - - -
Net asset value per unit : Private Banking Class - - - -
Net asset value per unit : Private Banking Class (USD) - - - -
Net asset value per unit : Private Banking Dis - - - -
Cost of securities portfolio 6 264 354.01 6 845 417.76 64 142 048.67 30 499 839.65
*1) (LF) Special Purpose - 7.5% Equity Formula (RON) Fund have merged into Balanced - Active Fund (RON) on June 14, 2017
The accompanying notes form an integral part of these financial statements. 9

Statistics*1)
(LF) (LF) (LF) (LF)
Special Purpose Blue
Chips Protect II Fund
Special Purpose
Blue Chips Protect
III Fund
Income Plus (RON) Balanced - Active
Fund (RON)
Currency EUR EUR RON RON
Total net assets at period/year ended:
31/12/2015 8 540 705.74 9 032 327.13 73 347 541.94 34 542 498.10
31/12/2016 7 521 079.75 8 268 166.53 72 185 084.22 34 892 014.49
30/06/2017 7 069 430.75 7 960 872.95 73 604 329.40 36 760 064.11
N.A.V. per unit at period/year ended "Eurobank" unit :
31/12/2015 EUR 10.5379 - - -
31/12/2016 EUR 11.406 - - -
30/06/2017 EUR 11.9554 - - -
N.A.V. per unit at period/year ended "Eurobank I" unit :
31/12/2015 EUR 9.2693 EUR 9.3447 - -
31/12/2016 EUR 9.9106 EUR 9.9601 - -
30/06/2017 EUR 10.3252 EUR 10.4083 - -
N.A.V. per unit at period/year ended "Bancpost (RON)" unit :
31/12/2015 - - RON 15.6524 RON 16.1791
31/12/2016 - - RON 15.6927 RON 16.1617
30/06/2017 - - RON 15.8732 RON 16.9693
*1) (LF) Special Purpose - 7.5% Equity Formula (RON) Fund have merged into Balanced - Active Fund (RON) on June 14, 2017
-
-
-
-
-
-
-
-
-
-
-
-
The accompanying notes form an integral part of these financial statements. 10

Statement of Net Assets
as at June 30, 2017 (continued)*2)
(LF) (LF) (LF) (LF)
Equity - Flexi Style
Greece Fund
Income Plus € Fund Greek Government
Bond Fund
Total Return Fund
Currency Notes EUR EUR EUR EUR
Assets
Securities portfolio at market value 2 15 607 355.00 32 220 003.00 34 484 874.70 1 719 480.31
Unrealised gain on financial futures 2, 7 - - - 30 554.46
Financial derivative instruments: options, swaps and
forward foreign exchange contracts 2, 7 - - - -
Cash at bank 2 640 411.39 11 698 426.10 2 144 353.91 573 697.53
Formation expenses 2 - - - -
Receivable on interest and dividends 59 498.05 275 460.99 441 885.22 8 083.99
Receivable on securities 292 512.59 - - 29 528.65
Receivable on subscriptions 38 870.80 60 071.32 33 580.88 -
Collateral to swap contracts 7 - - - -
Other assets 1 153.45 5 298.10 6 585.18 202.90
Total assets 16 639 801.28 44 259 259.51 37 111 279.89 2 361 547.84
Liabilities
Unrealised loss on financial futures 2, 7 - - - -
Financial derivative instruments: options, swaps and
forward foreign exchange contracts 2, 7 - - - -
Subscriptions in advance 64 500.00 102 000.00 34 500.00 -
Other payable and accrued expenses 45 648.44 55 561.62 523 824.01 77 019.38
Payable on redemptions 19 927.49 - 47 949.62 -
Dividend payable - - 27 612.03 -
Collateral to swap contracts 7 - - - -
Total liabilities 130 075.93 157 561.62 633 885.66 77 019.38
Total net assets at the end of the period / year 16 509 725.35 44 101 697.89 36 477 394.23 2 284 528.46
Information summary
Units outstanding Eurobank 13 309 307.429 24 511 511.368 764 041.213 -
Units outstanding Eurobank I - 100 783.079 388 094.163 -
Units outstanding Eurobank (USD) - - - -
Units outstanding Postbank - - - -
Units outstanding Postbank (BGN) - - - -
Units outstanding Interamerican - 30 693.221 - -
Units outstanding Interamerican I - - - -
Units outstanding Bancpost (EUR) - - - -
Units outstanding Bancpost (RON) - - - -
Units outstanding Prelium A - - - 193 478.175
Units outstanding Prelium B - - - 19 649.825
Units outstanding Private Banking Class 1 795 150.050 5 424 434.661 333 777.719 -
Units outstanding Private Banking Class (USD) - - - -
Units outstanding Private Banking Dis - - 121 638.915 -
Net asset value per unit : Eurobank EUR 1.0930 EUR 1.4576 EUR 22.5897 -
Net asset value per unit : Eurobank I - EUR 1.4734 EUR 23.8867 -
Net asset value per unit : Eurobank (USD) - - - -
Net asset value per unit : Postbank - - - -
Net asset value per unit : Postbank (BGN) - - - -
Net asset value per unit : Interamerican - EUR 10.3820 - -
Net asset value per unit : Interamerican I - - - -
Net asset value per unit : Bancpost (EUR) - - - -
Net asset value per unit : Bancpost (RON) - - - -
Net asset value per unit : Prelium A - - - EUR 10.6559
Net asset value per unit : Prelium B - - - EUR 11.3412
Net asset value per unit : Private Banking Class EUR 1.0931 EUR 1.4574 EUR 22.5862 -
Net asset value per unit : Private Banking Class (USD) - - - -
Net asset value per unit : Private Banking Dis - - EUR 19.8037 -
Cost of securities portfolio 12 714 792.76 31 669 885.16 29 826 073.41 1 655 445.76
*2) (LF) Special Purpose All Weather Plus Fund have merged into (LF) Income Plus € Fund on March 29, 2017
The accompanying notes form an integral part of these financial statements. 11

Statistics*2)
(LF) (LF) (LF) (LF)
Equity - Flexi Style
Greece Fund
Income Plus € Fund Greek Government
Bond Fund
Total Return Fund
Currency EUR EUR EUR EUR
Total net assets at period/year ended:
31/12/2015 14 395 723.93 29 612 589.89 31 604 744.71 3 255 765.06
31/12/2016 13 149 494.48 34 322 382.76 30 181 764.28 3 092 454.79
30/06/2017 16 509 725.35 44 101 697.89 36 477 394.23 2 284 528.46
N.A.V. per unit at period/year ended "Eurobank" unit :
31/12/2015 EUR 0.8846 EUR 1.3285 EUR 17.6634 -
31/12/2016 EUR 0.8710 EUR 1.4179 EUR 19.8341 -
30/06/2017 EUR 1.0930 EUR 1.4576 EUR 22.5897 -
N.A.V. per unit at period/year ended "Eurobank I" unit :
31/12/2015 - EUR 1.3349 EUR 18.3434 -
31/12/2016 EUR 0.8710 EUR 1.4304 EUR 20.8479 -
30/06/2017 - EUR 1.4734 EUR 23.8867 -
N.A.V. per unit at period/year ended "Private Banking Class " unit :
31/12/2015 EUR 0.8848 - - -
31/12/2016 EUR 0.8710 - - -
30/06/2017 EUR 1.0931 - - -
N.A.V. per unit at period/year ended "Private Banking Class " unit :
31/12/2015 - EUR 1.3284 EUR 17.6623 -
31/12/2016 - EUR 1.4177 EUR 19.8316 -
30/06/2017 - EUR 1.4574 EUR 22.5862 -
N.A.V. per unit at period/year ended "Interamerican" unit :
31/12/2015 - EUR 9.4261 - -
31/12/2016 - EUR 10.0862 - -
30/06/2017 - EUR 10.3820 - -
N.A.V. per unit at period/year ended "Private Banking Dis " unit :
31/12/2015 - - EUR 16.6616 -
31/12/2016 - - EUR 17.8067 -
30/06/2017 - - EUR 19.8037 -
N.A.V. per unit at period/year ended "Prelium A" unit :
31/12/2015 - - - EUR 10.5952
31/12/2016 - - - EUR 10.7196
30/06/2017 - - - EUR 10.6559
N.A.V. per unit at period/year ended "Prelium B" unit :
31/12/2015 - - - EUR 11.1063
31/12/2016 - - - EUR 11.3519
30/06/2017 - - - EUR 11.3412
*2) (LF) Special Purpose All Weather Plus Fund have merged into (LF) Income Plus € Fund on March 29, 2017
The accompanying notes form an integral part of these financial statements. 12

Statement of Net Assets
as at June 30, 2017 (continued)
(LF) (LF) (LF) (LF)
Money Market
Fund - Reserve
Global Bond Fund Equity - Middle
East - North Africa
Fund
Special Purpose
Best Performers
Fund
Currency Notes EUR EUR EUR EUR
Assets
Securities portfolio at market value 2 532 544 119.58 10 231 600.56 856 570.64 11 220 272.23
Unrealised gain on financial futures 2, 7 - 12 585.44 - -
Financial derivative instruments: options, swaps and
forward foreign exchange contracts 2, 7 - - - 3 395 079.11
Cash at bank 2 205 233 659.79 583 593.40 67 585.99 2 129 386.23
Formation expenses 2 2.82 - - -
Receivable on interest and dividends - 24 812.04 716.08 68 340.60
Receivable on securities - - - -
Receivable on subscriptions - - - -
Collateral to swap contracts 7 - - - 77 850.00
Other assets 68 924.50 757.60 75.88 954.27
Total assets 737 846 706.69 10 853 349.04 924 948.59 16 891 882.44
Liabilities
Unrealised loss on financial futures 2, 7 - - - -
Financial derivative instruments: options, swaps and
forward foreign exchange contracts 2, 7 - - - -
Subscriptions in advance - - - -
Other payable and accrued expenses 1 137 089.73 209 233.80 2 639.85 33 952.86
Payable on redemptions 199 157.48 11 910.20 52 991.70
Dividend payable - - -
Collateral to swap contracts 7 - - - 3 654 000.00
Total liabilities 1 336 247.21 221 144.00 2 639.85 3 740 944.56
Total net assets at the end of the period / year 736 510 459.48 10 632 205.04 922 308.74 13 150 937.88
Information summary
Units outstanding Eurobank 65 591 002.394 683 013.400 43 388.212 -
Units outstanding Eurobank I 4 667 164.431 150 000.000 31 539.017 991 268.767
Units outstanding Eurobank (USD) - - - -
Units outstanding Postbank - - - -
Units outstanding Postbank (BGN) - - - -
Units outstanding Interamerican 1 633 011.810 - - -
Units outstanding Interamerican I - - - -
Units outstanding Bancpost (EUR) 23 391.929 - - -
Units outstanding Bancpost (RON) - - - -
Units outstanding Prelium A - - - -
Units outstanding Prelium B - - - -
Units outstanding Private Banking Class 1 805 427.978 9 672.791 - -
Units outstanding Private Banking Class (USD) - - - -
Units outstanding Private Banking Dis - 15 989.510 - -
Net asset value per unit : Eurobank EUR 9.9894 EUR 12.3452 EUR 12.1763 -
Net asset value per unit : Eurobank I EUR 10.0048 EUR 12.5552 EUR 12.4924 EUR 13.2668
Net asset value per unit : Eurobank (USD) - - - -
Net asset value per unit : Postbank - - - -
Net asset value per unit : Postbank (BGN) - - - -
Net asset value per unit : Interamerican EUR 10.0000 - - -
Net asset value per unit : Interamerican I - - - -
Net asset value per unit : Bancpost (EUR) EUR 9.9991 - - -
Net asset value per unit : Bancpost (RON) - - - -
Net asset value per unit : Prelium A - - - -
Net asset value per unit : Prelium B - - - -
Net asset value per unit : Private Banking Class EUR 9.9893 EUR 12.3625 - -
Net asset value per unit : Private Banking Class (USD) - - - -
Net asset value per unit : Private Banking Dis - EUR 12.3447 - -
Cost of securities portfolio 532 544 119.58 10 328 540.56 961 516.50 10 293 402.65
The accompanying notes form an integral part of these financial statements. 13

Statistics
(LF) (LF) (LF) (LF)
Money Market
Fund - Reserve
Global Bond Fund Equity - Middle
East - North Africa
Fund
Special Purpose
Best Performers
Fund
Currency EUR EUR EUR EUR
Total net assets at period/year ended:
31/12/2015 1 465 471 489.76 12 254 107.51 1 492 837.26 16 649 722.18
31/12/2016 897 907 338.49 10 717 241.98 1 116 997.87 14 807 039.68
30/06/2017 736 510 459.48 10 632 205.04 922 308.74 13 150 937.88
N.A.V. per unit at period/year ended "Eurobank" unit :
31/12/2015 EUR 10.0402 EUR 12.1818 EUR 12.9234 -
31/12/2016 EUR 10.0152 EUR 12.5689 EUR 13.2735 -
30/06/2017 EUR 9.9894 EUR 12.3452 EUR 12.1763 -
N.A.V. per unit at period/year ended "Eurobank I" unit :
31/12/2015 EUR 10.0400 EUR 12.3067 EUR 13.0517 EUR 11.3085
31/12/2016 EUR 10.0230 EUR 12.7545 EUR 13.5474 EUR 12.7464
30/06/2017 EUR 10.0048 EUR 12.5552 EUR 12.4924 EUR 13.2668
N.A.V. per unit at period/year ended "Bancpost (EUR)" unit :
31/12/2015 EUR 10.0403 - - -
31/12/2016 EUR 10.0199 - - -
30/06/2017 EUR 9.9991 - - -
N.A.V. per unit at period/year ended "Interamerican" unit :
31/12/2015 EUR 10.0412 - - -
31/12/2016 EUR 10.0208 - - -
30/06/2017 EUR 10.0000 - - -
N.A.V. per unit at period/year ended "Private Banking Class " unit :
31/12/2015 EUR 10.0400 EUR 12.1848 - -
31/12/2016 EUR 10.0150 EUR 12.5830 - -
30/06/2017 EUR 9.9893 EUR 12.3625 - -
N.A.V. per unit at period/year ended "Private Banking Dis " unit :
31/12/2015 - - - -
31/12/2016 - - - -
30/06/2017 - EUR 12.3447 - -
The accompanying notes form an integral part of these financial statements. 14
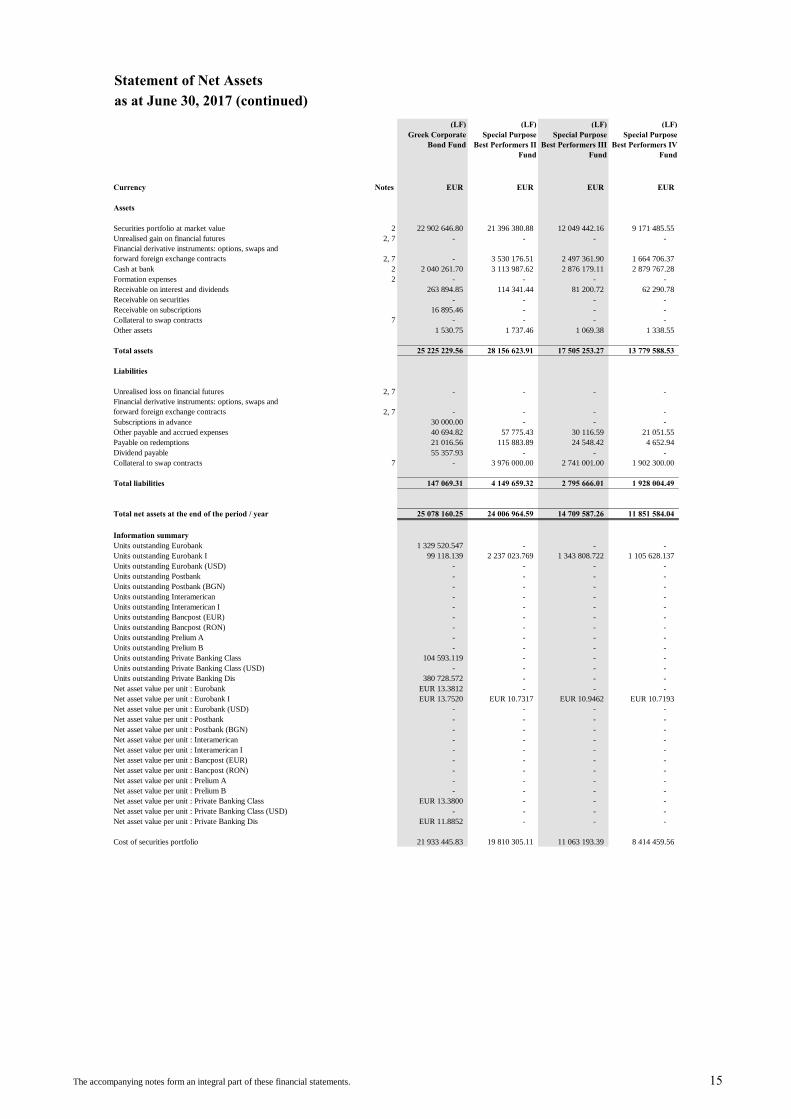
Statement of Net Assets
as at June 30, 2017 (continued)
(LF) (LF) (LF) (LF)
Greek Corporate
Bond Fund
Special Purpose
Best Performers II
Fund
Special Purpose
Best Performers III
Fund
Special Purpose
Best Performers IV
Fund
Currency Notes EUR EUR EUR EUR
Assets
Securities portfolio at market value 2 22 902 646.80 21 396 380.88 12 049 442.16 9 171 485.55
Unrealised gain on financial futures 2, 7 - - - -
Financial derivative instruments: options, swaps and
forward foreign exchange contracts 2, 7 - 3 530 176.51 2 497 361.90 1 664 706.37
Cash at bank 2 2 040 261.70 3 113 987.62 2 876 179.11 2 879 767.28
Formation expenses 2 - - - -
Receivable on interest and dividends 263 894.85 114 341.44 81 200.72 62 290.78
Receivable on securities - - - -
Receivable on subscriptions 16 895.46 - - -
Collateral to swap contracts 7 - - - -
Other assets 1 530.75 1 737.46 1 069.38 1 338.55
Total assets 25 225 229.56 28 156 623.91 17 505 253.27 13 779 588.53
Liabilities
Unrealised loss on financial futures 2, 7 - - - -
Financial derivative instruments: options, swaps and
forward foreign exchange contracts 2, 7 - - - -
Subscriptions in advance 30 000.00 - - -
Other payable and accrued expenses 40 694.82 57 775.43 30 116.59 21 051.55
Payable on redemptions 21 016.56 115 883.89 24 548.42 4 652.94
Dividend payable 55 357.93 - - -
Collateral to swap contracts 7 - 3 976 000.00 2 741 001.00 1 902 300.00
Total liabilities 147 069.31 4 149 659.32 2 795 666.01 1 928 004.49
Total net assets at the end of the period / year 25 078 160.25 24 006 964.59 14 709 587.26 11 851 584.04
Information summary
Units outstanding Eurobank 1 329 520.547 - - -
Units outstanding Eurobank I 99 118.139 2 237 023.769 1 343 808.722 1 105 628.137
Units outstanding Eurobank (USD) - - - -
Units outstanding Postbank - - - -
Units outstanding Postbank (BGN) - - - -
Units outstanding Interamerican - - - -
Units outstanding Interamerican I - - - -
Units outstanding Bancpost (EUR) - - - -
Units outstanding Bancpost (RON) - - - -
Units outstanding Prelium A - - - -
Units outstanding Prelium B - - - -
Units outstanding Private Banking Class 104 593.119 - - -
Units outstanding Private Banking Class (USD) - - - -
Units outstanding Private Banking Dis 380 728.572 - - -
Net asset value per unit : Eurobank EUR 13.3812 - - -
Net asset value per unit : Eurobank I EUR 13.7520 EUR 10.7317 EUR 10.9462 EUR 10.7193
Net asset value per unit : Eurobank (USD) - - - -
Net asset value per unit : Postbank - - - -
Net asset value per unit : Postbank (BGN) - - - -
Net asset value per unit : Interamerican - - - -
Net asset value per unit : Interamerican I - - - -
Net asset value per unit : Bancpost (EUR) - - - -
Net asset value per unit : Bancpost (RON) - - - -
Net asset value per unit : Prelium A - - - -
Net asset value per unit : Prelium B - - - -
Net asset value per unit : Private Banking Class EUR 13.3800 - - -
Net asset value per unit : Private Banking Class (USD) - - - -
Net asset value per unit : Private Banking Dis EUR 11.8852 - - -
Cost of securities portfolio 21 933 445.83 19 810 305.11 11 063 193.39 8 414 459.56
The accompanying notes form an integral part of these financial statements. 15

Statistics
(LF) (LF) (LF) (LF)
Greek Corporate
Bond Fund
Special Purpose
Best Performers II
Fund
Special Purpose
Best Performers III
Fund
Special Purpose
Best Performers IV
Fund
Currency EUR EUR EUR EUR
Total net assets at period/year ended:
31/12/2015 47 884 869.70 25 037 791.98 14 784 008.58 11 296 725.13
31/12/2016 22 666 970.26 25 840 561.20 15 415 374.27 12 312 944.74
30/06/2017 25 078 160.25 24 006 964.59 14 709 587.26 11 851 584.04
N.A.V. per unit at period/year ended "Eurobank" unit :
31/12/2015 EUR 11.8161 - - -
31/12/2016 EUR 12.7578 - - -
30/06/2017 EUR 13.3812 - - -
N.A.V. per unit at period/year ended "Eurobank I" unit :
31/12/2015 EUR 11.9988 EUR 9.4631 EUR 9.1971 EUR 8.8640
31/12/2016 EUR 13.0595 EUR 10.6087 EUR 10.4884 EUR 10.2371
30/06/2017 EUR 13.7520 EUR 10.7317 EUR 10.9462 EUR 10.7193
N.A.V. per unit at period/year ended "Interamerican" unit :
31/12/2015 - -
31/12/2016 - -
30/06/2017 - -
N.A.V. per unit at period/year ended "Private Banking Dis " unit :
31/12/2015 EUR 11.3091 -
31/12/2016 EUR 11.6166 -
30/06/2017 EUR 11.8852 -
N.A.V. per unit at period/year ended "Private Banking Class " unit :
31/12/2015 EUR 11.8150 -
31/12/2016 EUR 12.7567 -
30/06/2017 EUR 13.3800 -
The accompanying notes form an integral part of these financial statements. 16

Statement of Net Assets
as at June 30, 2017 (continued)
(LF) (LF) (LF)
Special Purpose
Best Performers V
Fund
Special Purpose
Best Performers VI
Fund
Special Purpose
Step Up Formula
(RON) Fund
Currency Notes EUR EUR RON
Assets
Securities portfolio at market value 2 20 568 646.58 16 835 852.53 15 410 957.50
Unrealised gain on financial futures 2, 7 - - -
Financial derivative instruments: options, swaps and
forward foreign exchange contracts 2, 7 1 815 679.10 911 662.12 833 175.00
Cash at bank 2 4 034 345.75 4 763 130.83 1 086 956.33
Formation expenses 2 - - -
Receivable on interest and dividends 120 268.62 101 937.49 97 094.67
Receivable on securities - - -
Receivable on subscriptions - - -
Collateral to swap contracts 7 - - -
Other assets 4 458.22 1 609.63 7 704.30
Total assets 26 543 398.27 22 614 192.60 17 435 887.80
Liabilities
Unrealised loss on financial futures 2, 7 - - -
Financial derivative instruments: options, swaps and
forward foreign exchange contracts 2, 7 - - -
Subscriptions in advance - - -
Other payable and accrued expenses 37 193.67 29 876.85 120 158.84
Payable on redemptions 42 808.79 31 151.21 -
Dividend payable - - -
Collateral to swap contracts 7 2 355 600.00 1 463 800.00 728 368.00
Total liabilities 2 435 602.46 1 524 828.06 848 526.84
Total net assets at the end of the period / year 24 107 795.81 21 089 364.54 16 587 360.96
Information summary
Units outstanding Eurobank - - -
Units outstanding Eurobank I 2 119 897.867 1 924 353.711 -
Units outstanding Eurobank (USD) - - -
Units outstanding Postbank - - -
Units outstanding Postbank (BGN) - - -
Units outstanding Interamerican - - -
Units outstanding Interamerican I - - -
Units outstanding Bancpost (EUR) - - -
Units outstanding Bancpost (RON) - - 1 575 074.943
Units outstanding Prelium A - - -
Units outstanding Prelium B - - -
Units outstanding Private Banking Class - - -
Units outstanding Private Banking Class (USD) - - -
Units outstanding Private Banking Dis - - -
Net asset value per unit : Eurobank - - -
Net asset value per unit : Eurobank I EUR 11.3721 EUR 10.9592 -
Net asset value per unit : Eurobank (USD) - - -
Net asset value per unit : Postbank - - -
Net asset value per unit : Postbank (BGN) - - -
Net asset value per unit : Interamerican - - -
Net asset value per unit : Interamerican I - - -
Net asset value per unit : Bancpost (EUR) - - -
Net asset value per unit : Bancpost (RON) - - RON 10.5312
Net asset value per unit : Prelium A - - -
Net asset value per unit : Prelium B - - -
Net asset value per unit : Private Banking Class - - -
Net asset value per unit : Private Banking Class (USD) - - -
Net asset value per unit : Private Banking Dis - - -
Cost of securities portfolio 19 096 915.16 15 584 165.06 15 473 807.31
The accompanying notes form an integral part of these financial statements. 17

Statistics
(LF) (LF) (LF)
Special Purpose
Best Performers V
Fund
Special Purpose
Best Performers VI
Fund
Special Purpose
Step Up Formula
(RON) Fund
Currency EUR EUR RON
Total net assets at period/year ended:
31/12/2015 26 563 698.51 20 879 861.70 -
31/12/2016 26 787 546.33 22 075 037.77 16 307 438.08
30/06/2017 24 107 795.81 21 089 364.54 16 587 360.96
N.A.V. per unit at period/year ended "Eurobank I" unit :
31/12/2015 EUR 9.6481 EUR 9.4270 -
31/12/2016 EUR 10.9501 EUR 10.5012 -
30/06/2017 EUR 11.3721 EUR 10.9592 -
N.A.V. per unit at period/year ended "Bancpost (RON)" unit :
31/12/2014 - - -
31/12/2015 - - RON 10.2835
31/12/2016 - - RON 10.5312
The accompanying notes form an integral part of these financial statements. 18

(LF) Equity - Global Equities Fund
Schedule of investmentsas at June 30, 2017
(All figures in EUR)
Shares / Cost Market % of Net
Currency Nominal Name Price Price Assets
Transferable securities admitted to an official exchange listing
Equities
EUR 3 000 AIRBUS GROUP NV 168 866.73 216 000.00 0.86%
EUR 1 250 VOLKSWAGEN AG-PFD 160 909.88 166 687.50 0.66%
EUR 3 750 DAIMLER AG 268 643.70 237 637.50 0.95%
EUR 3 750 SOCIETE GENERALE 120 000.00 176 662.50 0.70%
EUR 4 500 BNP PARIBAS 195 329.27 283 770.00 1.13%
EUR 24 000 ING GROUP NV 248 589.17 362 400.00 1.44%
EUR 25 378 BANCO BILBAO VIZCAYA (LUX) 205 937.75 184 371.17 0.73%
EUR 50 000 BANCO DE SANTANDER SA 302 563.52 289 600.00 1.15%
EUR 2 800 ANHEUSER BUSCH INBEV NV (INTERBREW S.A) 246 452.90 270 788.00 1.08%
EUR 9 500 CIE DE ST-GOBAIN 365 812.92 444 410.00 1.77%
EUR 1 210 AIR LIQUIDE(L) EUR11 66 178.66 130 922.00 0.52%
EUR 3 000 BAYER AG 269 422.08 339 600.00 1.35%
EUR 3 500 BASF 261 580.40 283 815.00 1.13%
EUR 2 500 RENAULT 212 492.25 198 125.00 0.79%
EUR 1 500 LOREAL 192 329.74 273 600.00 1.09%
EUR 8 003 ENGIE SA 149 536.13 105 759.65 0.42%
EUR 40 000 ENEL SPA 121 811.91 187 760.00 0.75%
EUR 22 488 IBERDROLA SA 96 651.02 155 909.30 0.62%
EUR 3 750 SCHNEIDER ELECTRIC 247 432.50 252 262.50 1.00%
EUR 3 300 VINCI SA 236 829.34 246 609.00 0.98%
EUR 3 500 DANONE 195 136.08 230 335.00 0.92%
EUR 6 750 UNILEVER NV CVA 208 734.87 326 160.00 1.30%
EUR 3 500 FRESENIUS AG 246 521.10 262 710.00 1.05%
EUR 1 150 LVMH MOET-HENNESSY LOUIS 219 262.90 251 045.00 1.00%
EUR 11 000 AXA S.A. 204 727.68 263 450.00 1.05%
EUR 2 300 ALLIANZ A.G. 245 454.80 396 520.00 1.58%
EUR 4 000 SIEMENS AG 335 859.15 481 400.00 1.92%
EUR 11 750 TOTAL 515 689.84 508 598.75 2.03%
EUR 20 000 ENI 324 978.88 263 200.00 1.05%
EUR 6 250 SANOFI 451 937.52 523 500.00 2.09%
EUR 600 UNIBAIL-RODAMCO SE 89 450.69 132 390.00 0.53%
EUR 7 500 INDUSTRIA DE DISENO TEXTIL 164 338.00 252 075.00 1.00%
EUR 4 000 ASML HOLDING NV 312 666.70 456 400.00 1.82%
EUR 4 500 SAP AG 405 810.00 411 525.00 1.64%
EUR 18 000 DEUTSCHE TELECOM AG 207 668.56 282 960.00 1.13%
EUR 24 000 TELEFONICA SA ORD 288 715.44 216 912.00 0.86%
EUR 6 000 ENAGAS 120 621.00 147 300.00 0.59%
8 674 943.08 10 213 169.87 40.68%
GBP 128 140 SECURE PROPERTY DEV INV LTD 109 763.00 29 144.92 0.12%
USD 4 000 BOEING COMPANY 305 810.84 693 130.04 2.76%
USD 4 750 UTD TECHNOLOGIES COM 364 439.21 508 256.66 2.02%
USD 4 500 NIKE CLASS B 152 114.87 232 649.84 0.93%
USD 5 000 COACH INC. 175 865.13 207 413.25 0.83%
USD 4 500 GOLDMAN SACHS GROUP 672 718.13 875 000.00 3.49%
USD 5 150 JP MORGAN CHASE& CO 237 754.22 412 469.33 1.64%
USD 4 800 COCA COLA CO 118 652.48 188 643.53 0.75%
USD 3 200 E.I. DU PONT DE NEMOURS & CO 87 603.90 226 316.16 0.90%
USD 4 500 APPLE COMPUTER 540 083.23 567 902.21 2.26%
USD 3 800 INTERNATIONAL BUSINESS MACHS(IBM) 426 420.55 512 227.48 2.04%
USD 3 000 PROCTER & GAMBLE CO. 133 503.64 229 100.95 0.91%
USD 4 000 AMERICAN EXPRESS CO 198 862.79 295 268.14 1.18%
USD 5 000 VISA INC-CLASS A SHARES 260 346.98 410 883.28 1.64%
USD 4 175 UNITED HEALTH GROUP INC 287 791.24 678 346.04 2.70%
USD 4 500 TRAVELERS COS INC 290 750.04 498 935.33 1.99%
USD 250 AMAZON COM Inc 179 865.25 212 057.48 0.84%
USD 3 700 CATERPILLAR INC 231 371.75 348 406.94 1.39%
The accompanying notes form an integral part of these financial statements 19
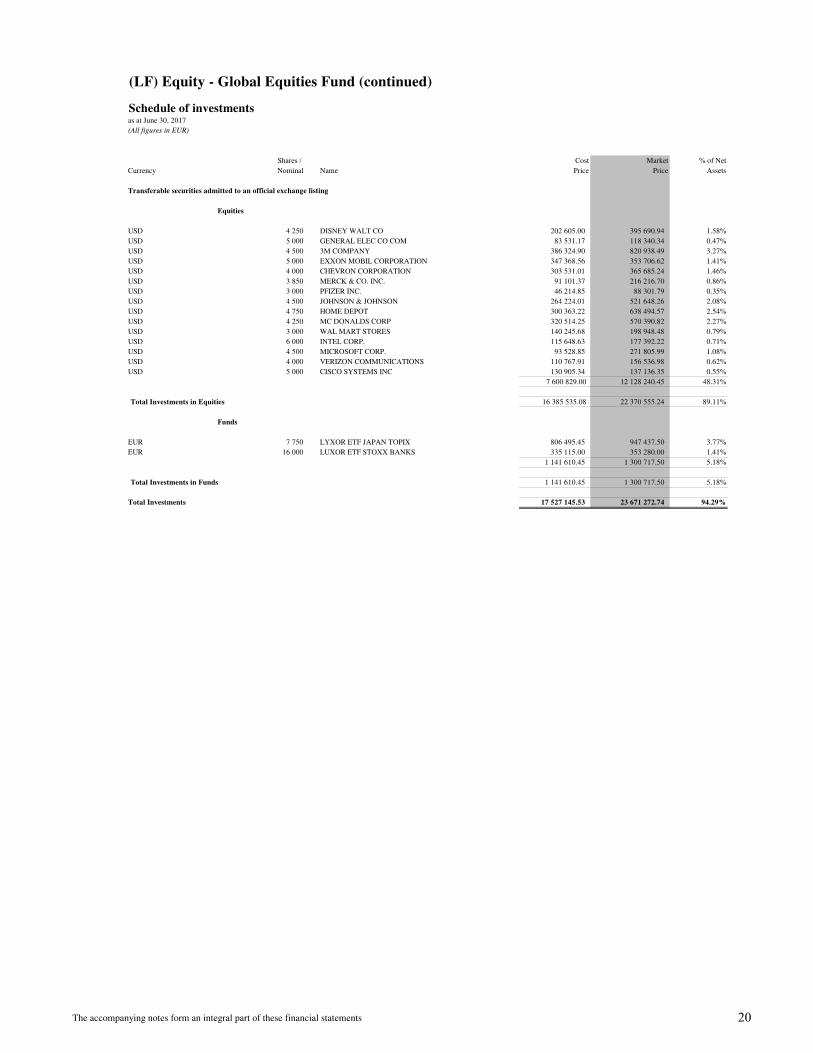
(LF) Equity - Global Equities Fund (continued)
Schedule of investmentsas at June 30, 2017
(All figures in EUR)
Shares / Cost Market % of Net
Currency Nominal Name Price Price Assets
Transferable securities admitted to an official exchange listing
Equities
USD 4 250 DISNEY WALT CO 202 605.00 395 690.94 1.58%
USD 5 000 GENERAL ELEC CO COM 83 531.17 118 340.34 0.47%
USD 4 500 3M COMPANY 386 324.90 820 938.49 3.27%
USD 5 000 EXXON MOBIL CORPORATION 347 368.56 353 706.62 1.41%
USD 4 000 CHEVRON CORPORATION 303 531.01 365 685.24 1.46%
USD 3 850 MERCK & CO. INC. 91 101.37 216 216.70 0.86%
USD 3 000 PFIZER INC. 46 214.85 88 301.79 0.35%
USD 4 500 JOHNSON & JOHNSON 264 224.01 521 648.26 2.08%
USD 4 750 HOME DEPOT 300 363.22 638 494.57 2.54%
USD 4 250 MC DONALDS CORP 320 514.25 570 390.82 2.27%
USD 3 000 WAL MART STORES 140 245.68 198 948.48 0.79%
USD 6 000 INTEL CORP. 115 648.63 177 392.22 0.71%
USD 4 500 MICROSOFT CORP. 93 528.85 271 805.99 1.08%
USD 4 000 VERIZON COMMUNICATIONS 110 767.91 156 536.98 0.62%
USD 5 000 CISCO SYSTEMS INC 130 905.34 137 136.35 0.55%
7 600 829.00 12 128 240.45 48.31%
Total Investments in Equities 16 385 535.08 22 370 555.24 89.11%
Funds
EUR 7 750 LYXOR ETF JAPAN TOPIX 806 495.45 947 437.50 3.77%
EUR 16 000 LUXOR ETF STOXX BANKS 335 115.00 353 280.00 1.41%
1 141 610.45 1 300 717.50 5.18%
Total Investments in Funds 1 141 610.45 1 300 717.50 5.18%
Total Investments 17 527 145.53 23 671 272.74 94.29%
23 671 272.74
The accompanying notes form an integral part of these financial statements 20

(LF) Equity - Global Equities Fund (continued)
Portfolio breakdownas at June 30, 2017
By countries / by issuers
Belgium 1.14%
Cyprus 0.12%
France 22.48%
Germany 12.09%
Italy 1.91%
Netherlands 5.75%
Spain 5.26%
United States 51.24%
Total 100.00%
By industry groups
Aerospace&Defence 5.99%
Apparel 1.86%
Automobiles 1.71%
Banks 10.92%
Beverages 1.94%
Building&Construction Materials 1.88%
Chemicals 4.14%
Computer Hardware 4.56%
Consumer, Non-cyclical 0.84%
Cosmetics 2.12%
Diversified Financials 1.25%
Electric 1.90%
Equity Funds 5.49%
Financials 1.74%
Food 2.35%
HealthCare 3.98%
Internet 0.90%
Investments Companies 0.12%
Machinery -Constr&Mining 1.47%
Media &Entertainment 1.67%
Miscellaneous Manufacturers 6.00%
Oil&Gas 6.30%
Pharmaceuticals 5.70%
Real Estate Investment Trusts 0.56%
Retail 7.01%
Semiconductors 2.68%
Software 2.89%
Telecommunication Services 3.35%
Utilities 0.62%
Total 100.00%
The accompanying notes form an integral part of these financial statements 21

(LF) Equity - Emerging Europe Fund
Schedule of investmentsas at June 30, 2017
(All figures in EUR)
Shares / Cost Market % of Net
Currency Nominal Name Price Price Assets
Transferable securities admitted to an official exchange listing
Equities
CZK 23 500 MONETA MONEY BANK 71 323.08 68 713.97 0.71%
CZK 2 000 KOMERCNI BANKA AS 65 963.73 69 931.67 0.73%
CZK 8 250 O2 CZECH REPUBLIC AS 80 408.96 85 438.22 0.89%
217 695.77 224 083.86 2.33%
EUR 370 000 PIRAEUS BANK S.A. 86 060.00 79 550.00 0.83%
EUR 57 500 ALPHA BANK SA 165 347.19 124 200.00 1.29%
EUR 403 333 NAT. BANK OF GREECE SA 166 312.49 134 309.89 1.39%
EUR 70 000 EUROBANK ERGASIAS SA 153 693.25 68 600.00 0.71%
EUR 2 000 TITAN CEMENT COMPANY S.A. 40 787.13 49 540.00 0.51%
EUR 8 000 GREEK ORGAN.OF FOOTBALL PROGN.S.A. 68 428.90 79 200.00 0.82%
EUR 8 000 HELLENIC TELECOM. ORG. 79 661.65 84 320.00 0.88%
760 290.61 619 719.89 6.43%
HUF 8 000 OTP BANK 130 153.57 234 326.96 2.43%
HUF 5 000 RICHTER GEDEON 87 805.09 114 363.85 1.19%
HUF 1 400 MOL MAGYAR OLA ES GAZIPARI 75 546.09 96 174.39 1.00%
293 504.75 444 865.20 4.62%
PLN 6 500 BANK PEKAO (LOCAL) 250 724.23 191 959.11 1.99%
PLN 32 000 PKO BANK POLSKI SA 256 374.72 260 943.23 2.71%
PLN 1 500 BANK ZACHODNI WBK S.A. 110 097.89 121 500.75 1.26%
PLN 700 GRUPA KETY SA 61 097.26 72 055.66 0.75%
PLN 6 500 ALIOR BANK SA 115 967.95 94 979.77 0.99%
PLN 22 500 POLSKA GRUPA ENERGETYCZNA SA 113 372.16 64 477.39 0.67%
PLN 19 500 POWSZECHNY ZAKLAD UBEZPIECZE SA 164 756.47 205 756.17 2.14%
PLN 3 250 KGHM POLSKA MIEZD S.A. 104 993.37 85 097.26 0.88%
PLN 11 000 POLSKI KONCERN NAFTOWY ORLEN 177 446.00 291 275.23 3.02%
PLN 60 000 POLSKIE GORNICTWO NAFTOWE I GAZ 82 488.12 89 732.36 0.93%
PLN 1 100 AMREST 48 265.57 92 406.35 0.96%
PLN 1 800 CCC SA (NG2 SA) 72 116.02 95 837.57 1.00%
1 557 699.76 1 666 020.85 17.30%
RON 165 000 BANCA TRANSILVANIA 87 389.26 97 318.94 1.01%
RON 33 000 OLTCHIM VALCEA 5 359.01 2 305.21 0.02%
RON 20 000 ELECTRICA SA 52 133.76 57 553.32 0.60%
RON 6 000 ROMPETROL WELL SERVICES 461.82 428.35 0.00%
RON 150 000 DAFORA MEDIAS 3 039.61 0.00 0.00%
148 383.46 157 605.82 1.64%
RSD 20 KOMERCIJALNA BANKA AD BEOGRAD 3 071.74 297.89 0.00%
The accompanying notes form an integral part of these financial statements 22

(LF) Equity - Emerging Europe Fund (continued)
Schedule of investmentsas at June 30, 2017
(All figures in EUR)
Shares / Cost Market % of Net
Currency Nominal Name Price Price Assets
Transferable securities admitted to an official exchange listing
Equities
TRY 0.03 TURK HAVA YOLLARI 0.07 0.06 0.00%
TRY 10 000.00 TOFAS TURK OTOMOBIL FABRIK 74 021.74 72 008.77 0.75%
TRY 10 000.00 FORD OTOMOTIV SANAYI AS 83 579.89 107 041.41 1.11%
TRY 68 001.80 TURKIYE IS BANKASI AS 115 440.62 126 230.47 1.31%
TRY 105 000.00 TURKIYE GARANTI BANKASI AS 256 755.76 256 129.47 2.66%
TRY 45 000.00 YAPI VE KREDI BANK 50 451.83 50 343.85 0.52%
TRY 70 001.00 AKBANK TAS 182 443.10 170 929.84 1.77%
TRY 0.78 TURKIYE VAKIFLAR BAKASI 1.26 1.26 0.00%
TRY 12 000.00 COCA COLA ICECEK 113 338.75 120 735.54 1.25%
TRY 70 000.00 PETKIM PETROKIMYA HOLD. AS 73 087.93 105 695.92 1.10%
TRY 11 000.00 ARCELIK AS 62 648.21 71 425.72 0.74%
TRY 0.20 AYGAZ AS 0.66 0.76 0.00%
TRY 6.46 TURKIYE SINAI KALKINMA BANK 2.44 2.29 0.00%
TRY 0.99 AKENERJI ELEKTRIK URETIM 0.85 0.27 0.00%
TRY 15 000.00 TAV HAVALIMANLARI HOLDINGS 55 322.11 70 526.24 0.73%
TRY 9 500.00 BIM BIRLESIK MAGAZALAR AS 157 379.82 154 451.34 1.60%
TRY 15 000.14 MIGROS TICARET AS 75 222.47 103 005.88 1.07%
TRY 0.57 TEFKEN HOLDING 1.03 1.24 0.00%
TRY 20 000.70 KOC HOLDING AS 78 452.07 80 632.69 0.84%
TRY 43 000.00 HACI OMER SABANCI HOLDING AS 113 004.58 117 105.20 1.22%
TRY 1.28 TURK SISE VE CAM 1.19 1.46 0.00%
TRY 1.36 ANADOLU SIGORTA 0.88 0.96 0.00%
TRY 0.68 KARDEMIR KARABUK DEMIR 0.51 0.30 0.00%
TRY 60 000.45 EREGLI DEMIR CELIK 87 969.51 105 397.71 1.09%
TRY 0.33 KOZA ALTIN ISLETMELERI AS 2.42 1.70 0.00%
TRY 0.89 TRAKYA CAM SANAYII 0.64 0.86 0.00%
TRY 1.22 SODA SANAYII 0.84 2.00 0.00%
TRY 4 750.00 TUPRAS TURKIYE PETROL 88 402.72 119 773.76 1.24%
TRY 0.30 SINPAS GAYRIMENKUL YATIRIM 0.12 0.05 0.00%
TRY 0.99 IS GAYRIMENKUL YATIRIM ORTAK 0.36 0.36 0.00%
TRY 30 000.00 TURKCELL ILETISIM HIZMET AS 122 525.17 86 560.02 0.90%
1 790 059.55 1 918 007.40 19.91%
USD 72 000 SBERBANK-SPONSORED ADR 518 612.41 652 996.85 6.78%
USD 3 600 X5 RETAIL GROUP N.V. 107 446.53 109 305.99 1.13%
USD 9 000 MAGNIT PJSC-SPON GDR 206 178.39 268 138.80 2.78%
USD 4 000 MAIL.RU GROUP-GDR REGS 89 709.59 92 358.92 0.96%
USD 2 250 YANDEX NV 33 282.17 51 735.02 0.54%
USD 5 000 NOVOLIPET STEEL GDR 43 280.00 84 822.99 0.88%
USD 16 500 MMC NORILSK JSC- ADR (LONDON) 207 475.87 199 526.81 2.07%
USD 168 500 OAO GAZPROM SPONSORED ADR 1 165 969.23 584 405.01 6.07%
USD 48 000 SURGUTNEFTEGAZ ADR 276 758.42 180 862.25 1.88%
USD 9 000 TATNEFT 248 966.63 297 318.61 3.09%
USD 2 300 NOVATEK OAO -GDR- 152 166.00 224 518.05 2.33%
USD 49 000 ROSNEFT OIL CO -GDR 262 827.93 233 364.00 2.42%
USD 10 000 MEGAFON-GDR 112 173.31 80 266.39 0.83%
USD 9 000 ROS AGRO PLC - GDR 122 912.05 91 876.97 0.95%
USD 21 000 LENTA LTD - REG 139 089.16 106 913.77 1.11%
USD 17 500 LUKOIL OIL ADR's 708 959.86 748 181.74 7.77%
USD 20 000 VEON LTD NPV- ADR 77 309.25 68 524.36 0.71%
USD 8 000 MOBILE TELESYSTEMS OJSC ADS 78 442.37 58 745.18 0.61%
4 551 559.17 4 133 861.71 42.92%
Total Investments in Equities 9 322 264.81 9 164 462.62 95.15%
Total Investments 9 322 264.81 9 164 462.62 95.15%
9 164 462.62
The accompanying notes form an integral part of these financial statements 23
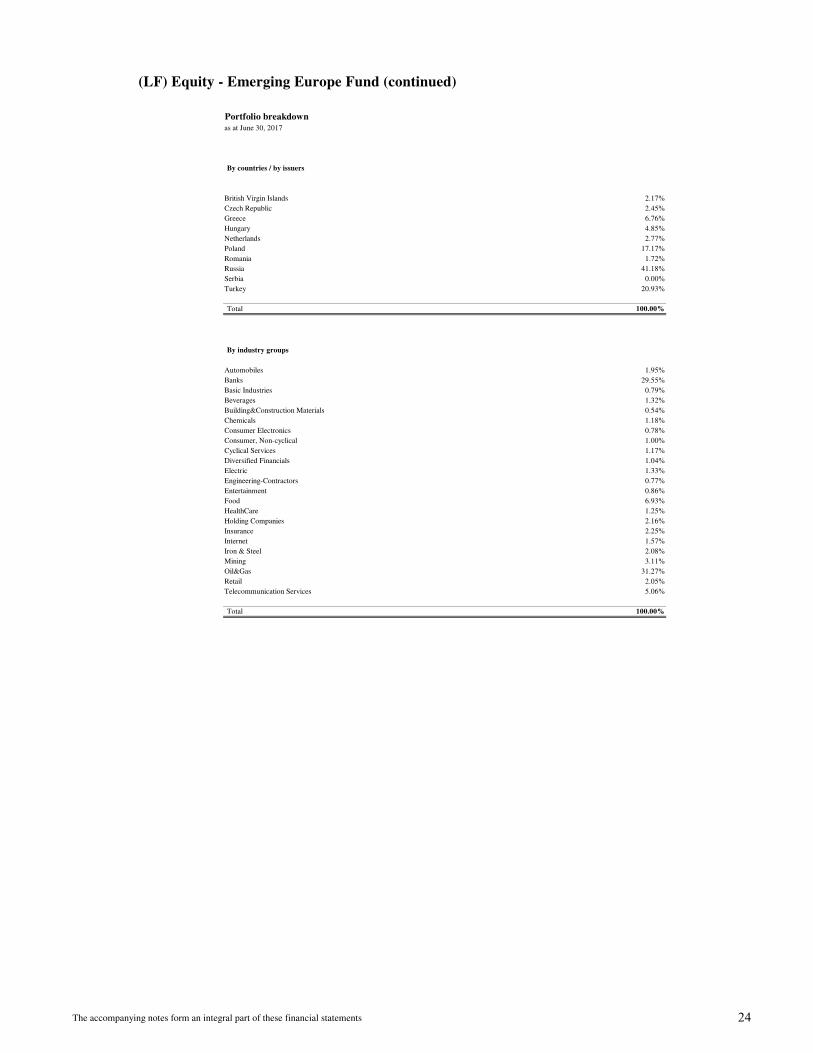
(LF) Equity - Emerging Europe Fund (continued)
Portfolio breakdownas at June 30, 2017
By countries / by issuers
British Virgin Islands 2.17%
Czech Republic 2.45%
Greece 6.76%
Hungary 4.85%
Netherlands 2.77%
Poland 17.17%
Romania 1.72%
Russia 41.18%
Serbia 0.00%
Turkey 20.93%
Total 100.00%
By industry groups
Automobiles 1.95%
Banks 29.55%
Basic Industries 0.79%
Beverages 1.32%
Building&Construction Materials 0.54%
Chemicals 1.18%
Consumer Electronics 0.78%
Consumer, Non-cyclical 1.00%
Cyclical Services 1.17%
Diversified Financials 1.04%
Electric 1.33%
Engineering-Contractors 0.77%
Entertainment 0.86%
Food 6.93%
HealthCare 1.25%
Holding Companies 2.16%
Insurance 2.25%
Internet 1.57%
Iron & Steel 2.08%
Mining 3.11%
Oil&Gas 31.27%
Retail 2.05%
Telecommunication Services 5.06%
Total 100.00%
The accompanying notes form an integral part of these financial statements 24

(LF) Equity - Greek Equities Fund
Schedule of investmentsas at June 30, 2017
(All figures in EUR)
Shares / Cost Market % of Net
Currency Nominal Name Price Price Assets
Transferable securities admitted to an official exchange listing
Equities
EUR 35 000 AEGEAN AIRLINES 234 276.80 290 500.00 2.07%
EUR 560 000 EUROBANK ERGASIAS SA 546 286.51 548 800.00 3.91%
EUR 500 000 ALPHA BANK SA 917 483.56 1 080 000.00 7.70%
EUR 3 000 000 NAT. BANK OF GREECE SA 822 176.91 999 000.00 7.12%
EUR 2 500 000 PIRAEUS BANK S.A. 581 147.80 537 500.00 3.83%
EUR 20 000 COCA-COLA HBC AG-CDI NEW 351 909.58 516 200.00 3.68%
EUR 34 000 TITAN CEMENT COMPANY S.A. 757 418.58 842 180.00 6.01%
EUR 80 000 ELLAKTOR 138 409.48 116 000.00 0.83%
EUR 18 000 PIRAEUS PORT AUTHORITY SA 239 824.03 277 740.00 1.98%
EUR 9 500 THESSALONIKI PORT AUTHORITY 219 559.23 210 900.00 1.50%
EUR 40 000 GR.SARANTHS S.A 188 120.43 487 600.00 3.48%
EUR 45 000 FOURLIS S.A 183 863.17 264 150.00 1.88%
EUR 45 000 HELLENIC EXCHANGES HOLDINGS S.A. 226 717.07 255 600.00 1.82%
EUR 120 000 ADMIE HOLDING 250 282.95 268 800.00 1.92%
EUR 80 000 PUBLIC POWER CORPORATION SA 152 459.36 175 200.00 1.25%
EUR 60 000 HELLENIC TECHNODOMIKI ANEMOS S.A. 102 000.00 90 600.00 0.65%
EUR 60 000 TERNA ENERG. 191 058.09 239 400.00 1.71%
EUR 59 000 GREEK ORGAN.OF FOOTBALL PROGN.S.A. 462 765.68 584 100.00 4.17%
EUR 110 000 MYTILINEOS HOLDINGS S.A. 587 076.66 908 600.00 6.48%
EUR 53 000 MOTOR OIL (HELLAS) CORINTH REFINERIES SA 753 587.90 1 010 710.00 7.21%
EUR 70 000 HELLENIC PETROLEUM S.A. 316 699.41 581 000.00 4.14%
EUR 120 000 GEK GROUP OF COMPANIES S.A. 287 440.89 487 200.00 3.47%
EUR 38 000 LAMDA DEVELOPMENT S.A 197 125.34 251 940.00 1.80%
EUR 29 000 GRIVALIA PROPERTIES REIC 159 177.32 265 350.00 1.89%
EUR 32 000 JUMBO S.A 313 562.58 512 000.00 3.65%
EUR 25 000 FOLLI FOLLIE S.A. 503 875.82 535 000.00 3.82%
EUR 53 000 HELLENIC TELECOM. ORG. 416 717.36 558 620.00 3.98%
EUR 65 000 ATHENS WATER SUPPLY & SEWAGE Co. 360 682.20 382 200.00 2.73%
EUR 8 000 THESSALONIKI WATER AND SEWAGE COMPANY SA 48 352.13 36 000.00 0.26%
10 510 056.84 13 312 890.00 94.95%
Total Investments in Equities 10 510 056.84 13 312 890.00 94.95%
Total Investments 10 510 056.84 13 312 890.00 94.95%
10 746 294.51 13 312 890.00
The accompanying notes form an integral part of these financial statements 25

(LF) Equity - Greek Equities Fund (continued)
Portfolio breakdownas at June 30, 2017
By countries / by issuers
Greece 96.12%
Switzerland 3.88%
Total 100.00%
By industry groups
Airlines&Airports 2.18%
Banks 23.78%
Beverages 3.88%
Building&Construction Materials 6.33%
Commercial Services 4.54%
Cosmetics 3.66%
Distribution-Wholesale 1.98%
Diversified Financials 1.92%
Electric 4.02%
Energy-Alternate Sources 1.80%
Entertainment 4.39%
Mining 6.82%
Oil&Gas 11.96%
Real Estate 5.55%
Real Estate Investment Trusts 1.99%
Retail 7.86%
Telecommunication Services 4.20%
Water 3.14%
Total 100.00%
The accompanying notes form an integral part of these financial statements 26

(LF) Income Plus $ Fund
Schedule of investmentsas at June 30, 2017
(All figures in USD)
Shares / Cost Market % of Net
Currency Nominal Name Price Price Assets
Transferable securities admitted to an official exchange listing
Bonds
USD 500 000 COMMONWEALTH BANK AUST 7/11/2019 1.81928 FLOATING 500 000.00 503 232.50 0.60%
USD 1 500 000 NATIONAL AUSTRALIA BANK 23/7/2018 1.79317 FLOATING 1 500 000.00 1 507 155.00 1.79%
USD 1 000 000 ROYAL BANK OF CANADA 2/3/2020 1.59 FLOATING 1 000 000.00 1 000 305.00 1.19%
USD 1 000 000 TORONTO-DOMINION BANK 18/1/2019 1.57844 FLOATING 1 000 000.00 1 003 400.00 1.19%
USD 500 000 DANSKE BANK A/S 2/3/2020 1.72 FLOATING 500 000.00 501 242.50 0.60%
USD 1 000 000 ABN AMRO BANK NV 18/1/2019 1.79844 FLOATING 1 000 000.00 1 004 450.00 1.19%
USD 1 000 000 SKANDINAVISKA ENSKILDA 13/9/2019 1.80644 FLOATING 1 000 000.00 1 004 465.00 1.19%
USD 600 000 STANDARD CHARTERED PLC 19/8/2019 2.30839 FLOATING 600 000.00 606 843.00 0.72%
USD 1 000 000 JP MORGAN CHASE BANK NA 21/9/2018 1.73022 FLOATING 1 000 000.00 1 002 700.00 1.19%
USD 250 000 CITIBANK NA 12/6/2020 1.72811 FLOATING 250 000.00 250 810.00 0.30%
USD 1 500 000 CITIBANK NA 20/3/2019 1.61356 FLOATING 1 500 000.00 1 502 265.00 1.78%
USD 1 000 000 FORD MOTOR CREDIT CO LLC 12/6/2020 2.01811 FLOATING 1 000 000.00 1 000 445.00 1.19%
USD 1 000 000 IBM CORP 27/1/2020 1.40039 FLOATING 1 000 000.00 1 003 600.00 1.19%
USD 300 000 MORGAN STANLEY 14/2/2020 1.98178 FLOATING 300 000.00 301 240.50 0.36%
USD 1 000 000 AMERICAN EXPRESS CREDIT 3/3/2020 1.64806 FLOATING 1 000 000.00 1 002 105.00 1.19%
USD 1 800 000 GOLDMAN SACHS GROUP INC 25/4/2019 2.19622 FLOATING 1 804 500.00 1 820 358.00 2.16%
USD 1 000 000 BERKSHIRE HATHAWAY INC 6/8/2018 1.32928 FLOATING 1 000 000.00 1 001 380.00 1.19%
USD 1 500 000 MET LIFE GLOB FUNDING I 14/9/2018 1.58167 FLOATING 1 500 000.00 1 504 582.50 1.79%
USD 200 000 NEW YORK LIFE GLOBAL FDG 9/4/2020 1.42761 FLOATING 200 000.00 200 486.00 0.24%
USD 3 000 000 SIEMENS FINANCIERINGSMAT 16/3/2020 1.59033 FLOATING 3 000 000.00 3 007 710.00 3.57%
USD 350 000 NISSAN MOTOR ACCEPTANCE 13/9/2019 1.75644 FLOATING 350 000.00 350 880.25 0.42%
USD 500 000 DEUTSCHE TELEKOM INT FIN 19/9/2019 1.71744 FLOATING 500 000.00 500 450.00 0.59%
USD 500 000 HYUNDAI CAPITAL AMERICA 3/4/2020 2.09861 FLOATING 500 000.00 500 792.50 0.59%
USD 500 000 SHELL INTERNATIONAL FIN 12/9/2019 1.57811 FLOATING 500 000.00 502 405.00 0.60%
USD 1 000 000 JOHN DEERE CAPITAL CORP 9/10/2019 1.44039 FLOATING 1 000 000.00 1 002 970.00 1.19%
USD 1 000 000 CATERPILLAR FINL SERVICE 22/3/2019 1.56722 FLOATING 1 000 000.00 1 002 465.00 1.19%
USD 250 000 BMW US CAPITAL LLC 13/9/2019 1.65556 FLOATING 250 000.00 251 458.75 0.30%
USD 950 000 APPLE INC 11/5/2020 1.252 FLOATING 950 000.00 949 430.00 1.13%
USD 600 000 PEPSICO INC 4/10/2019 1.56917 FLOATING 600 000.00 603 288.00 0.72%
USD 225 000 NISSAN MOTOR ACCEPTANCE 13/1/2020 1.73511 FLOATING 225 000.00 225 723.38 0.27%
USD 2 025 000 AMGEN INC 10/5/2019 1.502 FLOATING 2 025 000.00 2 031 054.75 2.41%
USD 400 000 GENERAL MOTORS FINL CO 13/4/2020 2.08511 FLOATING 400 000.00 402 268.00 0.48%
USD 500 000 CISCO SYSTEMS INC 20/9/2019 1.61356 FLOATING 500 000.00 503 220.00 0.60%
USD 2 000 000 WALT DISNEY COMPANY/THE 5/6/2020 1.4125 FLOATING 2 000 000.00 2 002 510.00 2.38%
USD 950 000 PEPSICO INC 2/5/2019 1.20956 FLOATING 950 000.00 950 009.50 1.13%
USD 200 000 BMW US CAPITAL LLC 6/4/2020 1.67917 FLOATING 200 000.00 200 883.00 0.24%
USD 550 000 GENERAL MOTORS FINL CO 4/10/2019 2.56917 FLOATING 550 000.00 556 399.25 0.66%
33 154 500.00 33 264 982.38 39.51%
Total Investments in Bonds 33 154 500.00 33 264 982.38 39.51%
Total transferable securities admitted to an official exchange listing 33 154 500.00 33 264 982.38 39.51%
Other transferable securities and money market instruments
Money Market Instruments
USD 4 000 000 ECD CS 18/08/2017 3 936 932.53 3 936 932.53 4.68%
USD 1 000 000 ECD CRAGLO 18/08/2017 985 550.73 985 550.73 1.17%
USD 3 000 000 ECP Abbey National 18/08/2017 2 956 946.85 2 956 946.85 3.51%
USD 3 000 000 ECP SG 18/08/2017 2 956 652.19 2 956 652.19 3.51%
USD 2 000 000 ECP ALLIANZ 28/07/2017 1 973 461.33 1 973 461.33 2.34%
USD 2 000 000 ECP BNP PARIBAS 15/08/2017 1 969 139.21 1 969 139.21 2.34%
USD 3 000 000 ECP NATIXIS 10/08/2017 2 957 716.97 2 957 716.97 3.51%
USD 2 000 000 ECP UBSUK 9/8/2017 1 972 084.05 1 972 084.05 2.34%
19 708 483.86 19 708 483.86 23.41%
Total Investments in Money Market Instruments 19 708 483.86 19 708 483.86 23.41%
Total other transferable securities and money market instruments 19 708 483.86 19 708 483.86 23.41%
Total Investments 52 862 983.86 52 973 466.24 62.92%
52 973 466.24
The accompanying notes form an integral part of these financial statements 27

(LF) Income Plus $ Fund (continued)
Portfolio breakdownas at June 30, 2017
By countries / by issuers
Australia 3.80%
Canada 3.78%
Denmark 0.95%
France 11.16%
Germany 9.40%
Japan 0.66%
Netherlands 2.84%
South Korea 0.95%
Sweden 1.90%
Switzerland 11.15%
United Kingdom 9.57%
United States 43.85%
Total 100.00%
By industry groups
Banks 20.55%
Commercial Papers 37.20%
Computer Hardware 1.89%
Finance & Credit institutions 5.90%
Insurance 5.11%
Other 29.34%
Total 100.00%
The accompanying notes form an integral part of these financial statements 28

(LF) Absolute Return Fund
Schedule of investmentsas at June 30, 2017
(All figures in EUR)
Shares / Cost Market % of Net
Currency Nominal Name Price Price Assets
Transferable securities admitted to an official exchange listing
Bonds
EUR 500 000 CARREFOUR BANQUE 20/3/2020 0.1875 FLOATING 500 000.00 503 527.50 0.75%
EUR 850 000 INTESA SANPAOLO SPA 18/1/2024 1.375 FIXED 844 160.50 854 092.75 1.27%
EUR 500 000 COOPERATIEVE RABOBANK UA 29/5/2020 0 FLOATING 499 750.00 503 195.00 0.75%
EUR 894 000 ERB HELLAS PLC 26/6/2018 4.25 FIXED 838 745.83 881 890.77 1.31%
EUR 500 000 WELLS FARGO & COMPANY 26/4/2021 0.291 FLOATING 500 000.00 505 437.50 0.75%
EUR 500 000 GENERAL ELECTRIC CO 28/5/2020 0 FLOATING 500 000.00 502 602.50 0.75%
EUR 500 000 GRIFONAS FINANCE PLC 28/8/2039 0.042 FLOATING 235 793.58 191 541.63 0.28%
EUR 1 000 000 RCI BANQUE SA 16/7/2018 0.248 FLOATING 1 000 750.00 1 003 895.00 1.49%
EUR 200 000 PETROLEOS MEXICANOS 21/8/2021 2.5 FIXED 199 914.00 204 290.00 0.30%
EUR 143 000 HELLENIC PETROLEUM FINAN 4/7/2019 5.25 FIXED 147 147.00 149 024.59 0.22%
EUR 300 000 MOTOR OIL FINANCE PLC 1/4/2022 3.25 FIXED 298 299.00 306 886.50 0.46%
EUR 700 000 OTE PLC 2/12/2019 4.375 FIXED 719 162.00 741 863.50 1.10%
EUR 200 000 OTE PLC 7/2/2018 7.875 FIXED 213 600.00 208 037.00 0.31%
EUR 500 000 BMW US CAPITAL LLC 18/3/2019 0.051 FLOATING 500 000.00 502 165.00 0.74%
EUR 500 000 FEDEX CORP 11/4/2019 0.22 FLOATING 500 000.00 502 650.00 0.75%
EUR 200 000 REPUBLIC OF CYPRUS 27/6/2024 2.75 FIXED 199 372.00 205 125.00 0.30%
EUR 500 000 REPUBLIC OF CYPRUS 6/5/2022 3.875 FIXED 498 750.00 549 947.50 0.82%
EUR 5 000 000 BUNDESSCHATZANWEISUNGEN 15/9/2017 0 FIXED 5 008 950.00 5 007 000.00 7.42%
EUR 75 000 HELLENIC REPUBLIC 24/2/2023 3 STEP CPN 55 117.19 70 104.38 0.10%
EUR 75 000 HELLENIC REPUBLIC 24/2/2032 3 STEP CPN 55 117.19 58 910.63 0.09%
EUR 75 000 HELLENIC REPUBLIC 24/2/2027 3 STEP CPN 55 117.19 66 224.25 0.10%
EUR 75 000 HELLENIC REPUBLIC 24/2/2031 3 STEP CPN 55 117.19 59 696.25 0.09%
EUR 75 000 HELLENIC REPUBLIC 24/2/2030 3 STEP CPN 55 117.19 60 713.25 0.09%
EUR 75 000 HELLENIC REPUBLIC 24/2/2029 3 STEP CPN 55 117.19 61 956.38 0.09%
EUR 75 000 HELLENIC REPUBLIC 24/2/2024 3 STEP CPN 55 117.19 69 044.63 0.10%
EUR 75 000 HELLENIC REPUBLIC 24/2/2037 3 STEP CPN 55 117.19 55 063.50 0.08%
EUR 75 000 HELLENIC REPUBLIC 24/2/2034 3 STEP CPN 55 117.19 57 196.50 0.08%
EUR 75 000 HELLENIC REPUBLIC 24/2/2026 3 STEP CPN 55 117.19 67 215.75 0.10%
EUR 75 000 HELLENIC REPUBLIC 24/2/2040 3 STEP CPN 55 117.19 54 551.25 0.08%
EUR 75 000 HELLENIC REPUBLIC 24/2/2042 3 STEP CPN 55 117.19 54 491.25 0.08%
EUR 75 000 HELLENIC REPUBLIC 24/2/2033 3 STEP CPN 55 117.19 57 984.75 0.09%
EUR 75 000 HELLENIC REPUBLIC 24/2/2035 3 STEP CPN 55 117.19 56 303.25 0.08%
EUR 75 000 HELLENIC REPUBLIC 24/2/2036 3 STEP CPN 55 117.19 55 609.88 0.08%
EUR 75 000 HELLENIC REPUBLIC 24/2/2025 3 STEP CPN 55 117.19 67 895.25 0.10%
EUR 75 000 HELLENIC REPUBLIC 24/2/2038 3 STEP CPN 55 117.19 54 701.63 0.08%
EUR 75 000 HELLENIC REPUBLIC 24/2/2039 3 STEP CPN 55 117.19 54 683.25 0.08%
EUR 75 000 HELLENIC REPUBLIC 24/2/2028 3 STEP CPN 55 117.19 63 736.13 0.09%
EUR 75 000 HELLENIC REPUBLIC 24/2/2041 3 STEP CPN 55 117.19 54 539.25 0.08%
EUR 3 000 000 NETHERLANDS GOVERNMENT 15/1/2020 0.25 FIXED 3 005 400.00 3 059 595.00 4.54%
EUR 500 000 OBRIGACOES DO TESOURO 17/10/2022 2.2 FIXED 485 470.00 523 260.00 0.78%
EUR 2 000 000 SPAIN LETRAS DEL TESORO 17/11/2017 0 ZERO COUPON 2 003 955.75 2 003 000.00 2.97%
EUR 500 000 BONOS Y OBLIG DEL ESTADO 31/10/2027 1.45 FIXED 496 245.00 492 130.00 0.73%
EUR 2 000 000 HELLENIC T-BILL 3/11/2017 0 ZERO COUPON 1 970 420.00 1 988 990.00 2.95%
EUR 1 600 000 HELLENIC REPUBLIC 17/7/2017 3.375 FIXED 1 560 045.00 1 599 272.00 2.37%
EUR 2 000 000 HELLENIC T-BILL 11/8/2017 0 ZERO COUPON 1 986 440.00 1 996 700.00 2.96%
25 814 713.46 26 186 740.15 38.83%
RON 4 500 000 ROMANIA GOVERNMENT BOND 26/2/2020 2.25 FIXED 1 002 708.90 999 147.68 1.48%
USD 300 000 UNICREDIT SPA 12/4/2022 3.75 FIXED 279 583.26 269 454.52 0.40%
USD 1 600 000 BANCO SANTANDER SA 11/4/2022 2.71761 FLOATING 1 502 206.37 1 445 404.84 2.14%
USD 500 000 SKANDINAVISKA ENSKILDA 13/9/2019 1.80644 FLOATING 448 068.82 440 091.57 0.65%
USD 400 000 STANDARD CHARTERED PLC 19/8/2019 2.30839 FLOATING 354 139.00 354 505.78 0.53%
USD 200 000 CITIGROUP INC 25/4/2022 2.11622 FLOATING 187 230.86 176 296.88 0.26%
USD 250 000 CITIBANK NA 12/6/2020 1.72811 FLOATING 222 064.31 219 777.43 0.33%
USD 1 000 000 HSBC USA INC 23/6/2019 2.25 FIXED 949 158.63 880 849.11 1.31%
USD 500 000 IBM CORP 12/2/2019 1.55094 FLOATING 370 507.59 440 501.23 0.65%
USD 500 000 MICROSOFT CORP 12/2/2025 2.7 FIXED 470 437.20 437 107.87 0.65%
USD 250 000 WESTPAC BANKING CORP 13/5/2019 1.89178 FLOATING 219 394.47 220 722.70 0.33%
USD 200 000 MORGAN STANLEY 14/2/2020 1.98178 FLOATING 188 270.73 175 978.79 0.26%
USD 1 000 000 SIEMENS FINANCIERINGSMAT 16/3/2020 1.59033 FLOATING 947 328.53 878 522.61 1.30%
USD 250 000 CEMEX SAB DE CV 15/10/2018 5.90844 FLOATING 185 130.33 227 969.46 0.34%
USD 400 000 PEPSICO INC 4/10/2019 1.56917 FLOATING 355 998.58 352 429.02 0.52%
USD 250 000 BMW US CAPITAL LLC 13/9/2019 1.65556 FLOATING 221 317.28 220 345.91 0.33%
USD 300 000 FORD MOTOR CREDIT CO LLC 28/3/2022 2.56483 FLOATING 276 268.53 264 601.74 0.39%
USD 300 000 GENERAL MOTORS FINL CO 13/4/2020 2.08511 FLOATING 283 607.49 264 371.71 0.39%
USD 500 000 APPLE INC 6/5/2024 3.45 FIXED 456 683.39 456 701.28 0.68%
USD 1 000 000 REPUBLIC OF FINLAND 23/4/2019 1 FIXED 882 474.77 868 493.69 1.29%
USD 500 000 ROMANIA 22/1/2024 4.875 FIXED 366 749.96 478 055.99 0.71%
USD 1 000 000 US TREASURY N/B 31/1/2022 1.875 FIXED 939 697.61 877 400.16 1.30%
USD 500 000 US TREASURY N/B 31/8/2021 1.125 FIXED 446 630.96 426 651.36 0.63%
USD 1 000 000 US TREASURY N/B 30/9/2017 0.625 FIXED 939 447.61 875 346.40 1.30%
USD 1 000 000 US TREASURY N/B 28/2/2022 1.875 FIXED 945 061.24 877 365.93 1.30%
12 437 457.52 12 128 945.98 17.98%
Total Investments in Bonds 39 254 879.88 39 314 833.81 58.29%
The accompanying notes form an integral part of these financial statements 29

(LF) Absolute Return Fund (continued)
Schedule of investmentsas at June 30, 2017
(All figures in EUR)
Shares / Cost Market % of Net
Currency Nominal Name Price Price Assets
Transferable securities admitted to an official exchange listing
Equities
EUR 25 653 BANCO BILBAO VIZCAYA (LUX) 227 611.23 186 369.05 0.28%
EUR 50 000 ELLAKTOR 61 460.92 72 500.00 0.11%
EUR 40 000 SPDR EM LOCAL GOV BND 2 698 780.00 2 637 200.00 3.91%
EUR 4 519 FOLLI FOLLIE S.A. 105 763.68 96 706.60 0.14%
EUR 40 000 HELLENIC TELECOM. ORG. 321 735.00 421 600.00 0.63%
3 415 350.83 3 414 375.65 5.06%
USD 4 000 TEVA PHARMACEUTICAL INDUSTRIES 184 592.29 116 438.84 0.17%
184 592.29 116 438.84 0.17%
Total Investments in Equities 3 599 943.12 3 530 814.49 5.24%
Funds
EUR 7 000 LYXOR MSCI INDIA ETF 95 084.50 107 170.00 0.16%
Total Investments in Funds 95 084.50 107 170.00 0.16%
Other Securities
EUR 200 000 WARRANT HELLENIC REPUBLIC 15/10/2042 0 VARIABLE 274 500.00 50 600.00 0.08%
Total Investments in Other Securities 274 500.00 50 600.00 0.08%
Total transferable securities admitted to an official exchange listing 43 224 407.50 43 003 418.30 63.76%
Total Investments 43 224 407.50 43 003 418.30 63.76%
43 003 418.30
The accompanying notes form an integral part of these financial statements 30
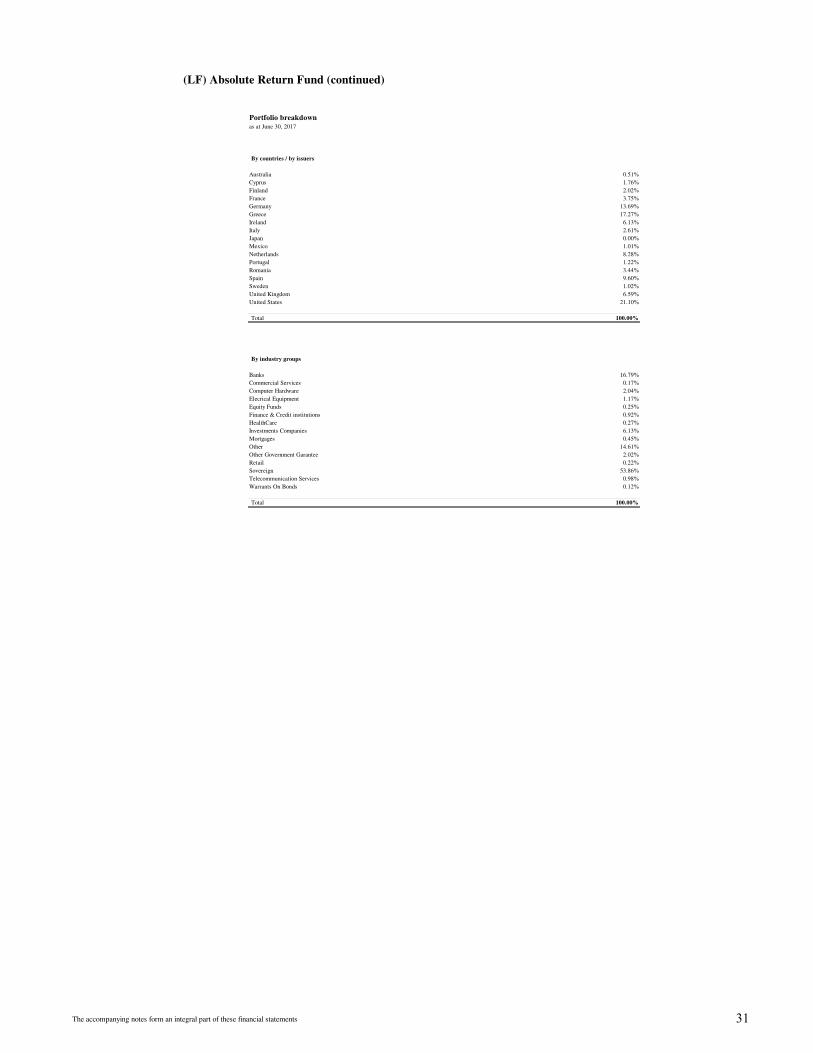
(LF) Absolute Return Fund (continued)
Portfolio breakdownas at June 30, 2017
By countries / by issuers
Australia 0.51%
Cyprus 1.76%
Finland 2.02%
France 3.75%
Germany 13.69%
Greece 17.27%
Ireland 6.13%
Italy 2.61%
Japan 0.00%
Mexico 1.01%
Netherlands 8.28%
Portugal 1.22%
Romania 3.44%
Spain 9.60%
Sweden 1.02%
United Kingdom 6.59%
United States 21.10%
Total 100.00%
By industry groups
Banks 16.79%
Commercial Services 0.17%
Computer Hardware 2.04%
Elecrical Equipment 1.17%
Equity Funds 0.25%
Finance & Credit institutions 0.92%
HealthCare 0.27%
Investments Companies 6.13%
Mortgages 0.45%
Other 14.61%
Other Government Garantee 2.02%
Retail 0.22%
Sovereign 53.86%
Telecommunication Services 0.98%
Warrants On Bonds 0.12%
Total 100.00%
The accompanying notes form an integral part of these financial statements 31

(LF) Special Purpose Dual Formula Fund
Schedule of investmentsas at June 30, 2017
(All figures in EUR)
Shares / Cost Market % of Net
Currency Nominal Name Price Price Assets
Transferable securities admitted to an official exchange listing
Bonds
EUR 2 500 000 HELLENIC T-BILL 8/9/2017 0 ZERO COUPON 2 483 050.00 2 492 100.00 10.11%
EUR 5 000 000 HELLENIC T-BILL 14/7/2017 0 ZERO COUPON 4 979 560.00 4 998 000.00 20.28%
EUR 2 300 000 HELLENIC T-BILL 11/8/2017 0 ZERO COUPON 2 284 406.00 2 296 205.00 9.32%
EUR 1 000 000 HELLENIC T-BILL 8/12/2017 0 ZERO COUPON 985 210.00 992 400.00 4.03%
EUR 10 000 HELLENIC T-BILL 1/9/2017 0 ZERO COUPON 9 852.10 9 972.20 0.04%
EUR 7 150 000 HELLENIC REPUBLIC 17/7/2017 3.375 FIXED 7 087 484.49 7 146 746.75 29.00%
EUR 300 000 HELLENIC T-BILL 15/9/2017 0 ZERO COUPON 297 966.00 299 295.00 1.21%
EUR 1 500 000 HELLENIC T-BILL 7/7/2017 0 ZERO COUPON 1 478 175.00 1 499 775.00 6.09%
Total Investments in Bonds 19 605 703.59 19 734 493.95 80.08%
Other securities
EUR 49 329 WARRANT HELLENIC REPUBLIC 15/10/2042 0 VARIABLE 0.00 12 480.24 0.05%
Total Investments in Other securities 0.00 12 480.24 0.05%
Total transferable securities admitted to an official exchange listing 19 605 703.59 19 746 974.19 80.13%
Total Investments 19 605 703.59 19 746 974.19 80.13%
19 746 974.19
Portfolio breakdownas at June 30, 2017
By countries / by issuers
Greece 100.00%
Total 100.00%
By industry groups
Sovereign 99.94%
Warrants On Bonds 0.06%
Total 100.00%
The accompanying notes form an integral part of these financial statements 32

(LF) Special Purpose Blue Chips Protect Fund
Schedule of investmentsas at June 30, 2017
(All figures in EUR)
Shares / Cost Market % of Net
Currency Nominal Name Price Price Assets
Transferable securities admitted to an official exchange listing
Bonds
EUR 749 000 ERB HELLAS PLC 26/6/2018 4.25 FIXED 679 679.15 738 854.80 7.45%
EUR 150 000 OTE PLC 7/2/2018 7.875 FIXED 156 332.78 156 027.75 1.57%
EUR 750 000 TREASURY CERTIFICATES 9/11/2017 0 ZERO COUPON 753 456.06 751 751.25 7.58%
EUR 2 575 000 HELLENIC REPUBLIC 17/7/2017 3.375 FIXED 2 467 035.31 2 573 828.38 25.96%
EUR 750 000 HELLENIC T-BILL 3/11/2017 0 ZERO COUPON 738 907.50 745 871.25 7.52%
EUR 300 000 HELLENIC T-BILL 14/7/2017 0 ZERO COUPON 298 056.00 299 880.00 3.03%
EUR 1 800 000 HELLENIC T-BILL 6/10/2017 0 ZERO COUPON 1 773 378.00 1 792 332.00 18.08%
EUR 100 000 HELLENIC T-BILL 8/9/2017 0 ZERO COUPON 99 322.00 99 684.00 1.01%
EUR 1 200 000 HELLENIC T-BILL 8/12/2017 0 ZERO COUPON 1 182 252.00 1 190 880.00 12.01%
EUR 400 000 HELLENIC T-BILL 11/8/2017 0 ZERO COUPON 397 288.00 399 340.00 4.03%
EUR 250 000 HELLENIC T-BILL 4/8/2017 0 ZERO COUPON 246 302.50 249 661.25 2.52%
Total Investments in Bonds 8 792 009.30 8 998 110.68 90.77%
Total Investments 8 792 009.30 8 998 110.68 90.77%
8 998 110.68
Portfolio breakdownas at June 30, 2017
By countries / by issuers
Belgium 8.35%
Greece 81.70%
United Kingdom 9.95%
Total 100.00%
By industry groups
Banks 8.21%
Other 1.73%
Sovereign 90.05%
Total 100.00%
The accompanying notes form an integral part of these financial statements 33

(LF) Special Purpose Blue Chips Protect II Fund
Schedule of investmentsas at June 30, 2017
(All figures in EUR)
Shares / Cost Market % of Net
Currency Nominal Name Price Price Assets
Transferable securities admitted to an official exchange listing
Bonds
EUR 599 000 ERB HELLAS PLC 26/6/2018 4.25 FIXED 561 274.50 590 886.55 8.36%
EUR 400 000 TREASURY CERTIFICATES 9/11/2017 0 ZERO COUPON 401 843.23 400 934.00 5.67%
EUR 50 000 HELLENIC T-BILL 8/9/2017 0 ZERO COUPON 49 661.00 49 842.00 0.71%
EUR 300 000 HELLENIC T-BILL 11/8/2017 0 ZERO COUPON 297 966.00 299 505.00 4.24%
EUR 300 000 HELLENIC T-BILL 14/7/2017 0 ZERO COUPON 298 056.00 299 880.00 4.24%
EUR 250 000 HELLENIC T-BILL 4/8/2017 0 ZERO COUPON 246 302.50 249 661.25 3.53%
EUR 650 000 HELLENIC T-BILL 8/12/2017 0 ZERO COUPON 640 386.50 645 060.00 9.12%
EUR 1 825 000 HELLENIC REPUBLIC 17/7/2017 3.375 FIXED 1 749 183.78 1 824 169.63 25.80%
EUR 450 000 HELLENIC T-BILL 3/11/2017 0 ZERO COUPON 443 344.50 447 522.75 6.33%
EUR 1 600 000 HELLENIC T-BILL 6/10/2017 0 ZERO COUPON 1 576 336.00 1 593 184.00 22.54%
Total Investments in Bonds 6 264 354.01 6 400 645.18 90.54%
Total Investments 6 264 354.01 6 400 645.18 90.54%
6 400 645.18
Portfolio breakdownas at June 30, 2017
By countries / by issuers
Belgium 6.26%
Greece 84.50%
United Kingdom 9.23%
Total 100.00%
By industry groups
Banks 9.22%
Sovereign 90.77%
Total 100.00%
The accompanying notes form an integral part of these financial statements 34

(LF) Special Purpose Blue Chips Protect III Fund
Schedule of investmentsas at June 30, 2017
(All figures in EUR)
Shares / Cost Market % of Net
Currency Nominal Name Price Price Assets
Transferable securities admitted to an official exchange listing
Bonds
EUR 599 000 ERB HELLAS PLC 26/6/2018 4.25 FIXED 561 274.50 590 886.55 7.42%
EUR 300 000 OTE PLC 7/2/2018 7.875 FIXED 319 114.00 312 055.50 3.92%
EUR 400 000 TREASURY CERTIFICATES 9/11/2017 0 ZERO COUPON 401 843.23 400 934.00 5.04%
EUR 600 000 HELLENIC T-BILL 3/11/2017 0 ZERO COUPON 591 126.00 596 697.00 7.50%
EUR 200 000 HELLENIC T-BILL 14/7/2017 0 ZERO COUPON 198 704.00 199 920.00 2.51%
EUR 2 100 000 HELLENIC REPUBLIC 17/7/2017 3.375 FIXED 2 011 964.53 2 099 044.50 26.37%
EUR 300 000 HELLENIC T-BILL 4/8/2017 0 ZERO COUPON 295 563.00 299 593.50 3.76%
EUR 100 000 HELLENIC T-BILL 8/9/2017 0 ZERO COUPON 99 322.00 99 684.00 1.25%
EUR 850 000 HELLENIC T-BILL 8/12/2017 0 ZERO COUPON 837 428.50 843 540.00 10.60%
EUR 1 300 000 HELLENIC T-BILL 6/10/2017 0 ZERO COUPON 1 280 773.00 1 294 462.00 16.26%
EUR 250 000 HELLENIC T-BILL 11/8/2017 0 ZERO COUPON 248 305.00 249 587.50 3.14%
Total Investments in Bonds 6 845 417.76 6 986 404.55 87.76%
Total Investments 6 845 417.76 6 986 404.55 87.76%
6 986 404.55
Portfolio breakdownas at June 30, 2017
By countries / by issuers
Belgium 5.74%
Greece 81.34%
United Kingdom 12.92%
Total 100.00%
By industry groups
Banks 8.46%
Other 4.47%
Sovereign 87.08%
Total 100.00%
The accompanying notes form an integral part of these financial statements 35
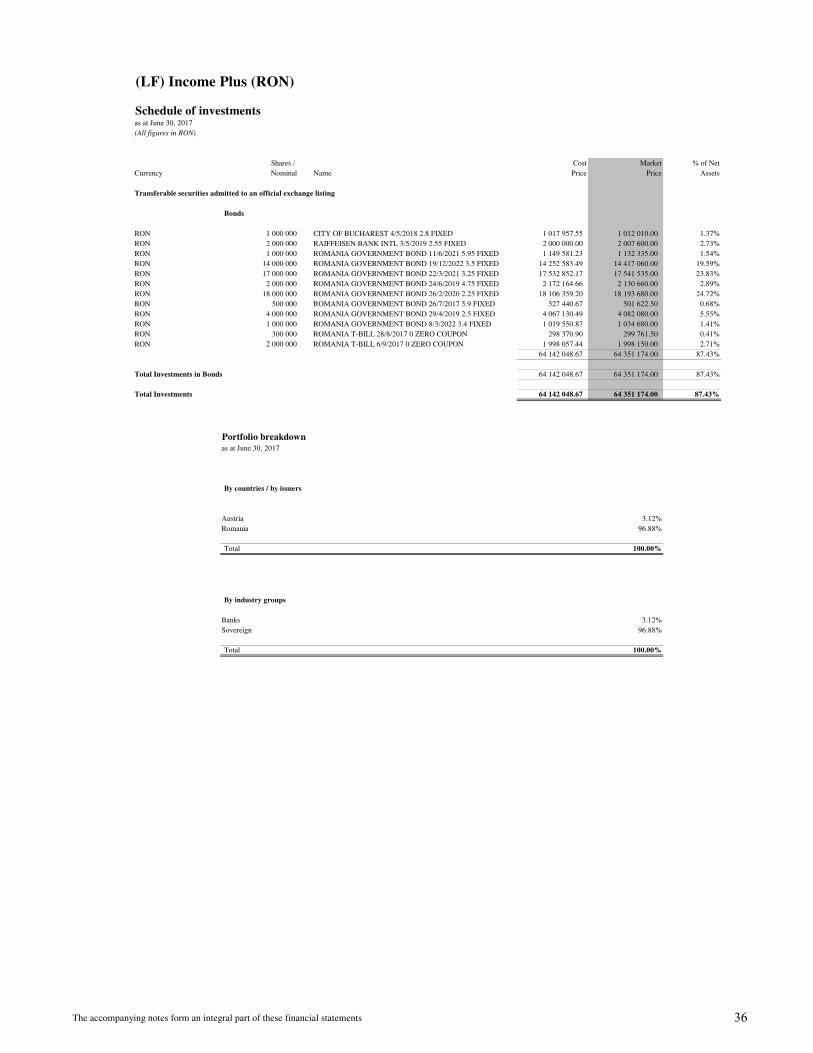
(LF) Income Plus (RON)
Schedule of investmentsas at June 30, 2017
(All figures in RON)
Shares / Cost Market % of Net
Currency Nominal Name Price Price Assets
Transferable securities admitted to an official exchange listing
Bonds
RON 1 000 000 CITY OF BUCHAREST 4/5/2018 2.8 FIXED 1 017 957.55 1 012 010.00 1.37%
RON 2 000 000 RAIFFEISEN BANK INTL 3/5/2019 2.55 FIXED 2 000 000.00 2 007 600.00 2.73%
RON 1 000 000 ROMANIA GOVERNMENT BOND 11/6/2021 5.95 FIXED 1 149 581.23 1 132 335.00 1.54%
RON 14 000 000 ROMANIA GOVERNMENT BOND 19/12/2022 3.5 FIXED 14 252 583.49 14 417 060.00 19.59%
RON 17 000 000 ROMANIA GOVERNMENT BOND 22/3/2021 3.25 FIXED 17 532 852.17 17 541 535.00 23.83%
RON 2 000 000 ROMANIA GOVERNMENT BOND 24/6/2019 4.75 FIXED 2 172 164.66 2 130 660.00 2.89%
RON 18 000 000 ROMANIA GOVERNMENT BOND 26/2/2020 2.25 FIXED 18 106 359.20 18 193 680.00 24.72%
RON 500 000 ROMANIA GOVERNMENT BOND 26/7/2017 5.9 FIXED 527 440.67 501 622.50 0.68%
RON 4 000 000 ROMANIA GOVERNMENT BOND 29/4/2019 2.5 FIXED 4 067 130.49 4 082 080.00 5.55%
RON 1 000 000 ROMANIA GOVERNMENT BOND 8/3/2022 3.4 FIXED 1 019 550.87 1 034 680.00 1.41%
RON 300 000 ROMANIA T-BILL 28/8/2017 0 ZERO COUPON 298 370.90 299 761.50 0.41%
RON 2 000 000 ROMANIA T-BILL 6/9/2017 0 ZERO COUPON 1 998 057.44 1 998 150.00 2.71%
64 142 048.67 64 351 174.00 87.43%
Total Investments in Bonds 64 142 048.67 64 351 174.00 87.43%
Total Investments 64 142 048.67 64 351 174.00 87.43%
64 351 174.00
Portfolio breakdownas at June 30, 2017
By countries / by issuers
Austria 3.12%
Romania 96.88%
Total 100.00%
By industry groups
Banks 3.12%
Sovereign 96.88%
Total 100.00%
The accompanying notes form an integral part of these financial statements 36

(LF) Balanced - Active Fund (RON)
Schedule of investmentsas at June 30, 2017
(All figures in RON)
Shares / Cost Market % of Net
Currency Nominal Name Price Price Assets
Transferable securities admitted to an official exchange listing
Bonds
RON 500 000 CITY OF BUCHAREST 4/5/2018 2.8 FIXED 508 978.78 506 005.00 1.38%
RON 1 000 000 RAIFFEISEN BANK INTL 3/5/2019 2.55 FIXED 1 000 000.00 1 003 800.00 2.73%
RON 80 000 ROMANIA GOVERNMENT BOND 17/1/2018 3.25 FIXED 81 239.11 81 127.60 0.22%
RON 1 000 000 ROMANIA GOVERNMENT BOND 19/12/2022 3.5 FIXED 1 038 689.70 1 029 790.00 2.80%
RON 4 000 000 ROMANIA GOVERNMENT BOND 24/2/2025 4.75 FIXED 4 594 503.28 4 317 680.00 11.75%
RON 1 000 000 ROMANIA GOVERNMENT BOND 24/6/2019 4.75 FIXED 1 086 082.33 1 065 330.00 2.90%
RON 4 000 000 ROMANIA GOVERNMENT BOND 26/2/2020 2.25 FIXED 4 028 943.94 4 043 040.00 11.00%
RON 560 000 ROMANIA GOVERNMENT BOND 26/7/2017 5.9 FIXED 591 151.00 561 817.20 1.53%
RON 1 000 000 ROMANIA GOVERNMENT BOND 29/4/2019 2.5 FIXED 1 017 710.02 1 020 520.00 2.78%
RON 1 000 000 ROMANIA T-BILL 21/2/2018 0 ZERO COUPON 991 578.20 995 330.00 2.71%
RON 50 000 ROMANIA T-BILL 28/8/2017 0 ZERO COUPON 49 891.21 49 960.25 0.14%
RON 1 600 000 ROMANIA T-BILL 6/9/2017 0 ZERO COUPON 1 598 341.82 1 598 520.00 4.35%
Total Investments on Bonds 16 587 109.39 16 272 920.05 44.27%
Equities
RON 702 964 ANTIBIOTICE 284 255.10 381 006.49 1.04%
RON 700 108 BANCA COMERCIALA CARPATICA 140 270.30 69 870.78 0.19%
RON 1 040 001 BANCA TRANSILVANIA 766 806.09 2 792 402.69 7.60%
RON 225 000 BRD -GROUPE SOCIETE GENERALE 2 056 268.20 3 033 000.00 8.25%
RON 50 000 CONDMAG SA 27 556.25 0.00 0.00%
RON 1 450 000 DAFORA MEDIAS 160 515.88 0.00 0.00%
RON 190 000 ELECTRICA SA 2 270 211.71 2 489 000.00 6.77%
RON 250 600 ELECTROMAGNETICA-BUCURESTI 48 867.00 42 977.90 0.12%
RON 2 500 IPROEB BISTRITA 1 598.57 2 130.00 0.01%
RON 12 500 NUCLEARELECTRICA 112 497.68 79 875.00 0.22%
RON 50 000 ROMGAZ SA 1 588 561.44 1 537 500.00 4.18%
RON 37 000 SC BURCA DE VALORI 1 352 311.69 1 209 900.00 3.29%
RON 6 700 000 SNP PETROM 2 537 103.87 1 899 450.00 5.17%
RON 65 000 TRANSELECTRICA 1 655 279.30 1 777 750.00 4.84%
RON 3 500 TRANSGAZ S.A. 800 627.17 1 253 000.00 3.41%
RON 100 000 ZENTIVA SA 110 000.00 210 000.00 0.57%
Total Investments in Equities 13 912 730.26 16 777 862.86 45.64%
Total Investments 30 499 839.65 33 050 782.91 89.91%
33 050 782.91
Portfolio breakdownas at June 30, 2017
By countries / by issuers
Austria 3.04%
Romania 96.96%
Total 100.00%
By industry groups
Banks 20.87%
Diversified Financials 3.66%
Electric 13.15%
Engineering-Contractors 0.00%
Gas Distribution 3.79%
Industrial components 0.13%
Oil&Gas 10.40%
Oil&Gas-Services 0.00%
Pharmaceuticals 1.79%
Sovereign 46.20%
Telecommunication Services 0.01%
Total 100.00%
The accompanying notes form an integral part of these financial statements 37

(LF) Equity - Flexi Style Greece Fund
Schedule of investmentsas at June 30, 2017
(All figures in EUR)
Shares / Cost Market % of Net
Currency Nominal Name Price Price Assets
Transferable securities admitted to an official exchange listing
Equities
EUR 216 000 ADMIE HOLDING 448 322.63 483 840.00 2.93%
EUR 40 000 AEGEAN AIRLINES 274 955.43 332 000.00 2.01%
EUR 600 000 ALPHA BANK SA 1 121 692.37 1 296 000.00 7.85%
EUR 70 000 ATHENS WATER SUPPLY & SEWAGE Co. 400 781.32 411 600.00 2.49%
EUR 24 000 COCA-COLA HBC AG-CDI NEW 406 444.37 619 440.00 3.75%
EUR 90 000 ELLAKTOR 145 483.78 130 500.00 0.79%
EUR 700 000 EUROBANK ERGASIAS SA 724 376.31 686 000.00 4.16%
EUR 30 000 FOLLI FOLLIE S.A. 611 587.54 642 000.00 3.89%
EUR 45 000 FOURLIS S.A 124 373.25 264 150.00 1.60%
EUR 140 000 GEK GROUP OF COMPANIES S.A. 299 371.90 568 400.00 3.44%
EUR 47 000 GR.SARANTHS S.A 198 468.18 572 930.00 3.47%
EUR 60 000 GREEK ORGAN.OF FOOTBALL PROGN.S.A. 484 489.75 594 000.00 3.60%
EUR 29 000 GRIVALIA PROPERTIES REIC 180 107.19 265 350.00 1.61%
EUR 60 000 HELLENIC EXCHANGES HOLDINGS S.A. 344 499.30 340 800.00 2.06%
EUR 80 000 HELLENIC PETROLEUM S.A. 492 798.05 664 000.00 4.02%
EUR 445 000 HELLENIC TECHNODOMIKI ANEMOS S.A. 713 296.29 671 950.00 4.07%
EUR 65 000 HELLENIC TELECOM. ORG. 546 203.56 685 100.00 4.15%
EUR 42 000 JUMBO S.A 483 385.10 672 000.00 4.07%
EUR 35 500 LAMDA DEVELOPMENT S.A 167 437.97 235 365.00 1.43%
EUR 60 000 MOTOR OIL (HELLAS) CORINTH REFINERIES SA 876 205.38 1 144 200.00 6.93%
EUR 130 000 MYTILINEOS HOLDINGS S.A. 728 269.73 1 073 800.00 6.50%
EUR 3 700 000 NAT. BANK OF GREECE SA 1 023 973.41 1 232 100.00 7.46%
EUR 3 000 000 PIRAEUS BANK S.A. 662 011.89 645 000.00 3.91%
EUR 10 000 PIRAEUS PORT AUTHORITY SA 154 867.37 154 300.00 0.93%
EUR 95 000 TERNA ENERG. 299 198.51 379 050.00 2.30%
EUR 10 000 THESSALONIKI PORT AUTHORITY 227 680.38 222 000.00 1.34%
EUR 6 000 THESSALONIKI WATER AND SEWAGE COMPANY SA 33 287.17 27 000.00 0.16%
EUR 24 000 TITAN CEMENT COMPANY S.A. 541 224.62 594 480.00 3.60%
Total Investments in Equities 12 714 792.76 15 607 355.00 94.53%
Total Investments 12 714 792.76 15 607 355.00 94.53%
15 607 355.00
Portfolio breakdownas at June 30, 2017
By countries / by issuers
Greece 96.03%
Cyprus 0.00%
Switzerland 3.97%
Total 100.00%
By industry groups
Airlines&Airports 2.13%
Banks 24.73%
Beverages 3.97%
Building&Construction Materials 3.81%
Commercial Services 3.25%
Cosmetics 3.67%
Distribution-Wholesale 1.69%
Diversified Financials 2.18%
Electric 7.41%
Energy-Alternate Sources 2.43%
Entertainment 3.81%
Mining 6.88%
Oil&Gas 11.59%
Real Estate 5.15%
Real Estate Investment Trusts 1.70%
Retail 8.42%
Telecommunication Services 4.39%
Water 2.81%
Total 100.00%
The accompanying notes form an integral part of these financial statements 38

(LF) Income Plus € Fund
Schedule of investmentsas at June 30, 2017
(All figures in EUR)
Shares / Cost Market % of Net
Currency Nominal Name Price Price Assets
Transferable securities admitted to an official exchange listing
Bonds
EUR 100 000 ERB HELLAS PLC 26/6/2018 4.25 FIXED 92 050.00 98 645.50 0.22%
EUR 200 000 HELLENIC PETROLEUM FINAN 4/7/2019 5.25 FIXED 205 750.00 208 426.00 0.47%
EUR 400 000 HELLENIC REPUBLIC 17/4/2019 4.75 FIXED 388 003.69 407 338.00 0.92%
EUR 8 200 000 HELLENIC REPUBLIC 17/7/2017 3.375 FIXED 7 803 522.47 8 196 269.00 18.58%
EUR 3 500 000 HELLENIC T-BILL 11/8/2017 0 ZERO COUPON 3 476 270.00 3 494 225.00 7.92%
EUR 1 000 000 HELLENIC T-BILL 14/7/2017 0 ZERO COUPON 993 520.00 999 600.00 2.27%
EUR 8 500 000 HELLENIC T-BILL 15/9/2017 0 ZERO COUPON 8 442 370.00 8 480 025.00 19.23%
EUR 1 500 000 HELLENIC T-BILL 6/10/2017 0 ZERO COUPON 1 477 815.00 1 493 610.00 3.39%
EUR 2 800 000 HELLENIC T-BILL 7/7/2017 0 ZERO COUPON 2 791 949.00 2 799 580.00 6.35%
EUR 6 000 000 HELLENIC T-BILL 8/12/2017 0 ZERO COUPON 5 911 260.00 5 954 400.00 13.50%
EUR 100 000 PUBLIC POWER CORP FIN 1/5/2019 5.5 FIXED 87 375.00 87 884.50 0.20%
Total Investments in Bonds 31 669 885.16 32 220 003.00 73.06%
Total Investments 31 669 885.16 32 220 003.00 73.06%
32 220 003.00
Portfolio breakdownas at June 30, 2017
By countries / by issuers
Greece 98.77%
United Kingdom 1.23%
Total 100.00%
By industry groups
Banks 0.31%
Electricity 0.27%
Other 0.65%
Sovereign 98.77%
Total 100.00%
The accompanying notes form an integral part of these financial statements 39

(LF) Greek Government Bond Fund
Schedule of investmentsas at June 30, 2017
(All figures in EUR)
Shares / Cost Market % of Net
Currency Nominal Name Price Price Assets
Transferable securities admitted to an official exchange listing
Bonds
EUR 942 650 HELLENIC REPUBLIC 24/2/2023 3 STEP CPN 678 137.75 881 118.52 2.42%
EUR 826 660 HELLENIC REPUBLIC 24/2/2040 3 STEP CPN 605 385.56 601 271.15 1.65%
EUR 2 792 650 HELLENIC REPUBLIC 24/2/2024 3 STEP CPN 2 022 198.95 2 570 899.63 7.05%
EUR 2 741 660 HELLENIC REPUBLIC 24/2/2031 3 STEP CPN 1 807 447.48 2 182 224.28 5.98%
EUR 776 660 HELLENIC REPUBLIC 24/2/2041 3 STEP CPN 575 095.71 564 779.39 1.55%
EUR 1 751 660 HELLENIC REPUBLIC 24/2/2038 3 STEP CPN 1 161 871.83 1 277 581.98 3.50%
EUR 3 001 660 HELLENIC REPUBLIC 24/2/2035 3 STEP CPN 2 078 243.72 2 253 376.18 6.18%
EUR 651 660 HELLENIC REPUBLIC 24/2/2042 3 STEP CPN 495 556.27 473 463.57 1.30%
EUR 2 401 660 HELLENIC REPUBLIC 24/2/2036 3 STEP CPN 1 696 060.52 1 780 746.83 4.88%
EUR 2 631 660 HELLENIC REPUBLIC 24/2/2032 3 STEP CPN 1 737 455.74 2 067 103.14 5.67%
EUR 2 801 660 HELLENIC REPUBLIC 24/2/2028 3 STEP CPN 1 837 572.59 2 380 892.69 6.53%
EUR 2 292 650 HELLENIC REPUBLIC 24/2/2026 3 STEP CPN 1 567 759.40 2 054 695.86 5.63%
EUR 1 692 650 HELLENIC REPUBLIC 24/2/2025 3 STEP CPN 1 312 919.08 1 532 305.27 4.20%
EUR 801 660 HELLENIC REPUBLIC 24/2/2039 3 STEP CPN 590 674.79 584 498.32 1.60%
EUR 2 961 660 HELLENIC REPUBLIC 24/2/2037 3 STEP CPN 2 107 334.67 2 174 391.54 5.96%
EUR 1 651 660 HELLENIC REPUBLIC 24/2/2034 3 STEP CPN 1 112 550.11 1 259 588.95 3.45%
EUR 2 301 660 HELLENIC REPUBLIC 24/2/2033 3 STEP CPN 1 475 364.22 1 779 482.40 4.88%
EUR 3 051 660 HELLENIC REPUBLIC 24/2/2030 3 STEP CPN 2 024 572.89 2 470 349.29 6.77%
EUR 4 201 660 HELLENIC REPUBLIC 24/2/2029 3 STEP CPN 2 961 662.02 3 470 928.30 9.52%
EUR 2 292 650 HELLENIC REPUBLIC 24/2/2027 3 STEP CPN 1 520 924.36 2 024 387.02 5.55%
Total Investments in Bonds 29 368 787.66 34 384 084.31 94.27%
Other securities
EUR 398 381 WARRANT HELLENIC REPUBLIC 15/10/2042 0 VARIABLE 457 285.75 100 790.39 0.28%
Total Investments in Other securities 457 285.75 100 790.39 0.28%
Total Investments 29 826 073.41 34 484 874.70 94.55%
34 484 874.70
Portfolio breakdownas at June 30, 2017
By countries / by issuers
Greece 100.00%
Total 100.00%
By industry groups
Sovereign 100.00%
Total 100.00%
The accompanying notes form an integral part of these financial statements 40

(LF) Total Return Fund
Schedule of investmentsas at June 30, 2017
(All figures in EUR)
Shares / Cost Market % of Net
Currency Nominal Name Price Price Assets
Transferable securities admitted to an official exchange listing
Equities
EUR 255 ACCOR SA 10 086.68 10 466.48 0.46%
EUR 105 AIRBUS GROUP NV 6 268.16 7 560.00 0.33%
EUR 90 ARKEMA GROUP 8 738.66 8 408.70 0.37%
EUR 300 AXA S.A. 7 198.50 7 185.00 0.31%
EUR 210 BASF 15 324.26 17 028.90 0.75%
EUR 140 BAYER AG 12 660.08 15 848.00 0.69%
EUR 135 BEIERSDORF 11 487.64 12 425.40 0.54%
EUR 130 BNP PARIBAS 8 251.10 8 197.80 0.36%
EUR 250 BOUYGUES 7 683.82 9 230.00 0.40%
EUR 135 CAP GEMINI 8 045.40 12 214.80 0.53%
EUR 240 DANONE 15 106.84 15 794.40 0.69%
EUR 455 DEUTSCHE TELECOM AG 6 260.45 7 152.60 0.31%
EUR 8 100 EUROBANK ERGASIAS SA 7 976.70 7 938.00 0.35%
EUR 200 FRESENIUS AG 12 589.30 15 012.00 0.66%
EUR 180 GEMALTO 10 426.57 9 459.00 0.41%
EUR 140 HEINEKEN NV 11 222.37 11 918.20 0.52%
EUR 95 HENKEL KGaA VZ 8 508.38 11 447.50 0.50%
EUR 500 INFINEON TECHNOLOGIES 6 367.37 9 242.50 0.40%
EUR 120 INGENICO GROUP 10 419.50 9 538.80 0.42%
EUR 755 KON AHOLD 14 199.68 12 638.70 0.55%
EUR 295 KONINKLIJKE PHILIPS NV 6 694.89 9 173.03 0.40%
EUR 3 490 NOKIA OYJ 15 251.81 18 730.83 0.82%
EUR 35 000 PIRAEUS BANK S.A. 8 025.00 7 525.00 0.33%
EUR 385 PRYSMIAN SPA 7 248.11 9 913.75 0.43%
EUR 505 ROYAL DUTCH SHELL A' PLC (LUX) 11 164.60 11 733.68 0.51%
EUR 180 SANOFI 13 115.06 15 076.80 0.66%
EUR 165 SAP AG 10 097.96 15 089.25 0.66%
EUR 140 SCHNEIDER ELECTRIC 8 436.61 9 417.80 0.41%
EUR 225 SCOR SE 7 798.33 7 809.75 0.34%
EUR 170 SOCIETE GENERALE 8 121.75 8 008.70 0.35%
EUR 90 THALES 6 305.35 8 481.60 0.37%
EUR 420 THYSSEN KRUPP 7 967.44 10 447.50 0.46%
EUR 260 TOTAL 10 864.24 11 254.10 0.49%
EUR 240 UNILEVER NV CVA 9 630.47 11 596.80 0.51%
EUR 135 VINCI SA 8 013.92 10 088.55 0.44%
EUR 380 WORLDLINE SA 11 014.32 11 400.00 0.50%
348 571.32 394 453.92 17.27%
USD 190 NIKE CLASS B 8 839.65 9 822.99 0.43%
USD 140 COACH INC. 4 117.25 5 807.57 0.25%
USD 580 FORD MOTOR CO 5 854.65 5 687.17 0.25%
USD 80 JP MORGAN CHASE& CO 4 744.50 6 407.29 0.28%
USD 285 BANK OF AMERICA CORP 3 926.01 6 058.62 0.27%
USD 115 CITIGROUP INC 4 547.39 6 739.57 0.30%
USD 215 COCA COLA CO 8 452.56 8 449.66 0.37%
USD 325 UNDER ARMOUR INC 5 590.64 5 741.32 0.25%
USD 780 TWITTER INC 12 598.32 12 213.99 0.53%
USD 70 APPLE COMPUTER 7 191.44 8 834.03 0.39%
USD 95 PROCTER & GAMBLE CO. 7 023.95 7 254.86 0.32%
USD 130 AMERICAN EXPRESS CO 8 804.09 9 596.21 0.42%
USD 45 ELECTRONIC ARTS US 2855121099 3 726.51 4 168.77 0.18%
USD 105 VALERO ENERGY COPR 6 379.22 6 206.89 0.27%
USD 110 VISA INC-CLASS A SHARES 8 880.47 9 039.43 0.40%
USD 115 TYSON FOODS INC 3 386.86 6 311.30 0.28%
USD 210 BARRICK GOLD CORP 3 577.88 2 927.71 0.13%
USD 250 GOLDCORP INC 3 575.09 2 828.16 0.12%
USD 70 AGNICO EAGLE 2 847.06 2 767.61 0.12%
USD 55 AMGEN INC 7 702.89 8 300.60 0.36%
USD 335 TEVA PHARMACEUTICAL INDUSTRIES 10 970.99 9 751.75 0.43%
USD 104 ACTIVISION BLIZZARD INC 4 805.51 5 246.48 0.23%
USD 145 ALTABA INC. 6 378.98 6 922.19 0.30%
USD 115 AMERICAN INTL GROUP INC 5 656.27 6 300.21 0.28%
USD 10 ALPHABET INC 6 790.08 8 146.51 0.36%
USD 10 AMAZON COM Inc 6 215.89 8 482.30 0.37%
USD 975 CLIFFS NATURAL RESOURCES INC COM 5 914.29 5 912.20 0.26%
USD 300 UNITED STATES STEEL CORP 5 760.00 5 820.19 0.25%
USD 205 ALCOA INC 5 786.86 5 865.10 0.26%
USD 100 NEWMONT MNG CORP 3 116.26 2 838.24 0.12%
USD 280 GENERAL ELEC CO COM 7 620.86 6 627.06 0.29%
USD 90 PAYPAL HOLDINGS ING 3 121.22 4 232.65 0.19%
USD 140 HESS CORP 6 086.06 5 381.88 0.24%
USD 100 CHEVRON CORPORATION 9 064.12 9 142.13 0.40%
USD 245 DEVON ENERGY CORP. 8 733.20 6 863.52 0.30%
USD 125 EXXON MOBIL CORPORATION 9 465.64 8 842.67 0.39%
USD 205 HALLIBURTON CO 8 144.36 7 672.23 0.34%
USD 115 BAKER HUGHES INC 6 466.58 5 493.03 0.24%
USD 305 MYLAN INC 10 393.90 10 375.13 0.45%
USD 70 JOHNSON & JOHNSON 5 110.68 8 114.53 0.36%
USD 125 L BRANDS INC 6 915.80 5 902.78 0.26%
USD 65 MC DONALDS CORP 6 763.02 8 723.62 0.38%
USD 85 CVS CORP 6 465.87 5 992.90 0.26%
USD 180 FORTINET INC 6 293.10 5 905.36 0.26%
USD 100 MICROSOFT CORP. 3 723.12 6 040.13 0.26%
USD 430 FIREEYE INC 5 334.13 5 731.07 0.25%
292 863.22 311 489.61 13.63%
Total Investments in Equities 641 434.54 705 943.53 30.90%
The accompanying notes form an integral part of these financial statements 41

(LF) Total Return Fund (continued)
Schedule of investments (continued)as at June 30, 2017
(All figures in EUR)
Shares / Cost Market % of Net
Currency Nominal Name Price Price Assets
Transferable securities admitted to an official exchange listing
Bonds
EUR 960 HELLENIC REPUBLIC 24/2/2038 3 STEP CPN 960.00 700.18 0.03%
EUR 50 960 HELLENIC REPUBLIC 24/2/2028 3 STEP CPN 42 655.00 43 306.57 1.90%
EUR 960 HELLENIC REPUBLIC 24/2/2031 3 STEP CPN 960.00 764.11 0.03%
EUR 960 HELLENIC REPUBLIC 24/2/2030 3 STEP CPN 960.00 777.13 0.03%
EUR 960 HELLENIC REPUBLIC 24/2/2033 3 STEP CPN 960.00 742.20 0.03%
EUR 35 900 HELLENIC REPUBLIC 24/2/2026 3 STEP CPN 27 846.60 32 173.94 1.41%
EUR 960 HELLENIC REPUBLIC 24/2/2032 3 STEP CPN 214.42 754.06 0.03%
EUR 960 HELLENIC REPUBLIC 24/2/2040 3 STEP CPN 960.00 698.26 0.03%
EUR 960 HELLENIC REPUBLIC 24/2/2039 3 STEP CPN 960.00 699.95 0.03%
EUR 960 HELLENIC REPUBLIC 24/2/2034 3 STEP CPN 960.00 732.12 0.03%
EUR 960 HELLENIC REPUBLIC 24/2/2041 3 STEP CPN 960.00 698.10 0.03%
EUR 960 HELLENIC REPUBLIC 24/2/2037 3 STEP CPN 960.00 704.81 0.03%
EUR 960 HELLENIC REPUBLIC 24/2/2035 3 STEP CPN 960.00 720.68 0.03%
EUR 50 960 HELLENIC REPUBLIC 24/2/2029 3 STEP CPN 41 698.50 42 097.29 1.84%
EUR 960 HELLENIC REPUBLIC 24/2/2036 3 STEP CPN 960.00 711.81 0.03%
EUR 960 HELLENIC REPUBLIC 24/2/2042 3 STEP CPN 199.49 697.49 0.03%
EUR 40 900 HELLENIC REPUBLIC 24/2/2027 3 STEP CPN 22 456.49 36 114.29 1.58%
EUR 50 000 OBRIGACOES DO TESOURO 17/10/2022 2.2 FIXED 49 512.50 52 326.00 2.29%
EUR 50 000 OBRIGACOES DO TESOURO 14/4/2027 4.125 FIXED 49 807.00 54 647.25 2.39%
244 950.00 270 066.24 11.82%
USD 30 000 APPLE INC 6/5/2020 2 FIXED 28 275.08 26 415.35 1.16%
USD 30 000 BMW US CAPITAL LLC 11/4/2019 1.5 FIXED 27 981.96 26 205.57 1.15%
USD 35 000 BMW US CAPITAL LLC 11/4/2021 2 FIXED 31 869.46 30 436.69 1.33%
USD 30 000 CHEVRON CORP 2/3/2018 1.365 FIXED 28 201.80 26 285.09 1.15%
USD 30 000 EBAY INC 9/3/2018 2.5 FIXED 28 427.28 26 441.90 1.16%
USD 27 000 GENERAL MOTORS FINL CO 10/7/2019 3.5 FIXED 25 564.06 24 216.25 1.06%
USD 30 000 NESTLE HOLDINGS INC 30/9/2019 2 FIXED 28 291.71 26 432.44 1.16%
USD 50 000 US TREASURY N/B 28/2/2021 1.125 FIXED 43 772.95 42 926.99 1.88%
USD 50 000 US TREASURY N/B 30/11/2020 2 FIXED 46 259.05 44 329.54 1.94%
USD 50 000 US TREASURY N/B 30/9/2017 0.625 FIXED 44 362.55 43 767.32 1.92%
USD 50 000 US TREASURY N/B 31/1/2022 1.875 FIXED 46 960.26 43 870.01 1.92%
USD 50 000 US TREASURY N/B 31/5/2023 1.625 FIXED 45 541.68 42 839.71 1.88%
USD 35 000 VERIZON COMMUNICATIONS 1/11/2021 3 FIXED 33 049.38 31 127.06 1.36%
458 557.22 435 293.92 19.05%
Total Investments in Bonds 703 507.22 705 360.16 30.88%
Other securities
EUR 188 WARRANT HELLENIC REPUBLIC 15/10/2042 0 VARIABLE 0.00 47.56 0.00%
Total Investments in Other securities 0.00 47.56 0.00%
Funds
EUR 160.00 AMUNDI FLOT EUR CORP 16 250.40 16 262.40 0.71%
EUR 220.00 ISHARES EURO CORP BND IR-H 21 522.60 21 484.10 0.94%
EUR 240.00 ISHARES EURO INFL 49 210.40 48 820.80 2.14%
EUR 125.00 ISHARES JPM USD EM BND EUR - H 12 737.50 12 677.50 0.55%
EUR 160.00 LYX BRC FL EUR 16 092.59 16 120.00 0.71%
EUR 215.00 LYXOR BOFAML EUR HY EX FINANCIAL BOND 25 814.51 25 782.80 1.13%
141 628.00 141 147.60 6.18%
GBP 1 275.00 ISHARES GBP INDEX-LNK 26 240.86 25 686.18 1.12%
GBP 280.00 ISHARES CORE GBP CORP 47 407.84 46 413.52 2.03%
73 648.70 72 099.70 3.16%
USD 275.00 AMUNDI ETF FLOAT RATE USD 24 651.60 24 914.34 1.09%
USD 130.00 ISHARES JPM USD EM BND USD D 12 948.57 12 855.33 0.56%
USD 265.00 ISHARES USD CORP INTEREST 23 035.13 22 632.51 0.99%
USD 310.00 ISHARES USD SHORT DUR HY CORP 25 711.56 25 659.48 1.12%
USD 50.00 ISHARES USD TIPS ETF 8 880.44 8 820.10 0.39%
95 227.30 94 881.76 4.15%
Total Investments in Funds 310 504.00 308 129.06 13.49%
Total Investments 1 655 445.76 1 719 480.31 75.27%
1 719 480.31
The accompanying notes form an integral part of these financial statements 42

(LF) Total Return Fund (continued)
Portfolio breakdownas at June 30, 2017
By countries / by issuers
Canada 0.50%
Finland 1.09%
France 14.84%
Germany 6.61%
Greece 10.39%
Ireland 8.15%
Italy 0.58%
Netherlands 3.76%
Portugal 6.22%
United Kingdom 4.19%
United States 43.68%
Total 100.00%
By industry groups
Aerospace&Defence 0.44%
Apparel 0.91%
Automobiles&Parts 0.33%
Banks 2.96%
Beverages 1.18%
Bond Funds 1.50%
Chemicals 3.07%
Clothing&Footwear 0.33%
Communication Services 0.71%
Computer Hardware 1.06%
Computer Services 0.71%
Consumer Staples 0.72%
Cosmetics 0.42%
Debt Funds 7.24%
Diversified Financials 0.56%
Electric 0.24%
Electrical Equipment 1.10%
Electronicl Equipment 0.53%
Energy-Alternate Sources 0.36%
Engineering-Contractors 1.12%
Financials 0.53%
Fixed Income 9.18%
Food 2.70%
Gold Mining 0.50%
HealthCare 1.92%
Hotels 0.61%
Industrial components 1.07%
Information Technology 0.31%
Information Technology Hardware 0.40%
Insurance 1.24%
Internet 0.97%
Iron & Steel 1.29%
Materials 0.34%
Mining 0.17%
Miscellaneous Manufacturers 0.39%
Non-Cyclical Services 0.25%
Oil&Gas 2.41%
Oil&Gas-Services 0.77%
Oil-Integrated 0.68%
Other 12.65%
Pharmaceuticals 1.95%
Retail 1.20%
Semiconductors 0.54%
Software 2.24%
Sovereign 28.37%
Telecommunication Services 1.51%
Wireless Telecomunication 0.33%
Total 100.00%
The accompanying notes form an integral part of these financial statements 43

(LF) Money Market Fund - Reserve
Schedule of investmentsas at June 30, 2017
(All figures in EUR)
Shares / Cost Market % of Net
Currency Nominal Name Price Price Assets
Other transferable securities and money market instruments
Money Market Instruments
EUR 15 000 000 ECD CSLON 10/05/2018 15 024 997.84 15 024 997.84 2.04%
EUR 10 000 000 ECP AIR LIQUIDE 24/08/17 10 012 214.90 10 012 214.90 1.36%
EUR 10 000 000 ECP ALLIANZ 27/07/2017 10 031 443.00 10 031 443.00 1.36%
EUR 5 000 000 ECP AVIVA 29/08/2017 5 006 544.67 5 006 544.67 0.68%
EUR 15 000 000 ECP BFCM 11/09/2017 15 017 461.97 15 017 461.97 2.04%
EUR 15 000 000 ECP BFCM 11/12/2017 15 037 250.61 15 037 250.61 2.04%
EUR 10 000 000 ECP BNP PARIBAS 08/03/2018 10 024 833.74 10 024 833.74 1.36%
EUR 10 000 000 ECP BNP PARIBAS 09/02/2018 10 025 849.98 10 025 849.98 1.36%
EUR 10 000 000 ECP BNP PARIBAS 13/02/2018 10 025 849.98 10 025 849.98 1.36%
EUR 10 000 000 ECP CALYON 16/03/2018 10 026 940.44 10 026 940.44 1.36%
EUR 10 000 000 ECP CALYON 27/04/2018 10 026 430.79 10 026 430.79 1.36%
EUR 10 000 000 ECP CIC LONDON 29/09/2017 10 021 219.93 10 021 219.93 1.36%
EUR 15 000 000 ECP CSLON 07/09/2017 15 000 758.37 15 000 758.37 2.04%
EUR 5 000 000 ECP CSLON 24/08/2017 5 008 235.77 5 008 235.77 0.68%
EUR 6 000 000 ECP DZ BANK 20/10/2017 6 012 629.86 6 012 629.86 0.82%
EUR 15 000 000 ECP DZ LONDON 10/10/2017 15 034 202.81 15 034 202.81 2.04%
EUR 10 000 000 ECP ENGIES 04/09/2017 10 017 028.95 10 017 028.95 1.36%
EUR 10 000 000 ECP ENGIES 06/11/2017 10 016 213.75 10 016 213.75 1.36%
EUR 5 000 000 ECP ENGIES 09/10/2017 5 007 848.41 5 007 848.41 0.68%
EUR 5 000 000 ECP ENGIES 19/10/2017 5 008 019.09 5 008 019.09 0.68%
EUR 10 000 000 ECP HSBC FRANCE 15/02/2018 10 025 921.18 10 025 921.18 1.36%
EUR 10 000 000 ECP LA BANQUE POSTALE 04/08/2017 10 016 203.99 10 016 203.99 1.36%
EUR 20 000 000 ECP LA BANQUE POSTALE 18/7/17 20 041 146.98 20 041 146.98 2.72%
EUR 5 000 000 ECP L'OREAL 20/09/17 5 006 954.10 5 006 954.10 0.68%
EUR 5 000 000 ECP LVMH 17/08/2017 5 004 796.26 5 004 796.26 0.68%
EUR 10 000 000 ECP MISTUBISHI 10/08/2017 10 014 853.98 10 014 853.98 1.36%
EUR 10 000 000 ECP MISTUBISHI 14/08/2017 10 014 689.60 10 014 689.60 1.36%
EUR 10 000 000 ECP MIZUHO 01/03/2018 10 022 801.87 10 022 801.87 1.36%
EUR 10 000 000 ECP NATIXIS 03/11/2017 10 019 248.09 10 019 248.09 1.36%
EUR 10 000 000 ECP NATIXIS 07/12/2017 10 020 318.98 10 020 318.98 1.36%
EUR 10 000 000 ECP NATIXIS 13/02/2018 10 024 325.70 10 024 325.70 1.36%
EUR 10 000 000 ECP NATIXIS 15/02/2018 10 024 325.70 10 024 325.70 1.36%
EUR 10 000 000 ECP NATIXIS 28/07/2017 10 009 535.47 10 009 535.47 1.36%
EUR 10 000 000 ECP NORDEA 08/09/2017 10 019 460.02 10 019 460.02 1.36%
EUR 10 000 000 ECP NORDEA 11/09/17 10 019 248.09 10 019 248.09 1.36%
EUR 5 000 000 ECP ORANGE 29/09/2017 5 007 636.65 5 007 636.65 0.68%
EUR 5 000 000 ECP PG 20/09/2017 5 004 092.24 5 004 092.24 0.68%
EUR 2 000 000 ECP PG 02/08/2017 2 001 671.95 2 001 671.95 0.27%
EUR 3 000 000 ECP PG 10/07/2017 3 002 949.56 3 002 949.56 0.41%
EUR 5 000 000 ECP PG 24/08/2017 5 004 181.27 5 004 181.27 0.68%
EUR 10 000 000 ECP SOCGEN 15/03/2018 10 026 866.43 10 026 866.43 1.36%
EUR 10 000 000 ECP SOCGEN 16/02/2018 10 026 358.18 10 026 358.18 1.36%
EUR 15 000 000 ECP SOCGEN 26/03/2018 15 038 774.97 15 038 774.97 2.04%
EUR 15 000 000 ECP STAN 26/04/2018 15 047 927.65 15 047 927.65 2.04%
EUR 10 000 000 ECP SUMITOMO 14/08/2017 10 016 185.88 10 016 185.88 1.36%
EUR 10 000 000 ECP SUMITOMO 21/08/2017 10 016 627.60 10 016 627.60 1.36%
EUR 10 000 000 ECP SVENSKA HANDELSBANK 16/08/2017 10 018 288.94 10 018 288.94 1.36%
EUR 10 000 000 ECP SVENSKA HANDELSBANK 25/07/17 10 020 263.20 10 020 263.20 1.36%
EUR 3 500 000 ECP SVENSKA HANDELSBANK 29/08/2017 3 505 937.70 3 505 937.70 0.48%
EUR 15 000 000 ECP TORONTO DOMINION BANK 21/07/2017 15 042 587.24 15 042 587.24 2.04%
EUR 10 000 000 ECP UBS AG 02/02/2018 10 026 358.18 10 026 358.18 1.36%
EUR 15 000 000 ECP UBS AG 26/09/2017 15 030 583.06 15 030 583.06 2.04%
EUR 5 000 000 ECP VEOLIA ENVIRONMENT 01/12/2017 5 009 189.78 5 009 189.78 0.68%
EUR 5 000 000 ECP VEOLIA ENVIRONMENT 07/09/2017 5 005 825.53 5 005 825.53 0.68%
EUR 7 000 000 ECP VINCI 21/07/2017 7 006 819.00 7 006 819.00 0.95%
EUR 10 000 000 HSBC FRANCE 4/8/2017 10 015 189.70 10 015 189.70 1.36%
Total Investments in Money Market Instruments 532 544 119.58 532 544 119.58 72.31%
Total other transferable securities and money market instruments 532 544 119.58 532 544 119.58 72.31%
Total Investments 532 544 119.58 532 544 119.58 72.31%
532 544 119.58
The accompanying notes form an integral part of these financial statements 44

(LF) Money Market Fund - Reserve (continued)
Portfolio breakdownas at June 30, 2017
By countries / by issuers
Austria 0.00%
Canada 2.82%
France 55.88%
Germany 5.84%
Japan 3.76%
Netherlands 0.00%
Spain 0.00%
Sweden 3.76%
Switzerland 11.28%
United Kingdom 13.83%
United States 2.82%
Total 100.00%
By industry groups
Commercial Papers 100.00%
Total 100.00%
The accompanying notes form an integral part of these financial statements 45

(LF) Global Bond Fund
Schedule of investmentsas at June 30, 2017
(All figures in EUR)
Shares / Cost Market % of Net
Currency Nominal Name Price Price Assets
Transferable securities admitted to an official exchange listing
Bonds
EUR 100 000 AMERICAN INTL GROUP 8/6/2023 1.5 FIXED 99 356.00 101 790.50 0.96%
EUR 100 000 ANHEUSER-BUSCH INBEV SA/ 17/3/2020 0.421 FLOATING 100 000.00 101 672.00 0.96%
EUR 300 000 BONOS Y OBLIG DEL ESTADO 30/4/2022 0.4 FIXED 299 747.25 301 264.50 2.83%
EUR 200 000 BONOS Y OBLIG DEL ESTADO 31/10/2027 1.45 FIXED 198 498.00 196 852.00 1.85%
EUR 300 000 BUNDESOBLIGATION 8/10/2021 0 FIXED 306 313.33 303 943.50 2.86%
EUR 450 000 BUNDESOBLIGATION 8/4/2022 0 FIXED 458 580.30 454 853.25 4.28%
EUR 450 000 BUNDESSCHATZANWEISUNGEN 15/12/2017 0 FIXED 451 491.00 451 449.00 4.25%
EUR 300 000 BUNDESSCHATZANWEISUNGEN 15/9/2017 0 FIXED 300 453.00 300 420.00 2.83%
EUR 300 000 BUONI POLIENNALI DEL TES 1/11/2021 0.35 FIXED 295 354.75 296 202.00 2.79%
EUR 150 000 BUONI POLIENNALI DEL TES 1/12/2026 1.25 FIXED 142 708.50 140 168.25 1.32%
EUR 150 000 BUONI POLIENNALI DEL TES 1/6/2021 0.45 FIXED 149 166.00 149 788.50 1.41%
EUR 300 000 BUONI POLIENNALI DEL TES 15/5/2024 1.85 FIXED 305 167.50 305 794.50 2.88%
EUR 50 000 DEUTSCHE POST AG 1/4/2021 0.375 FIXED 49 677.50 50 343.50 0.47%
EUR 450 000 FRANCE (GOVT OF) 25/5/2022 0 FIXED 451 671.00 450 940.50 4.24%
EUR 150 000 FRANCE (GOVT OF) 25/5/2027 1 FIXED 154 731.00 152 662.50 1.44%
EUR 300 000 GOLDMAN SACHS GROUP INC 18/12/2017 0.371 FLOATING 300 000.00 300 873.00 2.83%
EUR 300 000 HELLENIC T-BILL 11/8/2017 0 ZERO COUPON 297 966.00 299 505.00 2.82%
EUR 450 000 HELLENIC T-BILL 3/11/2017 0 ZERO COUPON 443 344.50 447 522.75 4.21%
EUR 400 000 HELLENIC T-BILL 7/7/2017 0 ZERO COUPON 394 180.00 399 940.00 3.76%
EUR 100 000 KLEPIERRE 17/4/2023 1 FIXED 99 352.00 101 599.50 0.96%
EUR 150 000 OBRIGACOES DO TESOURO 14/4/2027 4.125 FIXED 165 883.50 163 941.75 1.54%
EUR 150 000 OBRIGACOES DO TESOURO 17/10/2022 2.2 FIXED 146 417.25 156 978.00 1.48%
EUR 100 000 PETROLEOS MEXICANOS 21/8/2021 2.5 FIXED 99 957.00 102 145.00 0.96%
EUR 100 000 RCI BANQUE SA 16/7/2018 0.248 FLOATING 100 000.00 100 389.50 0.94%
EUR 100 000 REPUBLIC OF CYPRUS 27/6/2024 2.75 FIXED 99 686.00 102 562.50 0.96%
EUR 100 000 SCHNEIDER ELECTRIC SE 6/9/2021 2.5 FIXED 110 300.00 109 114.50 1.03%
6 020 001.38 6 042 716.00 56.83%
USD 200 000 ABN AMRO BANK NV 18/1/2019 1.79844 FLOATING 190 421.78 176 034.00 1.66%
USD 50 000 ANZ NEW ZEALAND INTL/LDN 25/1/2022 2.1665 FLOATING 46 886.72 44 260.65 0.42%
USD 200 000 BANCO SANTANDER SA 11/4/2022 2.71761 FLOATING 187 775.80 180 675.60 1.70%
USD 200 000 BAT INTL FINANCE PLC 9/9/2019 1.625 FIXED 178 809.93 173 058.18 1.63%
USD 30 000 CISCO SYSTEMS INC 21/2/2018 1.77172 FLOATING 27 208.42 26 393.27 0.25%
USD 50 000 CITIGROUP INC 25/4/2022 2.11622 FLOATING 46 807.71 44 074.22 0.41%
USD 100 000 COMMONWEALTH BANK AUST 7/11/2019 1.81928 FLOATING 91 979.40 88 193.57 0.83%
USD 63 000 EXXON MOBIL CORPORATION 28/2/2018 1.80039 FLOATING 57 861.87 55 423.38 0.52%
USD 200 000 FORD MOTOR CREDIT CO LLC 28/3/2022 2.56483 FLOATING 184 179.02 176 401.16 1.66%
USD 50 000 GENERAL MOTORS FINL CO 13/4/2020 2.08511 FLOATING 47 267.91 44 061.95 0.41%
USD 50 000 GENERAL MOTORS FINL CO 14/1/2022 2.70844 FLOATING 47 605.45 44 705.35 0.42%
USD 100 000 IBM CORP 12/2/2019 1.55094 FLOATING 74 101.52 88 100.25 0.83%
USD 200 000 MITSUBISHI UFJ FIN GRP 13/9/2021 2.29644 FLOATING 179 227.53 177 566.60 1.67%
USD 50 000 NISSAN MOTOR ACCEPTANCE 13/1/2020 1.73511 FLOATING 47 317.12 43 954.39 0.41%
USD 50 000 PEPSICO INC 22/2/2019 1.76172 FLOATING 45 061.28 44 137.53 0.42%
USD 200 000 ROCHE HOLDINGS INC 13/3/2020 2 FIXED 179 057.89 175 960.39 1.65%
USD 200 000 SKANDINAVISKA ENSKILDA 13/9/2019 1.80644 FLOATING 177 677.14 176 036.63 1.66%
USD 200 000 UNICREDIT SPA 12/4/2022 3.75 FIXED 186 388.84 179 636.35 1.69%
USD 250 000 US TREASURY N/B 28/2/2022 1.875 FIXED 235 044.42 219 341.48 2.06%
USD 300 000 US TREASURY N/B 30/11/2021 1.75 FIXED 271 893.40 262 208.57 2.47%
USD 300 000 US TREASURY N/B 31/1/2022 1.875 FIXED 280 231.43 263 220.05 2.48%
USD 250 000 US TREASURY N/B 31/10/2021 1.25 FIXED 225 854.00 213 976.04 2.01%
USD 280 000 US TREASURY N/B 31/8/2021 1.125 FIXED 249 621.77 238 924.76 2.25%
USD 100 000 WESTPAC BANKING CORP 19/8/2021 2.02839 FLOATING 89 661.97 88 447.69 0.83%
3 347 942.32 3 224 792.06 30.33%
Total Investments in Bonds 9 367 943.70 9 267 508.06 87.16%
Equities
EUR 8 500 SPDR EM LOCAL GOV BND 571 725.00 560 405.00 5.27%
Total Investments in Equities 571 725.00 560 405.00 5.27%
Funds
EUR 3 000 ISHARES MARKIT IBOXX EU CBND 388 871.86 403 687.50 3.80%
Total Investments in Funds 388 871.86 403 687.50 3.80%
Total Investments 10 328 540.56 10 231 600.56 96.23%
10 231 600.56
The accompanying notes form an integral part of these financial statements 46

(LF) Global Bond Fund (continued)
Portfolio breakdownas at June 30, 2017
By countries / by issuers
Australia 1.73%
Belgium 0.99%
Cyprus 1.00%
France 8.94%
Germany 15.26%
Greece 11.21%
Ireland 9.42%
Italy 10.47%
Mexico 1.00%
Netherlands 1.72%
New Zealand 0.43%
Portugal 3.14%
Spain 6.63%
Sweden 1.72%
United Kingdom 1.69%
United States 24.64%
Total 100.00%
By industry groups
Banks 14.23%
Computer Hardware 0.86%
Debt Funds 3.95%
Electrical Equipment 1.07%
Insurance 0.99%
Investments Companies 5.48%
Other 12.12%
Sovereign 61.30%
Total 100.00%
The accompanying notes form an integral part of these financial statements 47

(LF) Equity - Middle East - North Africa Fund
Schedule of investmentsas at June 30, 2017
(All figures in EUR)
Shares / Cost Market % of Net
Currency Nominal Name Price Price Assets
Transferable securities admitted to an official exchange listing
Equities
EGP 6 250 COMMERCIAL INTERNATIONAL BANK 18 124.75 24 815.48 2.69%
EGP 20 000 ORIENTAL WEAVERS 16 375.45 17 796.16 1.93%
EGP 11 906 SIX OF OCTOBER DEVELOPMENT 19 668.59 8 479.89 0.92%
EGP 33 000 T M G HOLDING 29 561.76 12 717.82 1.38%
83 730.55 63 809.35 6.92%
EUR 1 000 MAROC TELECOM (FRANCE) 11 037.31 12 780.00 1.39%
KWD 4 000 AGILITY 7 314.61 9 497.40 1.03%
KWD 30 800 KUWAIT FINANCE HOUSE 46 409.06 42 970.54 4.66%
KWD 6 000 KUWAIT PROJECTS CO HOLDINGS 9 935.84 5 823.22 0.63%
KWD 16 000 MOBILE TELECOMMUNICATIONS CO 28 461.99 19 087.23 2.07%
KWD 29 400 NATIONAL BANK OF KUWAIT 62 310.74 58 596.19 6.35%
154 432.24 135 974.58 14.74%
MAD 650 ATTIJARIWAFA BANK 21 167.81 25 956.23 2.81%
OMR 24 523 BANKMUSCAT SAOG 27 709.98 20 737.79 2.25%
OMR 19 057 NATIONAL BANK OF OMAN SAOG 8 108.34 9 097.45 0.99%
OMR 3 008 OMAN CEMENT CO 4 751.07 3 049.71 0.33%
OMR 4 000 OMAN TELECOMMUNICATIONS CO 13 860.99 10 320.53 1.12%
54 430.38 43 205.48 4.68%
QAR 1 250 BARWA REAL ESTATE CO 13 467.77 9 387.49 1.02%
QAR 1 312 COMMERCIAL BANK OF QATAR 15 009.56 8 999.69 0.98%
QAR 1 600 INDUSTRIES QATAR 58 421.58 35 537.05 3.85%
QAR 2 200 MASRAF AL RAYAN 22 360.46 20 086.57 2.18%
QAR 900 OOREDOO 24 868.02 19 010.34 2.06%
QAR 400 QATAR ELECTRICITY & WATER CO 17 478.95 17 787.45 1.93%
QAR 1 610 QATAR INSURANCE CO 29 633.65 25 400.81 2.75%
QAR 700 QATAR ISLAMIC BANK 19 436.80 14 421.55 1.56%
QAR 1 800 QATAR NATIONAL BANK 57 764.46 53 433.31 5.79%
QAR 5 050 VODAFONE QATAR 12 428.53 9 675.47 1.05%
270 869.78 213 739.73 23.17%
AED 17 000 ABU DHABI COMMERCIAL BANK 24 009.96 28 933.05 3.14%
AED 10 000 AGTHIA GROUP PJSC 9 740.87 13 184.07 1.43%
AED 33 000 ALDAR PROPERTIES 24 788.42 18 194.02 1.97%
AED 35 000 DUBAI FINANCIAL MARKET 19 672.58 9 312.75 1.01%
AED 12 500 DUBAI ISLAMIC BANK 19 156.95 16 869.62 1.83%
AED 12 000 EMIRATES TELECOM GROUP 48 224.57 50 051.54 5.43%
AED 32 000 EMMAR PROPERTIES PJSC 64 661.79 59 448.19 6.45%
AED 22 548 NATIONAL BANK OF ABU DHABI 51 737.71 56 752.40 6.15%
261 992.85 252 745.64 27.40%
USD 1 500 BANQUE AUDI SAL-REG S GDR 7 289.97 7 899.58 0.86%
USD 1 500 BLOM BANK SAL -REG S GDR 9 906.36 15 904.31 1.72%
USD 6 000 COMMERCIAL INTL BANK-GDR 24 749.50 23 659.31 2.57%
USD 65 000 DEPA LTD 28 921.89 20 390.82 2.21%
USD 2 150 DP WORLD LTD 32 987.86 40 505.61 4.39%
103 855.58 108 359.63 11.75%
Total Investments in Equities 961 516.50 856 570.64 92.87%
Total Investments 961 516.50 856 570.64 92.87%
856 570.64
The accompanying notes form an integral part of these financial statements 48

(LF) Equity - Middle East - North Africa Fund (continued)
Portfolio breakdownas at June 30, 2017
By countries / by issuers
Egypt 10.21%
Kuwait 15.87%
Lebanon 2.78%
Morocco 4.52%
Oman 5.04%
Qatar 24.95%
United Arab Emirates 36.62%
Total 100.00%
By industry groups
Banks 50.10%
Building&Construction Materials 0.36%
Chemicals 4.15%
Commercial Services 7.11%
Communication Services 8.06%
Constructions 0.00%
Financials 10.64%
Food 1.54%
Food Processors 0.00%
Holding Companies 0.68%
Household Goods&Textiles 2.08%
Insurance 2.97%
Real Estate 4.21%
Storage/Warehousing 1.11%
Telecommunication Services 4.93%
Utilities-Other 2.08%
Total 100.00%
The accompanying notes form an integral part of these financial statements 49

(LF) Special Purpose Best Performers Fund
Schedule of investmentsas at June 30, 2017
(All figures in EUR)
Shares / Cost Market % of Net
Currency Nominal Name Price Price Assets
Transferable securities admitted to an official exchange listing
Bonds
EUR 500 000 BANQUE FED CRED MUTUEL 19/1/2018 0 FLOATING 500 035.50 500 885.00 3.81%
EUR 400 000 BPCE SA 5/2/2018 0 FLOATING 399 920.00 400 754.00 3.05%
EUR 300 000 CCTS EU 15/12/2020 0.53 FLOATING 305 049.00 305 052.00 2.32%
EUR 700 000 CCTS EU 15/12/2022 0.43 FLOATING 691 759.00 703 990.00 5.35%
EUR 145 000 ERB HELLAS PLC 26/6/2018 4.25 FIXED 131 710.75 143 035.98 1.09%
EUR 300 000 GOLDMAN SACHS GROUP INC 18/12/2017 0.371 FLOATING 300 000.00 300 873.00 2.29%
EUR 450 000 GOLDMAN SACHS GROUP INC 29/4/2019 0.371 FLOATING 450 000.00 453 854.25 3.45%
EUR 650 000 HELLENIC PETROLEUM FINAN 14/10/2021 4.875 FIXED 646 444.50 686 309.00 5.22%
EUR 2 350 000 HELLENIC REPUBLIC 24/2/2023 3 STEP CPN 1 777 016.31 2 196 603.75 16.70%
EUR 1 890 000 HELLENIC REPUBLIC 24/2/2024 3 STEP CPN 1 390 400.82 1 739 924.55 13.23%
EUR 300 000 HELLENIC REPUBLIC 24/2/2025 3 STEP CPN 224 250.00 271 581.00 2.07%
EUR 300 000 HELLENIC REPUBLIC 24/2/2026 3 STEP CPN 217 800.00 268 863.00 2.04%
EUR 150 000 MOTOR OIL FINANCE PLC 1/4/2022 3.25 FIXED 149 149.50 153 443.25 1.17%
EUR 500 000 NATIONAL BANK OF CANADA 11/9/2017 0 FLOATING 500 000.00 500 350.00 3.80%
EUR 150 000 OTE PLC 7/2/2018 7.875 FIXED 160 875.00 156 027.75 1.19%
EUR 210 000 PUBLIC POWER CORP FIN 1/5/2019 5.5 FIXED 191 514.08 184 557.45 1.40%
EUR 1 300 000 SPAIN LETRAS DEL TESORO 17/11/2017 0 ZERO COUPON 1 303 100.51 1 301 950.00 9.90%
EUR 950 000 TREASURY CERTIFICATES 9/11/2017 0 ZERO COUPON 954 377.68 952 218.25 7.24%
Total Investments in Bonds 10 293 402.65 11 220 272.23 85.32%
Total transferable securities admitted to an official exchange listing 10 293 402.65 11 220 272.23 85.32%
Total Investments 10 293 402.65 11 220 272.23 85.32%
11 220 272.23
Portfolio breakdownas at June 30, 2017
By countries / by issuers
Belgium 8.49%
Canada 4.46%
France 8.04%
Greece 39.90%
Italy 8.99%
Spain 11.60%
United Kingdom 11.79%
United States 6.73%
Total 100.00%
By industry groups
Banks 20.50%
Electricity 1.64%
Finance & Credit institutions 0.00%
Other 8.87%
Sovereign 68.98%
Total 100.00%
The accompanying notes form an integral part of these financial statements 50

(LF) Greek Corporate Bond Fund
Schedule of investmentsas at June 30, 2017
(All figures in EUR)
Shares / Cost Market % of Net
Currency Nominal Name Price Price Assets
Transferable securities admitted to an official exchange listing
Bonds
EUR 1 050 000 COCA-COLA HBC FINANCE BV 11/11/2024 1.875 FIXED 1 123 917.53 1 112 616.75 4.44%
EUR 1 037 000 ERB HELLAS PLC 26/6/2018 4.25 FIXED 991 126.35 1 022 953.84 4.08%
EUR 400 000 FF GROUP FINANCE LX 3/7/2019 1.75 FIXED 397 000.00 391 636.00 1.56%
EUR 1 139 000 HELLENIC PETROLEUM FINAN 14/10/2021 4.875 FIXED 1 143 863.67 1 202 624.54 4.80%
EUR 700 000 HELLENIC PETROLEUM FINAN 4/7/2019 5.25 FIXED 669 814.65 729 491.00 2.91%
EUR 350 000 HELLENIC REPUBLIC 17/4/2019 4.75 FIXED 324 706.67 356 420.75 1.42%
EUR 340 000 HELLENIC REPUBLIC 24/2/2023 3 STEP CPN 200 895.47 317 806.50 1.27%
EUR 340 000 HELLENIC REPUBLIC 24/2/2024 3 STEP CPN 200 895.47 313 002.30 1.25%
EUR 340 000 HELLENIC REPUBLIC 24/2/2025 3 STEP CPN 200 895.47 307 791.80 1.23%
EUR 340 000 HELLENIC REPUBLIC 24/2/2026 3 STEP CPN 212 418.35 304 711.40 1.22%
EUR 340 000 HELLENIC REPUBLIC 24/2/2027 3 STEP CPN 200 895.47 300 216.60 1.20%
EUR 340 000 HELLENIC REPUBLIC 24/2/2028 3 STEP CPN 200 895.47 288 937.10 1.15%
EUR 340 000 HELLENIC REPUBLIC 24/2/2029 3 STEP CPN 200 895.47 280 868.90 1.12%
EUR 340 000 HELLENIC REPUBLIC 24/2/2030 3 STEP CPN 200 895.47 275 233.40 1.10%
EUR 340 000 HELLENIC REPUBLIC 24/2/2031 3 STEP CPN 200 895.47 270 623.00 1.08%
EUR 340 000 HELLENIC REPUBLIC 24/2/2032 3 STEP CPN 200 895.47 267 061.50 1.06%
EUR 340 000 HELLENIC REPUBLIC 24/2/2033 3 STEP CPN 200 895.47 262 864.20 1.05%
EUR 340 000 HELLENIC REPUBLIC 24/2/2034 3 STEP CPN 200 895.47 259 290.80 1.03%
EUR 340 000 HELLENIC REPUBLIC 24/2/2035 3 STEP CPN 200 895.47 255 241.40 1.02%
EUR 340 000 HELLENIC REPUBLIC 24/2/2036 3 STEP CPN 200 895.47 252 098.10 1.01%
EUR 340 000 HELLENIC REPUBLIC 24/2/2037 3 STEP CPN 200 895.47 249 621.20 1.00%
EUR 340 000 HELLENIC REPUBLIC 24/2/2038 3 STEP CPN 200 895.47 247 980.70 0.99%
EUR 340 000 HELLENIC REPUBLIC 24/2/2039 3 STEP CPN 200 895.47 247 897.40 0.99%
EUR 340 000 HELLENIC REPUBLIC 24/2/2040 3 STEP CPN 200 895.47 247 299.00 0.99%
EUR 340 000 HELLENIC REPUBLIC 24/2/2041 3 STEP CPN 200 895.47 247 244.60 0.99%
EUR 340 000 HELLENIC REPUBLIC 24/2/2042 3 STEP CPN 200 895.47 247 027.00 0.99%
EUR 1 500 000 HELLENIC T-BILL 14/7/2017 0 ZERO COUPON 1 490 280.00 1 499 400.00 5.98%
EUR 300 000 HELLENIC T-BILL 3/11/2017 0 ZERO COUPON 295 563.00 298 348.50 1.19%
EUR 500 000 HELLENIC T-BILL 6/10/2017 0 ZERO COUPON 492 605.00 497 870.00 1.99%
EUR 500 000 HELLENIC T-BILL 8/9/2017 0 ZERO COUPON 496 610.00 498 420.00 1.99%
EUR 9 728 HOUSEMARKET SA 4/10/2021 5 FIXED 9 883.65 9 912.83 0.04%
EUR 350 000 INTRALOT CAPITAL LUX 15/5/2021 6 FIXED 360 250.00 360 263.75 1.44%
EUR 800 000 INTRALOT CAPITAL LUX 15/9/2021 6.75 FIXED 806 550.00 850 444.00 3.39%
EUR 650 000 MOTOR OIL FINANCE PLC 1/4/2022 3.25 FIXED 648 448.50 664 920.75 2.65%
EUR 753 000 MYTILINEOS HOLDINGS S.A. 27/6/2022 3.1 FIXED 753 000.00 756 984.12 3.02%
EUR 1 210 000 OPAP SA 21/3/2022 3.5 FIXED 1 215 271.41 1 230 237.25 4.91%
EUR 400 000 OTE PLC 2/12/2019 4.375 FIXED 396 424.00 423 922.00 1.69%
EUR 850 000 OTE PLC 7/2/2018 7.875 FIXED 913 585.00 884 157.25 3.53%
EUR 800 000 OTE PLC 9/7/2020 3.5 FIXED 815 400.00 832 764.00 3.32%
EUR 1 300 000 PUBLIC POWER CORP FIN 1/5/2019 5.5 FIXED 1 241 212.06 1 142 498.50 4.56%
EUR 1 150 000 TITAN GLOBAL FINANCE PLC 10/7/2019 4.25 FIXED 1 207 310.00 1 218 919.50 4.86%
EUR 795 000 TITAN GLOBAL FINANCE PLC 17/6/2021 3.5 FIXED 795 000.00 845 744.85 3.37%
20 617 253.77 22 273 367.08 88.82%
USD 500 000 FAGE INTL / FAGE USA 15/8/2026 5.625 FIXED 457 992.06 452 179.72 1.80%
Total Investments in Bonds 21 075 245.83 22 725 546.80 90.62%
Other securities
EUR 700 000 WARRANT HELLENIC REPUBLIC 15/10/2042 0 VARIABLE 858 200.00 177 100.00 0.71%
Total Investments in Other securities 858 200.00 177 100.00 0.71%
Total Investments 21 933 445.83 22 902 646.80 91.33%
22 902 646.80
The accompanying notes form an integral part of these financial statements 51

(LF) Greek Corporate Bond Fund (continued)
Portfolio breakdownas at June 30, 2017
By countries / by issuers
Greece 48.72%
Luxembourg 7.26%
Netherlands 4.86%
United Kingdom 39.15%
Total 100.00%
By industry groups
Banks 4.47%
Electricity 4.99%
Finance & Credit institutions 1.71%
Other 50.54%
Sovereign 37.52%
Warrants On Bonds 0.77%
Total 100.00%
The accompanying notes form an integral part of these financial statements 52

(LF) Special Purpose Best Performers II Fund
Schedule of investmentsas at June 30, 2017
(All figures in EUR)
Shares / Cost Market % of Net
Currency Nominal Name Price Price Assets
Transferable securities admitted to an official exchange listing
Bonds
EUR 600 000 BANQUE FED CRED MUTUEL 19/1/2018 0 FLOATING 600 042.60 601 062.00 2.50%
EUR 700 000 BPCE SA 5/2/2018 0 FLOATING 699 860.00 701 319.50 2.92%
EUR 500 000 CCTS EU 15/12/2020 0.53 FLOATING 508 415.00 508 420.00 2.12%
EUR 1 000 000 CCTS EU 15/2/2024 0.51 FLOATING 970 830.00 992 660.00 4.13%
EUR 500 000 DEUTSCHE BANK AG 15/4/2019 0.218 FLOATING 498 760.00 501 537.50 2.09%
EUR 200 000 ERB HELLAS PLC 26/6/2018 4.25 FIXED 181 670.00 197 291.00 0.82%
EUR 300 000 GOLDMAN SACHS GROUP INC 18/12/2017 0.371 FLOATING 300 000.00 300 873.00 1.25%
EUR 675 000 GOLDMAN SACHS GROUP INC 29/4/2019 0.371 FLOATING 675 000.00 680 781.38 2.84%
EUR 1 100 000 HELLENIC PETROLEUM FINAN 14/10/2021 4.875 FIXED 1 093 983.00 1 161 446.00 4.84%
EUR 5 020 000 HELLENIC REPUBLIC 24/2/2023 3 STEP CPN 3 801 273.64 4 692 319.50 19.55%
EUR 2 280 000 HELLENIC REPUBLIC 24/2/2024 3 STEP CPN 1 660 646.00 2 098 956.60 8.74%
EUR 430 000 HELLENIC REPUBLIC 24/2/2025 3 STEP CPN 321 425.00 389 266.10 1.62%
EUR 430 000 HELLENIC REPUBLIC 24/2/2026 3 STEP CPN 312 180.00 385 370.30 1.61%
EUR 150 000 MOTOR OIL FINANCE PLC 1/4/2022 3.25 FIXED 149 149.50 153 443.25 0.64%
EUR 500 000 NATIONAL BANK OF CANADA 11/9/2017 0 FLOATING 500 000.00 500 350.00 2.08%
EUR 220 000 OTE PLC 7/2/2018 7.875 FIXED 235 950.00 228 840.70 0.95%
EUR 110 000 OTE PLC 9/7/2020 3.5 FIXED 103 079.17 114 505.05 0.48%
EUR 200 000 PUBLIC POWER CORP FIN 1/5/2019 5.5 FIXED 176 900.00 175 769.00 0.73%
EUR 5 000 000 SPAIN LETRAS DEL TESORO 17/11/2017 0 ZERO COUPON 5 011 925.04 5 007 500.00 20.86%
EUR 2 000 000 TREASURY CERTIFICATES 9/11/2017 0 ZERO COUPON 2 009 216.16 2 004 670.00 8.35%
Total Investments in Bonds 19 810 305.11 21 396 380.88 89.13%
Total transferable securities admitted to an official exchange listing 19 810 305.11 21 396 380.88 89.13%
Total Investments 19 810 305.11 21 396 380.88 89.13%
21 396 380.88
Portfolio breakdownas at June 30, 2017
By countries / by issuers
Belgium 9.37%
Canada 2.34%
France 6.09%
Germany 2.34%
Greece 35.36%
Italy 7.02%
Spain 23.40%
United Kingdom 9.49%
United States 4.59%
Total 100.00%
By industry groups
Banks 16.28%
Electricity 0.82%
Other 7.75%
Sovereign 75.15%
Total 100.00%
The accompanying notes form an integral part of these financial statements 53

(LF) Special Purpose Best Performers III Fund
Schedule of investmentsas at June 30, 2017
(All figures in EUR)
Shares / Cost Market % of Net
Currency Nominal Name Price Price Assets
Transferable securities admitted to an official exchange listing
Bonds
EUR 400 000 BANQUE FED CRED MUTUEL 19/1/2018 0 FLOATING 400 028.40 400 708.00 2.72%
EUR 400 000 BPCE SA 5/2/2018 0 FLOATING 399 920.00 400 754.00 2.72%
EUR 145 000 ERB HELLAS PLC 26/6/2018 4.25 FIXED 131 710.75 143 035.98 0.97%
EUR 375 000 GOLDMAN SACHS GROUP INC 29/4/2019 0.371 FLOATING 375 000.00 378 211.88 2.57%
EUR 250 000 GOLDMAN SACHS GROUP INC 18/12/2017 0.371 FLOATING 250 000.00 250 727.50 1.70%
EUR 130 000 OTE PLC 7/2/2018 7.875 FIXED 139 425.00 135 224.05 0.92%
EUR 390 000 OTE PLC 9/7/2020 3.5 FIXED 365 462.50 405 972.45 2.76%
EUR 300 000 MOTOR OIL FINANCE PLC 1/4/2022 3.25 FIXED 298 299.00 306 886.50 2.09%
EUR 260 000 HELLENIC REPUBLIC 24/2/2025 3 STEP CPN 194 350.00 235 370.20 1.60%
EUR 2 570 000 HELLENIC REPUBLIC 24/2/2023 3 STEP CPN 1 939 808.60 2 402 243.25 16.33%
EUR 260 000 HELLENIC REPUBLIC 24/2/2026 3 STEP CPN 188 760.00 233 014.60 1.58%
EUR 1 750 000 HELLENIC REPUBLIC 24/2/2024 3 STEP CPN 1 285 029.00 1 611 041.25 10.95%
EUR 600 000 CCTS EU 15/2/2024 0.51 FLOATING 582 498.00 595 596.00 4.05%
EUR 300 000 CCTS EU 15/12/2020 0.53 FLOATING 305 049.00 305 052.00 2.07%
EUR 2 000 000 SPAIN LETRAS DEL TESORO 17/11/2017 0 ZERO COUPON 2 004 770.02 2 003 000.00 13.62%
EUR 700 000 HELLENIC PETROLEUM FINAN 14/10/2021 4.875 FIXED 696 171.00 739 102.00 5.02%
EUR 1 500 000 TREASURY CERTIFICATES 9/11/2017 0 ZERO COUPON 1 506 912.12 1 503 502.50 10.22%
Total Investments in Bonds 11 063 193.39 12 049 442.16 81.92%
Total transferable securities admitted to an official exchange listing 11 063 193.39 12 049 442.16 81.92%
Total Investments 11 063 193.39 12 049 442.16 81.92%
12 049 442.16
Portfolio breakdownas at June 30, 2017
By countries / by issuers
Belgium 12.48%
France 6.65%
Greece 37.19%
Italy 7.47%
Spain 16.62%
United Kingdom 14.36%
United States 5.22%
Total 100.00%
By industry groups
Banks 13.06%
Other 13.17%
Sovereign 73.77%
Total 100.00%
The accompanying notes form an integral part of these financial statements 54

(LF) Special Purpose Best Performers IV Fund
Schedule of investmentsas at June 30, 2017
(All figures in EUR)
Shares / Cost Market % of Net
Currency Nominal Name Price Price Assets
Transferable securities admitted to an official exchange listing
Bonds
EUR 300 000 BANQUE FED CRED MUTUEL 19/1/2018 0 FLOATING 300 021.30 300 531.00 2.54%
EUR 300 000 BPCE SA 5/2/2018 0 FLOATING 299 940.00 300 565.50 2.54%
EUR 300 000 CCTS EU 15/12/2020 0.53 FLOATING 305 049.00 305 052.00 2.57%
EUR 600 000 CCTS EU 15/2/2024 0.51 FLOATING 582 498.00 595 596.00 5.03%
EUR 100 000 ERB HELLAS PLC 26/6/2018 4.25 FIXED 90 835.00 98 645.50 0.83%
EUR 150 000 GOLDMAN SACHS GROUP INC 18/12/2017 0.371 FLOATING 150 000.00 150 436.50 1.27%
EUR 300 000 GOLDMAN SACHS GROUP INC 29/4/2019 0.371 FLOATING 300 000.00 302 569.50 2.55%
EUR 600 000 HELLENIC PETROLEUM FINAN 14/10/2021 4.875 FIXED 596 718.00 633 516.00 5.35%
EUR 1 940 000 HELLENIC REPUBLIC 24/2/2023 3 STEP CPN 1 463 720.60 1 813 366.50 15.30%
EUR 1 340 000 HELLENIC REPUBLIC 24/2/2024 3 STEP CPN 983 850.00 1 233 597.30 10.41%
EUR 200 000 HELLENIC REPUBLIC 24/2/2025 3 STEP CPN 149 500.00 181 054.00 1.53%
EUR 200 000 HELLENIC REPUBLIC 24/2/2026 3 STEP CPN 145 200.00 179 242.00 1.51%
EUR 250 000 MOTOR OIL FINANCE PLC 1/4/2022 3.25 FIXED 248 582.50 255 738.75 2.16%
EUR 100 000 OTE PLC 7/2/2018 7.875 FIXED 107 250.00 104 018.50 0.88%
EUR 300 000 OTE PLC 9/7/2020 3.5 FIXED 281 125.00 312 286.50 2.63%
EUR 400 000 SPAIN LETRAS DEL TESORO 17/11/2017 0 ZERO COUPON 400 954.00 400 600.00 3.38%
EUR 2 000 000 TREASURY CERTIFICATES 9/11/2017 0 ZERO COUPON 2 009 216.16 2 004 670.00 16.91%
Total Investments in Bonds 8 414 459.56 9 171 485.55 77.39%
Total Investments 8 414 459.56 9 171 485.55 77.39%
9 171 485.55
Portfolio breakdownas at June 30, 2017
By countries / by issuers
Belgium 21.86%
France 6.55%
Greece 37.15%
Italy 9.82%
Spain 4.37%
United Kingdom 15.31%
United States 4.94%
Total 100.00%
By industry groups
Banks 12.57%
Other 14.23%
Sovereign 73.20%
Total 100.00%
The accompanying notes form an integral part of these financial statements 55

(LF) Special Purpose Best Performers V Fund
Schedule of investmentsas at June 30, 2017
(All figures in EUR)
Shares / Cost Market % of Net
Currency Nominal Name Price Price Assets
Transferable securities admitted to an official exchange listing
Bonds
EUR 700 000 BANQUE FED CRED MUTUEL 19/1/2018 0 FLOATING 700 049.70 701 239.00 2.91%
EUR 700 000 BPCE SA 5/2/2018 0 FLOATING 699 860.00 701 319.50 2.91%
EUR 500 000 CCTS EU 15/12/2020 0.53 FLOATING 508 415.00 508 420.00 2.11%
EUR 1 000 000 CCTS EU 15/2/2024 0.51 FLOATING 970 830.00 992 660.00 4.12%
EUR 300 000 ERB HELLAS PLC 26/6/2018 4.25 FIXED 272 505.00 295 936.50 1.23%
EUR 300 000 GOLDMAN SACHS GROUP INC 18/12/2017 0.371 FLOATING 300 000.00 300 873.00 1.25%
EUR 675 000 GOLDMAN SACHS GROUP INC 29/4/2019 0.371 FLOATING 675 000.00 680 781.38 2.82%
EUR 1 200 000 HELLENIC PETROLEUM FINAN 14/10/2021 4.875 FIXED 1 193 436.00 1 267 032.00 5.26%
EUR 2 170 000 HELLENIC REPUBLIC 24/2/2023 3 STEP CPN 1 634 939.00 2 028 353.25 8.41%
EUR 3 820 000 HELLENIC REPUBLIC 24/2/2024 3 STEP CPN 2 788 036.50 3 516 672.90 14.59%
EUR 460 000 HELLENIC REPUBLIC 24/2/2025 3 STEP CPN 343 850.00 416 424.20 1.73%
EUR 460 000 HELLENIC REPUBLIC 24/2/2026 3 STEP CPN 333 960.00 412 256.60 1.71%
EUR 1 500 000 HELLENIC T-BILL 3/11/2017 0 ZERO COUPON 1 477 815.00 1 491 742.50 6.19%
EUR 150 000 MOTOR OIL FINANCE PLC 1/4/2022 3.25 FIXED 149 149.50 153 443.25 0.64%
EUR 500 000 NATIONAL BANK OF CANADA 11/9/2017 0 FLOATING 500 000.00 500 350.00 2.08%
EUR 220 000 OTE PLC 7/2/2018 7.875 FIXED 235 950.00 228 840.70 0.95%
EUR 660 000 OTE PLC 9/7/2020 3.5 FIXED 618 475.00 687 030.30 2.85%
EUR 200 000 PUBLIC POWER CORP FIN 1/5/2019 5.5 FIXED 178 192.31 175 769.00 0.73%
EUR 4 000 000 SPAIN LETRAS DEL TESORO 17/11/2017 0 ZERO COUPON 4 009 540.03 4 006 000.00 16.62%
EUR 1 500 000 TREASURY CERTIFICATES 9/11/2017 0 ZERO COUPON 1 506 912.12 1 503 502.50 6.24%
Total Investments in Bonds 19 096 915.16 20 568 646.58 85.32%
Total transferable securities admitted to an official exchange listing 19 096 915.16 20 568 646.58 85.32%
Total Investments 19 096 915.16 20 568 646.58 85.32%
20 568 646.58
Portfolio breakdownas at June 30, 2017
By countries / by issuers
Belgium 7.31%
Canada 2.43%
France 6.82%
Greece 38.24%
Italy 7.30%
Spain 19.48%
United Kingdom 13.65%
United States 4.77%
Total 100.00%
By industry groups
Banks 15.46%
Electricity 0.85%
Other 11.36%
Sovereign 72.32%
Total 100.00%
The accompanying notes form an integral part of these financial statements 56

(LF) Special Purpose Best Performers VI Fund
Schedule of investmentsas at June 30, 2017
(All figures in EUR)
Shares / Cost Market % of Net
Currency Nominal Name Price Price Assets
Transferable securities admitted to an official exchange listing
Bonds
EUR 500 000 BANQUE FED CRED MUTUEL 19/1/2018 0 FLOATING 500 035.50 500 885.00 2.38%
EUR 500 000 BPCE SA 5/2/2018 0 FLOATING 499 900.00 500 942.50 2.38%
EUR 400 000 CCTS EU 15/12/2020 0.53 FLOATING 406 732.00 406 736.00 1.93%
EUR 800 000 CCTS EU 15/2/2024 0.51 FLOATING 776 664.00 794 128.00 3.77%
EUR 200 000 ERB HELLAS PLC 26/6/2018 4.25 FIXED 181 670.00 197 291.00 0.94%
EUR 200 000 GOLDMAN SACHS GROUP INC 18/12/2017 0.371 FLOATING 200 000.00 200 582.00 0.95%
EUR 525 000 GOLDMAN SACHS GROUP INC 29/4/2019 0.371 FLOATING 525 000.00 529 496.63 2.51%
EUR 1 000 000 HELLENIC PETROLEUM FINAN 14/10/2021 4.875 FIXED 994 530.00 1 055 860.00 5.01%
EUR 500 000 HELLENIC REPUBLIC 17/4/2019 4.75 FIXED 457 450.00 509 172.50 2.41%
EUR 2 400 000 HELLENIC REPUBLIC 24/2/2023 3 STEP CPN 1 784 816.50 2 243 340.00 10.64%
EUR 2 470 000 HELLENIC REPUBLIC 24/2/2024 3 STEP CPN 1 815 639.00 2 273 869.65 10.78%
EUR 350 000 HELLENIC REPUBLIC 24/2/2025 3 STEP CPN 261 625.00 316 844.50 1.50%
EUR 350 000 HELLENIC REPUBLIC 24/2/2026 3 STEP CPN 254 100.00 313 673.50 1.49%
EUR 1 500 000 HELLENIC T-BILL 3/11/2017 0 ZERO COUPON 1 477 815.00 1 491 742.50 7.07%
EUR 300 000 MOTOR OIL FINANCE PLC 1/4/2022 3.25 FIXED 298 299.00 306 886.50 1.46%
EUR 500 000 NATIONAL BANK OF CANADA 11/9/2017 0 FLOATING 500 000.00 500 350.00 2.37%
EUR 180 000 OTE PLC 7/2/2018 7.875 FIXED 193 050.00 187 233.30 0.89%
EUR 540 000 OTE PLC 9/7/2020 3.5 FIXED 506 025.00 562 115.70 2.67%
EUR 100 000 PUBLIC POWER CORP FIN 1/5/2019 5.5 FIXED 88 852.94 87 884.50 0.42%
EUR 2 600 000 SPAIN LETRAS DEL TESORO 17/11/2017 0 ZERO COUPON 2 606 201.02 2 603 900.00 12.35%
EUR 1 250 000 TREASURY CERTIFICATES 9/11/2017 0 ZERO COUPON 1 255 760.10 1 252 918.75 5.94%
Total Investments in Bonds 15 584 165.06 16 835 852.53 79.83%
Total transferable securities admitted to an official exchange listing 15 584 165.06 16 835 852.53 79.83%
Total Investments 15 584 165.06 16 835 852.53 79.83%
16 835 852.53
Portfolio breakdownas at June 30, 2017
By countries / by issuers
Belgium 7.44%
Canada 2.97%
France 5.95%
Greece 42.46%
Italy 7.13%
Spain 15.47%
United Kingdom 14.24%
United States 4.34%
Total 100.00%
By industry groups
Banks 14.43%
Electricity 0.52%
Other 12.55%
Sovereign 72.50%
Total 100.00%
The accompanying notes form an integral part of these financial statements 57

(LF) Special Purpose Step Up Formula (RON) Fund
Schedule of investmentsas at June 30, 2017
(All figures in EUR)
Shares / Cost Market % of Net
Currency Nominal Name Price Price Assets
Transferable securities admitted to an official exchange listing
Bonds
RON 3 000 000 ROMANIA T-BILL 11/6/2018 0 ZERO COUPON 2 975 430.00 2 977 125.00 17.95%
RON 4 000 000 ROMANIA GOVERNMENT BOND 17/1/2018 3.25 FIXED 4 124 343.05 4 056 380.00 24.45%
RON 1 700 000 ROMANIA T-BILL 28/8/2017 0 ZERO COUPON 1 690 598.39 1 698 648.50 10.24%
RON 500 000 ROMANIA T-BILL 16/10/2017 0 ZERO COUPON 496 508.31 499 140.00 3.01%
RON 3 000 000 ROMANIA T-BILL 21/2/2018 0 ZERO COUPON 2 973 760.37 2 985 990.00 18.00%
RON 700 000 ROMANIA GOVERNMENT BOND 26/7/2017 5.9 FIXED 737 551.66 702 271.50 4.23%
RON 500 000 ROMANIA T-BILL 27/11/2017 0 ZERO COUPON 495 635.33 498 742.50 3.01%
RON 2 000 000 ROMANIA T-BILL 10/1/2018 0 ZERO COUPON 1 979 980.20 1 992 660.00 12.01%
Total Investments in Bonds 15 473 807.31 15 410 957.50 92.91%
Total transferable securities admitted to an official exchange listing 15 473 807.31 15 410 957.50 92.91%
Total Investments 15 473 807.31 15 410 957.50 92.91%
15 410 957.50
Portfolio breakdownas at June 30, 2017
By countries / by issuers
Romania 100.00%
Total 100.00%
By industry groups
Sovereign 100.00%
Total 100.00%
The accompanying notes form an integral part of these financial statements 58

59
Notes to the financial statements
As at June 30, 2017
1. General
(LF) (“the Fund”) is an open-ended investment fund which has been created on May 1, 2006 as a
mutual investment fund (“Fonds Commun de Placement”) organised under Part I of the
Luxembourg Law of December 17, 2010, as amended, relating to undertakings for collective
investment (the “2010 Law” amended by UCITS V).
The Fund is managed by Eurobank Fund Management Company (Luxembourg) S.A. (the
“Management Company”), a company incorporated under the laws of Luxembourg and having
its registered office in Luxembourg.
The Management Company may issue units in several classes (collectively “Classes” and each a
“Class”) in each Sub-Fund having: (i) a specific sales and redemption charge structure and/or (ii)
a specific management or advisory fee structure and/or (iii) different distribution, Unitholder
servicing or other fees and/or (iv) different types of targeted investors or distribution channels
and/or (v) a different hedging structure and/or (vi) such other features as may be determined by
the Management Company from time to time.
As at June 30, 2017, 26 sub-funds are active. T he active classes o f units are as follo ws:
Sub-Funds - Classes of Units Launched
Date
(LF) Equity - Global Equities Fund - Eurobank 18/09/2006
(LF) Equity - Global Equities Fund - Eurobank I 14/12/2006
(LF) Equity - Global Equities Fund - Eurobank (USD) 20/09/2011
(LF) Equity - Global Equities Fund - Interamerican 13/10/2011
(LF) Equity - Global Equities Fund - Private Banking Class 12/11/2014
(LF) Equity - Global Equities Fund - Private Banking Class (USD) 22/05/2015
(LF) Equity - Emerging Europe Fund - Eurobank 18/09/2006
(LF) Equity - Emerging Europe Fund - Eurobank I 02/01/2007
(LF) Equity - Emerging Europe Fund - Postbank 18/12/2007
(LF) Equity - Emerging Europe Fund - Postbank (BGN) 24/09/2010
(LF) Equity - Emerging Europe Fund - Interamerican 13/10/2011
(LF) Equity - Emerging Europe Fund - Eurobank (USD) 12/11/2014
(LF) Equity - Emerging Europe Fund - Bancpost (RON) 01/10/2014
(LF) Equity - Emerging Europe Fund - Private Banking Class 11/01/2016
(LF) Equity - Greek Equities Fund - Eurobank 18/09/2006
(LF) Equity - Greek Equities Fund - Eurobank I 25/09/2012

60
Notes to the financial statements
As at June 30, 2017 (continued)
1. General (continued)
(LF) Equity - Greek Equity Fund - Private Banking Class 30/01/2015
(LF) Income Plus $ Fund - Eurobank 18/09/2006
(LF) Income Plus $ Fund - Private Banking Class 10/12/2014
(LF) Absolute Return Fund - Eurobank 09/10/2006
(LF) Absolute Return Fund - Eurobank I 07/12/2006
(LF) Absolute Return Fund - Private Banking Class 14/10/2014
(LF) Absolute Return Fund - Postbank 09/03/2016
(LF) Special Purpose Dual Formula Fund - Eurobank I 11/06/2007
(LF) Special Purpose Blue Chips Protect Fund - Eurobank 29/10/2007
(LF) Special Purpose Blue Chips Protect Fund - Eurobank I 30/10/2007
(LF) Special Purpose Blue Chips Protect II Fund - Eurobank 12/02/2008
(LF) Special Purpose Blue Chips Protect II Fund - Eurobank I 20/02/2008
(LF) Special Purpose Blue Chips Protect III Fund - Eurobank I 06/06/2008
(LF) Income Plus (RON) - Bancpost 12/10/2009
(LF) Balanced - Active Fund (RON) - Bancpost 13/10/2009
(LF) Equity - Flexi Style Greece Fund - Eurobank 25/08/2008
(LF) Equity - Flexi Style Greece Fund - Private Banking Class 10/10/2014
(LF) Income Plus Fund € Fund - Eurobank 25/08/2008
(LF) Income Plus Fund € Fund - Eurobank I 20/09/2013
(LF) Income Plus Fund € Fund - Interamerican 28/01/2014
(LF) Income Plus Fund € Fund - Private Banking Class 14/10/2014
(LF) Greek Government Bond Fund - Eurobank 23/03/2009
(LF) Greek Government Bond Fund - Eurobank I 19/09/2012
(LF) Greek Government Bond Fund - Private Banking Class 14/10/2014
(LF) Greek Government Bond Fund - Private Banking DIS 22/04/2015
(LF) Total Return Fund - Prelium A 05/07/2010
(LF) Total Return Fund - Prelium B 19/11/2010
(LF) Money Market Fund - Reserve - Eurobank 23/09/2011
(LF) Money Market Fund - Reserve - Eurobank I 20/09/2013
(LF) Money Market Fund - Reserve - Interamerican 11/10/2011
(LF) Money Market Fund - Reserve - Bancpost 24/04/2015
(LF) Money Market Fund - Reserve - Private Banking Class 15/10/2014
(LF) Global Bond Fund - Eurobank 02/04/2012

Notes to the financial statements
As at June 30, 2017 (continued)
61
1. General (continued)
(LF) Global Bond Fund - Eurobank I 23/09/2013
(LF) Global Bond Fund - Private Banking Class 23/12/2014
(LF) Global Bond Fund - Private Banking Class DIS 02/02/2017
(LF) Equity - Middle East - North Africa Fund - Eurobank 02/04/2012
(LF) Equity - Middle East - North Africa Fund - Eurobank I 21/09/2012
(LF) Special Purpose Best Performers Fund - Eurobank I 17/09/2012
(LF) Greek Corporate Bond Fund - Eurobank 03/06/2013
(LF) Greek Corporate Bond Fund - Eurobank I 26/06/2013
(LF) Greek Corporate Bond Fund - Private Banking Class 10/10/2014
(LF) Greek Corporate Bond Fund - Private Banking DIS 24/04/2015
(LF) Special Purpose Best Performers II Fund - Eurobank I 11/11/2013
(LF) Special Purpose Best Performers III Fund - Eurobank I 17/03/2014
(LF) Special Purpose Best Performers IV Fund - Eurobank I 06/06/2014
(LF) Special Purpose Best Performers V Fund - Eurobank I 13/10/2014
(LF) Special Purpose Best Performers VI Fund - Eurobank I 17/03/2015
(LF) Special Purpose Step Up Formula (RON) Fund - Bancpost 09/05/2016
2. Summary of significant accounting policies
The financial statements are prepared in accordance with Luxembourg regulations relating to
undertakings for collective investments.
a) Basis of presentation of the financial statements
The financial statements of each Sub-Fund are kept in the following currencies:
(LF) Equity - Global Equities Fund EUR
(LF) Equity - Emerging Europe Fund EUR
(LF) Equity - Greek Equities Fund EUR
(LF) Income Plus $ Fund USD
(LF) Absolute Return Fund EUR
(LF) Special Purpose Dual Formula Fund EUR
(LF) Special Purpose Blue Chips Protect Fund EUR
(LF) Special Purpose Blue Chips Protect II Fund EUR
(LF) Special Purpose Blue Chips Protect III Fund EUR
(LF) Income Plus (RON) RON
(LF) Balanced - Active Fund (RON) RON

Notes to the financial statements
As at June 30, 2017 (continued)
62
2. Summary of significant accounting policies (continued)
(LF) Equity - Flexi Style Greece Fund EUR
(LF) Income Plus € Fund EUR
(LF) Greek Government Bond Fund EUR
(LF) Total Return Fund EUR
(LF) Money Market Fund - Reserve EUR
(LF) Global Bond Fund EUR
(LF) Equity - Middle East - North Africa Fund EUR
(LF) Special Purpose Best Performers Fund EUR
(LF) Greek Corporate Bond Fund EUR
(LF) Special Purpose Best Performers II Fund EUR
(LF) Special Purpose Best Performers III Fund EUR
(LF) Special Purpose Best Performers IV Fund EUR
(LF) Special Purpose Best Performers V Fund EUR
(LF) Special Purpose Best Performers VI Fund EUR
(LF) Special Purpose Step Up Formula (RON) Fund RON
The combined financial statements of the Fund reflecting the assets and liabilities of all portfolios
are expressed in Euro.
b) Security Valuation
Securities quoted or dealt in on any stock exchange or another regulated market are valued at the
latest available price.
When such prices are not representative of the fair value of the relevant securities and in the case
of unquoted securities, the valuation is based on the respective reasonable foreseeable sales price
as determined prudently and in good faith by the Board of Directors of the Management
Company of the Fund.
Where practice allows, liquid assets, money market instruments and all other instruments such as
those with interest rates adjusted at least annually based on market conditions, may be valued at
nominal value plus any accrued interest or an amortized cost basis. If the method of valuation on
an amortized cost basis is used, the portfolio holdings will be reviewed from time to time under
the direction of the Board of Directors to determine whether a deviation exists between the net
assets calculated using market quotations and that calculated on an amortized cost basis.
If a deviation exists which may result in a material dilution or other unfair result to Unitholders,
appropriated corrective action will be taken including, if necessary, the calculation of the Net
Asset Value by using available market quotations.
Investments in open-ended UCIs are valued on the basis of the last available NAV of the units or
shares of such UCIs.

Notes to the financial statements
As at June 30, 2017 (continued)
63
2. Summary of significant accounting policies (continued)
c) Foreign currency translation
The cost of investments and the transactions during the year/period, expressed in foreign
currencies, are converted into the reporting currency of each Sub-Fund at the rate of exchange
ruling at the time of the purchase or transaction.
The market value of investments and other assets and other liabilities, expressed in foreign
currencies, are translated into the reporting currency of each Sub-Fund at end of period exchange
rates. Exchange differences arising on foreign currency translation are taken to statements of
operations of the Annual report. The combined statement is calculated at end of period exchange
rates.
Closing exchange rates as at June 30, 2017 relating to EUR are:
1 AED = 0.2397 EUR
1 BGN = 0.5113 EUR
1 CHF = 0.9149 EUR
1 CZK = 0.0382 EUR
1 DKK = 0.1345 EUR
1 EGP = 0.0488 EUR
1 HUF = 0.0032 EUR
1 GBP = 1.1372 EUR
1 ISK = 0.0086 EUR
1 JPY = 0.0078 EUR
1 KWD = 2.8885 EUR
1 MAD = 0.0907 EUR
1 NOK = 0.1045 EUR
1 OMR = 2.2732 EUR
1 PLN = 0.2366 EUR
1 QAR = 0.2365 EUR
1 RON = 0.2197 EUR
1 RSD = 0.0083 EUR
1 TRY = 0.2492 EUR
1 USD = 0.8763 EUR
d) Interest and Dividend income
Interest income is recognised on an accrual basis, net of any irrecoverable withholding tax.
Dividends are recorded on an ex-dividend basis, net of any irrecoverable withholding tax.
Withholding taxes are however recorded on a dedicated expense account.
e) Formation expenses
Formation expenses are amortised on a straight line basis over a period of 5 years.

Notes to the financial statements
As at June 30, 2017 (continued)
64
2. Summary of significant accounting policies (continued)
f) Forward foreign exchange contracts
Forward foreign exchange contracts are valued at the forward rate applicable at the date of the
statement of net assets of each Sub-Fund for the remaining period until maturity.
Realised gains/losses and change in unrealised appreciation/depreciation resulting there from are
included in the statement of operations of the Annual report of each Sub-Fund under “Net
realised gain/(loss) on forward foreign exchange contracts” and “Change in net unrealised
appreciation/depreciation on forward foreign exchange contracts”.
g) Valuation of option contracts
The value of options that are traded on stock exchange is based on the closing prices published
by the stock exchange where the company has concluded the related contracts. The liquidation
value of options that are not traded on stock exchange is determined according to the guidelines
decided by the Board of Directors of the Management Company, following uniform criteria for
each type of contract.
Purchased Options - Premiums paid by the Fund for purchased options are included in the
statement of net assets as an investment. The option is adjusted daily to reflect the current market
value of the option and the change is recorded as unrealised appreciation or depreciation. If the
option is allowed to expire, the Fund will lose the entire premium it paid and record a realised
loss for the premium amount.
Premiums paid for purchased options which are exercised or closed are added to the amounts
paid or offset against the proceeds on the underlying investment transaction to determine the
realised gain/loss or cost basis of the security.
Written Options - Premiums received by the Fund for written options are included in the
statement of net assets. The amount of the liability is adjusted daily to reflect the current market
value of the written option and the change in market value is recorded as unrealised appreciation
or depreciation. Premiums received from written options that expire are treated as realised gains.
The Fund records a realised gain or loss on written options based on whether the cost of the
closing transaction exceeds the premium received. If a call option is exercised by the option
buyer, the premium received by the Fund is added to the proceeds from the sale of the underlying
security to the option buyer and compared to the cost of the closing transaction to determine
whether there has been a realised gain or loss. If a put option is exercised by an option buyer, the
premium received by the option seller reduces the cost basis of the purchased security.
The realised gains/(losses) and change in unrealised appreciation/depreciation on options are
disclosed in the statement of operations and changes in net assets of the Annual report
respectively under the headings “Net realised gain/(loss) on financial futures, options and swaps”
and “Change in net unrealised appreciation/(depreciation) on financial futures, options and
swaps.”

Notes to the financial statements
As at June 30, 2017 (continued)
65
2. Summary of significant accounting policies (continued)
h) Valuation of financial futures contracts
Upon entering into a futures contract, the Fund is required to deposit with the broker, cash or
securities in an amount equal to a certain percentage of the contract amount which is referred to
as the initial margin account.
The value of futures contracts that are traded on stock exchange is based on the closing prices
published by the stock exchange where the company has concluded the related contracts. The
value of futures contracts that are not traded on stock exchange is determined according to the
guidelines decided by the Board of Directors of the Management Company, following uniform
criteria for each type of contract.
The unrealised appreciation/(depreciation) on future contracts is disclosed in the statement of net
assets under “Unrealised gain/loss on financial futures”. Changes in the market value of open
futures contracts are recorded as unrealised appreciation/(depreciation) in the statement of
operations of the Annual report under “Change in net unrealised appreciation/(depreciation) on
financial futures and options”. Realised gains or losses, representing the difference between the
value of the contract at the time it was opened and the value at the time it was closed, are
reported at the closing or expiration of futures contracts in the statement of operations of the
Annual report under “Net realised gains/(losses) on financial futures and options”. Securities
deposited as initial margin account are designated in the schedule of investments and cash
deposited is recorded on the statement of net assets. A receivable and/or a payable to brokers for
the daily variation margin is also recorded on the statement of net assets.
i) Valuation of swap contracts
Swap transactions will be consistently valued based on a calculation of the net present value of
their expected cash flows. The swaps will be valued based on the valuation elements laid down in
the contracts and is obtained on a daily basis from the swap counterparty/ies based on the
following method:
- Valuations are based upon observable data whenever directly available in the market or
based upon model prices whenever data are non-directly observable in the market. As
soon as every observable data (market closes) and non-directly observable (like implied
volatilities & correlations) are collected, a pricing software starts computing the option
prices of the swaps. Monte Carlo (number of drawings may vary from 1000 to
10000/20000 depending on the model’s convergence rate), Closed Form or Finite
Difference methods/models are used for assessing optional pay-offs depending on the
options’ complexity;
- Once the options are valued, the remaining data for computing the swaps Mark-To-
Market, i.e. interest rate curves, etc. are collected and used to calculate the value of the
swaps;
- The models and parameters used for the valuation are audited and validated by the swap
counterparty’s risk management departments, which operate independently from the front
office. The final valuations of the swaps are reviewed and validated by the Risk
Management department of Eurobank Asset Management Mutual Funds Management
Company S.A..

Notes to the financial statements
As at June 30, 2017 (continued)
66
2. Summary of significant accounting policies (continued)
i) Valuation of swap contracts (continued)
Valuations provided by the swap counterparty/ies are compared with independent sources
(Independent Broker quotes and/or Risk Management of Eurobank Asset Management Mutual
Funds Management Company S.A.) according to the policies established in good faith by the
Board of Directors.
The unrealised appreciation/(depreciation) is disclosed in the statement of net assets under
“Financial derivative instruments: options, swaps and forward foreign exchange
contracts”.Realised gains/(losses) and changes in unrealised appreciation/(depreciation) as a
result thereof are included in the statement of operations of the Annual report respectively under
“Net realised gain/(loss) on financial futures, options and swaps” and “Net change in unrealised
appreciation/(depreciation) on financial futures, options and swaps”.
j) Realised gains and losses on sales of investments in securities
Investments in securities are accounted for on a trade date basis. Realised gains and losses on
sales of investments in securities are based on the average cost basis.
k) Money Market and Cash Sub-Funds: cash and time deposits
The following Sub-Funds invest their assets primarily in bank deposits and money market
instruments accordingly with their investment objectives.
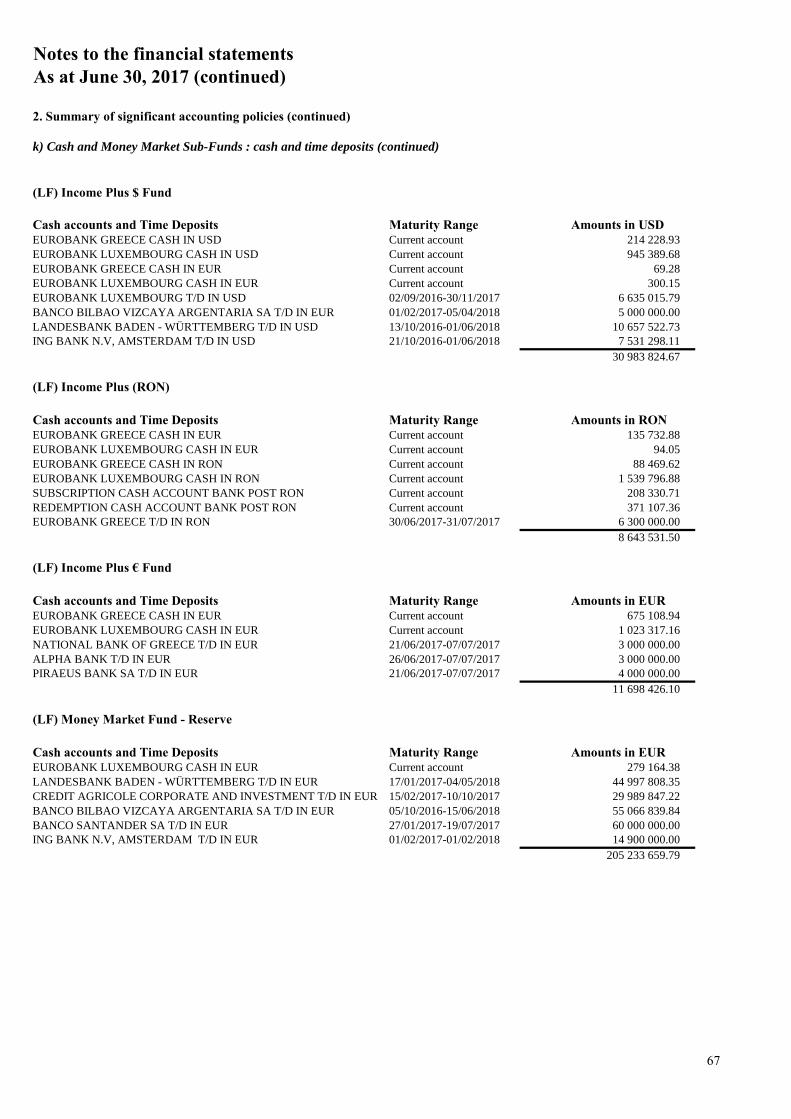
Notes to the financial statements
As at June 30, 2017 (continued)
2. Summary of significant accounting policies (continued)
(LF) Income Plus $ Fund
Cash accounts and Time Deposits Maturity Range Amounts in USD
EUROBANK GREECE CASH IN USD Current account 214 228.93
EUROBANK LUXEMBOURG CASH IN USD Current account 945 389.68
EUROBANK GREECE CASH IN EUR Current account 69.28
EUROBANK LUXEMBOURG CASH IN EUR Current account 300.15
EUROBANK LUXEMBOURG T/D IN USD 02/09/2016-30/11/2017 6 635 015.79
BANCO BILBAO VIZCAYA ARGENTARIA SA T/D IN EUR 01/02/2017-05/04/2018 5 000 000.00
LANDESBANK BADEN - WÜRTTEMBERG T/D IN USD 13/10/2016-01/06/2018 10 657 522.73
ING BANK N.V, AMSTERDAM T/D IN USD 21/10/2016-01/06/2018 7 531 298.11
30 983 824.67
(LF) Income Plus (RON)
Cash accounts and Time Deposits Maturity Range Amounts in RON
EUROBANK GREECE CASH IN EUR Current account 135 732.88
EUROBANK LUXEMBOURG CASH IN EUR Current account 94.05
EUROBANK GREECE CASH IN RON Current account 88 469.62
EUROBANK LUXEMBOURG CASH IN RON Current account 1 539 796.88
SUBSCRIPTION CASH ACCOUNT BANK POST RON Current account 208 330.71
REDEMPTION CASH ACCOUNT BANK POST RON Current account 371 107.36
EUROBANK GREECE T/D IN RON 30/06/2017-31/07/2017 6 300 000.00
8 643 531.50
(LF) Income Plus € Fund
Cash accounts and Time Deposits Maturity Range Amounts in EUR
EUROBANK GREECE CASH IN EUR Current account 675 108.94
EUROBANK LUXEMBOURG CASH IN EUR Current account 1 023 317.16
NATIONAL BANK OF GREECE T/D IN EUR 21/06/2017-07/07/2017 3 000 000.00
ALPHA BANK T/D IN EUR 26/06/2017-07/07/2017 3 000 000.00
PIRAEUS BANK SA T/D IN EUR 21/06/2017-07/07/2017 4 000 000.00
11 698 426.10
(LF) Money Market Fund - Reserve
Cash accounts and Time Deposits Maturity Range Amounts in EUR
EUROBANK LUXEMBOURG CASH IN EUR Current account 279 164.38
LANDESBANK BADEN - WÜRTTEMBERG T/D IN EUR 17/01/2017-04/05/2018 44 997 808.35
CREDIT AGRICOLE CORPORATE AND INVESTMENT T/D IN EUR 15/02/2017-10/10/2017 29 989 847.22
BANCO BILBAO VIZCAYA ARGENTARIA SA T/D IN EUR 05/10/2016-15/06/2018 55 066 839.84
BANCO SANTANDER SA T/D IN EUR 27/01/2017-19/07/2017 60 000 000.00
ING BANK N.V, AMSTERDAM T/D IN EUR 01/02/2017-01/02/2018 14 900 000.00
205 233 659.79
k) Cash and Money Market Sub-Funds : cash and time deposits (continued)
67

Notes to the financial statements
As at June 30, 2017 (continued)
2. Summary of significant accounting policies (continued)
(LF) Absolute Return Fund
Cash accounts and Time Deposits Maturity Range Amounts in EUR
EUROBANK GREECE CASH IN EUR Current account 200 409.05 EUROBANK LUXEMBOURG CASH IN EUR Current account 2 463 010.34 SUBSCRIPTION ACCOUNT- BANK POST EUR Current account 28.46 BANKPOST REDEMPTION ACCOUNTS-EUR Current account 101.27 MARGIN EUROBANK IN EURO / ETESEP Current account 0.01 MARGIN EUROBANK EQUITIES INVEST FIRM EURO Current account 17 748.07 MARGIN IN EURO CREDIT SUISSE Current account 1 902 611.13 EUROBANK GREECE CASH IN USD Current account 176 400.67 EUROBANK LUXEMBOURG CASH IN USD Current account 1 894 912.81 MARGIN EUROBANK EQUITIES IN USD Current account 2 933 325.39 EUROBANK GREECE CASH IN GBP Current account 12.70 EUROBANK LUXEMBOURG CASH IN GBP Current account 383 500.29 MARGIN EUROBANK EQUITIES IN GBP Current account 2 749.53 MARGIN EUROBANK EQUITIES IN CHF Current account 26 548.97 EUROBANK GREECE CASH IN JPY Current account 193 490.20 EUROBANK GREECE CASH IN RON Current account 219 669.18 EUROBANK LUXEMBOURG CASH IN RON Current account 16 327.94 EUROBANK GREECE CASH IN PLN Current account 0.03 EUROBANK GREECE CASH IN TRY Current account 249.93 LANDESBANK BADEN - WÜRTTEMBERG T/D IN EUR 27/06/2017-11/07/2017 4 494 739.48 L.PIRAEUS BANK T/D IN EUR 22/06/2017-14/07/2017 6 305 210.41 ING BANK N.V, AMSTERDAM T/D IN USD 10/02/2017-17/10/2017 876 270.59 ING BANK N.V, AMSTERDAM T/D IN EUR 27/06/2017-05/07/2017 2 994 172.00
25 101 488.45
The difference between this total amount and the "Cash at bank" in the Statement of Net Assets is due to deposit margins related
to futures contracts.
(LF) Total Return Fund
Cash accounts and Time Deposits Maturity Range Amounts in EUR
EUROBANK GREECE CASH IN EUR Current account 158.76 EUROBANK LUXEMBOURG CASH IN EUR Current account 930.95 EUROBANK GREECE CASH IN USD Current account 41.52 EUROBANK LUXEMBOURG CASH IN USD Current account 48 606.41 MARGIN EUROBANK EQUITIES IN USD Current account 77 737.24 EUROBANK GREECE CASH IN GBP Current account 31.40 EUROBANK LUXEMBOURG CASH IN GBP Current account 134.17 EUROBANK GREECE CASH IN PLN Current account 0.04 EUROBANK GREECE CASH IN TRY Current account 0.08 MARGIN EUROBANK IN EURO / ETESEP Current account 12 863.82 MARGIN EUROBANK EQUITIES INVEST FIRM (EURO) Current account 194 074.96 ING BANK N.V, AMSTERDAM T/D IN EUR 03/05/2017-17/10/2017 50 000.00 ING BANK N.V, AMSTERDAM T/D IN USD 18/10/2016-18/10/2017 219 139.95
603 719.30
The difference between this total amount and the "Cash at bank" in the Statement of Net Assets is due to deposit margins related
to futures contracts.
(LF) Special Purpose Best Performers IV Fund
Cash accounts and Time Deposits Maturity Range Amounts in EUR
EUROBANK GREECE CASH IN EUR Current account 136 117.36 EUROBANK LUXEMBOURG CASH IN EUR Current account 847 082.59 LANDESBANK BADEN - WÜRTTEMBERG T/D IN EUR 19/06/2017-19/07/2017 1 497 033.80 ING BANK N.V, AMSTERDAM T/D IN EUR 02/06/2017-03/07/2017 399 533.53
2 879 767.28
(LF) Special Purpose Best Performers VI Fund
Cash accounts and Time Deposits Maturity Range Amounts in EUR
EUROBANK GREECE CASH IN EUR Current account 83 552.05 EUROBANK LUXEMBOURG CASH IN EUR Current account 679 671.78 NATIONAL BANK OF GREECE T7D IN EUR 16/06/2017-17/07/2017 1 004 986.43 LANDESBANK BADEN - WÜRTTEMBERG T/D IN EUR 19/06/2017-19/07/2017 1 996 045.07 ING BANK N.V, AMSTERDAM T/D IN EUR 02/06/2017-03/07/2017 998 875.50
4 763 130.83
l) Other Sub-Funds : cash and time deposits (continued)
68

Notes to the financial statements
As at June 30, 2017 (continued)
69
3. Management fees and performance fees
Management fees are due by each Sub-Fund and are calculated daily based on the net assets of
each class of Units during the month and are payable monthly.
As at June 30, 2017, the following effective rates are applicable per annum:
(LF) Equity - Global Equities Fund - Eurobank 2%
(LF) Equity - Global Equities Fund - Eurobank I 1.12%
(LF) Equity - Global Equities Fund - Eurobank (USD) 2%
(LF) Equity - Global Equities Fund - Interamerican 2.25%
(LF) Equity - Global Equities Fund - Private Banking Class 2%
(LF) Equity - Global Equities Fund - Private Banking Class (USD) 2%
(LF) Equity - Emerging Europe Fund - Eurobank 2.50%
(LF) Equity - Emerging Europe Fund - Eurobank I 1.25%
(LF) Equity - Emerging Europe Fund - Postbank 2.50%
(LF) Equity - Emerging Europe Fund - Interamerican 2.25%
(LF) Equity - Emerging Europe Fund - Postbank (BGN) 3.00%
(LF) Equity - Emerging Europe Fund - Eurobank (USD) 2.50%
(LF) Equity - Emerging Europe Fund - Bancpost (RON) 3.00%
(LF) Equity - Emerging Europe Fund - Private Banking Class 2.50%
(LF) Equity - Greek Equities Fund - Eurobank 2.50%
(LF) Equity - Greek Equities Fund - Eurobank I 1.00%
(LF) Equity - Greek Equities Fund - Private Banking Class 2.50%
(LF) Income Plus $ Fund - Eurobank 0.25%
(LF) Income Plus $ Fund - Private Banking Class 0.25%
(LF) Absolute Return Fund - Eurobank 1.00%
(LF) Absolute Return Fund - Eurobank I 0.75%
(LF) Absolute Return Fund - Private Banking Class 1.00%
(LF) Absolute Return Fund - Postbank 1.00%
(LF) Special Purpose Dual Formula Fund - Eurobank I 3.50%
(LF) Special Purpose Blue Chips Protect Fund - Eurobank 1.40%
(LF) Special Purpose Blue Chips Protect Fund - Eurobank I 1.40%
(LF) Special Purpose Blue Chips Protect II Fund - Eurobank 0.00%
(LF) Special Purpose Blue Chips Protect II Fund - Eurobank I 1.25%
(LF) Special Purpose Blue Chips Protect III Fund - Eurobank I 1.25%
(LF) Income Plus (RON) - Bancpost 0.50%

Notes to the financial statements
As at June 30, 2017 (continued)
70
3. Management fees and performance fees (continued)
(LF) Balanced - Active Fund (RON) - Bancpost 4.00%
(LF) Equity - Flexi Style Greece Fund - Eurobank 2.50%
(LF) Equity - Flexi Style Greece Fund - Private Banking Class 2.50%
(LF) Income Plus € Fund - Eurobank 0.75%
(LF) Income Plus € Fund - Eurobank I 0.40%
(LF) Income Plus € Fund - Interamerican 0.50%
(LF) Income Plus € Fund - Private Banking Class 0.75%
(LF) Greek Government Bond Fund - Eurobank 1.75%
(LF) Greek Government Bond Fund - Eurobank I 0.60%
(LF) Greek Government Bond Fund - Private Banking Class 1.75%
(LF) Greek Government Bond Fund - Private Banking DIS 1.75%
(LF) Total Return Fund - Prelium A 2.00%
(LF) Total Return Fund - Prelium B 1.00%
(LF) Money Market Fund - Reserve - Eurobank 0.25%
(LF) Money Market Fund - Reserve - Eurobank I 0.10%
(LF) Money Market Fund - Reserve - Interamerican 0.15%
(LF) Money Market Fund - Reserve - Private Banking Class 0.25%
(LF) Money Market Fund - Reserve - Bancpost 0.15%
(LF) Global Bond Fund - Eurobank 0.80%
(LF) Global Bond Fund - Eurobank I 0.40%
(LF) Global Bond Fund - Private Banking Class 0.80%
(LF) Global Bond Fund - Private Banking Class DIS 0.80% (A)
(LF) Equity - Middle East - North Africa Fund - Eurobank 2.50%
(LF) Equity - Middle East - North Africa Fund - Eurobank I 1.50%
(LF) Special Purpose Best Performers Fund - Eurobank I 2.00%
(LF) Greek Corporate Bond Fund - Eurobank 1.25%
(LF) Greek Corporate Bond Fund Eurobank I 0.50%
(LF) Greek Corporate Bond Fund - Private Banking Class 1.25%
(LF) Greek Corporate Bond Fund - Private Banking DIS 1.25%
(LF) Special Purpose Best Performers II Fund - Eurobank I 1.50%

Notes to the financial statements
As at June 30, 2017 (continued)
71
3. Management fees and performance fees (continued)
(LF) Special Purpose Best Performers III Fund - Eurobank I 1.25%
(LF) Special Purpose Best Performers IV Fund - Eurobank I 1.00%
(LF) Special Purpose Best Performers V Fund - Eurobank I 0.50%
(LF) Special Purpose Best Performers VI Fund - Eurobank I 0.70%
(LF) Special Purpose Step Up Formula (RON) Fund - Bancpost 0.70%
(A) 0.00% up to February 2nd, 2017; 0,80 % from February 3rd, 2017
The Management Company may further receive for certain Sub-Funds a performance fee as
indicated in the relevant Appendices of the prospectus to the Sub-Funds concerned.
In (LF) Absolute Return Fund, a Performance Fee is calculated and accrued on each Valuation
Day and paid on a quarterly basis, provided that the Net Asset Value per Unit before
Performance Fee is higher than the Target Net Asset Value per Unit.
The Target Net Asset Value per Unit corresponds to the previous quarter end Net Asset Value per
Unit multiplied by (1 + the Benchmark). The Benchmark is based on the calculated Weighted
Average ECB rate +250bps, prevailing within the period (i.e. quarterly) and prorated over the
period considered.
The Management Company will only be entitled to a Performance Fee if the quarter end Net
Asset Value per Unit before Performance Fee is higher than any previous quarter end Net Asset
Value per Unit on the basis of which a Performance Fee was paid (a “historical highest”).
The Performance Fee will be equal to 20% of the difference between the Net Asset Value per
Unit before Performance Fee and the Target Net Asset Value per Unit multiplied by the average
number of Units outstanding on each Valuation Day since the beginning of the quarter.
Payment of a Performance Fee may be due at the end of a quarter although the Benchmark has
not been outperformed since last payment of a Performance Fee if (i) the quarter end Net Asset
Value per Unit before Performance Fee outperforms the Benchmark over the quarter considered
and (ii) the quarter end Net Asset Value per Unit corresponds to a “historical highest” as defined
above.
In (LF) Total Return Fund, a Performance Fee is calculated from the beginning of each calendar
year, accrued on each Valuation Day and paid on annual basis, at the end of each calendar year.
The performance fee is paid provided that the Net Asset Value per Unit before performance is
higher than the Target Net Asset Value per Unit.
The Target Net Asset Value per Unit corresponds to the previous calendar year end Net Asset
Value per Unit multiplied by (1+ the hurdle rate).
The hurdle rate (benchmark) is set to a fixed 7%.

Notes to the financial statements
As at June 30, 2017 (continued)
72
3. Management fees and performance fees (continued)
The Performance Fee will be equal to 20% of the difference between the Net Asset Value per
Unit before Performance Fee and the Target Net Asset Value per Unit multiplied by the average
number of Units outstanding on each Valuation Day since the beginning of the calendar year.
For the period ended June 30, 2017 a performance fee of:
- EUR 66 702.49 was payable for the (LF) Absolute Return Fund - Eurobank class
- EUR 8 416.32 was payable for the (LF) Absolute Return Fund - Eurobank I class
- EUR 2 274.18 was payable for the (LF) Absolute Return Fund - Private Banking class
- EUR 26.85 was payable for the (LF) Absolute Return Fund - Postbank (EUR) class
Total EUR 77 419.84 for the (LF) Absolute Return Fund
- No performance fee was payable for the (LF) Total Return Fund - Prelium A
- No performance fee was payable for the (LF) Total Return Fund - Prelium B
4. Depositary fees
In consideration for its services, the Depositary is entitled to receive out of the assets of the
relevant Sub-Fund a fee (the “Depositary Fee”) payable at the end of each month in arrears at an
annual rate not exceeding the percentage amount indicated in the Appendix of the Prospectus
relevant to each Sub-Fund of the Prospectus of the Fund (up to 0.50% for all sub-funds excluding
(LF) Absolute Return Fund (up to 0.20%) and (LF) Equity Middle East (0.55%)). This
percentage amount will be calculated on a daily basis on the Net Asset Value of that day of the
relevant Class over the period by reference to which the fee is calculated. The Depositary may
also receive transaction-based fees.
5. Administrative fees
The Management Company shall pay, out of the Management Fee the fees and expenses:
- the fees and expenses due to the investment manager and any appointed sub-investment
manager
- the fees and expenses due to the Administrative and Registrar Agent
- the fees and expenses due to the distributors
6. Taxation
The Fund is liable in Luxembourg to an annual tax (the "taxe d'abonnement") of 0.05%,
calculated and payable quarterly, on the aggregate Net Asset Value of the outstanding units of the
Fund at the end of each quarter. This annual tax is however reduced to 0.01% on the aggregate
Net Asset Value of the units in the Classes reserved to institutional investors as well as in Sub-
Funds that invest exclusively in certain short-term transferable debt securities and other
instruments pursuant to the Grand-Ducal Regulation of April 14, 2004.
7. Transactions relating to options, forward foreign exchange contracts, swaps, and
financial futures contracts
The Fund entered into a number of options, forward foreign exchange contracts, swaps and
financial futures contracts. As at June 30, 2017 the positions were as follows:

Notes to the financial statements
As at June 30, 2017 (continued)
7. Transactions relating to options, forward foreign exchange contracts, swaps, and financial future contracts (continued)
a) Financial Futures Contracts
(LF) Equity - Global Equities Fund
Currency Number of Contracts Financial Futures Contracts Counterparty Commitment Unrealised loss EUR
EUR 8 STOXX 50 FUTURE SEPTEMBER 2017 Eurobank 274 480.00 -11 280.00
-11 280.00
USD 15 NIKKEI FUTURE USD SEPTEMBER 2017 Eurobank 1 321 306.52 9 200.84
9 200.84
Total -2 079.16
At year-end, the collateral held at broker is composed of deposit margins for futures contracts with the counterparty Eurobank and amounts to EUR 217 808.98.
(LF) Absolute Return Fund
Currency Number of Contracts Financial Futures Contracts Counterparty CommitmentUnrealised gain/loss
EUR
EUR 5 FUTURE ON DAX SEPTEMBER 2017 Credit Suisse 1 540 000.00 -18 437.50
EUR -10 EURO - BUXL 30Y BOND SEPTEMBER 2017 Credit Suisse -1 635 200.00 59 000.00
40 562.50
USD 190 EUR/USD FUTURE SEPTEMBER 2017 Credit Suisse 16 328 316.68 287 800.12
287 800.12
Total 328 362.62
At year-end, the collateral held at broker is composed of deposit margins for futures contracts with the counterparty Credit Suisse and amounts to EUR 4 882 983.10.
(LF) Total Return Fund
Currency Number of Contracts Financial Futures Contracts Counterparty Commitment Unrealised gain EUR
EUR -6 STOXX 50 FUTURE SEPTEMBER 2017 Eurobank -205 860.00 8 580.00
8 580.00
USD -1 S&P 500 EMINI FUTURE SEPTEMBER 2017 Eurobank -106 072.56 736.07
USD -1 NASDAQ 100 E-MINI SEPTEMBER 2017 Eurobank -99 066.77 1 867.33
USD 9 EUR/USD FUTURE SEPTEMBER 2017 Eurobank 1 130 421.92 19 371.06
21 974.46
Total 30 554.46
At year-end, the collateral held at broker is composed of deposit margins for futures contracts with the counterparty Eurobank and amounts to EUR 206 938.78.
(LF) Global Bond Fund
Currency Number of Contracts Financial Futures Contracts Counterparty Commitment Unrealised gain EUR
USD 6 EUR/USD FUTURE SEPTEMBER 2017 Eurobank 753 614.62 12 585.44
Total 12 585.44
At year-end, the collateral held at broker is composed of deposit margins for futures contracts with the counterparty Eurobank and amounts to EUR 20 912.
b) Financial Options Contracts
(LF) Absolute Return Fund
Currency Number of Contracts Financial Options Contracts Counterparty Cost Price Market Price EUR
EUR 150 PUT DAX 12000 JULY 2017 Credit Suisse 31 700.00 64 575.00
50 PUT BUND 163 AUGUST 2017 Credit Suisse 13 000.00 73 500.00
200 CALL DAX 13100 JULY 2017 Credit Suisse 20 500.00 2 700.00
Total 65 200.00 140 775.00
73

Notes to the financial statements
As at June 30, 2017 (continued)
7. Transactions relating to options, forward foreign exchange contracts, swaps, and financial future contracts (continued)
b) Financial Swaps Contracts
(LF) Special Purpose Dual Formula Fund
Currency NominalMaturity
DateFinancial Swaps Contracts Desription Counterparty Collateral (cash) Unrealised loss EUR
EUR 27 074 500 20/07/2017
Receive part of the positive performance of DJ EuroStoxx Select
Dividend 30 Index and DAX Index Eurobank -72 900.00 -92 053.30
Pay EURIBOR 3 Months -72 900.00 -92 053.30
(LF) Special Purpose Blue Chips Protect Fund
Currency NominalMaturity
DateFinancial Swaps Contracts Desription Counterparty Collateral (cash) Unrealised gain EUR
EUR 8 600 000 12/01/2018 Receive part of the positive performance of Equity Index Eurostoxx 50 JP Morgan 1 579 000.00 1 553 466.93
Pay EURIBOR 3 Months plus 0.80% 1 579 000.00 1 553 466.93
(LF) Special Purpose Blue Chips Protect II Fund
Currency NominalMaturity
DateFinancial Swaps Contracts Desription Counterparty Collateral (cash) Unrealised gain EUR
EUR 5 535 000 26/03/2018 Receive part of the positive performance of Equity Index Eurostoxx 50 Societe Generale 901 700.00 914 935.50
Pay EURIBOR 3 Months plus 0.95%
EUR 885 000 26/03/2018 Receive part of the positive performance of Equity Index Eurostoxx 50 JP Morgan 200 200.00 154 495.35
Pay EURIBOR 3 Months plus 0.945% 1 101 900.00 1 069 430.85
(LF) Special Purpose Blue Chips Protect III Fund
Currency NominalMaturity
DateFinancial Swaps Contracts Desription Counterparty Collateral (cash) Unrealised gain EUR
EUR 3 900 000 12/07/2018 Receive part of the positive performance of Equity Index Eurostoxx 50 Societe Generale 630 600.00 602 160.00
Pay EURIBOR 3 Months plus 0.51%
EUR 3 290 000 12/07/2018 Receive part of the positive performance of Equity Index Eurostoxx 50 JP Morgan 560 000.00 532 069.13
Pay EURIBOR 3 Months plus 0.48% 1 190 600.00 1 134 229.13
(LF) Special Purpose Best Performers Fund
Currency NominalMaturity
DateFinancial Swaps Contracts Desription Counterparty Collateral (cash) Unrealised gain EUR
EUR 2 595 000 16/11/2022
Receive part of the positive performance of a basket of 20 shares
of Blue Chips from OCDE countries and various economic sectors Barclays 1 000 000.00 891 391.01
Pay EURIBOR 3 Months plus 0.7425%
EUR 7 472 000 16/11/2022
Receive part of the positive performance of a basket of 20 shares
of Blue Chips from OCDE countries and various economic sectors JP Morgan 2 654 000.00 2 503 688.10
Pay EURIBOR 3 Months plus 0.68% 3 654 000.00 3 395 079.11
74

Notes to the financial statements
As at June 30, 2017 (continued)
7. Transactions relating to options, forward foreign exchange contracts, swaps, and financial future contracts (continued)
b) Financial Swaps Contracts (continued)
(LF) Special Purpose Best Performers II Fund
Currency NominalMaturity
DateFinancial Swaps Contracts Desription Counterparty Collateral (cash) Unrealised gain EUR
EUR 17 310 000 05/01/2024
Receive part of the positive performance of a basket of 20 shares
of Blue Chips from OCDE countries and various economic sectors Societe Generale 2 986 000.00 2 651 892.00
Pay EURIBOR 3 Months plus 0.04%
EUR 5 600 000 20/12/2023
Receive part of the positive performance of a basket of 20 shares
of Blue Chips from OCDE countries and various economic sectors JP Morgan 990 000.00 878 284.51
Pay EURIBOR 3 Months plus 0.10% 3 976 000.00 3 530 176.51
(LF) Special Purpose Best Performers III Fund
Currency NominalMaturity
DateFinancial Swaps Contracts Desription Counterparty Collateral (cash) Unrealised gain EUR
EUR 13 700 000 14/05/2024
Receive part of the positive performance of a basket of 20 shares
of Blue Chips from OCDE countries and various economic sectors JP Morgan 2 741 001.00 2 497 361.90
Pay EURIBOR 3 Months plus 0.3675% 2 741 001.00 2 497 361.90
(LF) Special Purpose Best Performers IV Fund
Currency NominalMaturity
DateFinancial Swaps Contracts Desription Counterparty Collateral (cash) Unrealised gain EUR
EUR 6 596 000 16/07/2024
Receive part of the positive performance of a basket of 20 shares
of Blue Chips from OCDE countries and various economic sectors Societe Generale 1 092 300.00 964 994.80
Pay EURIBOR 3 Months plus 0.51%
EUR 4 600 000 16/07/2024
Receive part of the positive performance of a basket of 20 shares
of Blue Chips from OCDE countries and various economic sectors JP Morgan 810 000.00 699 711.57
Pay EURIBOR 3 Months plus 0.52% 1 902 300.00 1 664 706.37
(LF) Special Purpose Best Performers V Fund
Currency NominalMaturity
DateFinancial Swaps Contracts Desription Counterparty Collateral (cash) Unrealised gain EUR
EUR 14 745 000 18/12/2024
Receive part of the positive performance of a basket of 20 shares
of Blue Chips from OCDE countries and various economic sectors Societe Generale 1 555 600.00 1 192 870.50
Pay EURIBOR 3 Months plus 0.91%
EUR 6 800 000 18/12/2024
Receive part of the positive performance of a basket of 20 shares
of Blue Chips from OCDE countries and various economic sectors JP Morgan 800 000.00 622 808.60
Pay EURIBOR 3 Months plus 0.95% 2 355 600.00 1 815 679.10
(LF) Special Purpose Best Performers VI Fund
Currency NominalMaturity
DateFinancial Swaps Contracts Desription Counterparty Collateral (cash) Unrealised gain EUR
EUR 11 500 000 06/05/2025
Receive part of the positive performance of a basket of 20 shares
of Blue Chips from OCDE countries and various economic sectors Societe Generale 833 800.00 491 050.00
Pay EURIBOR 3 Months plus 0.95%
EUR 7 900 000 06/05/2025
Receive part of the positive performance of a basket of 20 shares
of Blue Chips from OCDE countries and various economic sectors JP Morgan 630 000.00 420 612.12
Pay EURIBOR 3 Months plus 0.95% 1 463 800.00 911 662.12
(LF) Special Purpose Step Up Formula (RON) Fund
Currency NominalMaturity
DateFinancial Swaps Contracts Desription Counterparty Collateral (cash) Unrealised gain RON
EUR 15 870 000 26/06/2018 Receive part of the positive performance of Equity Index Eurostoxx 50 Societe Generale 728 368.00 833 175.00
Pay ENA * 0.07% 728 368.00 833 175.00
75

Notes to the financial statements
As at June 30, 2017 (continued)
76
8. Merger
The Board of Directors of the Management Company has decided to merge by contribution of all
assets and liabilities:
o with effect on March 29, 2017:
- (LF) Special Purpose All Weather Plus Fund into (LF) Income Plus € Fund
o with effect on June 14, 2017:
- (LF) Special Purpose 7.5% Equity Formula (RON) into (LF) Balanced-Active Fund (RON)
These mergers are aiming at rationalizing the existing range of products and creating scope for
investment efficiencies.
9. Distribution
The Board of Directors resolved to proceed to a dividend distribution for:
- (LF) Greek Corporate Bond Fund - Private Banking DIS the amount of 0.1464€/unit. The
dividend of EUR 35 899.23 has been deducted from the Net Asset Value of March 31, 2017 and
has been paid on April 5, 2017
- (LF) Greek Corporate Bond Fund - Private Banking DIS the amount of 0.1454€/unit. The
dividend of EUR 55 357.93 has been deducted from the Net Asset Value of June 30, 2017 and
will be paid on July 5, 2017
- (LF) Greek Government Bond Fund - Private Banking DIS the amount of 0.2244€/unit. The
dividend of EUR 20 210.27 has been deducted from the Net Asset Value of March 31, 2017 and
has been paid on April 5, 2017
- (LF) Greek Government Bond Fund - Private Banking DIS the amount of 0.2270€/unit. The
dividend of EUR 27 612.03 has been deducted from the Net Asset Value of June 30, 2017 and
will be paid on July 5, 2017