lf gresham house equity funds€¦ · 31/12/2019 · lf gresham house equity funds | annual report...
TRANSCRIPT

Part of Link Group
LF Gresham House Equity FundsLF Gresham House UK Multi Cap Income Fund LF Gresham House UK Smaller Companies Fund
ANNUAL REPORT AND FINANCIAL STATEMENTS FOR THE YEAR ENDED 31 DECEMBER 2019
LF Gresham House Equity Funds | Annual Report 2019
Page B
AUTHORISED CORPORATE DIRECTOR (‘ACD’)
LINK FUND SOLUTIONS LIMITEDHead Office: 6th Floor65 Gresham Street London EC2V 7NQTelephone: 0870 607 2555 Fax: 0870 607 2550Email: [email protected](Authorised and regulated by the Financial Conduct Authority)
DIRECTORS OF THE ACD
C. AddenbrookeN. BoylingB. HammondP. Hugh-Smith (resigned 30 June 2019)K.J. MidlA.J. Stenning (appointed 17 October 2019)A.J. Stuart
INVESTMENT MANAGER
GRESHAM HOUSE ASSET MANAGEMENT LIMITED5 New Street SquareLondon EC4A 3TW(Authorised and regulated bythe Financial Conduct Authority)
DEPOSITARY
THE BANK OF NEW YORK MELLON (INTERNATIONAL) LIMITEDOne Canada SquareLondon E14 5AL(Authorised by the Prudential Regulation Authority and regulated by the Financial Conduct Authority and Prudential Regulation Authority)
REGISTRAR
LINK FUND ADMINISTRATORS LIMITEDCustomer Service Centre:Central Square29 Wellington StreetLeeds LS1 4DLTelephone: 0345 922 0044Fax: 0113 224 6001(Authorised and regulated by the Financial Conduct Authority)
INDEPENDENT AUDITOR
KPMG LLP1 Sovereign SquareSovereign StreetLeeds LS1 4DA(Chartered Accountants)
LF Gresham House Equity Funds | Annual Report 2019
Page 1
CONTENTS
ACD’s Report . . . . . . . . . . . . . . . . . . . . . . . . . . . . . . 4
Authorised Status . . . . . . . . . . . . . . . . . . . . . . . . . . . 4
ACD’s Statement . . . . . . . . . . . . . . . . . . . . . . . . . . . 4
Important Information . . . . . . . . . . . . . . . . . . . . . . . . . 4
Cross Holdings . . . . . . . . . . . . . . . . . . . . . . . . . . . . 4
Remuneration Policy. . . . . . . . . . . . . . . . . . . . . . . . . . 4
Securities Financing Transactions . . . . . . . . . . . . . . . . . . . 6
Value Assessment . . . . . . . . . . . . . . . . . . . . . . . . . . . 6
Director’s Statement . . . . . . . . . . . . . . . . . . . . . . . . . . . 7
Statement of ACD’s Responsibilities . . . . . . . . . . . . . . . . . . . 8
Statement of Depositary’s Responsibilities . . . . . . . . . . . . . . . . 9
Report of the Depositary . . . . . . . . . . . . . . . . . . . . . . . . . 9
Independent Auditor’s Report to the Shareholders of LF Gresham House Equity Funds . . . . . . . . . . . . . . . . . 10
Accounting and Distribution Policies . . . . . . . . . . . . . . . . . . 13

LF Gresham House Equity Funds | Annual Report 2019
Page 2
CONTENTS continued
LF GRESHAM HOUSE UK MULTI CAP INCOME FUNDACD’s Report . . . . . . . . . . . . . . . . . . . . . . . . . . . . . 16
Important Information . . . . . . . . . . . . . . . . . . . . . . . . 16
Investment Objective and Policy . . . . . . . . . . . . . . . . . . . 16
Benchmark . . . . . . . . . . . . . . . . . . . . . . . . . . . . . 16
Investment Manager’s Report . . . . . . . . . . . . . . . . . . . . 17
Fund Information . . . . . . . . . . . . . . . . . . . . . . . . . . 20
Portfolio Statement . . . . . . . . . . . . . . . . . . . . . . . . . 26
Summary of Material Portfolio Changes . . . . . . . . . . . . . . . 31
FINANCIAL STATEMENTSStatement of Total Return . . . . . . . . . . . . . . . . . . . . . . 32
Statement of Change in Net Assets Attributable to Shareholders . . . 32
Balance Sheet. . . . . . . . . . . . . . . . . . . . . . . . . . . . 33
Notes to the Financial Statements . . . . . . . . . . . . . . . . . . 34
Distribution Table . . . . . . . . . . . . . . . . . . . . . . . . . . 44
LF Gresham House Equity Funds | Annual Report 2019
Page 3
CONTENTS continued
LF GRESHAM HOUSE UK SMALLER COMPANIES FUNDACD’s Report . . . . . . . . . . . . . . . . . . . . . . . . . . . . . 47
Important Information . . . . . . . . . . . . . . . . . . . . . . . . 47
Investment Objective and Policy . . . . . . . . . . . . . . . . . . . 47
Benchmark . . . . . . . . . . . . . . . . . . . . . . . . . . . . . 47
Investment Manager’s Report . . . . . . . . . . . . . . . . . . . . 48
Fund Information . . . . . . . . . . . . . . . . . . . . . . . . . . 51
Portfolio Statement . . . . . . . . . . . . . . . . . . . . . . . . . 55
Summary of Material Portfolio Changes . . . . . . . . . . . . . . . 59
FINANCIAL STATEMENTSStatement of Total Return . . . . . . . . . . . . . . . . . . . . . . 60
Statement of Change in Net Assets Attributable to Shareholders . . . 60
Balance Sheet. . . . . . . . . . . . . . . . . . . . . . . . . . . . 61
Notes to the Financial Statements . . . . . . . . . . . . . . . . . . 62
Distribution Table . . . . . . . . . . . . . . . . . . . . . . . . . . 71
General Information . . . . . . . . . . . . . . . . . . . . . . . . . . 72
LF Gresham House Equity Funds | Annual Report 2019
Page 4
ACD’S REPORTfor the year ended 31 December 2019
Authorised StatusLF Gresham House Equity Funds (‘the Company’) is an investment company with variable capital incorporated in England and Wales under registered number IC001084 and authorised by the Financial Conduct Authority (‘FCA’) with effect from 18 April 2017. The Company has an unlimited duration.
The Company is a UCITS scheme and the base of the currency of the Company and each sub-fund is pounds sterling.
Shareholders are not liable for the debts of the Company. Shareholders are not liable to make any further payment to the Company after they have paid the price on purchase of the shares.
ACD’s Statement
COVID-19 The outbreak of COVID-19, declared by the World Health Organisation as a pandemic on 11 March 2020, caused significant disruption to business and economic activity which was reflected in the fluctuations seen in the global stock markets. In the short time since its emergence the ramifications of COVID-19 and its long term impacts are now being fully recognised, as various national governments continue to provide financial support and stimulus to their economies. In the immediate aftermath of the global recognition of the seriousness of the pandemic there were sharp declines in asset prices and whilst there has been an element of recovery since then, there is now the unknown factor of the most dramatic global recession seen in living memory and how this will translate into future asset pricing. This combined with the fear, in many countries, of a second wave of COVID-19 would indicate that an extended period of instability will exist for some time as governments, society and business seek to understand how COVID-19 can be managed until such time there is a means of immunising the population.
Important InformationOn 1 February 2019, a new sub-fund, the LF Gresham House UK Smaller Companies Fund, was launched. Further details on this sub-fund are available in the latest scheme Prospectus.
Cross HoldingsNo sub-funds had holdings in any other sub-fund of the Company at the end of the year.
Remuneration PolicyLink Fund Solutions Limited (‘LFSL’) is committed to ensuring that its remuneration policies and practices are consistent with, and promote, sound and effective risk management. LFSL’s remuneration policy is designed to ensure that excessive risk taking is not encouraged by or within LFSL including in respect of the risk profile of the funds it operates, to manage the potential for conflicts of interest in relation to remuneration (having regard, inter alia, to its formal conflicts of interest policy) and to enable LFSL to achieve and maintain a sound capital base.
LFSL acts as the operator of both UCITS funds and AIFs.

LF Gresham House Equity Funds | Annual Report 2019
Page 5
Remuneration Policy continued
LFSL delegates portfolio management for the funds to various investment management firms. The portfolio managers’ fees and expense for providing investment management services are paid by the ACD out of its own remuneration under the ACD agreement. The investment management firms make information on remuneration publicly available in accordance with the disclosure requirements of Pillar 3 of the Capital Requirements Directive. This disclosure is in respect of LFSL activities (including activities performed by its sister company Link Fund Administrators Limited (LFAL) or by employees of that entity), and excludes activities undertaken by third party investment management firms. LFSL staff do not perform duties in respect of particular funds, nor are they remunerated by reference to the performance of any individual fund. Accordingly, the information below is for LFSL as a whole. No attempt has been made to attribute remuneration to the Company itself.
Information on LFSL’s remuneration arrangements is collated annually, as part of its statutory accounts preparation processes. Accordingly, the information disclosed relates to the year ended 30 June 2019, being the most recent accounting period which accounts have been prepared for LFSL prior to the production of these accounts. As at 30 June 2019, LFSL operated 98 UCITS and 81 AIFs, whose respective assets under management (‘AuM’) were £38,284 million and £34,426 million. The Company was valued at £44 million as at that date and represented 0.06% of LFSL’s total AuM and 0.11% of its UCITS AuM.
The disclosure below represents that required under COLL 4.5.7R (7) for funds subject to UCITS obligations.
2019Number of
beneficiariesFixed£’000
Variable£’000
Total£’000
Total amount of remuneration paid by LFSL for the financial year to 30 June 2019 163 7,503 682 8,185
Total amount of remuneration paid to members of staff whose activities have a material impact on the risk profile of the funds for the financial year to 30 June 2019
Senior management (including all Board members) 6 740 310 1,050Staff engaged in control functions 4 411 35 446Risk takers and other identified staff 16 1,378 122 1,500Any employees receiving total remuneration that
takes them into the same remuneration bracket as senior management and risk takers – – – –
Net assets
LFSL’s remuneration arrangement include fixed salaries, contributory pension arrangements and certain other benefits, and the potential for discretionary bonuses. The amount available for payment of discretionary bonuses is dependent on satisfactory performance by LFSL as a whole, rather than the performance of any individual fund. Subject to satisfactory LFSL performance, bonuses may then be paid to staff to reflect their contribution to LFSL’s success. The precise metrics used will vary by function, but consideration is given to both qualitative and quantitative measures.
ACD’S REPORT continued

LF Gresham House Equity Funds | Annual Report 2019
Page 6
Remuneration Policy continued
None of LFSL’s staff receives remuneration based on the performance of any individual fund.
Further details can be found at:www.linkfundsolutions.co.uk/assets/media/LFS_Explanation_of_Compliance_with_Remuneration_Code.pdf.
Securities Financing TransactionsThe Company has the ability to utilise Securities Financing Transactions (being transactions such as lending or borrowing of securities, repurchase or reverse repurchase transactions, buy-sell back or sell-buy back transactions, or margin lending transactions). No such transactions have been undertaken in the year covered by this report.
Value AssessmentIn accordance with current Financial Conduct Authority rules, the ACD is required to carry out an annual assessment on whether the Company provides value to investors. The outcome of this assessment will be published on the ACD’s website no later than 4 months from the record date of 31 December 2019.
LINK FUND SOLUTIONS LIMITEDACD of LF Gresham House Equity Funds29 June 2020
ACD’S REPORT continued
LF Gresham House Equity Funds | Annual Report 2019
Page 7
DIRECTOR’S STATEMENT
This report has been prepared in accordance with the requirements of the Collective Investment Schemes Sourcebook as issued and amended by the Financial Conduct Authority.
N. BOYLING
LINK FUND SOLUTIONS LIMITEDACD of LF Gresham House Equity Funds29 June 2020
LF Gresham House Equity Funds | Annual Report 2019
Page 8
The Collective Investment Schemes Sourcebook published by the Financial Conduct Authority (‘the COLL Sourcebook’) requires the ACD to prepare financial statements for each annual accounting year which give a true and fair view of the financial position of the Company, comprising each of its sub-funds, and of the net revenue/expense and net capital gains/losses on the property of the Company’s sub-funds for the year.
In preparing the financial statements the ACD is responsible for:
• selecting suitable accounting policies and then applying them consistently;
• making judgements and estimates that are reasonable and prudent;
• following UK accounting standards, including FRS 102 The Financial Reporting Standard applicable in the UK and Republic of Ireland;
• complying with the disclosure requirements of the Statement of Recommended Practice for UK Authorised Funds issued by the Investment Association in May 2014;
• keeping proper accounting records which enable it to demonstrate that the financial statements as prepared comply with the above requirements;
• assessing the Company and its sub-funds’ ability to continue as a going concern, disclosing, as applicable, matters related to going concern;
• using the going concern basis of accounting unless they either intend to liquidate the Company or its sub-funds or to cease operations, or have no realistic alternative but to do so;
• such internal control as they determine is necessary to enable the preparation of financial statements that are free from material misstatement, whether due to fraud or error; and
• taking reasonable steps for the prevention and detection of fraud and irregularities.
The ACD is responsible for the management of the Company in accordance with its Instrument of Incorporation, the Prospectus and the COLL Sourcebook.
STATEMENT OF ACD’S RESPONSIBILITIES
LF Gresham House Equity Funds | Annual Report 2019
Page 9
The Depositary must ensure that the Company is managed in accordance with the Financial Conduct Authority’s Collective Investment Schemes Sourcebook, the Open-Ended Investment Companies Regulations 2001 (SI 2001/1228), as amended, the Financial Services and Markets Act 2000, as amended, (together ‘the Regulations’), the Company’s Instrument of Incorporation and Prospectus (together ‘the Scheme documents’) as detailed below.
The Depositary must in the context of its role act honestly, fairly, professionally, independently and in the interests of the Company and its investors.
The Depositary is responsible for the safekeeping of all custodial assets and maintaining a record of all other assets of the Company in accordance with the Regulations.
The Depositary must ensure that:
• the Company’s cash flows are properly monitored and that cash of the Company is booked into the cash accounts in accordance with the Regulations;
• the sale, issue, repurchase, redemption and cancellation of shares are carried out in accordance with the Regulations;
• the value of shares of the Company are calculated in accordance with the Regulations;
• any consideration relating to transactions in the Company’s assets is remitted to the Company within the usual time limits;
• the Company’s income is applied in accordance with the Regulations; and
• the instructions of the ACD, which is the UCITS Management Company, are carried out (unless they conflict with the Regulations).
The Depositary also has a duty to take reasonable care to ensure that the Company is managed in accordance with the Regulations and the Scheme documents in relation to the investment and borrowing powers applicable to the Company.
REPORT OF THE DEPOSITARYHaving carried out such procedures as we consider necessary to discharge our responsibilities as Depositary of the Company, it is our opinion, based on the information available to us and the explanations provided, that in all material respects the Company, acting through the ACD:
(i) has carried out the issue, sale, redemption and cancellation, and calculation of the price of the Company’s shares and the application of the Company’s revenue in accordance with the Regulations and the Scheme documents of the Company; and
(ii) has observed the investment and borrowing powers and restrictions applicable to the Company.
THE BANK OF NEW YORK MELLON (INTERNATIONAL) LIMITEDDepositary of LF Gresham House Equity Funds29 June 2020
STATEMENT OF DEPOSITARY’S RESPONSIBILITIES
LF Gresham House Equity Funds | Annual Report 2019
Page 10
INDEPENDENT AUDITOR’S REPORT TO THE SHAREHOLDERS OF LF GRESHAM HOUSE EQUITY FUNDS
OpinionWe have audited the financial statements of LF Gresham House Equity Funds (‘the Company’) for the year ended 31 December 2019 which comprise the Statement of Total Return, the Statement of Change in Net Assets Attributable to Shareholders, the Balance Sheet, the Related Notes and Distribution Table for each of the Company’s sub-funds listed on pages 2 and 3 and the accounting policies set out on pages 13 to 15.
In our opinion the financial statements:
• give a true and fair view, in accordance with UK accounting standards, including FRS 102 The Financial Reporting Standard applicable in the UK and Republic of Ireland, of the financial position of each of the sub-funds as at 31 December 2019 and of the net revenue and the net capital gains on the property of each of the sub-funds for the year then ended; and
• have been properly prepared in accordance with the Instrument of Incorporation, the Statement of Recommended Practice relating to Authorised Funds, and the COLL Rules.
Basis for OpinionWe conducted our audit in accordance with International Standards on Auditing (UK) (“ISAs (UK)”) and applicable law. Our responsibilities are described below. We have fulfilled our ethical responsibilities under, and are independent of the Company in accordance with, UK ethical requirements including the FRC Ethical Standard.
We have received all the information and explanations which we consider necessary for the purposes of our audit and we believe that the audit evidence we have obtained is a sufficient and appropriate basis for our opinion.
Going ConcernThe Authorised Corporate Director has prepared the financial statements on the going concern basis as they do not intend to liquidate the Company or its sub-funds or to cease their operations, and as they have concluded that the Company and its sub-funds’ financial position means that this is realistic. They have also concluded that there are no material uncertainties that could have cast significant doubt over their ability to continue as a going concern for at least a year from the date of approval of the financial statements (“the going concern period”).
We are required to report to you if we have concluded that the use of the going concern basis of accounting is inappropriate or there is an undisclosed material uncertainty that may cast significant doubt over the use of that basis for a period of at least a year from the date of approval of the financial statements. In our evaluation of the Authorised Corporate Director’s conclusions, we considered the inherent risks to the Company and its sub-funds’ business model and analysed how those risks might affect the Company’s and its sub-funds’ financial resources or ability to continue operations over the going concern period. We have nothing to report in these respects.
LF Gresham House Equity Funds | Annual Report 2019
Page 11
However, as we cannot predict all future events or conditions and as subsequent events may result in outcomes that are inconsistent with judgements that were reasonable at the time they were made, the absence of reference to a material uncertainty in this auditor’s report is not a guarantee that the Company or its sub-funds will continue in operation.
Other InformationThe Authorised Corporate Director is responsible for the other information, presented in the Annual Report together with the financial statements. Our opinion on the financial statements does not cover the other information and, accordingly, we do not express an audit opinion or, except as explicitly stated below, any form of assurance conclusion thereon.
Our responsibility is to read the other information and, in doing so, consider whether, based on our financial statements audit work, the information therein is materially misstated or inconsistent with the financial statements or our audit knowledge. Based solely on that work:
• we have not identified material misstatements in the other information; and
• in our opinion the information given in the Authorised Corporate Director’s Report for the financial year is consistent with the financial statements.
Matters on Which We Are Required to Report by ExceptionWe have nothing to report in respect of the following matters where under the COLL Rules we are required to report to you if, in our opinion:
• proper accounting records for the Company have not been kept; or
• the financial statements are not in agreement with the accounting records.
Authorised Corporate Director’s (Link Fund Solutions Limited) ResponsibilitiesAs explained more fully in their statement set out on page 8 the Authorised Corporate Director is responsible for: the preparation of financial statements which give a true and fair view; such internal control as they determine is necessary to enable the preparation of financial statements that are free from material misstatement, whether due to fraud or error; assessing the Company and its sub-funds’ ability to continue as a going concern, disclosing, as applicable, matters related to going concern; and using the going concern basis of accounting unless they either intend to liquidate the Company or its sub-funds or to cease operations, or have no realistic alternative but to do so.
INDEPENDENT AUDITOR’S REPORT TO THE SHAREHOLDERS OF LF GRESHAM HOUSE EQUITY FUNDS continued

LF Gresham House Equity Funds | Annual Report 2019
Page 12
Auditor’s ResponsibilitiesOur objectives are to obtain reasonable assurance about whether the financial statements as a whole are free from material misstatement, whether due to fraud or error, and to issue our opinion in an auditor’s report. Reasonable assurance is a high level of assurance, but does not guarantee that an audit conducted in accordance with ISAs (UK) will always detect a material misstatement when it exists. Misstatements can arise from fraud or error and are considered material if, individually or in aggregate, they could reasonably be expected to influence the economic decisions of users taken on the basis of the financial statements.
A fuller description of our responsibilities is provided on the FRC’s website at www.frc.org.uk/auditorsresponsibilities.
The Purpose of Our Audit Work and to Whom We Owe Our ResponsibilitiesThis report is made solely to the Company’s shareholders, as a body, in accordance with Rule 4.5.12 of the Collective Investment Schemes sourcebook (‘the COLL Rules’) issued by the Financial Conduct Authority under the Open-Ended Investment Companies Regulations 2001. Our audit work has been undertaken so that we might state to the Company’s shareholders those matters we are required to state to them in an auditor’s report and for no other purpose. To the fullest extent permitted by law, we do not accept or assume responsibility to anyone other than the Company and the Company’s shareholders as a body, for our audit work, for this report, or for the opinions we have formed.
ALAIN DE BRAEKELEER FOR AND ON BEHALF OF KPMG LLP, STATUTORY AUDITORChartered Accountants1 Sovereign SquareSovereign StreetLeedsLS1 4DA29 June 2020
INDEPENDENT AUDITOR’S REPORT TO THE SHAREHOLDERS OF LF GRESHAM HOUSE EQUITY FUNDS continued

LF Gresham House Equity Funds | Annual Report 2019
Page 13
ACCOUNTING AND DISTRIBUTION POLICIESfor the year ended 31 December 2019
1. Accounting Policies
The principal accounting policies, which have been applied to the financial statements of the sub-funds in both the current and prior year, are set out below. These have been applied consistently across all sub-funds unless otherwise stated in the Notes to the Financial Statements of each sub-fund.
(A) BASIS OF ACCOUNTING
The financial statements of each sub-fund have been prepared under the historical cost basis, as modified by the revaluation of investments and in accordance with FRS 102 The Financial Reporting Standard applicable in the UK and Republic of Ireland. The financial statements have been prepared in accordance with the Statement of Recommended Practice (‘SORP’) for Financial Statements of UK Authorised Funds issued by the Investment Association (‘IA’) in May 2014, as amended.
These financial statements are prepared on a going concern basis. The ACD has made an assessment of each of the sub-fund’s ability to continue as a going concern, and is satisfied they have the resources to continue in business for the foreseeable future and is not aware of any material uncertainties that may cast significant doubt on this assessment. This assessment is made as at the date of issue of these financial statements and considers liquidity, declines in global capital markets, known redemption levels, expense projections, key service provider’s operational resilience, and the impact of COVID-19.
(B) RECOGNITION OF REVENUE
Dividends on quoted equities are recognised when the securities are quoted ex-dividend.
Revenue from unquoted equity investments is recognised when the dividend is declared.
Revenue on debt securities is accounted for on an effective yield basis.
Interest on bank and other cash deposits is recognised on an accruals basis.
Revenue is recognised gross of any withholding taxes but excludes attributable tax credits.
(C) TREATMENT OF EXPENSES
All expenses, except for those relating to the purchase and sale of investments, are charged initially against revenue.
(D) ALLOCATION OF REVENUE AND EXPENSES TO MULTIPLE SHARE CLASSES AND SUB-FUNDS
Any revenue or expense not directly attributable to a particular share class or sub-fund will normally be allocated pro-rata to the net assets of the relevant share classes and sub-funds, unless a different allocation method is deemed more appropriate by the ACD.
All share classes are ranked pari passu and have no particular rights or terms attached, including rights on winding up.
LF Gresham House Equity Funds | Annual Report 2019
Page 14
(E) TAXATION
Corporation tax is provided at 20% on taxable revenue, after deduction of allowable expenses.
Where overseas tax has been deducted from overseas revenue that tax can, in some instances, be set off against the corporation tax payable by way of double tax relief and where this is the case the offset is reflected in the tax charge.
Deferred tax is provided using the liability method on all timing differences arising on the treatment of certain items for taxation and accounting purposes, calculated at the rate at which it is anticipated the timing differences will reverse. Deferred tax assets are recognised only when, on the basis of available evidence, it is more likely than not that there will be taxable profits in the future against which the deferred tax asset can be offset.
(F) BASIS OF VALUATION OF INVESTMENTS
All investments are valued at their fair value as at close of business on the last business day of the financial year.
Quoted investments are valued at fair value which generally is the bid price, excluding any accrued interest in the case of debt securities. Accrued interest on debt securities is included in revenue.
For investments for which there is no quoted price or for which the quoted price is unreliable, fair value is determined by the ACD, taking into account, where appropriate, latest dealing prices, valuations from reliable sources, financial performance, maturity of the company and other relevant factors.
(G) EXCHANGE RATES
The base and functional currency of the sub-funds is pounds sterling. Transactions in foreign currencies are recorded in sterling at the rate ruling at the date of the transactions. Assets and liabilities expressed in foreign currencies at the end of the accounting period are translated into sterling at the exchange rate prevailing at close of business on the last business day of the financial year.
(H) DILUTION LEVY
The ACD may require a dilution levy on the purchase and redemption of shares if, in its opinion, the existing shareholders (for purchases) or remaining shareholders (for redemptions) might otherwise be adversely affected. For example, the dilution levy may be charged in the following circumstances: where the scheme property of a sub-fund is in continual decline; on a sub-fund experiencing large levels of net purchases relative to its size; on ‘large deals’ (typically being a purchase or redemption of shares to a size exceeding 5% of the Net Asset Value of the relevant sub-fund); in any case where the ACD is of the opinion that the interests of existing or remaining shareholders require the imposition of a dilution levy.
ACCOUNTING AND DISTRIBUTION POLICIES continued

LF Gresham House Equity Funds | Annual Report 2019
Page 15
ACCOUNTING AND DISTRIBUTION POLICIES continued
(I) DIRECT TRANSACTION COSTS
Direct transaction costs may consist of fees and commissions paid to agents, advisers, brokers and dealers, levies by regulatory agencies and securities exchanges, and transfer taxes and duties. Debt security investments have no separately identifiable transaction costs as they form part of the dealing spread. Direct transaction costs do not include any difference between the quoted bid and offer prices or internal administrative or holding costs. The average portfolio dealing spread disclosed is the difference between the bid and offer prices of investments at the balance sheet date, including the effect of foreign exchange, expressed as a percentage of the value determined by reference to the offer price.
(J) SET UP COSTS
Initial set up costs are written off as they are incurred.
2. Distribution Policies
Surplus revenue after expenses and taxation, as disclosed in the financial statements, after adjustment for items of a capital nature, is distributable to shareholders. Any deficit of revenue is deducted from capital.
Interim distributions may be made at the ACD’s discretion. Final distributions are made in accordance with the COLL Sourcebook.
The ordinary element of stock received in lieu of cash dividends is credited to capital in the first instance followed by a transfer to revenue of the cash equivalent being offered and this forms part of the distributable revenue of the Fund. In the case of an enhanced stock dividend, the value of the enhancement is treated as capital and does not form part of any distribution.
Special dividends are reviewed on a case by case basis in determining whether the dividend is to be treated as revenue or capital. Amounts recognised as revenue will form part of the distributable revenue. Amounts recognised as capital are deducted from the cost of the investment. The tax accounting treatment follows the treatment of the principal amount.
LF Gresham House Equity Funds | Annual Report 2019
Page 16
LF GRESHAM HOUSE UK MULTI CAP INCOME FUNDACD’S REPORTfor the year ended 31 December 2019
Important InformationPlease refer to the Important Information section on page 4.
Investment Objective and PolicyThe investment objective of LF Gresham House UK Multi Cap Income Fund (‘the Fund’) is to deliver a return of income with a potential for capital growth.
The Fund will be invested primarily in small and mid-sized companies and the Fund will also hold larger capitalised companies. Investment will be predominantly in the shares of UK listed companies. The Fund considers UK companies to be those companies which are incorporated in the UK and/or have a significant proportion of their operations in the UK. It may also invest in unlisted UK securities, UK government and/or corporate debt securities, collective investment schemes (no more than 10% of net asset value), money market instruments and cash and cash equivalents.
Derivatives and forward transactions may be used for Efficient Portfolio Management purposes.
BenchmarkThe Fund’s comparator benchmark is the IA UK Equity Income sector.
The Fund’s performance may be compared against the IA UK Equity Income sector. Many funds sold in the UK are grouped into sectors by the Investment Association (the trade body that represents UK investment managers). The comparator benchmark has been selected as we consider it assists investors in evaluating the Fund’s performance against the performance of other funds invested in similar assets.
LINK FUND SOLUTIONS LIMITEDACD of LF Gresham House UK Multi Cap Income Fund29 June 2020

LF Gresham House Equity Funds | Annual Report 2019
Page 17
LF GRESHAM HOUSE UK MULTI CAP INCOME FUNDACD’S REPORT continued
INVESTMENT MANAGER’S REPORTfor the year ended 31 December 2019
Investment StrategyThe LF Gresham House UK Multi Cap Income Fund (the Fund) was launched on 30 June 2017 with a policy of investing primarily in small and mid-cap companies, as well as holding large cap companies, and an objective of delivering a return of income with a potential for capital growth. These companies are predominantly UK listed equities. In annual terms the Fund currently is targeting a high single digit total return.
The Fund’s investment strategy seeks to leverage the Manager’s core expertise in investing in small and mid-sized UK businesses within its key sectors of consumer, TMT, business services and healthcare & education. The Fund focuses on finding profitable, cash generative companies that offer attractive dividends and scope to grow, and employs a disciplined investment process to appraise potential investments. The Fund also looks to benefit from the wider Gresham House platform of research and investment professionals, and network of entrepreneurs, business leaders and industry specialists.
Fund composition aims to reflect the Manager’s high conviction style, comprising a relatively concentrated portfolio of stocks with the potential to sustainably grow profits, cash flow and dividends over the longer term.
Movements in Net Asset ValueDuring the year the gross NAV of the Fund increased from £33.0m to £48.3m, of which 90.1% was invested in UK equities – 88.1% in small and mid-cap and 2.0% in large cap. The NAV increased due to net inflows from share holders amounting to £6.3m, in addition to a positive revaluation of the portfolio of £9.0m. The Fund delivered positive returns of 30.6% over the year (‘C’ Sterling Accumulation class), outperforming the IA UK Equity Income Sector, which returned 20.1%. The Fund generated a dividend yield of 3.74% in the period (‘C’ Sterling Income class), which compared to the FTSE All Share yield of 4.09%.
Investment ActivityDuring the year new investment activity was strong as inflows were deployed into a combination of new positions and follow on investments into portfolio companies, totalling £18m across both. During the year the number of portfolio companies decreased from 47 to 42 due to eleven new investments and sixteen divestments.
The level and quality of equity issuance in the UK small and mid-cap segment remained reasonably robust during most of the year despite an elevated level of geopolitical and economic uncertainty and lingering Brexit concerns created by the UK referendum on membership of the EU. The year was characterised by a recovery in UK equity markets towards the start of the year following the volatility seen in Q4 2018, a weaker middle period and elevated selling pressure in the run up to the UK General Election and a strong rebound in UK equities following the election result.
A key differentiating feature of the Fund’s investment process is its ability to leverage the wider platform and private equity resource of Gresham House and network to evaluate new opportunities. The Manager believes it is strongly positioned amongst UK fund managers to effectively evaluate new companies being admitted to the market through an Initial Public Offering (‘IPO’). Throughout the year the level of IPOs remained subdued

LF Gresham House Equity Funds | Annual Report 2019
Page 18
LF GRESHAM HOUSE UK MULTI CAP INCOME FUNDACD’S REPORT continued
INVESTMENT MANAGER’S REPORT continued
given the uncertainty within the UK political environment. However, the Fund invested £662k in Argentex, an IPO of a provider of corporate foreign exchange services, where the Manager leveraged its sector insight and previous investment experience to drive conviction in the investment case. A further £10.0m was invested into new investments including B&M European Value Retail, a discount retailer operating in the UK, Germany and France; Cello Health, a strategic healthcare research and consulting services provider; Sabre Insurance, a specialist motor insurance provider; Tatton Asset Management, an outsourced discretionary fund management services provider to the IFA sector; and Alpha Financial Markets, a global consultancy business to the asset and wealth management industry. The Fund also deployed £7.3m into 24 existing portfolio companies as follow on investments within the year.
2019 saw a marked increase in corporate activity within the smaller companies arena, which the Manager believes was driven by market sentiment weighing on share prices and widening the valuation discount in the small and micro cap space, as well as the structural attractiveness of this area of the UK equity market. Within the Fund, the Manager saw M&A activity from a range of buyers including trade, private equity and private equity backed trade. There were 16 full exits during the year, highlights of which were Sanderson, following completion of its acquisition by Aptean, realising a 63% return; Tarsus, an international B2B media group, following a recommended takeover offer by Charterhouse Capital Partners, where the Fund crystallised a 54% return; SafeCharge, realising a 51% profit after completion of the acquisition by Nuvei Corporation; and Manx Telecom, following completion of its acquisition by Basalt Infrastructure Partners. Charles Taylor, an insurance support services business, also received a recommended cash offer by private equity firm Lovell Minnick Partners, which completed in January 2020. The Fund made a full divestment of Knights Group, a UK legal services provider, after strong share price performance of 86% compressed the dividend yield to below the Fund’s target level.
Investment PerformancePerformance in the year was strong on an absolute basis with the Fund achieving a total return of 30.6% (based on ‘C’ Sterling Accumulation class), ranking 3rd out of 86 in the IA UK Equity Income Sector.
Key contributors to absolute performance during the year were Games Workshop, following positive results that were ahead of market expectation; SafeCharge, following a recommended acquisition by Nuvei Corporation; and Charles Taylor, following a recommended takeover offer for the company from US private equity firm Lovell Minnick Partners. Detractors were Arena Events, following a profit downgrade; Staffline, after announcing a profit warning in part driven by Brexit uncertainty; and Costain, following a profit downgrade due to project delays and a cancellation. These detractors were fully exited during the year.
OutlookThe Fund continues to seek new monies in order to take advantage of the many opportunities observed within its target universe. In line with the Manager’s style the Fund looks to invest in quality companies with sustainable income streams that offer attractive cash flows with the potential to deliver both dividend and capital growth over the long-term and that may demonstrate resilience during more volatile market conditions.
LF Gresham House Equity Funds | Annual Report 2019
Page 19
LF GRESHAM HOUSE UK MULTI CAP INCOME FUNDACD’S REPORT continued
INVESTMENT MANAGER’S REPORT continued
The Manager’s expectation of increasing market volatility played out during 2019, with macro and geopolitical uncertainty weighing on sentiment resulting in global and UK equity markets seeing notable selling pressure. This filtered through to a decline in IPO activity and an increase in M&A activity as cash-rich buyer groups looked to deploy capital in small and micro-cap businesses offering attractive fundamentals.
The strong market performance in Q4 2019 and an encouraging start to 2020 drew to a sudden halt as the potential ramifications of the international spread of COVID-19 on global economic growth began to impact sentiment. There are significant uncertainties relating to the spread and impact of the pandemic as well as the social and economic response from governments across the world including the UK. The Manager anticipates further periods of market volatility and weaker sentiment during 2020. It will also become clearer as the year progresses which sectors and companies have been fundamentally changed by the current crisis and which businesses will improve their market position and become stronger. There are likely to be some very attractive long-term smaller company investment opportunities that emerge during the year both from market movements and an increasing number of recapitalisation transactions to strengthen otherwise sound businesses.
The Manager continues to believe that over the long term its fundamentals focused investment style has the potential to outperform. The Fund will maintain its focus on building a high conviction portfolio of less cyclical, high-quality, niche growth businesses which the Manager believes can deliver strong returns through the market cycle regardless of the performance of the wider economy.
Note: Investments carry risks. Past performance is not a guide to future performance. Investors may not get back the amount invested.
GRESHAM HOUSE ASSET MANAGEMENT LIMITEDInvestment Manager7 April 2020

LF Gresham House Equity Funds | Annual Report 2019
Page 20
Risk and Reward Profile
This indicator shows how much a fund has risen and fallen in the past, and therefore how much a fund’s returns have varied. It is a measure of a fund’s volatility.As the Fund has less than 5 years’ price history, this calculation incorporates the volatility of an appropriate benchmark index. The higher a fund’s past volatility the higher the number on the scale and the greater the risk that investors in that fund may have made losses as well as gains. The lowest number on the scale does not mean that a fund is risk free.
The Fund has been classed as 4 because its volatility has been measured as average.
This indicator is based on historical data and may not be a reliable indication of the future risk profile of this Fund.
The risk and reward profile shown is not guaranteed to remain the same and may shift over time.
Liquidity Risk: Smaller companies’ securities are often traded less frequently than those of larger companies which means they may be more difficult to buy and sell. Their prices may also be subject to short term swings.
Counterparty Risk: As the Fund may enter into derivative arrangements there is a risk that other parties may fail to meet their obligations. This may lead to delays in receiving amounts due to the Fund, receiving less than is due or receiving nothing.
Concentration Risk: In the early stages of the Fund’s life, the Fund will be invested in a relatively concentrated number of stocks which in certain circumstances could increase the possibility of the Fund being more volatile in this period. As the size of the Fund grows the manager intends to progressively increase the number of holdings thereby reducing concentration risk over time. It is anticipated that the Fund may be concentrated for up to twelve months from launch.
For full details of the Fund’s risks, please see the Prospectus which may be obtained upon application and can be found on the ACD’s website, www.linkfundsolutions.co.uk.
Lower Risk
Typically Higher Rewards
TypicallyLower Rewards
Higher Risk
4
LF GRESHAM HOUSE UK MULTI CAP INCOME FUNDACD’S REPORT continued
FUND INFORMATION

LF Gresham House Equity Funds | Annual Report 2019
Page 21
Comparative Tables
‘C’ STERLING INCOME SHARES
CHANGE IN NET ASSETS PER SHARE31.12.19
pence per share31.12.18
pence per share31.12.171
pence per share
Opening net asset value per share 99.03 106.51 100.00 Return before operating charges* 30.81 (1.36) 8.97 Operating charges (0.98) (1.06) (0.97)Return after operating charges 29.83 (2.42) 8.00 Distributions (4.65) (5.06) (1.49)Closing net asset value per share 124.21 99.03 106.51 * after direct transaction costs of: 0.25 0.81 0.77
PERFORMANCE
Return after charges 30.12% (2.27)% 8.00%
OTHER INFORMATION
Closing net asset value (£’000) 2,162 1,064 37 Closing number of shares 1,740,844 1,073,924 34,563 Operating charges 0.89% 0.97% 1.88%2
Direct transaction costs 0.22% 0.74% 1.49%2
PRICES
Highest share price 126.93 116.85 108.37 Lowest share price 100.39 100.66 99.88
1 From 30 June 2017.2 Annualised figure due to share class launched less than 1 year.
LF GRESHAM HOUSE UK MULTI CAP INCOME FUND ACD’S REPORT continued
FUND INFORMATION continued

LF Gresham House Equity Funds | Annual Report 2019
Page 22
Comparative Tables continued
‘C’ STERLING ACCUMULATION SHARES
CHANGE IN NET ASSETS PER SHARE31.12.19
pence per share31.12.18
pence per share31.12.171
pence per share
Opening net asset value per share 104.96 107.82 100.00 Return before operating charges* 33.24 (1.76) 8.79 Operating charges (1.05) (1.10) (0.97)Return after operating charges 32.19 (2.86) 7.82 Distributions (5.02) (5.20) (1.50)Retained distributions on
accumulation shares 5.02 5.20 1.50 Closing net asset value per share 137.15 104.96 107.82 * after direct transaction costs of: 0.26 0.84 0.77
PERFORMANCE
Return after charges 30.67% (2.65)% 7.82%
OTHER INFORMATION
Closing net asset value (£’000) 4,524 6,298 –Closing number of shares 3,298,620 6,000,232 250 Operating charges 0.89% 0.97% 1.88%2
Direct transaction costs 0.22% 0.74% 1.49%2
PRICES
Highest share price 138.73 119.28 108.80 Lowest share price 106.39 104.85 99.88
1 From 30 June 2017.2 Annualised figure due to share class launched less than 1 year.
LF GRESHAM HOUSE UK MULTI CAP INCOME FUND ACD’S REPORT continued
FUND INFORMATION continued

LF Gresham House Equity Funds | Annual Report 2019
Page 23
Comparative Tables continued
‘F’ STERLING INCOME SHARES
CHANGE IN NET ASSETS PER SHARE31.12.19
pence per share31.12.18
pence per share31.12.171
pence per share
Opening net asset value per share 99.43 106.77 100.00 Return before operating charges* 30.96 (1.37) 9.16 Operating charges (0.82) (0.90) (0.89)Return after operating charges 30.14 (2.27) 8.27 Distributions (4.69) (5.07) (1.50)Closing net asset value per share 124.88 99.43 106.77 * after direct transaction costs of: 0.25 0.81 0.77
PERFORMANCE
Return after charges 30.31% (2.13)% 8.27%
OTHER INFORMATION
Closing net asset value (£’000) 27,906 19,451 961 Closing number of shares 22,345,352 19,563,672 900,250 Operating charges 0.74% 0.82% 1.73%2
Direct transaction costs 0.22% 0.74% 1.49%2
PRICES
Highest share price 127.63 117.23 108.64 Lowest share price 100.80 101.06 99.88
1 From 30 June 2017.2 Annualised figure due to share class launched less than 1 year.
LF GRESHAM HOUSE UK MULTI CAP INCOME FUND ACD’S REPORT continued
FUND INFORMATION continued

LF Gresham House Equity Funds | Annual Report 2019
Page 24
Comparative Tables continued
‘F’ STERLING ACCUMULATION SHARES
CHANGE IN NET ASSETS PER SHARE31.12.19
pence per share31.12.18
pence per share31.12.171
pence per share
Opening net asset value per share 105.45 108.14 100.00 Return before operating charges* 33.44 (1.76) 9.04 Operating charges (0.88) (0.93) (0.90)Return after operating charges 32.56 (2.69) 8.14 Distributions (5.04) (5.22) (1.50)Retained distributions on
accumulation shares 5.04 5.22 1.50 Closing net asset value per share 138.01 105.45 108.14 * after direct transaction costs of: 0.27 0.84 0.77
PERFORMANCE
Return after charges 30.88% (2.49)% 8.14%
OTHER INFORMATION
Closing net asset value (£’000) 12,893 5,632 5,776 Closing number of shares 9,342,275 5,340,855 5,340,855 Operating charges 0.74% 0.82% 1.73%2
Direct transaction costs 0.22% 0.74% 1.49%2
PRICES
Highest share price 139.60 119.75 109.12 Lowest share price 106.89 105.21 99.87
1 From 30 June 2017.2 Annualised figure due to share class launched less than 1 year.
LF GRESHAM HOUSE UK MULTI CAP INCOME FUND ACD’S REPORT continued
FUND INFORMATION continued

LF Gresham House Equity Funds | Annual Report 2019
Page 25
Fund Performance to 31 December 2019 (%)
1 year Since launch1
LF Gresham House UK Multi Cap Income Fund 30.61 38.73
1 Fund launched 30 June 2017.
The performance of the Fund is based on the published price per ‘C’ Sterling Accumulation share which includes reinvested income.
The performance of the Fund disclosed in the above table may differ from the ‘Return after charges’ disclosed in the Comparative Table due to the above performance being calculated on the latest published price prior to the year end, rather than the year end return after operating charges.
Details of the distributions per share for the year are shown in the Distribution Table on pages 44 to 46.
RISK WARNINGAn investment in an open-ended investment company should be regarded as a medium to long term investment. Investors should be aware that the price of shares and the income from them can fall as well as rise and investors may not receive back the full amount invested. Past performance is not a guide to future performance. Investments denominated in currencies other than the base currency are subject to fluctuation in exchange rates, which can be favourable or unfavourable.
LF GRESHAM HOUSE UK MULTI CAP INCOME FUND ACD’S REPORT continued
FUND INFORMATION continued
LF Gresham House Equity Funds | Annual Report 2019
Page 26
Holding Portfolio of InvestmentsValue£’000
31.12.19 %
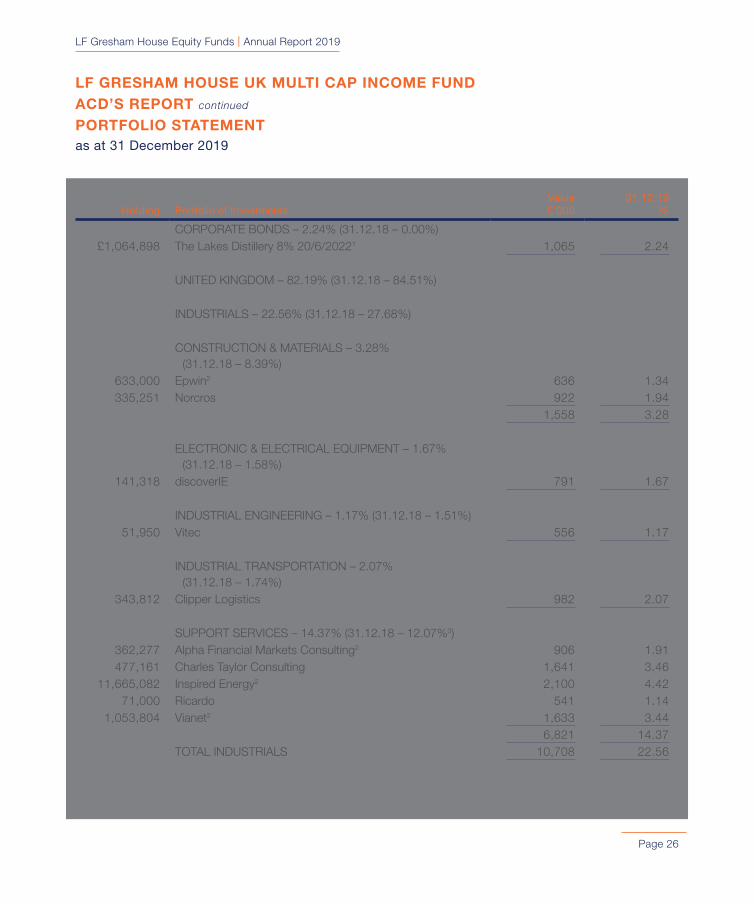
CORPORATE BONDS – 2.24% (31.12.18 – 0.00%) £1,064,898 The Lakes Distillery 8% 20/6/20221 1,065 2.24
UNITED KINGDOM – 82.19% (31.12.18 – 84.51%)
INDUSTRIALS – 22.56% (31.12.18 – 27.68%)
CONSTRUCTION & MATERIALS – 3.28% (31.12.18 – 8.39%)
633,000 Epwin2 636 1.34335,251 Norcros 922 1.94
1,558 3.28
ELECTRONIC & ELECTRICAL EQUIPMENT – 1.67% (31.12.18 – 1.58%)
141,318 discoverIE 791 1.67
INDUSTRIAL ENGINEERING – 1.17% (31.12.18 – 1.51%) 51,950 Vitec 556 1.17
INDUSTRIAL TRANSPORTATION – 2.07% (31.12.18 – 1.74%)
343,812 Clipper Logistics 982 2.07
SUPPORT SERVICES – 14.37% (31.12.18 – 12.07%3) 362,277 Alpha Financial Markets Consulting2 906 1.91 477,161 Charles Taylor Consulting 1,641 3.46
11,665,082 Inspired Energy2 2,100 4.42 71,000 Ricardo 541 1.14
1,053,804 Vianet2 1,633 3.44 6,821 14.37
TOTAL INDUSTRIALS 10,708 22.56
LF GRESHAM HOUSE UK MULTI CAP INCOME FUND ACD’S REPORT continued
PORTFOLIO STATEMENTas at 31 December 2019

LF Gresham House Equity Funds | Annual Report 2019
Page 27
Holding Portfolio of InvestmentsValue£’000
31.12.19 %
CONSUMER GOODS – 7.42% (31.12.18 – 7.84%)
FOOD PRODUCERS – 1.87% (31.12.18 – 1.61%) 906,893 Finsbury Food2 889 1.87
HOUSEHOLD GOODS & HOME CONSTRUCTION – 2.32% (31.12.18 – 3.44%)
454,033 Watkin Jones2 1,101 2.32
LEISURE GOODS – 3.23% (31.12.18 – 2.79%) 25,076 Games Workshop 1,531 3.23
TOTAL CONSUMER GOODS 3,521 7.42
CONSUMER SERVICES – 17.43% (31.12.18 – 18.08%)
GENERAL RETAILERS – 2.52% (31.12.18 – 0.00%) 292,000 B&M European Value Retail 1,196 2.52
MEDIA – 8.68% (31.12.18 – 11.31%3) 30,000 4imprint 1,044 2.20
531,000 Bloomsbury Publishing 1,540 3.24 103,435 Next Fifteen Communications2 544 1.15 404,183 Wilmington 994 2.09
4,122 8.68
TRAVEL & LEISURE – 6.23% (31.12.18 – 6.77%3)312,878 Domino’s Pizza 1,001 2.11 654,530 TEN Entertainment 1,957 4.12
2,958 6.23TOTAL CONSUMER SERVICES 8,276 17.43
LF GRESHAM HOUSE UK MULTI CAP INCOME FUND ACD’S REPORT continued
PORTFOLIO STATEMENT continued
as at 31 December 2019
LF Gresham House Equity Funds | Annual Report 2019
Page 28
Holding Portfolio of InvestmentsValue£’000
31.12.19 %
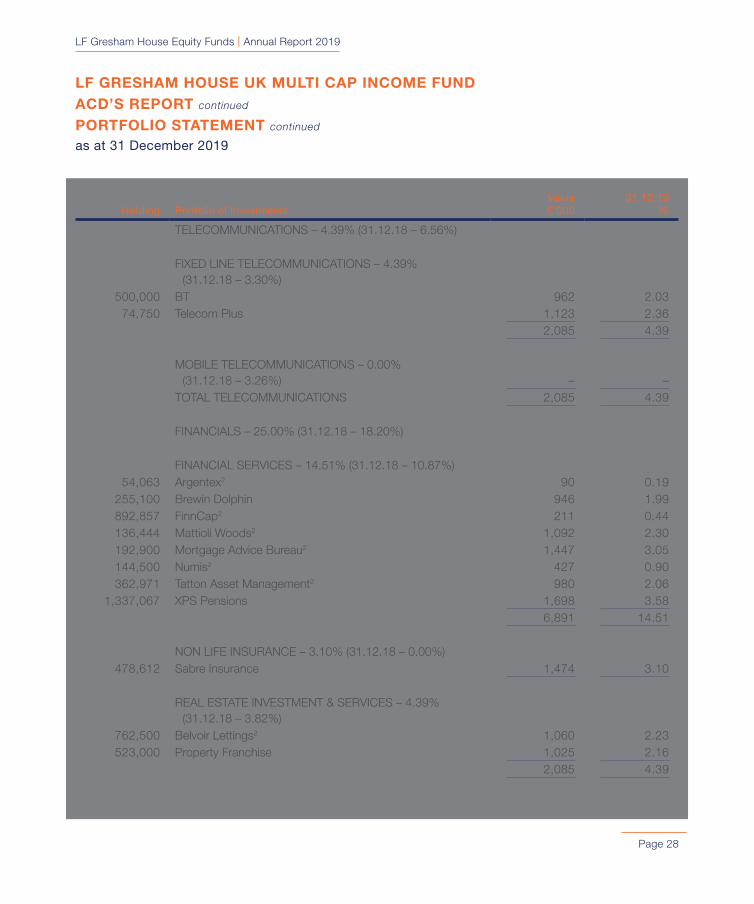
TELECOMMUNICATIONS – 4.39% (31.12.18 – 6.56%)
FIXED LINE TELECOMMUNICATIONS – 4.39% (31.12.18 – 3.30%)
500,000 BT 962 2.03 74,750 Telecom Plus 1,123 2.36
2,085 4.39
MOBILE TELECOMMUNICATIONS – 0.00% (31.12.18 – 3.26%) – –
TOTAL TELECOMMUNICATIONS 2,085 4.39
FINANCIALS – 25.00% (31.12.18 – 18.20%)
FINANCIAL SERVICES – 14.51% (31.12.18 – 10.87%) 54,063 Argentex2 90 0.19
255,100 Brewin Dolphin 946 1.99 892,857 FinnCap2 211 0.44 136,444 Mattioli Woods2 1,092 2.30 192,900 Mortgage Advice Bureau2 1,447 3.05 144,500 Numis2 427 0.90 362,971 Tatton Asset Management2 980 2.06
1,337,067 XPS Pensions 1,698 3.58 6,891 14.51
NON LIFE INSURANCE – 3.10% (31.12.18 – 0.00%) 478,612 Sabre Insurance 1,474 3.10
REAL ESTATE INVESTMENT & SERVICES – 4.39% (31.12.18 – 3.82%)
762,500 Belvoir Lettings2 1,060 2.23523,000 Property Franchise 1,025 2.16
2,085 4.39
LF GRESHAM HOUSE UK MULTI CAP INCOME FUND ACD’S REPORT continued
PORTFOLIO STATEMENT continued
as at 31 December 2019
LF Gresham House Equity Funds | Annual Report 2019
Page 29
Holding Portfolio of InvestmentsValue£’000
31.12.19 %
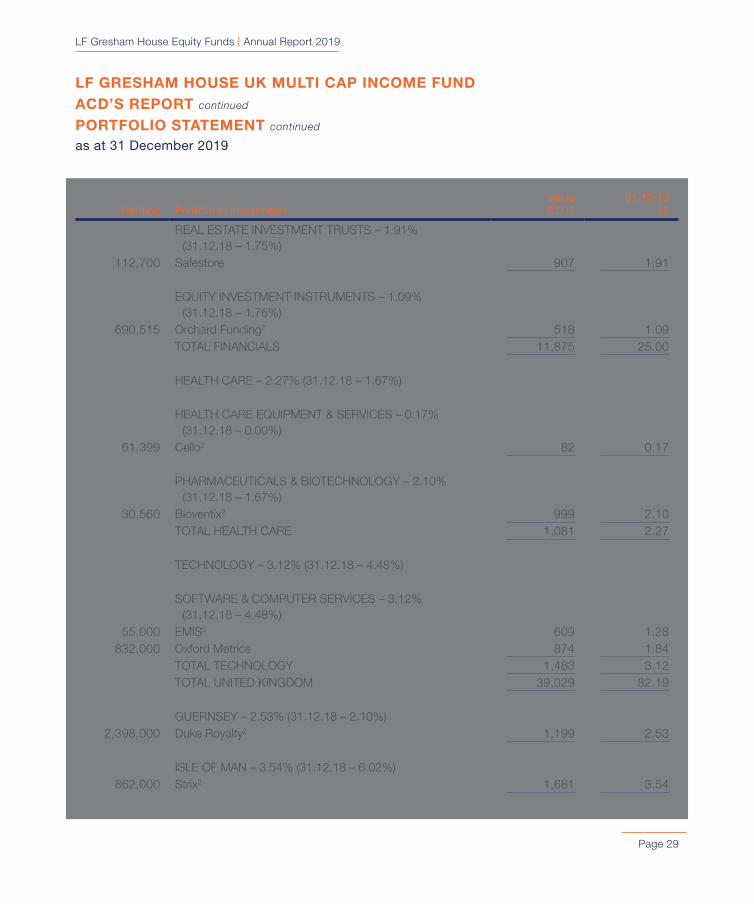
REAL ESTATE INVESTMENT TRUSTS – 1.91% (31.12.18 – 1.75%)
112,700 Safestore 907 1.91
EQUITY INVESTMENT INSTRUMENTS – 1.09% (31.12.18 – 1.76%)
690,515 Orchard Funding2 518 1.09 TOTAL FINANCIALS 11,875 25.00
HEALTH CARE – 2.27% (31.12.18 – 1.67%)
HEALTH CARE EQUIPMENT & SERVICES – 0.17% (31.12.18 – 0.00%)
61,399 Cello2 82 0.17
PHARMACEUTICALS & BIOTECHNOLOGY – 2.10% (31.12.18 – 1.67%)
30,560 Bioventix2 999 2.10 TOTAL HEALTH CARE 1,081 2.27
TECHNOLOGY – 3.12% (31.12.18 – 4.48%)
SOFTWARE & COMPUTER SERVICES – 3.12% (31.12.18 – 4.48%)
55,000 EMIS2 609 1.28 832,000 Oxford Metrics 874 1.84
TOTAL TECHNOLOGY 1,483 3.12 TOTAL UNITED KINGDOM 39,029 82.19
GUERNSEY – 2.53% (31.12.18 – 2.10%) 2,398,000 Duke Royalty2 1,199 2.53
ISLE OF MAN – 3.54% (31.12.18 – 6.02%) 862,000 Strix2 1,681 3.54
LF GRESHAM HOUSE UK MULTI CAP INCOME FUND ACD’S REPORT continued
PORTFOLIO STATEMENT continued
as at 31 December 2019

LF Gresham House Equity Funds | Annual Report 2019
Page 30
Holding Portfolio of InvestmentsValue£’000
31.12.19 %
Portfolio of investments 42,974 90.50Net other assets 4,511 9.50Net assets 47,485 100.00
The investment have been valued in accordance with note 1(F) of the Accounting Policies and are ordinary shares listed on a regulated market unless stated otherwise.
1 Unlisted security.2 AIM – Alternative Investment Market.3 The comparative figure has been restated to match current year presentation. Inspired Energy
has been reclassified from Industrial Goods & Services to Support Services. TEN Entertainment has been reclassified from Media to Travel and Leisure.
LF GRESHAM HOUSE UK MULTI CAP INCOME FUND ACD’S REPORT continued
PORTFOLIO STATEMENT continued
as at 31 December 2019

LF Gresham House Equity Funds | Annual Report 2019
Page 31
LF GRESHAM HOUSE UK MULTI CAP INCOME FUND ACD’S REPORT continued
SUMMARY OF MATERIAL PORTFOLIO CHANGESfor the year ended 31 December 2019
Total purchases for the year £’000 (note 15) 17,981
Major purchasesCost
£’000
BT 3,019Sabre Insurance 1,350The Lakes Distillery 8% 20/6/2022 1,065B&M European Value Retail 977XPS Pensions 974Inspired Energy 971Tatton Asset Management 876Alpha Financial Markets Consulting 758Argentex 662Signature Aviation 636
Total sales for the year £’000 (note 15) 13,941
Major salesProceeds
£’000
BT 1,940SafeCharge International 1,409Tarsus 1,332Sanderson 1,314Manx Telecom 1,251Signature Aviation 962Argentex 938Vodafone 914Knights 697Costain 590
The summary of material portfolio changes represents the 10 largest purchases and sales during the year.
LF Gresham House Equity Funds | Annual Report 2019
Page 32
Notes £’00031.12.19
£’000 £’00031.12.18
£’000
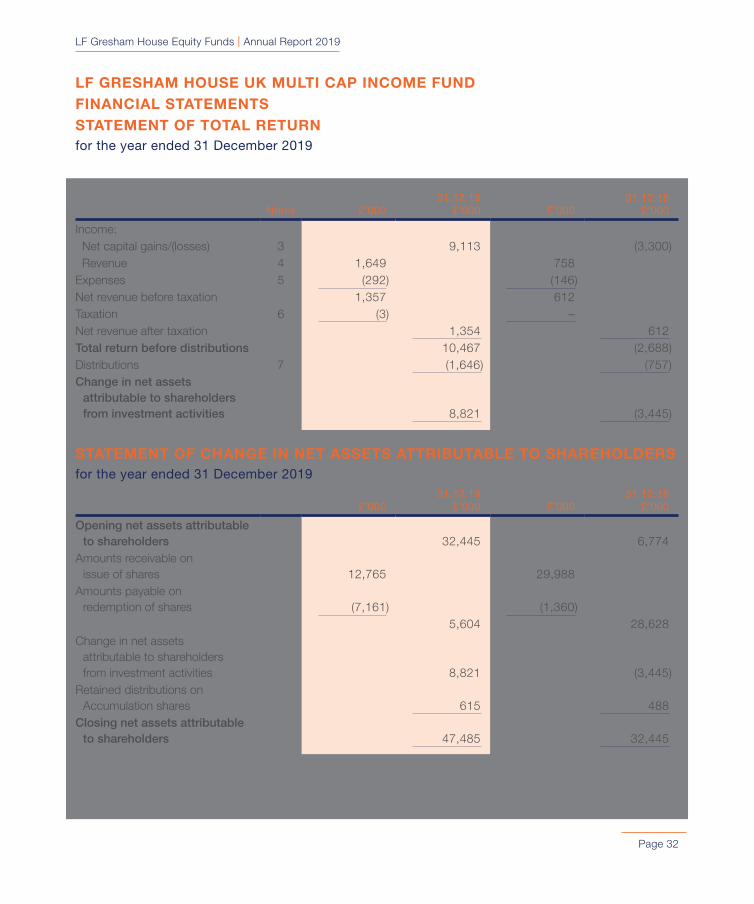
Income: Net capital gains/(losses) 3 9,113 (3,300) Revenue 4 1,649 758 Expenses 5 (292) (146) Net revenue before taxation 1,357 612 Taxation 6 (3) – Net revenue after taxation 1,354 612 Total return before distributions 10,467 (2,688) Distributions 7 (1,646) (757) Change in net assets
attributable to shareholders from investment activities 8,821 (3,445)
STATEMENT OF CHANGE IN NET ASSETS ATTRIBUTABLE TO SHAREHOLDERSfor the year ended 31 December 2019
£’00031.12.19
£’000 £’00031.12.18
£’000
Opening net assets attributable to shareholders 32,445 6,774
Amounts receivable on issue of shares 12,765 29,988
Amounts payable on redemption of shares (7,161) (1,360)
5,604 28,628 Change in net assets
attributable to shareholders from investment activities 8,821 (3,445)
Retained distributions on Accumulation shares 615 488
Closing net assets attributable to shareholders 47,485 32,445
LF GRESHAM HOUSE UK MULTI CAP INCOME FUND FINANCIAL STATEMENTSSTATEMENT OF TOTAL RETURNfor the year ended 31 December 2019
LF Gresham House Equity Funds | Annual Report 2019
Page 33
LF GRESHAM HOUSE UK MULTI CAP INCOME FUND FINANCIAL STATEMENTS continued
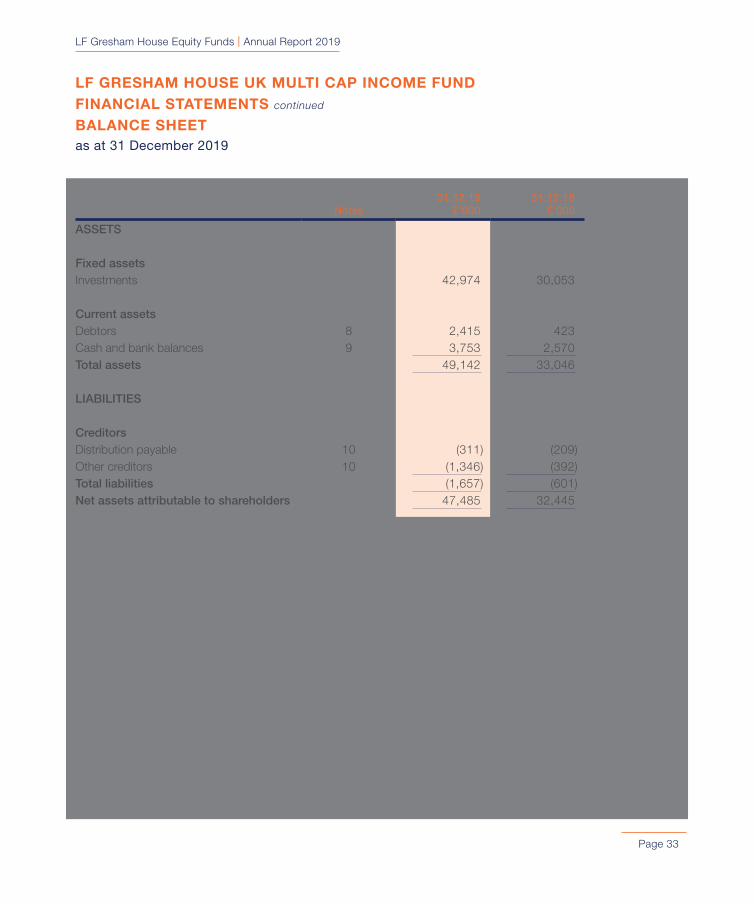
BALANCE SHEETas at 31 December 2019
Notes31.12.19
£’00031.12.18
£’000
ASSETS
Fixed assetsInvestments 42,974 30,053
Current assetsDebtors 8 2,415 423 Cash and bank balances 9 3,753 2,570 Total assets 49,142 33,046
LIABILITIES
CreditorsDistribution payable 10 (311) (209) Other creditors 10 (1,346) (392) Total liabilities (1,657) (601) Net assets attributable to shareholders 47,485 32,445
LF Gresham House Equity Funds | Annual Report 2019
Page 34
LF GRESHAM HOUSE UK MULTI CAP INCOME FUND FINANCIAL STATEMENTS continued
NOTES TO THE FINANCIAL STATEMENTSfor the year ended 31 December 2019
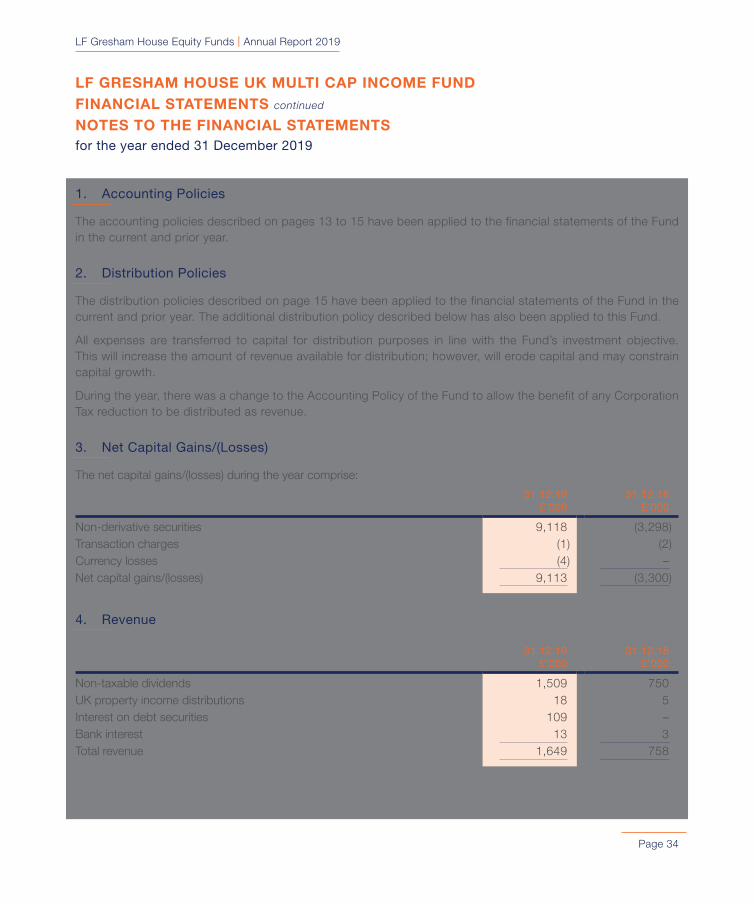
1. Accounting Policies
The accounting policies described on pages 13 to 15 have been applied to the financial statements of the Fund in the current and prior year.
2. Distribution Policies
The distribution policies described on page 15 have been applied to the financial statements of the Fund in the current and prior year. The additional distribution policy described below has also been applied to this Fund.
All expenses are transferred to capital for distribution purposes in line with the Fund’s investment objective. This will increase the amount of revenue available for distribution; however, will erode capital and may constrain capital growth.
During the year, there was a change to the Accounting Policy of the Fund to allow the benefit of any Corporation Tax reduction to be distributed as revenue.
3. Net Capital Gains/(Losses)
The net capital gains/(losses) during the year comprise:
31.12.19£’000
31.12.18£’000
Non-derivative securities 9,118 (3,298)Transaction charges (1) (2)Currency losses (4) –Net capital gains/(losses) 9,113 (3,300)
4. Revenue
31.12.19£’000
31.12.18£’000
Non-taxable dividends 1,509 750UK property income distributions 18 5Interest on debt securities 109 –Bank interest 13 3Total revenue 1,649 758
LF Gresham House Equity Funds | Annual Report 2019
Page 35
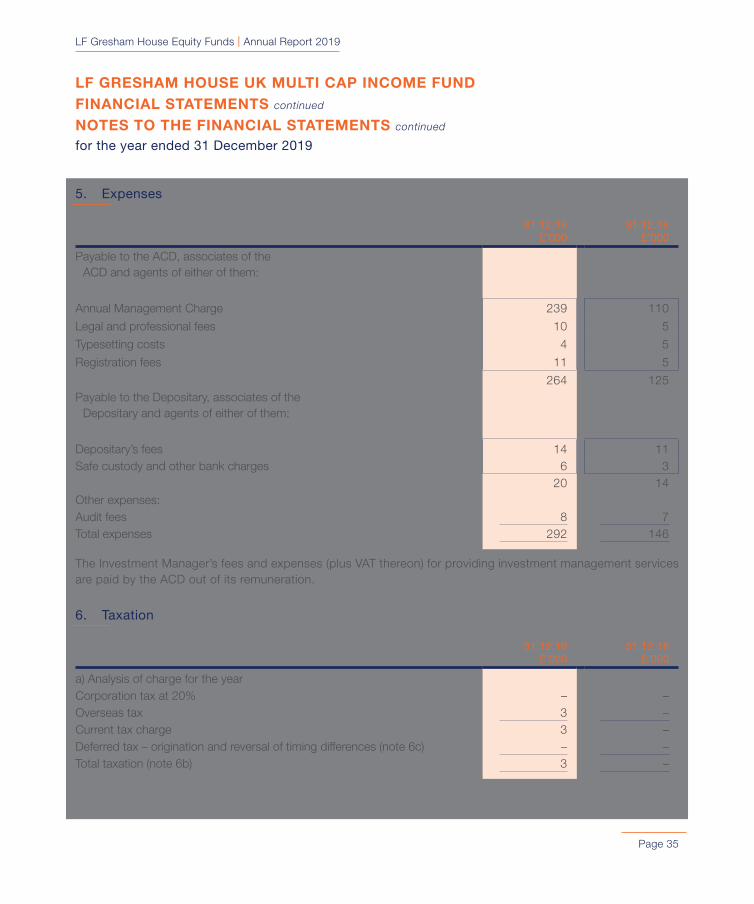
5. Expenses
31.12.19£’000
31.12.18£’000
Payable to the ACD, associates of the ACD and agents of either of them:
Annual Management Charge 239 110
Legal and professional fees 10 5
Typesetting costs 4 5
Registration fees 11 5
264 125Payable to the Depositary, associates of the
Depositary and agents of either of them:
Depositary’s fees 14 11Safe custody and other bank charges 6 3
20 14Other expenses:Audit fees 8 7Total expenses 292 146
The Investment Manager’s fees and expenses (plus VAT thereon) for providing investment management services are paid by the ACD out of its remuneration.
6. Taxation
31.12.19£’000
31.12.18£’000
a) Analysis of charge for the yearCorporation tax at 20% – –Overseas tax 3 –Current tax charge 3 –Deferred tax – origination and reversal of timing differences (note 6c) – –Total taxation (note 6b) 3 –
LF GRESHAM HOUSE UK MULTI CAP INCOME FUND FINANCIAL STATEMENTS continued
NOTES TO THE FINANCIAL STATEMENTS continued
for the year ended 31 December 2019

LF Gresham House Equity Funds | Annual Report 2019
Page 36
b) Factors affecting the tax charge for the yearThe tax assessed for the year differs from the standard rate of corporation tax in the UK for an authorised fund (20%) (31.12.18: 20%). The difference is explained below:
31.12.19£’000
31.12.18£’000
Net revenue before taxation 1,357 612Corporation tax at 20% 271 122
Effects of:Non-taxable dividends (302) (150)Unutilised excess management expenses 31 28Corporation tax charge – –
Overseas tax 3 –Total tax charge (note 6a) 3 –
c) Deferred taxAt the year end there is a potential deferred tax asset of £66,000 (31.12.18: £35,000) in relation to surplus management expenses. It is unlikely that the Fund will generate sufficient taxable profits in the future to utilise this amount and, therefore, no deferred tax asset has been recognised in the current or prior year.
7. Distributions
The distributions take account of revenue received on the issue of shares and revenue deducted on redemption of shares, and comprise:
31.12.19£’000
31.12.18£’000
First Interim 151 63Second Interim 670 197Third Interim 380 325Final 489 328
1,690 913
Add: Revenue deducted on redemption of shares 23 7Deduct: Revenue received on issue of shares (67) (163)Net distributions for the year 1,646 757
LF GRESHAM HOUSE UK MULTI CAP INCOME FUND FINANCIAL STATEMENTS continued
NOTES TO THE FINANCIAL STATEMENTS continued
for the year ended 31 December 2019

LF Gresham House Equity Funds | Annual Report 2019
Page 37
Details of the distributions per share are set out in the table on pages 44 to 46.
31.12.19£’000
31.12.18£’000
Distributions represented by:Net revenue after taxation 1,354 612Allocations to capital:Expenses 292 145Net distributions for the year 1,646 757
8. Debtors
31.12.19£’000
31.12.18£’000
Amounts receivable for issue of shares 244 279
Sales awaiting settlement 1,958 –
Accrued revenue:Non-taxable dividends 192 144Interest from debt securities 21 –
213 144Total debtors 2,415 423
9. Cash and Bank Balances
31.12.19£’000
31.12.18£’000
Bank balances 3,753 2,570Total cash and bank balances 3,753 2,570
10. Creditors
31.12.19£’000
31.12.18£’000
Distribution payable 311 209
LF GRESHAM HOUSE UK MULTI CAP INCOME FUND FINANCIAL STATEMENTS continued
NOTES TO THE FINANCIAL STATEMENTS continued
for the year ended 31 December 2019

LF Gresham House Equity Funds | Annual Report 2019
Page 38
31.12.19£’000
31.12.18£’000
Other CreditorsAmounts payable for redemption of shares 293 361
Purchases awaiting settlement 1,007 –
Accrued expenses:Amounts payable to the ACD, associates of
the ACD and agents of either of them:Annual Management Charge 24 18Legal and professional fees 1 1Typesetting costs 2 2Registration fees 1 1
28 22Amounts payable to the Depositary, associates of
the Depositary and agents of either of them:Depositary’s fees 1 1Safe custody and other bank charges 2 1
3 2
Other expenses 15 7Total other creditors 1,346 392
11. Related Party Transactions
The Annual Management Charge and legal and professional fees payable to Link Fund Solutions Limited (‘the ACD’), registration fees payable to Link Fund Administrators Limited and typesetting costs payable to Link Alternative Fund Administrators Limited (both companies are associates of the ACD) are disclosed in note 5 and amounts due at the year end are disclosed in note 10.
The aggregate monies received by the ACD through the issue of shares and paid on redemption of shares are disclosed in the Statement of Change in Net Assets Attributable to Shareholders on page 32 and amounts due at the year end are disclosed in notes 8 and 10.
LF GRESHAM HOUSE UK MULTI CAP INCOME FUND FINANCIAL STATEMENTS continued
NOTES TO THE FINANCIAL STATEMENTS continued
for the year ended 31 December 2019
LF Gresham House Equity Funds | Annual Report 2019
Page 39
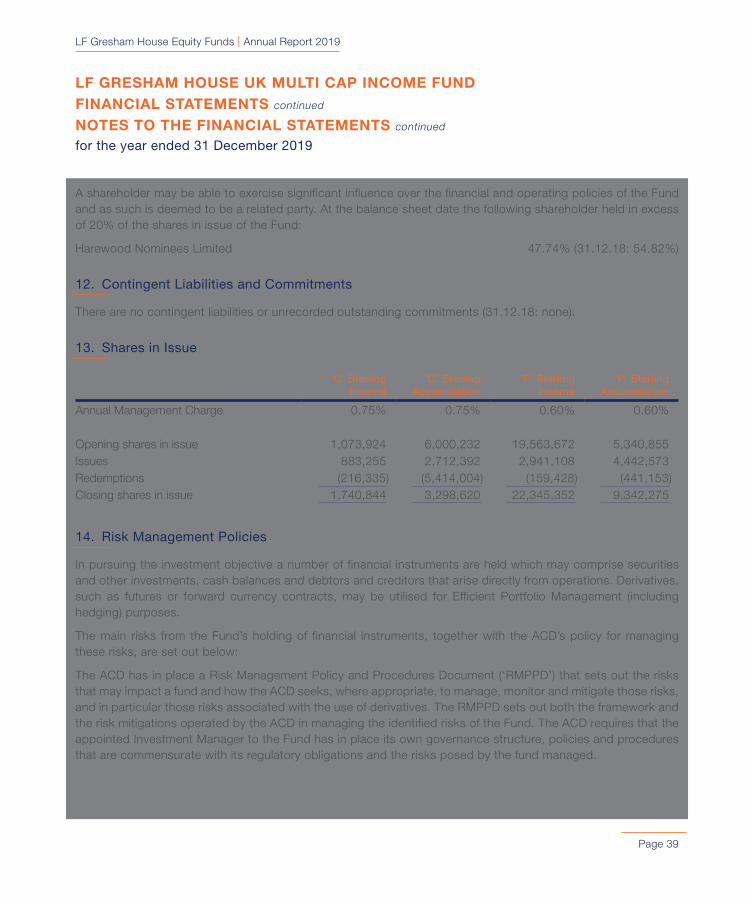
A shareholder may be able to exercise significant influence over the financial and operating policies of the Fund and as such is deemed to be a related party. At the balance sheet date the following shareholder held in excess of 20% of the shares in issue of the Fund:
Harewood Nominees Limited 47.74% (31.12.18: 54.82%)
12. Contingent Liabilities and Commitments
There are no contingent liabilities or unrecorded outstanding commitments (31.12.18: none).
13. Shares in Issue
‘C’ Sterling Income
‘C’ Sterling Accumulation
‘F’ Sterling Income
‘F’ Sterling Accumulation
Annual Management Charge 0.75% 0.75% 0.60% 0.60%
Opening shares in issue 1,073,924 6,000,232 19,563,672 5,340,855Issues 883,255 2,712,392 2,941,108 4,442,573Redemptions (216,335) (5,414,004) (159,428) (441,153)Closing shares in issue 1,740,844 3,298,620 22,345,352 9,342,275
14. Risk Management Policies
In pursuing the investment objective a number of financial instruments are held which may comprise securities and other investments, cash balances and debtors and creditors that arise directly from operations. Derivatives, such as futures or forward currency contracts, may be utilised for Efficient Portfolio Management (including hedging) purposes.
The main risks from the Fund’s holding of financial instruments, together with the ACD’s policy for managing these risks, are set out below:
The ACD has in place a Risk Management Policy and Procedures Document (‘RMPPD’) that sets out the risks that may impact a fund and how the ACD seeks, where appropriate, to manage, monitor and mitigate those risks, and in particular those risks associated with the use of derivatives. The RMPPD sets out both the framework and the risk mitigations operated by the ACD in managing the identified risks of the Fund. The ACD requires that the appointed Investment Manager to the Fund has in place its own governance structure, policies and procedures that are commensurate with its regulatory obligations and the risks posed by the fund managed.
LF GRESHAM HOUSE UK MULTI CAP INCOME FUND FINANCIAL STATEMENTS continued
NOTES TO THE FINANCIAL STATEMENTS continued
for the year ended 31 December 2019

LF Gresham House Equity Funds | Annual Report 2019
Page 40
(A) CREDIT RISK
Credit risk is the risk that a counterparty may be unable or unwilling to make a payment or fulfil contractual obligations. This may be in terms of an actual default or by deterioration in a counterparty’s credit quality.
Certain transactions in securities that the Fund enters into expose it to the risk that the counterparty will not deliver the investment for a purchase, or cash for a sale after the Fund has fulfilled its obligations. As part of its due diligence process, the ACD undertakes a review of the controls operated over counterparties by the Investment Manager, including initial and ongoing due diligence and business volumes placed with each counterparty. In cases which are dependent on the counterparty settling at the transaction’s maturity date, the ACD has policies in place which set out the minimum credit quality expected of a market counterparty or deposit taker at the outset of the transaction.
(B) INTEREST RATE RISK
Interest rate risk is the risk that the value of the Fund’s investments will fluctuate as a result of interest rate changes. The value of fixed interest securities may be affected by changes in interest rates, either globally or locally. Changes in the rate of return in one asset class may influence the valuation basis of other classes. The amount of revenue receivable from floating rate investments and bank balances or payable on bank overdrafts will be affected by fluctuations in interest rates.
The Fund takes on interest rate risk within its investment portfolio where the ACD and Investment Manager believe that the expected return compensates for the overall risk. The ACD and Investment Manager continue to monitor the level of interest rate risk posed by the Fund’s underlying investments on a regular basis. As the Fund has no significant direct exposure to interest rate risk, no sensitivity analysis has been presented.
The table below shows the direct interest rate risk profile:
31.12.19£’000
31.12.18£’000
Fixed rate investments 1,065 –Investments on which interest is not paid 41,909 30,053Total investments 42,974 30,053
Investments on which interest is not paid include equities.
(C) FOREIGN CURRENCY RISK
Foreign currency risk is the risk that the Sterling value of investments will fluctuate as a result of exchange rate movements. Assets denominated in currencies other than Sterling will provide direct exposure to currency risk as a consequence of the movement in foreign exchange rates when calculating the Sterling equivalent value.
The Fund does not have any significant exposure to foreign currency risk, and therefore no foreign currency table or sensitivity analysis has been presented.
LF GRESHAM HOUSE UK MULTI CAP INCOME FUND FINANCIAL STATEMENTS continued
NOTES TO THE FINANCIAL STATEMENTS continued
for the year ended 31 December 2019

LF Gresham House Equity Funds | Annual Report 2019
Page 41
(D) LEVERAGE
The Fund did not employ any significant leverage during the current or prior year.
(E) LIQUIDITY RISK
The main liability of the Fund is the redemption of any shares that investors want to sell. Investments may have to be sold to fund such redemptions should insufficient cash be held at the bank to meet this obligation.
The ACD monitors the liquidity profile of the Fund on a daily basis. In assessing the liquidity profile of the Fund, the ACD assesses how much of the Fund can be realised in one and five days, under normal and stressed market conditions, and the impact this would have on the overall subsequent liquidity profile. In assessing the liquidity of a company’s shares, the ACD utilises the lower of the 6 and 12 month average market volume of that company’s shares. Where a risk is identified then a more in depth review is undertaken to establish its significance, by assessing the liquidity profile of the Fund against a 25% market participation of the average daily volume. Based on this analysis 64.70% of the portfolio can be liquidated within 5 days and 92.01% within 30 days. Given this and the ACD’s understanding of the investor base, it is considered that the liquidity profile of the Fund is appropriate.
All financial liabilities are payable in one year or less, or on demand.
(F) MARKET PRICE RISK
Market price risk is the risk that the value of the Fund’s financial instruments will fluctuate as a result of changes in market prices caused by factors other than interest rate or foreign currency movement. Market price risk arises primarily from uncertainty about the future prices of financial instruments that the Fund holds.
Market price risk represents the potential loss the Fund may suffer through holding market positions in the face of price movements. The Fund’s investment portfolio is exposed to price fluctuations, which are monitored by the ACD in pursuance of the investment objective and policy. The risk is generally regarded as consisting of two elements – stock specific risk and market risk. Adhering to investment guidelines and avoiding excessive exposure to one particular issuer can limit stock specific risk. Subject to compliance with the investment objective, spreading exposure across a broad range of global stocks can mitigate market risk.
A 5% increase in the value of the Fund’s portfolio would have the effect of increasing the return and net assets by £2,149,000 (31.12.18: £1,503,000). A 5% decrease would have an equal and opposite effect.
(G) DERIVATIVES
The Fund held no derivatives during the current or prior year.
LF GRESHAM HOUSE UK MULTI CAP INCOME FUND FINANCIAL STATEMENTS continued
NOTES TO THE FINANCIAL STATEMENTS continued
for the year ended 31 December 2019
LF Gresham House Equity Funds | Annual Report 2019
Page 42
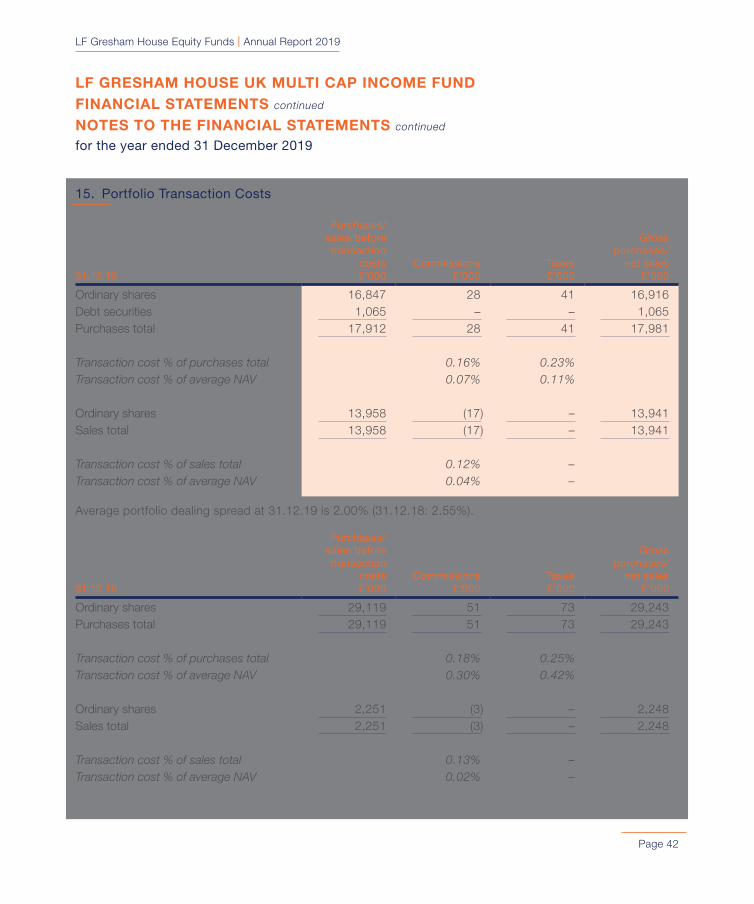
15. Portfolio Transaction Costs
31.12.19
Purchases/sales beforetransaction
costs£’000
Commissions£’000
Taxes£’000
Grosspurchases/
net sales£’000
Ordinary shares 16,847 28 41 16,916Debt securities 1,065 – – 1,065Purchases total 17,912 28 41 17,981
Transaction cost % of purchases total 0.16% 0.23%Transaction cost % of average NAV 0.07% 0.11%
Ordinary shares 13,958 (17) – 13,941Sales total 13,958 (17) – 13,941
Transaction cost % of sales total 0.12% –Transaction cost % of average NAV 0.04% –
Average portfolio dealing spread at 31.12.19 is 2.00% (31.12.18: 2.55%).
31.12.18
Purchases/sales beforetransaction
costs£’000
Commissions£’000
Taxes£’000
Grosspurchases/
net sales£’000
Ordinary shares 29,119 51 73 29,243Purchases total 29,119 51 73 29,243
Transaction cost % of purchases total 0.18% 0.25%Transaction cost % of average NAV 0.30% 0.42%
Ordinary shares 2,251 (3) – 2,248Sales total 2,251 (3) – 2,248
Transaction cost % of sales total 0.13% –Transaction cost % of average NAV 0.02% –
LF GRESHAM HOUSE UK MULTI CAP INCOME FUND FINANCIAL STATEMENTS continued
NOTES TO THE FINANCIAL STATEMENTS continued
for the year ended 31 December 2019

LF Gresham House Equity Funds | Annual Report 2019
Page 43
16. Fair Value Hierarchy
Investments are categorised into the following levels based on their fair value measurement:
Level 1: Unadjusted quoted price in an active market for an identical instrument;
Level 2: Valuation techniques using observable inputs other than quoted prices within Level 1;
Level 3: Valuation techniques using unobservable inputs (see note 1(F) of the Accounting Policies).
31.12.19Level 1
£’000Level 2
£’000Level 3
£’000Total
£’000
Investment assets 41,909 – 1,065 42,974
31.12.18Level 1
£’000Level 2
£’000Level 3
£’000Total
£’000
Investment assets 30,053 – – 30,053
17. Subsequent Events
On 11 March 2020 the World Health Organisation declared the COVID-19 outbreak a pandemic. As a result, global markets have experienced a period of volatility which has impacted the performance of the Fund since the balance sheet date. The length of time the volatility remains will largely depend on the scale and duration of the outbreak. The spread and impact of COVID-19 is considered as a non-adjusting event after the reporting period.
Since the balance sheet date, the price of each of the Fund’s share classes has moved as follows:
Share classBalance sheet
date 12.06.20 Movement
‘C’ Sterling Income 126.93 107.43 (15.36)%‘C’ Sterling Accumulation 138.73 119.36 (13.96)%‘F’ Sterling Income 127.63 108.10 (15.30)%‘F’ Sterling Accumulation 139.60 120.18 (13.91)%
LF GRESHAM HOUSE UK MULTI CAP INCOME FUND FINANCIAL STATEMENTS continued
NOTES TO THE FINANCIAL STATEMENTS continued
for the year ended 31 December 2019
LF Gresham House Equity Funds | Annual Report 2019
Page 44
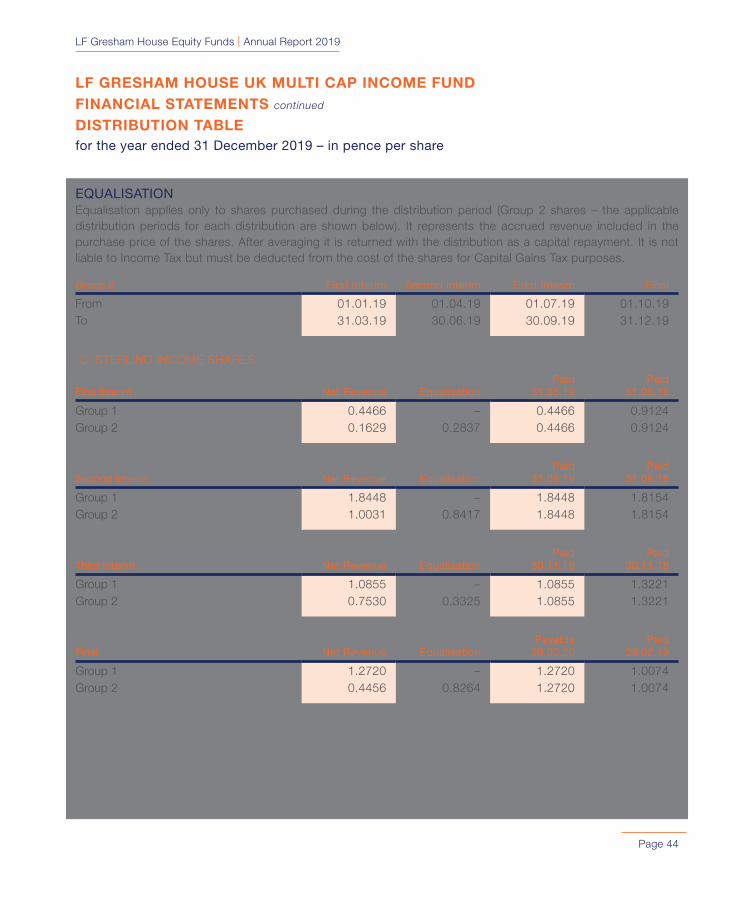
EQUALISATIONEqualisation applies only to shares purchased during the distribution period (Group 2 shares – the applicable distribution periods for each distribution are shown below). It represents the accrued revenue included in the purchase price of the shares. After averaging it is returned with the distribution as a capital repayment. It is not liable to Income Tax but must be deducted from the cost of the shares for Capital Gains Tax purposes.
Group 2 First Interim Second Interim Third Interim Final
From 01.01.19 01.04.19 01.07.19 01.10.19To 31.03.19 30.06.19 30.09.19 31.12.19
‘C’ STERLING INCOME SHARES
First Interim Net Revenue EqualisationPaid
31.05.19 Paid
31.05.18
Group 1 0.4466 – 0.4466 0.9124 Group 2 0.1629 0.2837 0.4466 0.9124
Second Interim Net Revenue EqualisationPaid
31.08.19 Paid
31.08.18
Group 1 1.8448 – 1.8448 1.8154 Group 2 1.0031 0.8417 1.8448 1.8154
Third Interim Net Revenue EqualisationPaid
30.11.19 Paid
30.11.18
Group 1 1.0855 – 1.0855 1.3221 Group 2 0.7530 0.3325 1.0855 1.3221
Final Net Revenue EqualisationPayable
29.02.20Paid
28.02.19
Group 1 1.2720 – 1.2720 1.0074 Group 2 0.4456 0.8264 1.2720 1.0074
LF GRESHAM HOUSE UK MULTI CAP INCOME FUND FINANCIAL STATEMENTS continued
DISTRIBUTION TABLEfor the year ended 31 December 2019 – in pence per share
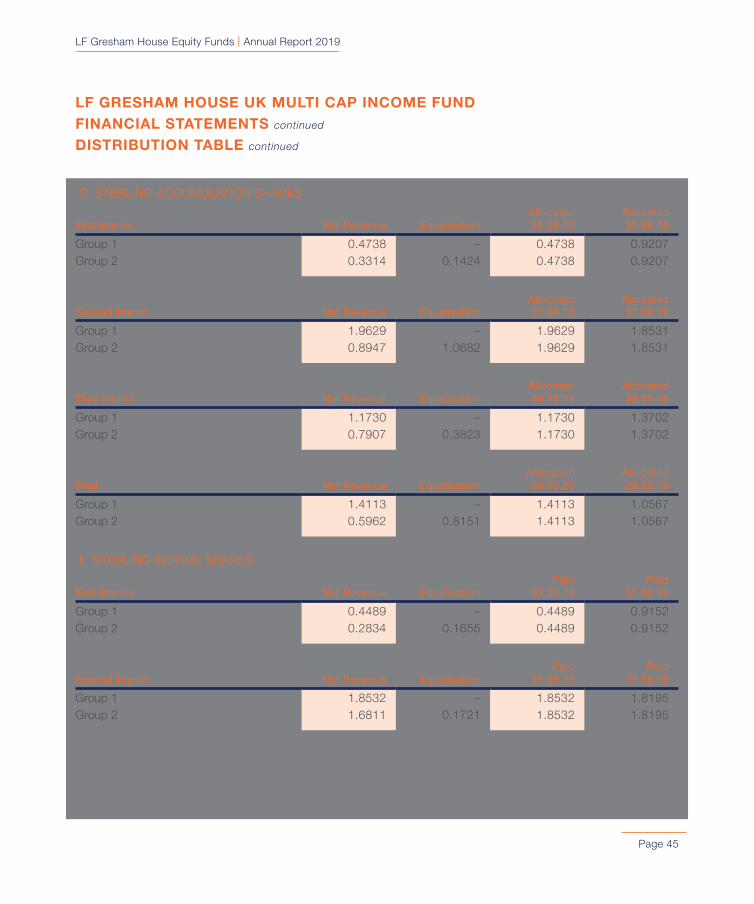
LF Gresham House Equity Funds | Annual Report 2019
Page 45
LF GRESHAM HOUSE UK MULTI CAP INCOME FUND FINANCIAL STATEMENTS continued
DISTRIBUTION TABLE continued
‘C’ STERLING ACCUMULATION SHARES
First Interim Net Revenue EqualisationAllocated 31.05.19
Allocated 31.05.18
Group 1 0.4738 – 0.4738 0.9207 Group 2 0.3314 0.1424 0.4738 0.9207
Second Interim Net Revenue EqualisationAllocated 31.08.19
Allocated 31.08.18
Group 1 1.9629 – 1.9629 1.8531 Group 2 0.8947 1.0682 1.9629 1.8531
Third Interim Net Revenue EqualisationAllocated 30.11.19
Allocated 30.11.18
Group 1 1.1730 – 1.1730 1.3702 Group 2 0.7907 0.3823 1.1730 1.3702
Final Net Revenue EqualisationAllocation
29.02.20Allocated 28.02.19
Group 1 1.4113 – 1.4113 1.0567 Group 2 0.5962 0.8151 1.4113 1.0567
‘F’ STERLING INCOME SHARES
First Interim Net Revenue EqualisationPaid
31.05.19 Paid
31.05.18
Group 1 0.4489 – 0.4489 0.9152 Group 2 0.2834 0.1655 0.4489 0.9152
Second Interim Net Revenue EqualisationPaid
31.08.19 Paid
31.08.18
Group 1 1.8532 – 1.8532 1.8195 Group 2 1.6811 0.1721 1.8532 1.8195
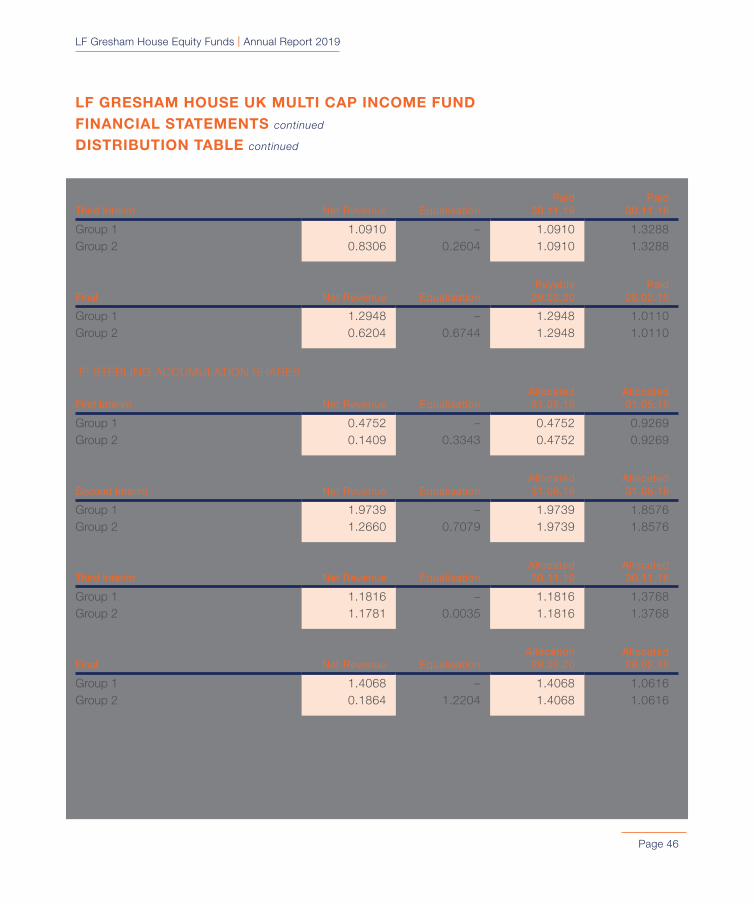
LF Gresham House Equity Funds | Annual Report 2019
Page 46
Third Interim Net Revenue EqualisationPaid
30.11.19 Paid
30.11.18
Group 1 1.0910 – 1.0910 1.3288 Group 2 0.8306 0.2604 1.0910 1.3288
Final Net Revenue EqualisationPayable
29.02.20Paid
28.02.19
Group 1 1.2948 – 1.2948 1.0110 Group 2 0.6204 0.6744 1.2948 1.0110
‘F’ STERLING ACCUMULATION SHARES
First Interim Net Revenue EqualisationAllocated 31.05.19
Allocated 31.05.18
Group 1 0.4752 – 0.4752 0.9269 Group 2 0.1409 0.3343 0.4752 0.9269
Second Interim Net Revenue EqualisationAllocated 31.08.19
Allocated 31.08.18
Group 1 1.9739 – 1.9739 1.8576 Group 2 1.2660 0.7079 1.9739 1.8576
Third Interim Net Revenue EqualisationAllocated 30.11.19
Allocated 30.11.18
Group 1 1.1816 – 1.1816 1.3768 Group 2 1.1781 0.0035 1.1816 1.3768
Final Net Revenue EqualisationAllocation
29.02.20Allocated 28.02.19
Group 1 1.4068 – 1.4068 1.0616 Group 2 0.1864 1.2204 1.4068 1.0616
LF GRESHAM HOUSE UK MULTI CAP INCOME FUND FINANCIAL STATEMENTS continued
DISTRIBUTION TABLE continued
LF Gresham House Equity Funds | Annual Report 2019
Page 47
LF GRESHAM HOUSE UK SMALLER COMPANIES FUNDACD’S REPORTfor the period from 1 February 2019 to 31 December 2019
Important InformationPlease refer to the Important Information section on page 4.
Investment Objective and PolicyThe LF Gresham House UK Smaller Companies Fund (‘the Fund’) aims to provide capital growth over the long term (in excess of 5 years).
The Fund will directly invest at least 70% of its assets in shares of smaller-sized UK companies. These are listed companies with a market capitalisation within the lowest 10% of the listed UK equities markets that are either domiciled, incorporated or have a significant portion of their business (which will be considered by reference to revenue, profits and/or assets depending on the nature of the business) in the UK.
The Fund may also invest in shares of medium and large sized UK companies, unlisted companies, collective investment schemes (which may include other funds managed by the ACD, funds to which the Investment Manager provides investment management services and associates of the ACD and Investment Manager), warrants, money market instruments, deposits, cash, or near cash.
Derivatives and forward transactions may be used for Efficient Portfolio Management purposes.
The investment policy referenced above will not apply under extraordinary market conditions, in which circumstances the Fund may invest in asset classes other than those in which it normally invests in order to mitigate its exposure to market risk. Examples of extraordinary market conditions include economic, political unrest or instability, world events leading to market instability, closure of a relevant market(s), or any events which give rise to high downside risk. During such periods, the Fund may temporarily invest up to 100% of its total assets in cash, deposits, treasury bills, government bonds or short-term money market instruments, or have substantial holdings in cash and cash equivalents.
BenchmarkThe Fund’s comparator benchmark is the IA UK Smaller Companies sector.
The Fund’s performance may be compared against the IA UK Smaller Companies sector. Many funds sold in the UK are grouped into sectors by the Investment Association (the trade body that represents UK investment managers). The comparator benchmark has been selected as we consider it assists investors in evaluating the Fund’s performance against the performance of other funds invested in similar assets.
LINK FUND SOLUTIONS LIMITEDACD of LF Gresham House UK Smaller Companies Fund29 June 2020
LF Gresham House Equity Funds | Annual Report 2019
Page 48
LF GRESHAM HOUSE UK SMALLER COMPANIES FUNDACD’S REPORT continued
INVESTMENT MANAGER’S REPORTfor the period from 1 February 2019 to 31 December 2019
Investment StrategyThe LF Gresham House UK Smaller Companies Fund (the Fund) was launched on 1 February 2019 with a policy of investing primarily in UK listed small companies, with a focus on capital appreciation over the medium to long term. The Fund is targeting consistent annual returns from a quality and fundamentals-based investment strategy, in line with the other funds of the Manager.
The Fund’s investment strategy seeks to leverage the Manager’s core expertise in investing in small and mid-sized UK businesses within its key sectors of Consumer Markets, TMT, Business Services, Financials and Healthcare & Education, whilst avoiding stocks prone to the effects of cyclical risk or large external factors. The Fund aims to benefit from the wider Gresham House platform of research and investment professionals, as well as its private equity heritage and network of entrepreneurs, business leaders and industry specialists.
Fund composition aims to reflect the Manager’s high conviction style, comprising a relatively concentrated portfolio of stocks with the potential to sustainably grow profits over the longer term.
Movements in Net Asset ValueAs at 31 December 2019 the gross NAV of the Fund was £4.2m, of which 97.8% was invested in UK equities. Since launch the NAV increased predominantly as a result of net inflows from shareholders, but also due to a steady revaluation of the portfolio. The Fund generated a capital return of 26.7% over the period (based on ‘C’ Sterling Accumulation class) outperforming the average of its IA UK Smaller Companies sector peer group, which returned 20.0%.
Investment ActivityAt launch the initial funding of £1.0m was invested across 34 companies. Post launch new investment activity was strong as inflows from new investors were deployed into a combination of new positions and follow-on investments into existing portfolio companies. A total of £3.9m has been invested since launch. During the period the number of portfolio companies increased from 34 at launch to 39 as at 31 December 2019.
Most of the Fund’s holdings are in companies where the Manager has extensive knowledge and experience built up over a number of years. Often companies held within the Fund may have been previous holdings of the Manager’s UK Micro Cap fund where they might have outgrown the mandate of that fund but where the Manager retains strong relationships with management and an in depth understanding of the key drivers and potential of those companies. The launch of the Fund has provided a vehicle through which the Manager can continue to back these businesses as they scale and mature and can benefit for continued scope for attractive capital growth over the medium to long term.
The Manager was active in evaluating equity placings conducted by existing listed businesses and made two new investments as part of these fundraisings. These were to increase our holding in Staffline, a specialist blue-collar temporary labour supplier, a company in which the Manager sees long-term upside; and Codemasters, a video game developer and publisher, as part of a funding round to undertake a transformational acquisition.
LF Gresham House Equity Funds | Annual Report 2019
Page 49
LF GRESHAM HOUSE UK SMALLER COMPANIES FUNDACD’S REPORT continued
INVESTMENT MANAGER’S REPORT continued
The Manager believes it is strongly positioned amongst UK fund managers to effectively evaluate new companies being admitted to the market through an Initial Public Offering (‘IPO’). This confidence stems from the Manager’s detailed due diligence process when assessing new positions. The team researches new potential investments with a private equity approach incorporating extensive use of external referencing of both the business model and the leadership. This leads to a high level of conviction and insight to companies with typically only limited available trading history. In line with this, the Fund has participated in 3 IPOs since launch: Loungers, a café-bar operator; Argentex, a corporate foreign exchange solutions provider; and Brickability, a specialist distributor of bricks and other construction materials.
There were five full exits during the period, Tarsus, an international business-to-business media group following a takeover offer; Tyman, an international supplier of building materials and products, after a number of changes in management in relatively quick succession; Costain, following a profit warning leading to a fundamental change to our investment view; SafeCharge, after the company was acquired; and CVS Group, after strong share price performance led to our target price being achieved.
Investment PerformanceThe Fund placed 11th out of 52 in the IA UK Smaller Companies Sector delivering a total fund return of 26.7% at 31 December 2019 (based on the ‘C’ Sterling Accumulation class).
There were a number of strong performers in the period, including Impax Asset Management, following strong growth in assets under management and earnings; Ergomed, a clinical development organisation, following positive results and analyst upgrades; and CVS Group, following a strong recovery in profitability and improving investor confidence following a period of uncertainty and underperformance in the prior year.
Negative performers during the period were Costain Group, following a profit warning due to project delays and a cancellation. This has since been fully exited as the senior management change did not provide sufficient confidence regarding the outlook. Other negative performers were Filta Group, which de-rated despite strong full year results; and Staffline, after announcing a material profit warning in part driven by Brexit uncertainty.
OutlookAs a newly launched fund, the Fund continues to seek new monies in order to take advantage of the many opportunities observed within its target universe. In line with the Manager’s style the Fund looks to invest in quality companies in order to deliver robust absolute and relative returns over the medium to long-term.
The Manager’s expectation of increasing market volatility played out during 2019, with macro and geopolitical uncertainty weighing on sentiment resulting in global and UK equity markets seeing notable selling pressure. This filtered through to a decline in IPO activity and an increase in M&A activity as cash-rich buyer groups looked to deploy capital in small and micro-cap businesses offering attractive fundamentals.

LF Gresham House Equity Funds | Annual Report 2019
Page 50
The strong market performance in Q4 2019 and an encouraging start to 2020 drew to a sudden halt as the potential ramifications of the international spread of COVID-19 on global economic growth began to impact sentiment. There are significant uncertainties relating to the spread and impact of the pandemic as well as the social and economic response from governments across the world including the UK. The Manager anticipates further periods of market volatility and weaker sentiment during 2020. It will also become clearer as the year progresses which sectors and companies have been fundamentally changed by the current crisis and which businesses will improve their market position and become stronger. There are likely to be some very attractive long-term smaller company investment opportunities that emerge during the year both from market movements and an increasing number of recapitalisation transactions to strengthen otherwise sound businesses.
The Manager continues to believe that over the long term its fundamentals focused investment style has the potential to outperform. The Fund will maintain its focus on building a high conviction portfolio of less cyclical, high-quality, niche growth businesses which the Manager believes can deliver strong returns through the market cycle regardless of the performance of the wider economy.
Note: Investments carry risks. Past performance is not a guide to future performance. Investors may not get back the amount invested.
GRESHAM HOUSE ASSET MANAGEMENT LIMITEDInvestment Manager7 April 2020
LF GRESHAM HOUSE UK SMALLER COMPANIES FUNDACD’S REPORT continued
INVESTMENT MANAGER’S REPORT continued
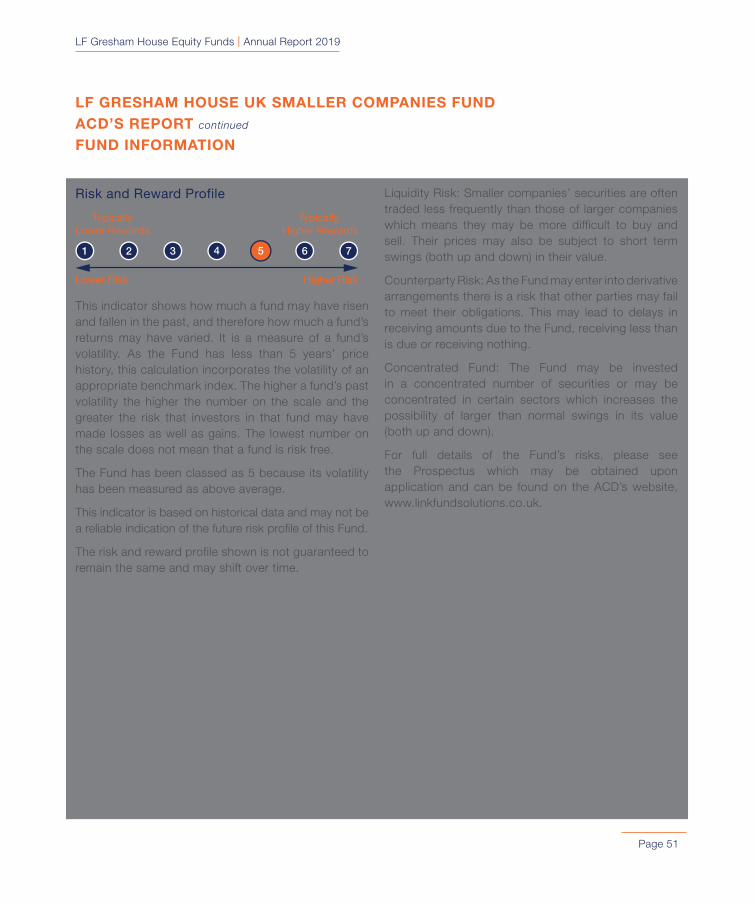
LF Gresham House Equity Funds | Annual Report 2019
Page 51
Risk and Reward Profile
This indicator shows how much a fund may have risen and fallen in the past, and therefore how much a fund’s returns may have varied. It is a measure of a fund’s volatility. As the Fund has less than 5 years’ price history, this calculation incorporates the volatility of an appropriate benchmark index. The higher a fund’s past volatility the higher the number on the scale and the greater the risk that investors in that fund may have made losses as well as gains. The lowest number on the scale does not mean that a fund is risk free.
The Fund has been classed as 5 because its volatility has been measured as above average.
This indicator is based on historical data and may not be a reliable indication of the future risk profile of this Fund.
The risk and reward profile shown is not guaranteed to remain the same and may shift over time.
Liquidity Risk: Smaller companies’ securities are often traded less frequently than those of larger companies which means they may be more difficult to buy and sell. Their prices may also be subject to short term swings (both up and down) in their value.
Counterparty Risk: As the Fund may enter into derivative arrangements there is a risk that other parties may fail to meet their obligations. This may lead to delays in receiving amounts due to the Fund, receiving less than is due or receiving nothing.
Concentrated Fund: The Fund may be invested in a concentrated number of securities or may be concentrated in certain sectors which increases the possibility of larger than normal swings in its value (both up and down).
For full details of the Fund’s risks, please see the Prospectus which may be obtained upon application and can be found on the ACD’s website, www.linkfundsolutions.co.uk.
Lower Risk
Typically Higher Rewards
TypicallyLower Rewards
Higher Risk
4
LF GRESHAM HOUSE UK SMALLER COMPANIES FUNDACD’S REPORT continued
FUND INFORMATION
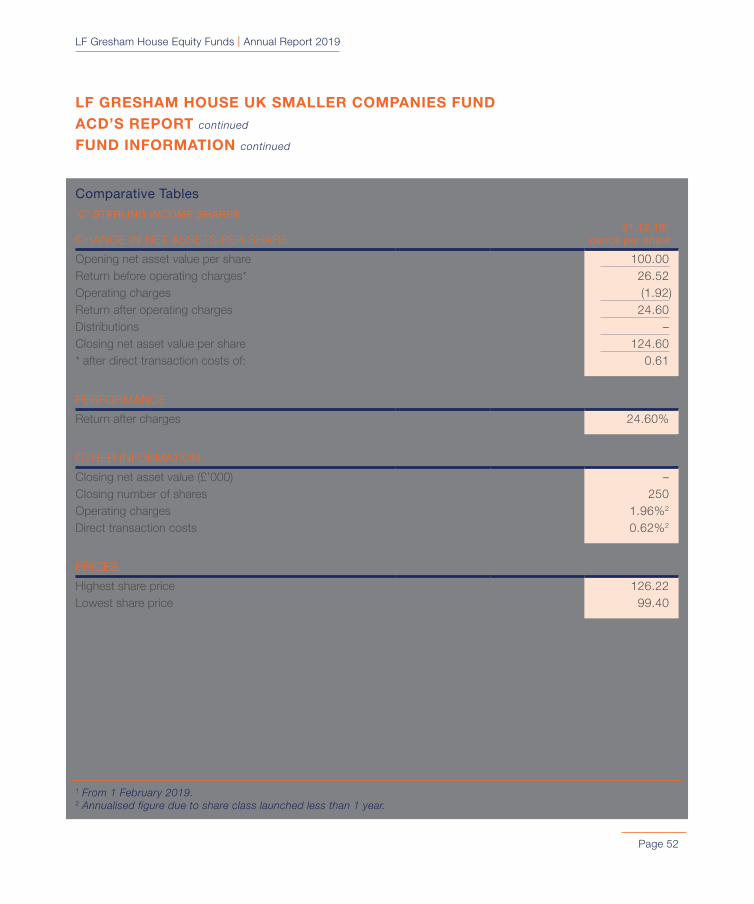
LF Gresham House Equity Funds | Annual Report 2019
Page 52
Comparative Tables
‘C’ STERLING INCOME SHARES
CHANGE IN NET ASSETS PER SHARE31.12.191
pence per share
Opening net asset value per share 100.00Return before operating charges* 26.52Operating charges (1.92)Return after operating charges 24.60 Distributions –Closing net asset value per share 124.60* after direct transaction costs of: 0.61
PERFORMANCE
Return after charges 24.60%
OTHER INFORMATION
Closing net asset value (£’000) –Closing number of shares 250 Operating charges 1.96%2
Direct transaction costs 0.62%2
PRICES
Highest share price 126.22Lowest share price 99.40
1 From 1 February 2019.2 Annualised figure due to share class launched less than 1 year.
LF GRESHAM HOUSE UK SMALLER COMPANIES FUND ACD’S REPORT continued
FUND INFORMATION continued

LF Gresham House Equity Funds | Annual Report 2019
Page 53
Comparative Tables continued
‘C’ STERLING ACCUMULATION SHARES
CHANGE IN NET ASSETS PER SHARE31.12.191
pence per share
Opening net asset value per share 100.00Return before operating charges* 26.95 Operating charges (1.93)Return after operating charges 25.02 Distributions (0.34)Retained distributions on
accumulation shares 0.34 Closing net asset value per share 125.02* after direct transaction costs of: 0.61
PERFORMANCE
Return after charges 25.02%
OTHER INFORMATION
Closing net asset value (£’000) 4,147 Closing number of shares 3,316,995 Operating charges 1.96%2
Direct transaction costs 0.62%2
PRICES
Highest share price 126.65Lowest share price 99.41
1 From 1 February 2019.2 Annualised figure due to share class launched less than 1 year.
LF GRESHAM HOUSE UK SMALLER COMPANIES FUND ACD’S REPORT continued
FUND INFORMATION continued

LF Gresham House Equity Funds | Annual Report 2019
Page 54
Fund PerformanceAs the Fund was launched less than one year ago, in accordance with FCA rules, no performance data is permitted to be reported.
Details of the distributions per share for the period are shown in the Distribution Table on page 71.
RISK WARNINGAn investment in an open-ended investment company should be regarded as a medium to long term investment. Investors should be aware that the price of shares and the income from them can fall as well as rise and investors may not receive back the full amount invested. Past performance is not a guide to future performance. Investments denominated in currencies other than the base currency are subject to fluctuation in exchange rates, which can be favourable or unfavourable.
LF GRESHAM HOUSE UK SMALLER COMPANIES FUND ACD’S REPORT continued
FUND INFORMATION continued
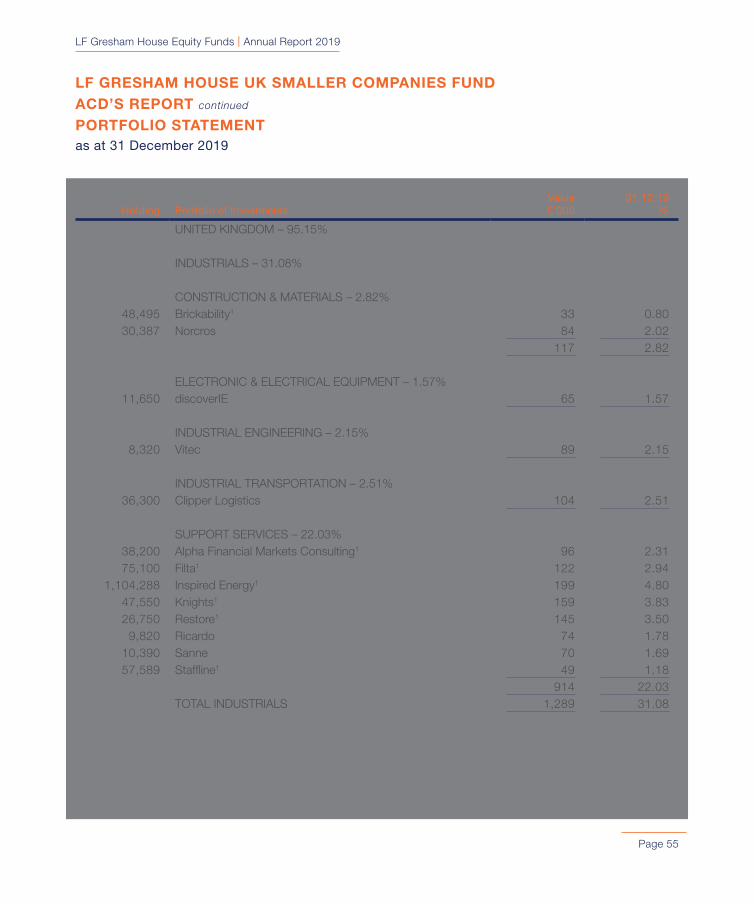
LF Gresham House Equity Funds | Annual Report 2019
Page 55
Holding Portfolio of InvestmentsValue£’000
31.12.19 %
UNITED KINGDOM – 95.15%
INDUSTRIALS – 31.08%
CONSTRUCTION & MATERIALS – 2.82%48,495 Brickability1 33 0.8030,387 Norcros 84 2.02
117 2.82
ELECTRONIC & ELECTRICAL EQUIPMENT – 1.57%11,650 discoverIE 65 1.57
INDUSTRIAL ENGINEERING – 2.15%8,320 Vitec 89 2.15
INDUSTRIAL TRANSPORTATION – 2.51%36,300 Clipper Logistics 104 2.51
SUPPORT SERVICES – 22.03%38,200 Alpha Financial Markets Consulting1 96 2.31 75,100 Filta1 122 2.94
1,104,288 Inspired Energy1 199 4.80 47,550 Knights1 159 3.83 26,750 Restore1 145 3.50
9,820 Ricardo 74 1.78 10,390 Sanne 70 1.69 57,589 Staffline1 49 1.18
914 22.03TOTAL INDUSTRIALS 1,289 31.08
LF GRESHAM HOUSE UK SMALLER COMPANIES FUND ACD’S REPORT continued
PORTFOLIO STATEMENTas at 31 December 2019

LF Gresham House Equity Funds | Annual Report 2019
Page 56
Holding Portfolio of InvestmentsValue£’000
31.12.19 %
CONSUMER GOODS – 11.67%
BEVERAGES – 1.13%3,020 Nichols1 47 1.13
FOOD PRODUCERS – 2.29%97,200 Finsbury Food1 95 2.29
HOUSEHOLD GOODS & HOME CONSTRUCTION – 5.31%16,380 IG Design1 116 2.80 42,950 Watkin Jones1 104 2.51
220 5.31
LEISURE GOODS – 2.94%1,995 Games Workshop 122 2.94
TOTAL CONSUMER GOODS 484 11.67
CONSUMER SERVICES – 21.08%
GENERAL RETAILERS – 2.63%26,700 B&M European Value Retail 109 2.63
MEDIA – 7.02%3,385 4imprint 118 2.85
15,300 Next Fifteen Communications1 80 1.93 48,800 S4 Capital 93 2.24
291 7.02
LF GRESHAM HOUSE UK SMALLER COMPANIES FUND ACD’S REPORT continued
PORTFOLIO STATEMENT continued
as at 31 December 2019

LF Gresham House Equity Funds | Annual Report 2019
Page 57
Holding Portfolio of InvestmentsValue£’000
31.12.19 %
TRAVEL & LEISURE – 11.43%25,600 Domino’s Pizza 82 1.98 54,580 Loungers1 115 2.77 56,990 TEN Entertainment 170 4.10 37,000 The Gym 107 2.58
474 11.43 TOTAL CONSUMER SERVICES 874 21.08
TELECOMMUNICATIONS – 1.76%
FIXED LINE TELECOMMUNICATIONS – 1.76%4,830 Telecom Plus 73 1.76
FINANCIALS – 17.17%
FINANCIAL SERVICES – 17.17%54,636 Argentex1 91 2.20 23,300 Brewin Dolphin 86 2.07 38,600 Impax Asset Management1 148 3.57 15,450 Mattioli Woods1 124 2.99 15,150 Mortgage Advice Bureau1 114 2.75
117,200 XPS Pensions 149 3.59 TOTAL FINANCIAL 712 17.17
HEALTH CARE – 4.70%
HEALTH CARE EQUIPMENT & SERVICES – 1.33% 41,321 Cello1 55 1.33
PHARMACEUTICALS & BIOTECHNOLOGY – 3.37%36,484 Ergomed1 140 3.37
TOTAL HEALTH CARE 195 4.70
LF GRESHAM HOUSE UK SMALLER COMPANIES FUND ACD’S REPORT continued
PORTFOLIO STATEMENT continued
as at 31 December 2019
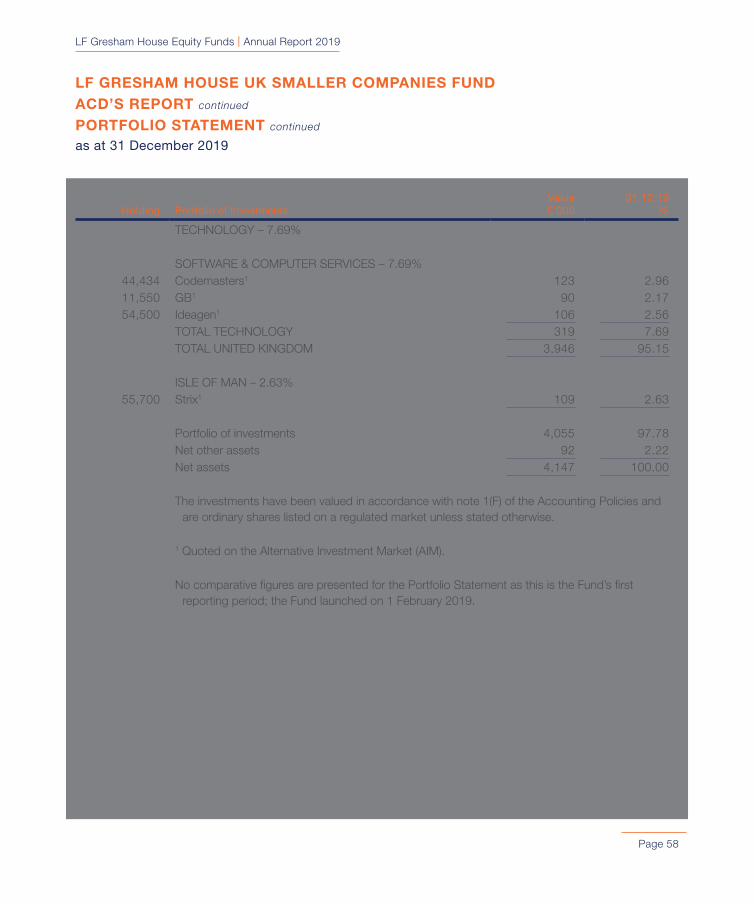
LF Gresham House Equity Funds | Annual Report 2019
Page 58
Holding Portfolio of InvestmentsValue£’000
31.12.19 %
TECHNOLOGY – 7.69%
SOFTWARE & COMPUTER SERVICES – 7.69%44,434 Codemasters1 123 2.96 11,550 GB1 90 2.17 54,500 Ideagen1 106 2.56
TOTAL TECHNOLOGY 319 7.69 TOTAL UNITED KINGDOM 3,946 95.15
ISLE OF MAN – 2.63%55,700 Strix1 109 2.63
Portfolio of investments 4,055 97.78 Net other assets 92 2.22 Net assets 4,147 100.00
The investments have been valued in accordance with note 1(F) of the Accounting Policies and are ordinary shares listed on a regulated market unless stated otherwise.
1 Quoted on the Alternative Investment Market (AIM).
No comparative figures are presented for the Portfolio Statement as this is the Fund’s first reporting period; the Fund launched on 1 February 2019.
LF GRESHAM HOUSE UK SMALLER COMPANIES FUND ACD’S REPORT continued
PORTFOLIO STATEMENT continued
as at 31 December 2019
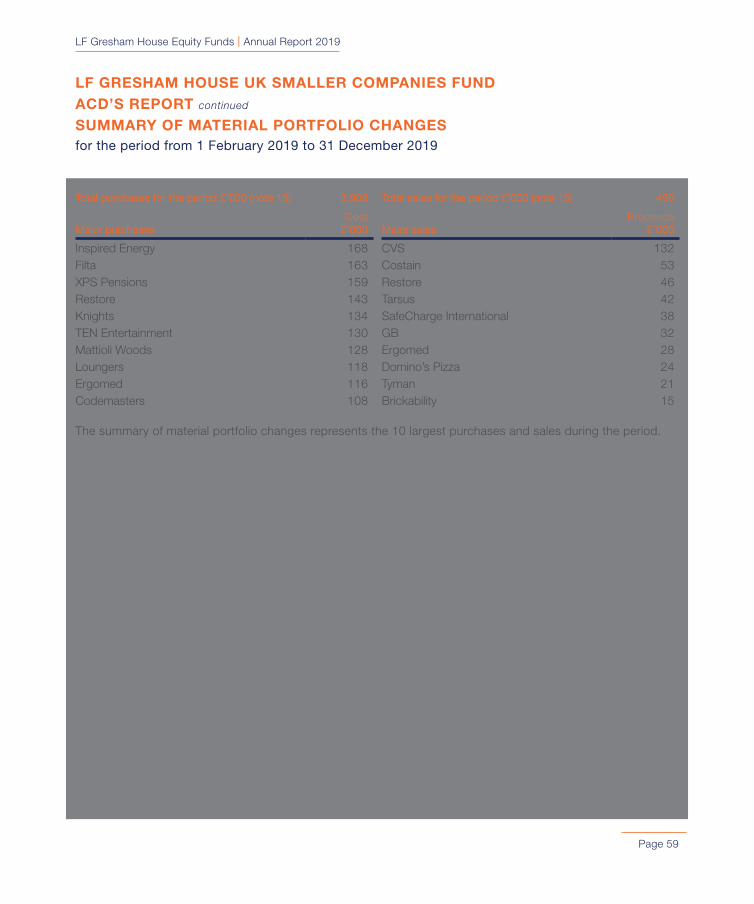
LF Gresham House Equity Funds | Annual Report 2019
Page 59
LF GRESHAM HOUSE UK SMALLER COMPANIES FUND ACD’S REPORT continued
SUMMARY OF MATERIAL PORTFOLIO CHANGESfor the period from 1 February 2019 to 31 December 2019
Total purchases for the period £’000 (note 15) 3,908
Major purchasesCost
£’000
Inspired Energy 168Filta 163XPS Pensions 159Restore 143Knights 134TEN Entertainment 130Mattioli Woods 128Loungers 118Ergomed 116Codemasters 108
Total sales for the period £’000 (note 15) 490
Major salesProceeds
£’000
CVS 132Costain 53Restore 46Tarsus 42SafeCharge International 38GB 32Ergomed 28Domino’s Pizza 24Tyman 21Brickability 15
The summary of material portfolio changes represents the 10 largest purchases and sales during the period.

LF Gresham House Equity Funds | Annual Report 2019
Page 60
Notes £’00031.12.19
£’000
Income: Net capital gains 3 635 Revenue 4 57 Expenses 5 (46) Net revenue before taxation 11 Taxation 6 –Net revenue after taxation 11 Total return before distributions 646 Distributions 7 (11) Change in net assets
attributable to shareholders from investment activities 635
STATEMENT OF CHANGE IN NET ASSETS ATTRIBUTABLE TO SHAREHOLDERSfor the period from 1 February 2019 to 31 December 2019
Note31.12.19
£’000
Opening net assets attributable to shareholders –
Amounts receivable on issue of shares 3,501
Change in net assets attributable to shareholders from investment activities 635
Retained distributions on Accumulation shares 7 11
Closing net assets attributable to shareholders 4,147
No comparative figures are presented for the Statement of Total Return and the Statement of Change in Net Asset Attributable to Shareholders as this is the Fund’s first reporting period; the Fund launched on 1 February 2019.
LF GRESHAM HOUSE UK SMALLER COMPANIES FUND FINANCIAL STATEMENTSSTATEMENT OF TOTAL RETURNfor the period from 1 February 2019 to 31 December 2019
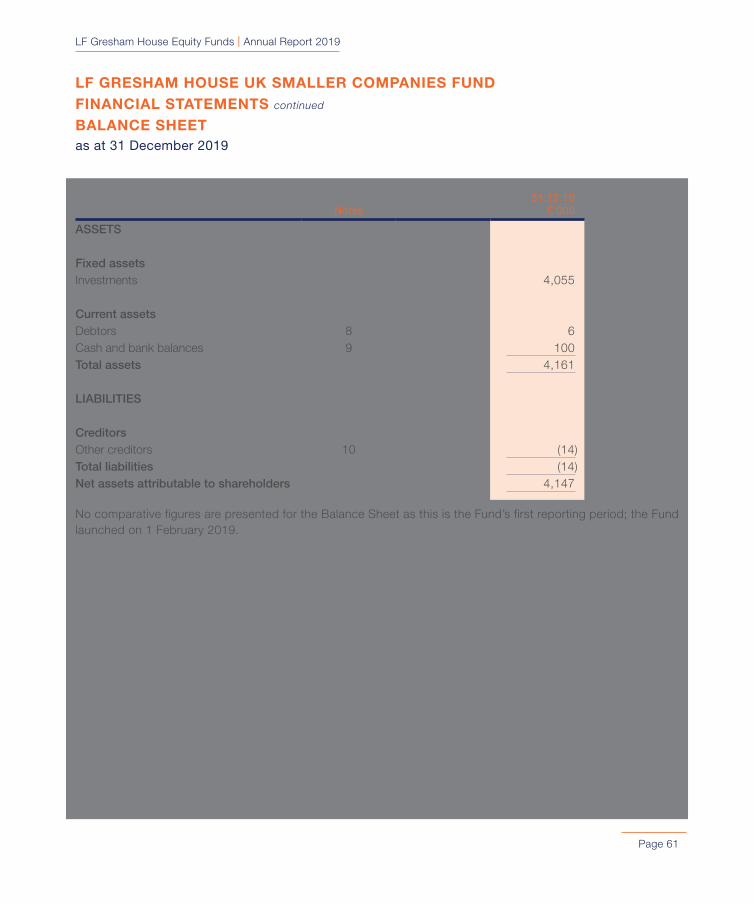
LF Gresham House Equity Funds | Annual Report 2019
Page 61
LF GRESHAM HOUSE UK SMALLER COMPANIES FUND FINANCIAL STATEMENTS continued
BALANCE SHEETas at 31 December 2019
Notes31.12.19
£’000
ASSETS
Fixed assetsInvestments 4,055
Current assetsDebtors 8 6 Cash and bank balances 9 100 Total assets 4,161
LIABILITIES
CreditorsOther creditors 10 (14) Total liabilities (14) Net assets attributable to shareholders 4,147
No comparative figures are presented for the Balance Sheet as this is the Fund’s first reporting period; the Fund launched on 1 February 2019.

LF Gresham House Equity Funds | Annual Report 2019
Page 62
LF GRESHAM HOUSE UK SMALLER COMPANIES FUND FINANCIAL STATEMENTS continued
NOTES TO THE FINANCIAL STATEMENTSfor the period from 1 February 2019 to 31 December 2019
1. Accounting Policies
The accounting policies described on pages 13 to 15 have been applied to the financial statements of the Fund in the current period.
2. Distribution Policies
The distribution policies described on page 15 have been applied to the financial statements of the Fund in the current period.
3. Net Capital Gains
The net capital gains during the period comprise:
01.02.19to 31.12.19
£’000
Non-derivative securities 637Transaction charges (2)Net capital gains 635
4. Revenue
01.02.19to 31.12.19
£’000
Non-taxable dividends 56Bank interest 1Total revenue 57
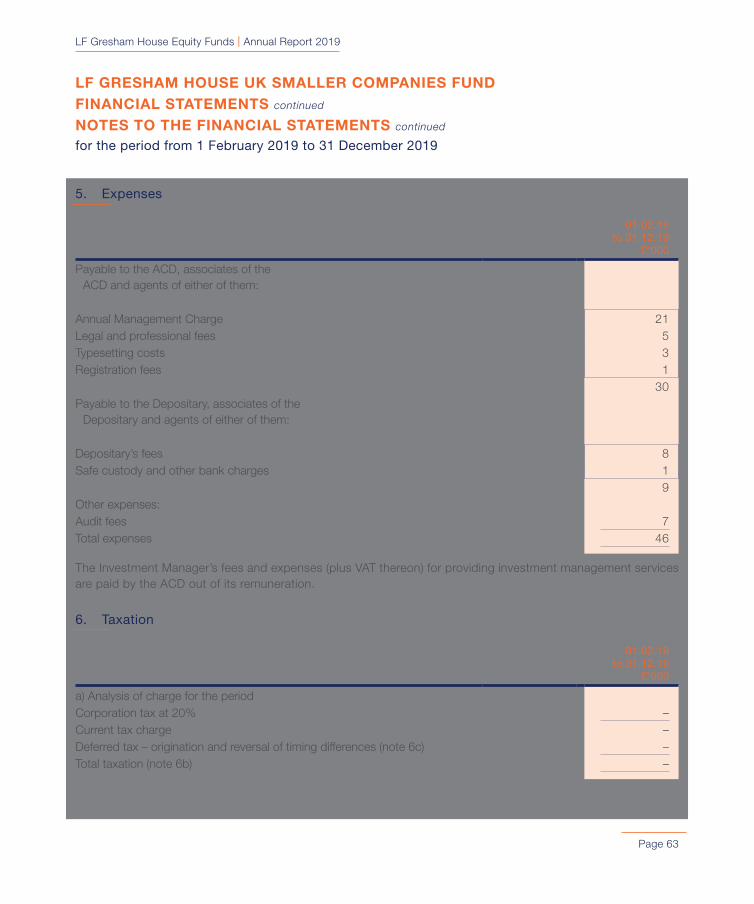
LF Gresham House Equity Funds | Annual Report 2019
Page 63
5. Expenses
01.02.19to 31.12.19
£’000
Payable to the ACD, associates of the ACD and agents of either of them:
Annual Management Charge 21Legal and professional fees 5Typesetting costs 3Registration fees 1
30Payable to the Depositary, associates of the
Depositary and agents of either of them:
Depositary’s fees 8Safe custody and other bank charges 1
9Other expenses:Audit fees 7Total expenses 46
The Investment Manager’s fees and expenses (plus VAT thereon) for providing investment management services are paid by the ACD out of its remuneration.
6. Taxation
01.02.19to 31.12.19
£’000
a) Analysis of charge for the periodCorporation tax at 20% –Current tax charge –Deferred tax – origination and reversal of timing differences (note 6c) –Total taxation (note 6b) –
LF GRESHAM HOUSE UK SMALLER COMPANIES FUND FINANCIAL STATEMENTS continued
NOTES TO THE FINANCIAL STATEMENTS continued
for the period from 1 February 2019 to 31 December 2019
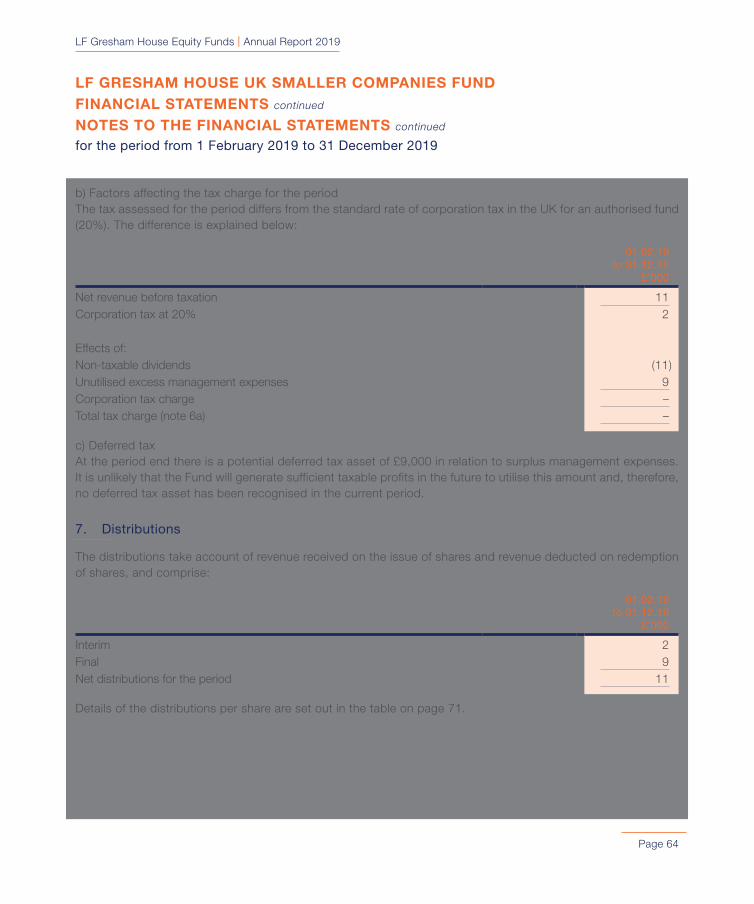
LF Gresham House Equity Funds | Annual Report 2019
Page 64
b) Factors affecting the tax charge for the periodThe tax assessed for the period differs from the standard rate of corporation tax in the UK for an authorised fund (20%). The difference is explained below:
01.02.19to 31.12.19
£’000
Net revenue before taxation 11Corporation tax at 20% 2
Effects of:Non-taxable dividends (11)Unutilised excess management expenses 9Corporation tax charge –Total tax charge (note 6a) –
c) Deferred taxAt the period end there is a potential deferred tax asset of £9,000 in relation to surplus management expenses. It is unlikely that the Fund will generate sufficient taxable profits in the future to utilise this amount and, therefore, no deferred tax asset has been recognised in the current period.
7. Distributions
The distributions take account of revenue received on the issue of shares and revenue deducted on redemption of shares, and comprise:
01.02.19to 31.12.19
£’000
Interim 2Final 9Net distributions for the period 11
Details of the distributions per share are set out in the table on page 71.
LF GRESHAM HOUSE UK SMALLER COMPANIES FUND FINANCIAL STATEMENTS continued
NOTES TO THE FINANCIAL STATEMENTS continued
for the period from 1 February 2019 to 31 December 2019
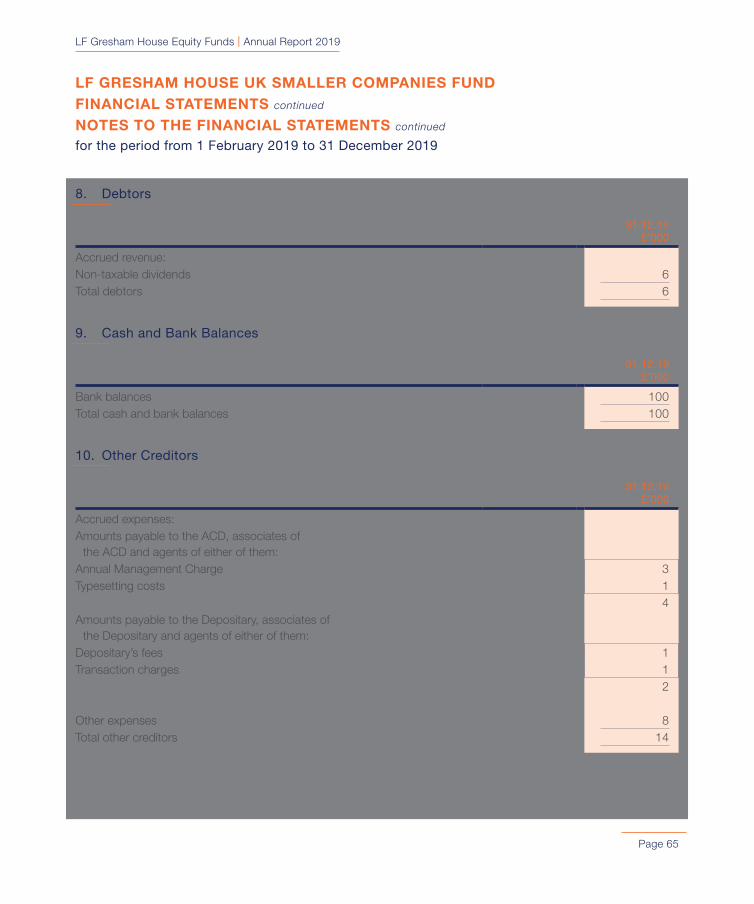
LF Gresham House Equity Funds | Annual Report 2019
Page 65
8. Debtors
31.12.19£’000
Accrued revenue:Non-taxable dividends 6Total debtors 6
9. Cash and Bank Balances
31.12.19£’000
Bank balances 100Total cash and bank balances 100
10. Other Creditors
31.12.19£’000
Accrued expenses:Amounts payable to the ACD, associates of
the ACD and agents of either of them:Annual Management Charge 3Typesetting costs 1
4Amounts payable to the Depositary, associates of
the Depositary and agents of either of them:Depositary’s fees 1Transaction charges 1
2
Other expenses 8Total other creditors 14
LF GRESHAM HOUSE UK SMALLER COMPANIES FUND FINANCIAL STATEMENTS continued
NOTES TO THE FINANCIAL STATEMENTS continued
for the period from 1 February 2019 to 31 December 2019

LF Gresham House Equity Funds | Annual Report 2019
Page 66
11. Related Party Transactions
The Annual Management Charge and legal and professional fees payable to Link Fund Solutions Limited (‘the ACD’), registration fees payable to Link Fund Administrators Limited and typesetting costs payable to Link Alternative Fund Administrators Limited (both companies are associates of the ACD) are disclosed in note 5 and amounts due at the period end are disclosed in note 10.
The aggregate monies received by the ACD through the issue of shares and paid on redemption of shares are disclosed in the Statement of Change in Net Assets Attributable to Shareholders on page 60. There are no outstanding amounts at the balance sheet date.
A shareholder may be able to exercise significant influence over the financial and operating policies of the Fund and as such is deemed to be a related party. At the balance sheet date the following shareholder held in excess of 20% of the shares in issue of the Fund:
Baronsmead Second Venture Trust 69.85%
12. Contingent Liabilities and Commitments
There are no contingent liabilities or unrecorded outstanding commitments.
13. Shares in Issue
‘C’Sterling
Accumulation
‘C’Sterling Income
Annual Management Charge 0.90% 0.90%
Opening shares in issue – –Issues 3,316,995 250Redemptions – –Closing shares in issue 3,316,995 250
14. Risk Management Policies
In pursuing the investment objective a number of financial instruments are held which may comprise securities and other investments, cash balances and debtors and creditors that arise directly from operations. Derivatives, such as futures or forward currency contracts, may be utilised for Efficient Portfolio Management (including hedging) purposes.
LF GRESHAM HOUSE UK SMALLER COMPANIES FUND FINANCIAL STATEMENTS continued
NOTES TO THE FINANCIAL STATEMENTS continued
for the period from 1 February 2019 to 31 December 2019

LF Gresham House Equity Funds | Annual Report 2019
Page 67
The main risks from the Fund’s holding of financial instruments, together with the ACD’s policy for managing these risks, are set out below:
The ACD has in place a Risk Management Policy and Procedures Document (‘RMPPD’) that sets out the risks that may impact a fund and how the ACD seeks, where appropriate, to manage, monitor and mitigate those risks, and in particular those risks associated with the use of derivatives. The RMPPD sets out both the framework and the risk mitigations operated by the ACD in managing the identified risks of the Fund. The ACD requires that the appointed Investment Manager to the Fund has in place its own governance structure, policies and procedures that are commensurate with its regulatory obligations and the risks posed by the fund managed.
(A) CREDIT RISK
Credit risk is the risk that a counterparty may be unable or unwilling to make a payment or fulfil contractual obligations. This may be in terms of an actual default or by deterioration in a counterparty’s credit quality.
Certain transactions in securities that the Fund enters into expose it to the risk that the counterparty will not deliver the investment for a purchase, or cash for a sale after the Fund has fulfilled its obligations. As part of its due diligence process, the ACD undertakes a review of the controls operated over counterparties by the Investment Manager, including initial and ongoing due diligence and business volumes placed with each counterparty. In cases which are dependent on the counterparty settling at the transaction’s maturity date, the ACD has policies in place which set out the minimum credit quality expected of a market counterparty or deposit taker at the outset of the transaction.
(B) INTEREST RATE RISK
Interest rate risk is the risk that the value of the Fund’s investments will fluctuate as a result of interest rate changes. The value of fixed interest securities may be affected by changes in interest rates, either globally or locally. Changes in the rate of return in one asset class may influence the valuation basis of other classes. The amount of revenue receivable from floating rate investments and bank balances or payable on bank overdrafts will be affected by fluctuations in interest rates.
As the Fund seeks to obtain its return from investing in equities and has no material exposure to interest rate risk, no interest rate risk table or sensitivity analysis has been presented.
(C) FOREIGN CURRENCY RISK
Foreign currency risk is the risk that the Sterling value of investments will fluctuate as a result of exchange rate movements. Assets denominated in currencies other than Sterling will provide direct exposure to currency risk as a consequence of the moment in foreign exchange rates when calculating the Sterling equivalent value.
The Fund does not have any significant exposure to foreign currency risk, and therefore no foreign currency table or sensitivity analysis has been presented.
LF GRESHAM HOUSE UK SMALLER COMPANIES FUND FINANCIAL STATEMENTS continued
NOTES TO THE FINANCIAL STATEMENTS continued
for the period from 1 February 2019 to 31 December 2019
LF Gresham House Equity Funds | Annual Report 2019
Page 68
(D) LEVERAGE
The Fund did not employ any significant leverage during the current period.
(E) LIQUIDITY RISK
The main liability of the Fund is the redemption of any shares that investors want to sell. Investments may have to be sold to fund such redemptions should insufficient cash be held at the bank to meet this obligation.
The ACD monitors the liquidity profile of the Fund on a daily basis. In assessing the liquidity profile of the Fund, the ACD assesses how much of the Fund can be realised in one and five days, under normal and stressed market conditions, and the impact this would have on the overall subsequent liquidity profile. In assessing the liquidity of a company’s shares, the ACD utilises the lower of the 6 and 12 month average market volume of that company’s shares. Where a risk is identified then a more in depth review is undertaken to establish its significance, by assessing the liquidity profile of the Fund against a 25% market participation of the average daily volume. Based on this analysis 94.28% of the portfolio can be liquidated within 5 days and 94.28% within 30 days. Given this and the ACD’s understanding of the investor base, it is considered that the liquidity profile of the Fund is appropriate.
All financial liabilities are payable in one year or less, or on demand.
(F) MARKET PRICE RISK
Market price risk is the risk that the value of the Fund’s financial instruments will fluctuate as a result of changes in market prices caused by factors other than interest rate or foreign currency movement. Market price risk arises primarily from uncertainty about the future prices of financial instruments that the Fund holds.
Market price risk represents the potential loss the Fund may suffer through holding market positions in the face of price movements. The Fund’s investment portfolio is exposed to price fluctuations, which are monitored by the ACD in pursuance of the investment objective and policy. The risk is generally regarded as consisting of two elements – stock specific risk and market risk. Adhering to investment guidelines and avoiding excessive exposure to one particular issuer can limit stock specific risk. Subject to compliance with the investment objective, spreading exposure across a broad range of global stocks can mitigate market risk.
A 5% increase in the value of the Fund’s portfolio would have the effect of increasing the return and net assets by £203,000. A 5% decrease would have an equal and opposite effect.
(G) DERIVATIVES
The Fund held no derivatives during the current period.
LF GRESHAM HOUSE UK SMALLER COMPANIES FUND FINANCIAL STATEMENTS continued
NOTES TO THE FINANCIAL STATEMENTS continued
for the period from 1 February 2019 to 31 December 2019

LF Gresham House Equity Funds | Annual Report 2019
Page 69
15. Portfolio Transaction Costs
31.12.19
Purchases/sales beforetransaction
costs£’000
Commissions£’000
Taxes£’000
Grosspurchases/
net sales£’000
Ordinary shares 3,894 7 7 3,908Purchases total 3,894 7 7 3,908
Transaction cost % of purchases total 0.18% 0.18%Transaction cost % of average NAV 0.27% 0.26%
Ordinary shares 491 (1) – 490Sales total 491 (1) – 490
Transaction cost % of sales total 0.19% –Transaction cost % of average NAV 0.03% –
Average portfolio dealing spread at 31.12.19 is 2.36%.
16. Fair Value Hierarchy
Investments are categorised into the following levels based on their fair value measurement:
Level 1: Unadjusted quoted price in an active market for an identical instrument;
Level 2: Valuation techniques using observable inputs other than quoted prices within Level 1;
Level 3: Valuation techniques using unobservable inputs (see note 1(F) of the Accounting Policies).
31.12.19Level 1
£’000Level 2
£’000Level 3
£’000Total
£’000
Investment assets 4,055 – – 4,055
LF GRESHAM HOUSE UK SMALLER COMPANIES FUND FINANCIAL STATEMENTS continued
NOTES TO THE FINANCIAL STATEMENTS continued
for the period from 1 February 2019 to 31 December 2019

LF Gresham House Equity Funds | Annual Report 2019
Page 70
17. Subsequent Events
On 11 March 2020 the World Health Organisation declared the COVID-19 outbreak a pandemic. As a result, global markets have experienced a period of volatility which has impacted the performance of the Fund since the balance sheet date. The length of time the volatility remains will largely depend on the scale and duration of the outbreak. The spread and impact of COVID-19 is considered as a non-adjusting event after the reporting period.
Since the balance sheet date, the price of each of the Fund’s share classes has moved as follows:
Share classBalance sheet
date 12.06.20 Movement
‘C’ Sterling Income 126.22 101.90 (19.27)%‘C’ Sterling Accumulation 126.65 102.49 (19.08)%
LF GRESHAM HOUSE UK SMALLER COMPANIES FUND FINANCIAL STATEMENTS continued
NOTES TO THE FINANCIAL STATEMENTS continued
for the period from 1 February 2019 to 31 December 2019

LF Gresham House Equity Funds | Annual Report 2019
Page 71
EQUALISATIONEqualisation applies only to shares purchased during the distribution period (Group 2 shares – the applicable distribution periods for each distribution are shown below). It represents the accrued revenue included in the purchase price of the shares. After averaging it is returned with the distribution as a capital repayment. It is not liable to Income Tax but must be deducted from the cost of the shares for Capital Gains Tax purposes.
Group 2 Interim Final
From 01.02.191 01.07.19To 30.06.19 31.12.19
‘C’ STERLING ACCUMULATION SHARES
Interim Net Revenue EqualisationAllocated 31.08.19
Group 1 0.0561 – 0.0561 Group 2 0.0561 0.0000 0.0561
Final Net Revenue EqualisationAllocation
29.02.20
Group 1 0.2848 – 0.2848 Group 2 0.2848 0.0000 0.2848
No comparative figures as the Fund launched 1 February 2019.
No distribution in the current period for ‘C’ Sterling Income shares.
1 The Fund launched 1 February 2019.
LF GRESHAM HOUSE UK SMALLER COMPANIES FUND FINANCIAL STATEMENTS continued
DISTRIBUTION TABLEfor the period from 1 February 2019 to 31 December 2019 – in pence per share

LF Gresham House Equity Funds | Annual Report 2019
Page 72
GENERAL INFORMATION
Structure of LF Gresham House Equity FundsThe Company is structured as an umbrella company, in that different sub-funds may be established from time to time by the ACD with the approval of the FCA. On the introduction of any new sub-fund or class, a revised Prospectus will be prepared setting out the relevant details of each sub-fund or class.
The Company is a UCITS scheme for the purposes of the Regulations.
The assets of each sub-fund will be treated as separate from those of every other sub-fund and will be invested in accordance with the investment objective and investment policy applicable to that sub-fund. Investment of the assets of each of the sub-funds must comply with the COLL Sourcebook and the investment objective and policy of the relevant sub-fund. The sub-funds currently available are:
LF Gresham House UK Multi Cap Income FundLF Gresham House UK Smaller Companies Fund (launched 1 February 2019)
In the future there may be other sub-funds of the Company.
Valuation PointThe current valuation point of the Company is 12.00 noon (London time) on each business day. Valuations may be made at other times under the terms contained within the Prospectus.
Buying and Selling SharesThe ACD will accept orders to deal in the shares on normal business days between 8.30am and 5.30pm (London time) and transactions will be effected at prices determined by the following valuation. Instructions to buy or sell shares may be either in writing to: PO Box 389, Darlington DL1 9UF or by telephone on 0345 922 0044.
PricesThe prices of all shares are published on every dealing day on the website of the ACD: www.linkfundsolutions.co.uk. The prices of shares may also be obtained by calling 0345 922 0044 during the ACD’s normal business hours.
Other InformationThe Instrument of Incorporation, Prospectus, Key Investor Information Document and the most recent interim and annual reports may be inspected at the office of the ACD which is also the Head Office. Copies of these may be obtained upon application and, excepting the Instrument of Incorporation, can be found on the ACD’s website, www.linkfundsolutions.co.uk.
Shareholders who have any complaints about the operation of the Company should contact the ACD or the Depositary in the first instance. In the event that a shareholder finds the response unsatisfactory they may make their complaint direct to the Financial Ombudsman Service at Exchange Tower, London E14 9SR.
LF Gresham House Equity Funds | Annual Report 2019
Page 73
GENERAL INFORMATION continued
Data Protection ActShareholders’ names will be added to a mailing list which may be used by the ACD, its associates or third parties to inform investors of other products by sending details of such products. Shareholders who do not want to receive such details should write to the ACD requesting their removal from any such mailing list.

6th Floor, 65 Gresham Street, London EC2V 7NQ
www
0870 607 2555
linkfundsolutions.co.uk
0870 607 2550
Part of Link Group