lexisnexis workplace productivity survey · workplace productivity survey prepared by worldone...
TRANSCRIPT

1
LexisNexis Workplace Productivity Survey
Prepared by WorldOne Research

2
Contents
1. Methodology, Sampling and Quotas
2. Screen
3. Situation
4. Consequences
5. Solution
6. Legal Professionals Only
7. Demographics

3
Methodology, Sampling and Quotas
Methodology - WorldOne has utilised a CAWI approach for this project.
The survey is scripted to be web friendly, which will ensure respondents fill in the survey via the internet by themselves.
This study is conducted in the USA only
Target samples are all white collar workers including 250 legal professionals and 400 non-legal professionals.
Total sample size is 650.
Survey concluded December 2007

4
Contents
1. Methodology, Sampling and Quotas
2. Screen
3. Situation
4. Consequences
5. Solution
6. Legal Professionals Only
7. Demographics

5
Q1. Are you currently? (employment status)
Base size: Total =650; Legal professionals = 250; Non-legal professionals =400
All respondents are employed full time.
There is no significant difference between the two groups.

6
Q2. Which of the following best describes your current position?
Base size: Total =650; Legal professionals = 250; Non-legal professionals =400
All respondents are white collar or knowledge workers.
100% 100% 100%
0%
10%
20%
30%
40%
50%
60%
70%
80%
90%
100%
Total Legal professionals Non-legal professionals
Administrative or office support staff
White collar or knowledge worker
There is no significant difference between the two groups.

7
0.5%
0.5%
3.2%
1.1%
0.2%
0.2%
0.3%
2.6%
26.5%
0.9%
0.6%
3.8%2.6%
2.9%
44.8%0.3%
2.3%
0.6%1.1%
0.6%
0.5%
2.5%
0.8%
0.8%
0% 20% 40% 60% 80% 100%
Aerospace/Defense
Biotechnology
Consulting (IT-related)
Consulting (non-computer related)
Consumer Package Goods
Computer distributor / wholesaler/ retailer
Computer manufacturer (hardware, peripherals, etc.)
Computer software developer
Education
Engineering / architecture / construction
Entertainment / recreation / hospitality / food services
Financial Services (banking / accounting / insurance)
Government
Healthcare / medical
Legal
Life Sciences
Manufacturer (non-computer related)
Media / marketing / advertising / PR
Retailer / distributor / wholesaler (non-computer related)
Transportation / utilities / communications
Pharmaceuticals
Professional Services
Real Estate
Telecommunication
Total
Q3. Which of the following best describes the sector in which you are currently employed? – Total
All legal professionals are employed in the legal sector, while non-legal professionals are spread around different sectors.
Base size: Total =650; Legal professionals = 250; Non-legal professionals =400

8
0.8%0.8%
5.3%
1.8%
0.3%0.3%
0.5%
4.3%43.0%
1.5%
1.0%
6.3%4.3%
4.8%
0.5%
3.8%
1.0%1.8%
1.0%
0.8%
4.0%1.3%
1.3%
10.3%
0% 20% 40% 60% 80% 100%
Aerospace/ Def ense
Biot echnology
Consult ing (IT-relat ed)
Consult ing (non-comput er relat ed)
Consumer Package Goods
Comput er dist r ibut or / wholesaler/ ret ailer
Comput er manuf act urer (hardware, peripherals, et c.)
Comput er sof t ware developer
Educat ion
Engineering / archit ect ure / const ruct ion
Ent ert ainment / recreat ion / hospit alit y / f ood services
Financial Services (banking / account ing / insurance)
Government
Healt hcare / medical
Legal
Lif e Sciences
Manuf act urer (non-comput er relat ed)
Media / market ing / advert ising / PR
Ret ailer / dist r ibut or / wholesaler (non-comput er relat ed)
Transport at ion / ut ilit ies / communicat ions
Pharmaceut icals
Prof essional Services
Real Est at e
Telecommunicat ion
Non-legalprofessionals
Q3. Which of the following best describes the sector in which you are currently employed? – Non-legal professionals
Base size: Total =650; Legal professionals = 250; Non-legal professionals =400

9
100.0%
0% 20% 40% 60% 80% 100%
Legal
Legalprofessionals
Q3. Which of the following best describes the sector in which you are currently employed? – Legal professionals
Base size: Total =650; Legal professionals = 250; Non-legal professionals =400

10
Most respondents will describe themselves as professionals, especially the legal segment.
Q4. Which of the following best describes your current position?
Base size: Total =650; Legal professionals = 250; Non-legal professionals =400
65.1%
79.6%
56.0%
3.2%
11.1%
17.3%
1.8%
4.6%
4.0%
5.0%
2.8%
3.8% 5.8%
4.6%6.8%
5.2%9.2%
2.8%
1.3%
2.0%
0.4%
0.8%
0.6%
1.2%
1.1%
0.4%
1.8%
0.8%1.2%
0%
10%
20%
30%
40%
50%
60%
70%
80%
90%
100%
Total Legal professionals Non-legalprofessional
Junior associate
Middle management
Manager
Vice President (includingSenior Vice President,Executive Vice President) Director (including ManagingDirector, Associate Director)
Human resources
IT
Finance
Office management
Professional
:Significantly higher than legal professionals :Significantly lower than legal professionals
11
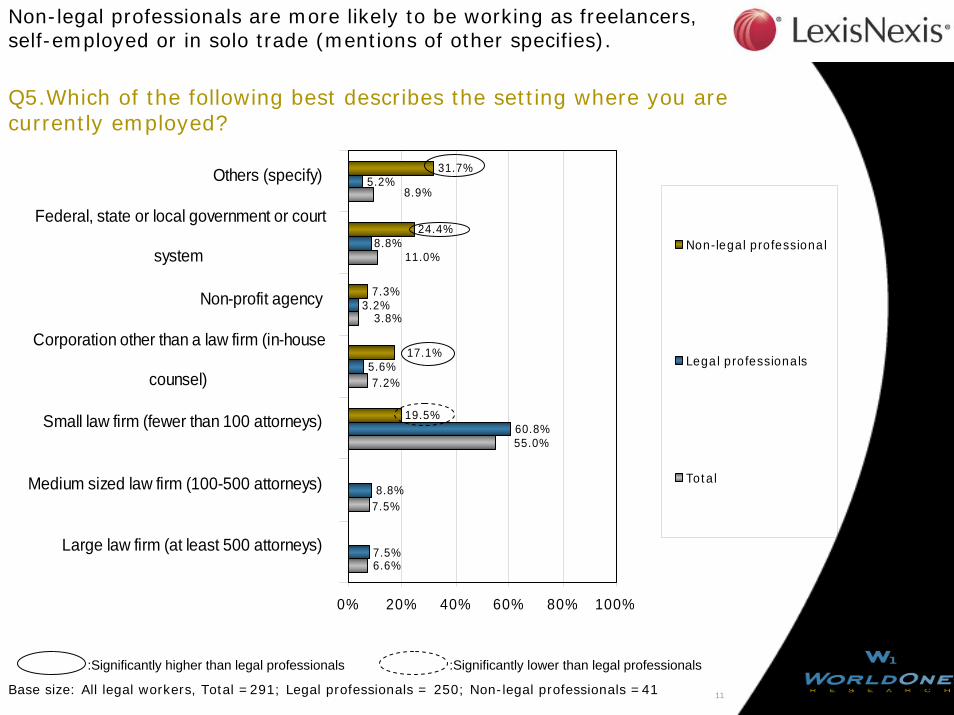
Non-legal professionals are more likely to be working as freelancers, self-employed or in solo trade (mentions of other specifies).
Q5.Which of the following best describes the setting where you are currently employed?
Base size: All legal workers, Total =291; Legal professionals = 250; Non-legal professionals =41
7.5%
8.8%
60.8%
5.6%
3.2%
5.2%
19.5%
7.3%
24.4%
31.7%
8.9%
11.0%
3.8%
7.2%
55.0%
7.5%
6.6%
8.8%
17.1%
0% 20% 40% 60% 80% 100%
Large law firm (at least 500 attorneys)
Medium sized law firm (100-500 attorneys)
Small law firm (fewer than 100 attorneys)
Corporation other than a law firm (in-house
counsel)
Non-profit agency
Federal, state or local government or court
system
Others (specify)
Non-legal professional
Legal professionals
Total
:Significantly higher than legal professionals :Significantly lower than legal professionals

12
Q6. Which of the following best describes your current position?
Q6 is asked for respondents working in the legal sector only; 41respondents working in the legal sector do not fit into any of the given positions, therefore, were not counted as legal professionals.
40.8%
28.4%
27.6%
2.0%
1.2%
100.0%
35.1%
24.4%
23.7%
1.7%
1.0%
14.1%
0% 20% 40% 60% 80% 100%
Associate
Partner
Paralegal
Legal secretary
Law librarian
None of these
Non-legalprofessional
Legalprofessionals
Total
Base size: All legal workers, Total =291; Legal professionals = 250; Non-legal professionals =41
:Significantly higher than legal professionals

13
Contents
1. Methodology, Sampling and Quotas
2. Screen
3. Situation
4. Consequences
5. Solution
6. Legal Professionals Only
7. Demographics

14
Legal professionals spend more hours conducting online research.
Q7. During the average workday, how many hours would you estimatethat you spend performing each of the following tasks? Conducting online research using Yahoo, Google, or other research tools such as LexisNexis or Factiva
Base size: Total =650; Legal professionals = 250; Non-legal professionals =400
41.5%
26.4%
51.0%
27.4%
26.4%
28.0%
22.3%
36.4%
13.5%
5.1% 6.4%4.3%
3.7% 4.4% 3.3%
0%
10%
20%
30%
40%
50%
60%
70%
80%
90%
100%
Total Legal professionals Non-legal professionals
6 or more
4 - less than 6
2 - less than 4
1 - less than 2
Less than 1hour
Mean 2.28 2.70 2.02:Significantly higher than legal professionals :Significantly lower than legal professionals

15
Legal professionals spend more hours conducting offline research.
Q7. During the average workday, how many hours would you estimate that you spend performing each of the following tasks? Conducting offline research using books or documents
Base size: Total =650; Legal professionals = 250; Non-legal professionals =400
24.5%
25.2%
24.0%
12.3%16.8%
9.5%
2.9% 3.2%2.8%
52.0%58.5%
62.5%
2.8% 1.3%1.8%
0%
10%
20%
30%
40%
50%
60%
70%
80%
90%
100%
Total Legal professionals Non-legal professionals
6 or more
4 - less than 6
2 - less than 4
1 - less than 2
Less than 1 hour
Mean 1.78 1.99 1.65:Significantly higher than legal professionals :Significantly lower than legal professionals

16
Both segments spend a similar amount of time attending meetings.
Q7. During the average workday, how many hours would you estimate that you spend performing each of the following tasks? Attending meetings
Base size: Total =650; Legal professionals = 250; Non-legal professionals =400
44.5% 44.0% 44.8%
28.0%33.2%
24.8%
21.8%18.4%
24.0%
4.2% 3.2% 4.7%
1.5% 1.2% 1.7%
0%
10%
20%
30%
40%
50%
60%
70%
80%
90%
100%
Total Legal professionals Non-legalprofessionals
6 or more
4 - less than 6
2 - less than 4
1 - less than 2
less than 1
Mean 2.08 1.99 2.14:Significantly lower than legal professionals

17
Legal professionals spend more time searching for documents and emails.
Q7. During the average workday, how many hours would
Base size: Total =650; Legal professionals = 250; Non-legal professionals =400
57.7%
47.6%
64.0%
26.2%
32.8%
22.0%
11.8% 16.0%9.3%
2.9% 2.4% 3.3%
1.5%1.2%1.4%
0%
10%
20%
30%
40%
50%
60%
70%
80%
90%
100%
Total Legal professionals Non-legal professionals
6 or more
4 - less than 6
2 - less than 4
1 - less than 2
less than 1 hour
Mean 1.75 1.87 1.67:Significantly higher than legal professionals :Significantly lower than legal professionals
you estimate that you spend performing each of the following tasks? Searching for documents or emails created previously

18
56.8% 53.6%58.8%
22.5%24.8%
21.0%
8.3% 9.2% 7.8%
6.0% 5.6% 6.2%
6.5% 6.8% 6.2%
0%
10%
20%
30%
40%
50%
60%
70%
80%
90%
100%
Total Legal professionals Non-legal professionals
100 or more
76-100
51-75
26-50
25 or fewer
Mean 36.72 36.73 36.71
Both segments receive a similar amount of work-related emails per day.
There is no significant difference between the two groups.
Base size: Total =650; Legal professionals = 250; Non-legal professionals =400
Q8. During the average workday, how many work-relatede-mails would you estimate that you receive?
19
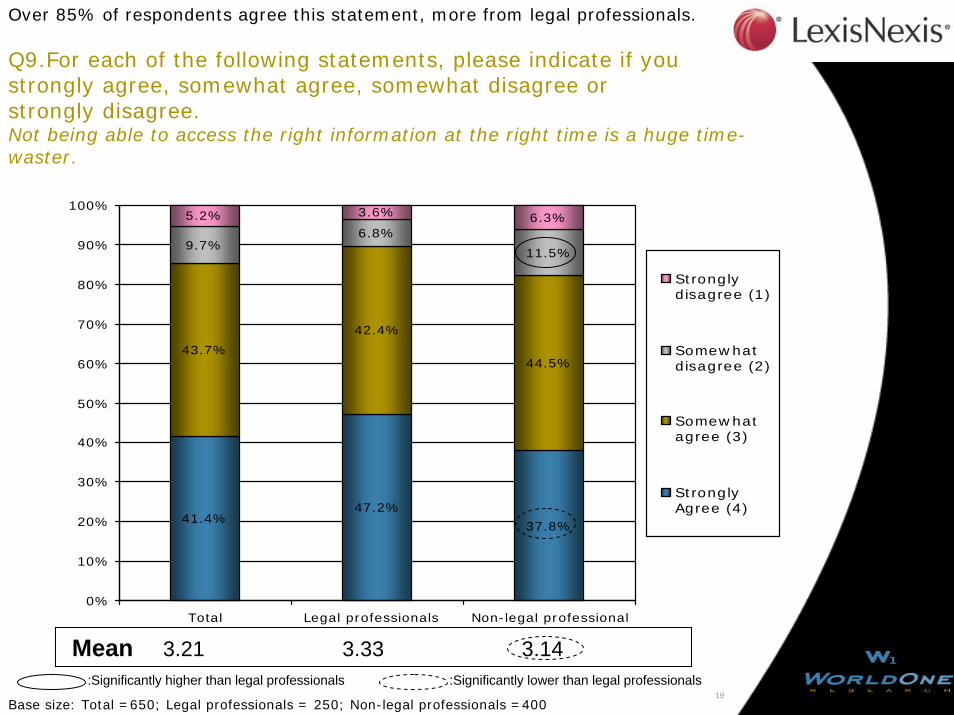
Over 85% of respondents agree this statement, more from legal professionals.
Q9.For each of the following statements, please indicate if you strongly agree, somewhat agree, somewhat disagree or strongly disagree. Not being able to access the right information at the right time is a huge time-waster.
Base size: Total =650; Legal professionals = 250; Non-legal professionals =400
41.4%47.2%
37.8%
43.7%
42.4%
44.5%
9.7%6.8%
11.5%
5.2% 3.6% 6.3%
0%
10%
20%
30%
40%
50%
60%
70%
80%
90%
100%
Total Legal professionals Non-legal professional
Stronglydisagree (1)
Somewhatdisagree (2)
Somewhatagree (3)
StronglyAgree (4)
Mean 3.21 3.33 3.14:Significantly higher than legal professionals :Significantly lower than legal professionals

20
Q10. Level of agreement with the following statement: People like me are increasingly overloaded by the amount of information theyhave to deal with in their jobs.
Base size: Total =650; Legal professionals = 250; Non-legal professionals =400
25.5% 26.8% 24.8%
46.9%50.4%
44.8%
18.9%16.8%
20.2%
8.6% 6.0%10.2%
0%
10%
20%
30%
40%
50%
60%
70%
80%
90%
100%
Total Legal professionals Non-legal professional
Stronglydisagree (1)
Somewhatdisagree (2)
Somewhatagree (3)
StronglyAgree (4)
Mean 2.89 2.98 2.84:Significantly lower than legal professionals
72% of respondents agree with information overload, more from legal professional.

21
Despite the previous complaints, 59% of respondents do NOT believe they will break down.
Q11. Level of agreement with the following statement: If the amount of information I receive continues to increase, I will soon reach a breaking point where I can't handle any more information.
Base size: Total =650; Legal professionals = 250; Non-legal professionals =400
10.4% 7.6%12.3%
30.7% 34.4% 28.5%
37.7% 38.4%37.3%
21.2% 19.6% 22.0%
0%
10%
20%
30%
40%
50%
60%
70%
80%
90%
100%
Total Legal professionals Non-legal professional
Stronglydisagree (1)
Somewhatdisagree (2)
Somewhatagree (3)
StronglyAgree (4)
Mean 2.31 2.30 2.31There is no significant difference between the two groups.

22
62% of respondents agree time is wasted on finding information, more from legal professionals.
Q12. Level of agreement with the following statement: I spend a lot of time sifting through irrelevant informationto find what I need.
Base size: Total =650; Legal professionals = 250; Non-legal professionals =400
19.4% 20.0% 19.0%
42.8%48.4%
39.3%
26.5%22.8%
28.8%
11.4% 8.8%13.0%
0%
10%
20%
30%
40%
50%
60%
70%
80%
90%
100%
Total Legal professionals Non-legal professional
Stronglydisagree (1)
Somewhatdisagree (2)
Somewhatagree (3)
StronglyAgree (4)
Mean 2.70 2.80 2.64:Significantly lower than legal professionals

23
Q13. Level of agreement with the following statement: I wish I could spend less time organizing information, and more time using the information that comes my way.
Base size: Total =650; Legal professionals = 250; Non-legal professionals =400
22.5% 22.0% 22.8%
45.7% 44.8% 46.3%
24.2% 25.6% 23.3%
7.7% 7.6% 7.6%
0%
10%
20%
30%
40%
50%
60%
70%
80%
90%
100%
Total Legal professionals Non-legal professional
Stronglydisagree (1)
Somewhatdisagree (2)
Somewhatagree (3)
StronglyAgree (4)
Mean 2.83 2.81 2.84There is no significant difference between the two groups.

24
More legal professionals have information management software.
Q14. Level of agreement with the following statement: I do not have the information management software I need to efficiently manage the information I receive.
Base size: Total =650; Legal professionals = 250; Non-legal professionals =400
9.4% 8.8% 9.8%
28.9% 30.4% 28.0%
38.9%44.0%
35.8%
22.8%16.8%
26.5%
0%
10%
20%
30%
40%
50%
60%
70%
80%
90%
100%
Total Legal professionals Non-legal professionals
Stronglydisagree (1)
Somewhatdisagree (2)
Somewhatagree (3)
StronglyAgree (4)
Mean 2.25 2.31 2.21:Significantly higher than legal professionals :Significantly lower than legal professionals

25
Q15. Approximately how many hours do you work at your job in a typical workday?
Legal professionals work slightly longer than non-legal, but there is no significant difference.
8.5% 7.6% 9.0%
36.5%29.6%
40.8%
24.6%
26.8%
23.3%
18.6%21.2%
17.0%
8.8% 11.6%7.1%
2.5% 2.3%2.8%
0.5% 0.4% 0.5%
0%
10%
20%
30%
40%
50%
60%
70%
80%
90%
100%
Total Legal professionals Non-legal professionals
19-24
11-18
10
9
8
7
1-6
Mean 8.89 9.02 8.81
Base size: Total =650; Legal professionals = 250; Non-legal professionals =400
:Significantly higher than legal professionals

26
Q16. In a typical day, what percentage of your working hours are spent receiving and managing information and what percentage are spent using information? % Receiving and managing information:
Legal professionals spend more time receiving and managing information.
Base size: Total =650, Legal professionals = 250, Non-legal professionals =400
28.6%21.6%
33.0%
25.7%
28.0%
24.3%
31.7%35.6%
29.3%
11.7% 13.6% 10.5%
3.0%2.3% 1.2%
0%
10%
20%
30%
40%
50%
60%
70%
80%
90%
100%
Total Legal professionals Non-legal professionals
81% - 100%
61% - 80%
41% - 60%
21% - 40%
0% - 20%
Mean 39.35% 41.82% 37.81%:Significantly higher than legal professionals :Significantly lower than legal professionals

27
Q16. In a typical day, what percentage of your working hours are spent receiving and managing information and what percentage are spent using information? % Using information:
Legal professionals spend less time using information.
Base size: Total =650, Legal professionals = 250, Non-legal professionals =400
4.8% 6.2%
16.2% 20.8% 13.2%
32.0%34.0%
30.8%
30.2%
32.4%
28.8%
16.9%10.4%
21.0%
2.4%0%
10%
20%
30%
40%
50%
60%
70%
80%
90%
100%
Total Legal professionals Non-legalprofessionals
81% - 100%
61% - 80%
41% - 60%
21% - 40%
0% - 20%
Mean 60.65% 58.18% 62.19%:Significantly higher than legal professionals :Significantly lower than legal professionals

28
Q16. In a typical day, what percentage of your working hours are spent receiving and managing information and What percentage are spent using information? Receiving and managing information / Using information: Summary
Base size: Total =650, Legal professionals = 250, Non-legal professionals =400
39.4% 37.8%
60.7% 58.2%62.2%
41.8%
0%
10%
20%
30%
40%
50%
60%
70%
80%
90%
100%
Total Legal professionals Non-legalprofessionals
Usinginformation
Receiving andmanaginginformation
:Significantly higher than legal professionals :Significantly lower than legal professionals

29
Contents
1. Methodology, Sampling and Quotas
2. Screen
3. Situation
4. Consequences
5. Solution
6. Legal Professionals Only
7. Demographics
30
3.5
6.5
1.5
10.9
3.2
4.9
4.2
2.0
2.3
1.0
2.7
12.9
4.6
3.3
1.2
2.0
5.8
6.6
9.7
4.7
2.4
2.5
2.1
6.4
5.1
1.8
3.5
0 3 6 9 12 15
Missing a meeting or appointment because of schedulingmiscommunications
Needing to recreate a document because a previouslycreated version could not be found
Needing to search for an old email or document
Having trouble f inding the correct or most recent versionof a document
Disagreements among colleagues about the right w ay toorganize information
Missing deadlines because of trouble f inding necessaryinformation
Delivering incomplete documents, email or othercommunications because the necessary information could
not be found
Having trouble recreating how time w as spent for billingpurposes
Spending too much time conducting research
Non-legalprofessionals
Legalprofessionals
Total
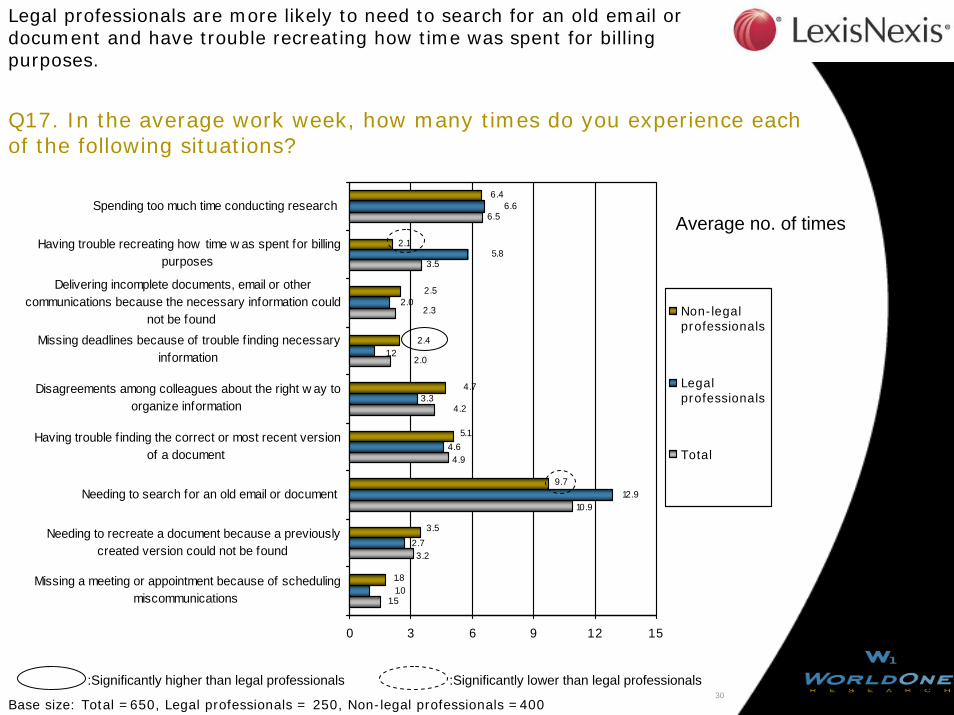
Q17. In the average work week, how many times do you experience each of the following situations?
Legal professionals are more likely to need to search for an old email or document and have trouble recreating how time was spent for billing purposes.
Average no. of times
Base size: Total =650, Legal professionals = 250, Non-legal professionals =400
:Significantly higher than legal professionals :Significantly lower than legal professionals

31
93.4% 91.5%
6.6% 3.6%8.5%
96.4%
0%
10%
20%
30%
40%
50%
60%
70%
80%
90%
100%
Total Legal professionals Non-legal professional
Yes No
Q17 Ever experienced any of these things? (all statements)
Base size: Total =650; Legal professionals = 250; Non-legal professionals =400
More legal professionals have experienced some of the consequences mentioned.
:Significantly higher than legal professionals :Significantly lower than legal professionals
32
Contents
1. Methodology, Sampling and Quotas
2. Screen
3. Situation
4. Consequences
5. Solution
6. Legal Professionals Only
7. Demographics

33
Q18. Which, if any, of the following things has your company or organization done in the last 2 years to help you and your colleagues manage information efficiently?
Base size: Total =650, Legal professionals = 250, Non-legal professionals =400
Legal professionals receive more help from their organizations than non-legal professionals.
56.4%
26.0%
20.0%
36.1%
32.4%
22.4%
44.0%
22.0%
11.8%
24.5%
26.5%
35.8%
48.8%
14.9%
23.5%
27.2%
28.8%
30.6%
0% 20% 40% 60% 80% 100%
Invested in faster computers and more up-to-datetechnology
Offered training in information management
Brought in outside consultants to analyze and improvethe organization’s information management systems
Provided information management technology that isdesigned to f it my job
Provided information management technology or toolsthat w ork together
None of these
Non-legalprofessionals
Legalprofessionals
Total
:Significantly lower than legal professionals
34
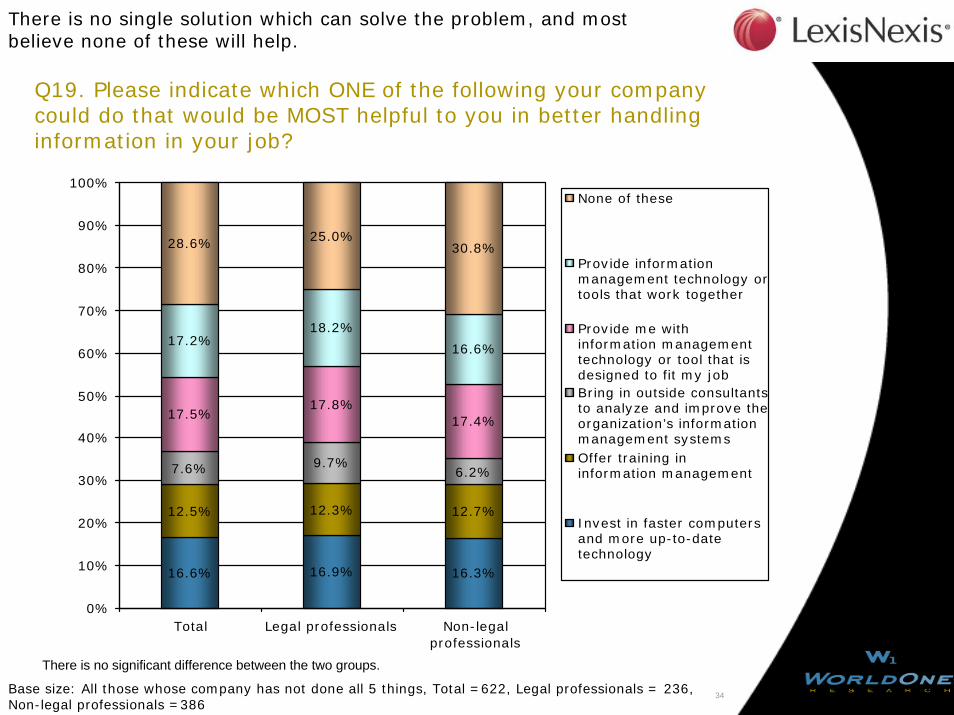
Q19. Please indicate which ONE of the following your company could do that would be MOST helpful to you in better handling information in your job?
Base size: All those whose company has not done all 5 things, Total =622, Legal professionals = 236, Non-legal professionals =386
There is no single solution which can solve the problem, and most believe none of these will help.
16.6% 16.9% 16.3%
12.5% 12.3% 12.7%
7.6% 9.7%6.2%
17.5%17.8%
17.4%
17.2%18.2%
16.6%
28.6% 25.0%30.8%
0%
10%
20%
30%
40%
50%
60%
70%
80%
90%
100%
Total Legal professionals Non-legalprofessionals
None of these
Provide informationmanagement technology ortools that work together
Provide me withinformation managementtechnology or tool that isdesigned to fit my job Bring in outside consultantsto analyze and improve theorganization’s informationmanagement systems Offer training ininformation management
Invest in faster computersand more up-to-datetechnology
There is no significant difference between the two groups.

35
Contents
1. Methodology, Sampling and Quotas
2. Screen
3. Situation
4. Consequences
5. Solution
6. Legal Professionals Only
7. Demographics
36
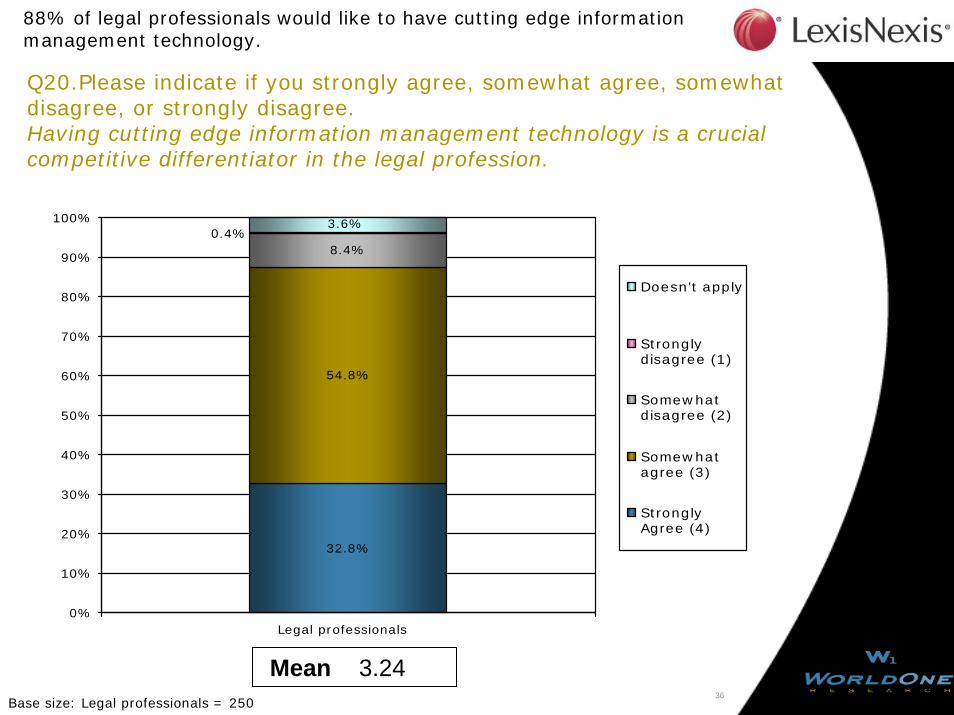
Q20.Please indicate if you strongly agree, somewhat agree, somewhat disagree, or strongly disagree. Having cutting edge information management technology is a crucial competitive differentiator in the legal profession.
88% of legal professionals would like to have cutting edge information management technology.
Base size: Legal professionals = 250
32.8%
54.8%
8.4%0.4%
3.6%
0%
10%
20%
30%
40%
50%
60%
70%
80%
90%
100%
Legal professionals
Doesn't apply
Stronglydisagree (1)
Somewhatdisagree (2)
Somewhatagree (3)
StronglyAgree (4)
Mean 3.24

37
Q21. Please indicate if you strongly agree, somewhat agree, somewhat disagree, or strongly disagree.The consequences of mismanaging information are extremely serious in the legal profession.
Nearly all (98%) of legal professionals agree with this statement.
Base size: Legal professionals = 250
77.6%
20.0%
1.2%0.8%0.4%
0%
10%
20%
30%
40%
50%
60%
70%
80%
90%
100%
Legal professionals
Doesn't apply
Stronglydisagree (1)
Somewhatdisagree (2)
Somewhatagree (3)
StronglyAgree (4)
Mean 3.75

38
Q22. Please indicate if you strongly agree, somewhat agree,somewhat disagree, or strongly disagree. Research takes up so much of my time that sometimes I end up not billing for time I spend on it.
Compare with previous statements; only 45% of legal professionals agree with this one.
Base size: Legal professionals = 250
13.2%
31.6%
25.6%
15.2%
14.4%
0%
10%
20%
30%
40%
50%
60%
70%
80%
90%
100%
Legal professionals
Doesn't apply
Stronglydisagree (1)
Somewhatdisagree (2)
Somewhatagree (3)
StronglyAgree (4)
Mean 2.50

39
Q23. Compared with two years ago, would you say that finding specific pieces of legal research or information is …
68% of legal professionals do believe things are getting easier.
Base size: Legal professionals = 250
20.0%
48.4%
24.8%
2.4%1.2%
3.2%
0%
10%
20%
30%
40%
50%
60%
70%
80%
90%
100%
Legal professionals
Don’t know
Much moredifficult
Somewhatmore difficult
Neither easiernor moredifficult Somewhateasier
Much easier
Mean 3.86
40
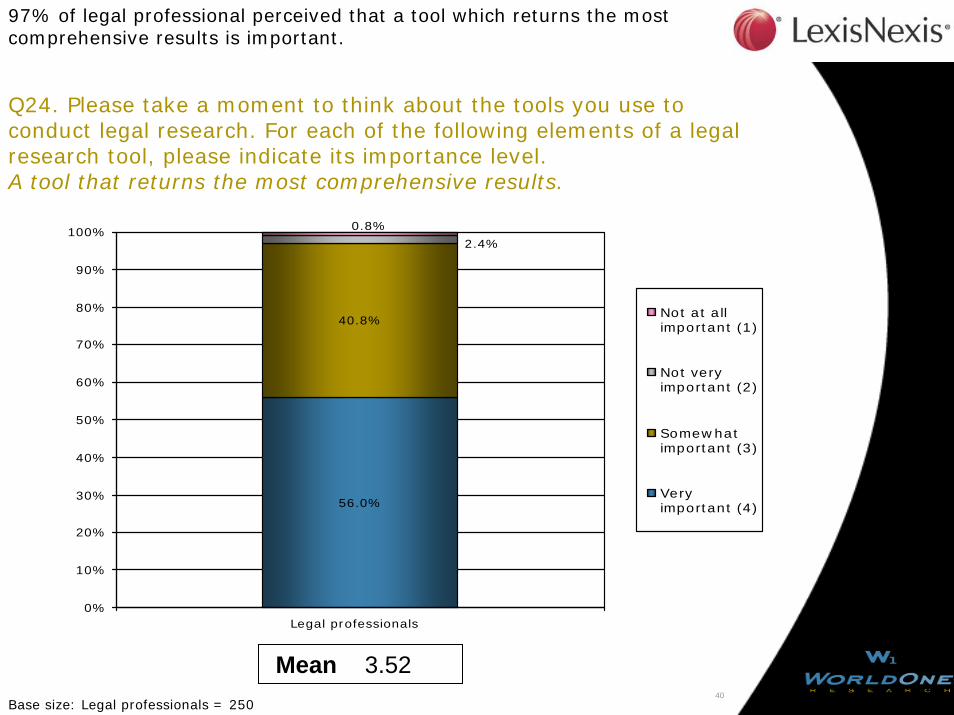
Q24. Please take a moment to think about the tools you use to conduct legal research. For each of the following elements of a legal research tool, please indicate its importance level.A tool that returns the most comprehensive results.
97% of legal professional perceived that a tool which returns the most comprehensive results is important.
Base size: Legal professionals = 250
56.0%
40.8%
2.4%
0.8%
0%
10%
20%
30%
40%
50%
60%
70%
80%
90%
100%
Legal professionals
Not at allimportant (1)
Not veryimportant (2)
Somewhatimportant (3)
Veryimportant (4)
Mean 3.52
41
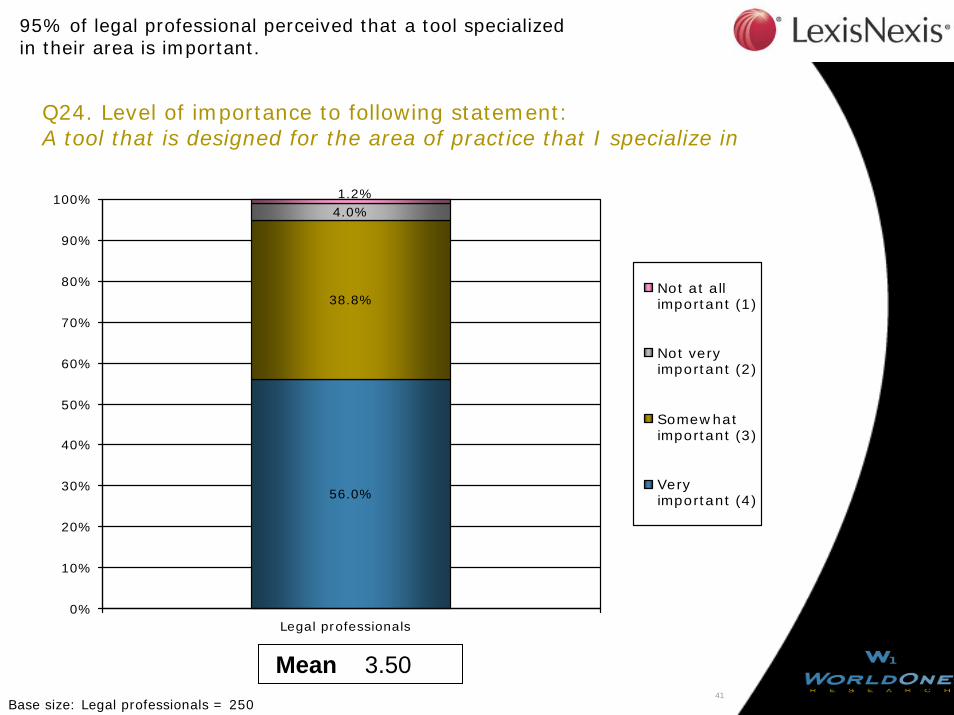
56.0%
38.8%
4.0%1.2%
0%
10%
20%
30%
40%
50%
60%
70%
80%
90%
100%
Legal professionals
Not at allimportant (1)
Not veryimportant (2)
Somewhatimportant (3)
Veryimportant (4)
Q24. Level of importance to following statement: A tool that is designed for the area of practice that I specialize in
95% of legal professional perceived that a tool specialized in their area is important.
Base size: Legal professionals = 250
Mean 3.50
42
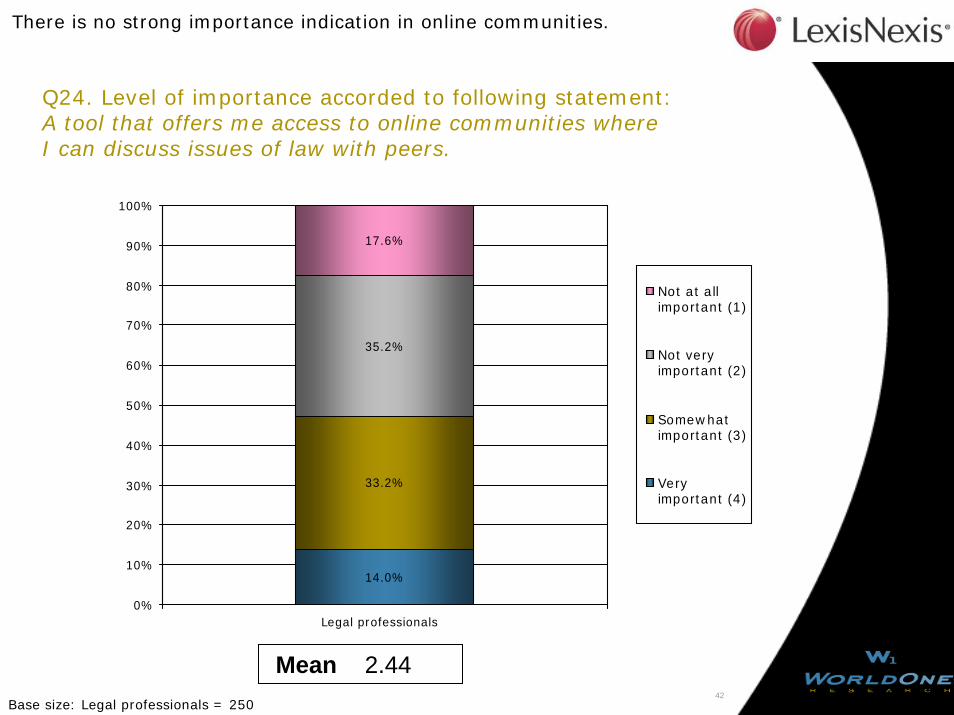
Q24. Level of importance accorded to following statement: A tool that offers me access to online communities where I can discuss issues of law with peers.
There is no strong importance indication in online communities.
Base size: Legal professionals = 250
14.0%
33.2%
35.2%
17.6%
0%
10%
20%
30%
40%
50%
60%
70%
80%
90%
100%
Legal professionals
Not at allimportant (1)
Not veryimportant (2)
Somewhatimportant (3)
Veryimportant (4)
Mean 2.44

43
Q24. Level of importance accorded to following statement: A tool that provides analysis and expertise in addition to data.
Base size: Legal professionals = 250
28.4%
50.0%
17.2%
4.4%
0%
10%
20%
30%
40%
50%
60%
70%
80%
90%
100%
Legal professionals
Not at allimportant (1)
Not veryimportant (2)
Somewhatimportant (3)
Veryimportant (4)
Mean 3.02
78% of legal professionals perceived it is important to have a tool that provides analysis and expertise.

44
Q24. Level of importance accorded to the following statement:A tool that offers only the most relevant documents and datafor my needs.
Base size: Legal professionals = 250
52.0%
41.2%
6.0%
0.8%
0%
10%
20%
30%
40%
50%
60%
70%
80%
90%
100%
Legal professionals
Not at allimportant (1)
Not veryimportant (2)
Somewhatimportant (3)
Veryimportant (4)
Mean 3.44
93% of legal professionals perceived it is important to have a tool that offers only the most relevant documents and data.

45
Q24. Level of importance accorded to following statement: A tool with information that is regularly updated.
Base size: Legal professionals = 250
76.8%
20.8%
1.6%0.8%
0%
10%
20%
30%
40%
50%
60%
70%
80%
90%
100%
Legal professionals
Not at allimportant (1)
Not veryimportant (2)
Somewhatimportant (3)
Veryimportant (4)
Mean 3.74
Nearly all (97%) of legal professionals perceived it is important to havea tool with information that is regularly updated..

46
Q24. Level of importance accorded to following statement: A tool that integrates research into your workflow.
Base size: Legal professionals = 250
30.0%
49.2%
17.6%
3.2%
0%
10%
20%
30%
40%
50%
60%
70%
80%
90%
100%
Legal professionals
Not at allimportant (1)
Not veryimportant (2)
Somewhatimportant (3)
Veryimportant (4)
Mean 3.06
79% of legal professionals perceived it is important to have a tool that integrates research into workflow.
47
Contents
1. Methodology, Sampling and Quotas
2. Screen
3. Situation
4. Consequences
5. Solution
6. Legal Professionals Only
7. Demographics

48
Q25. Respondent age
19.7% 20.4% 19.3%
32.9%
41.2%
27.8%
27.2%
26.0%
28.0%
19.8%12.0%
24.8%
0.1%0.4%0.3%
0%
10%
20%
30%
40%
50%
60%
70%
80%
90%
100%
Total Legal professionals Non-legal professionals
Over 65
56-65
46-55
31-45
18-30
Base size: Total =650, Legal professionals = 250, Non-legal professionals =400
:Significantly higher than legal professionals :Significantly lower than legal professionals

49
Q26. Gender
Base size: Total =650, Legal professionals = 250, Non-legal professionals =400
There is no significant difference between the two groups.
Gender split is similar for both legal and non-legal professionals.
31.8% 29.8%
68.2%64.8%
70.3%
35.2%
0%
10%
20%
30%
40%
50%
60%
70%
80%
90%
100%
Total Legal professionals Non-legal professional
Male Female
50
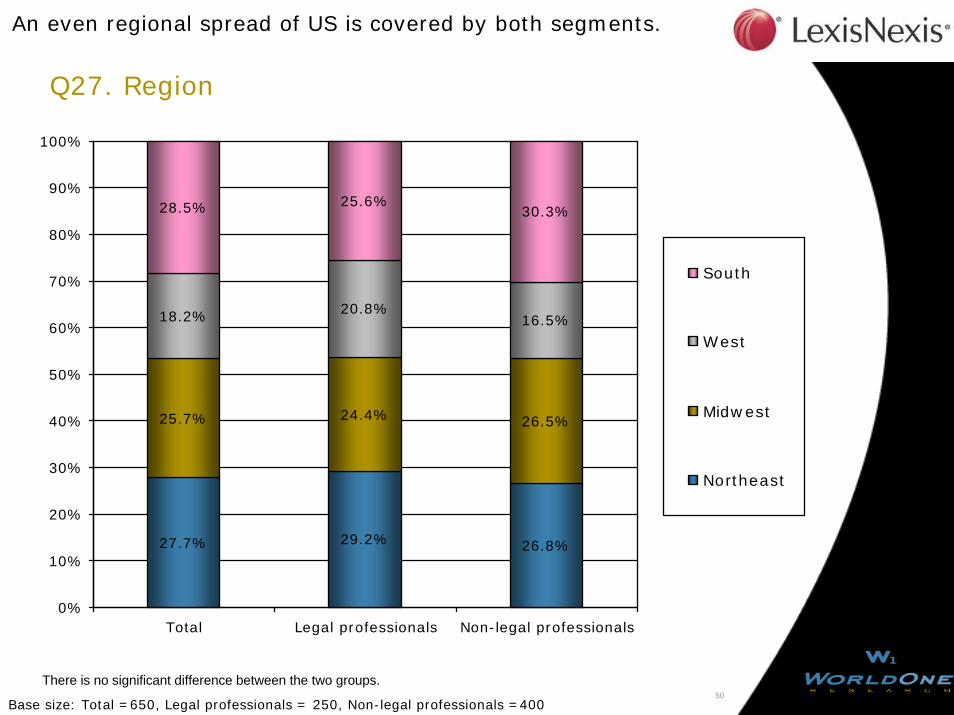
Q27. Region
An even regional spread of US is covered by both segments.
27.7% 29.2% 26.8%
25.7% 24.4% 26.5%
18.2% 20.8%16.5%
28.5% 25.6%30.3%
0%
10%
20%
30%
40%
50%
60%
70%
80%
90%
100%
Total Legal professionals Non-legal professionals
South
West
Midwest
Northeast
Base size: Total =650, Legal professionals = 250, Non-legal professionals =400
There is no significant difference between the two groups.

51
LexisNexis Workplace Productivity Survey
Prepared by WorldOne Research