levels and patterns of safety net spending in developing...
TRANSCRIPT

NO. 0817S P D I S C U S S I O N P A P E R
Levels and Patterns ofSafety Net Spending inDeveloping and TransitionCountries
Christine WeigandMargaret Grosh
June 2008
Levels and Patterns of Safety Net Spending in Developing and Transition Countries
Christine Weigand Margaret Grosh
June 2008
Keywords: transfers, safety nets, social assistance, social protection, redistribution JEL classification: D31, H55, I31, I38


i
Acknowledgements
This work draws on, expands and substantially updates an earlier compilation of data done by Lorraine Blank which included in turn a regional compilation done by Luis Guillermo Hakim for the Middle East and North Africa. The search for spending figures was hugely abetted by the parallel review of all World Bank analytic work carried out simultaneously by Annamaria Milazzo. Box 2 draws on a memo written by Emanuele Baldacci. Helpful comments came from David Coady, Francisco Ferreira, Tamar Manuelyan Atinc, Carlo del Ninno, Valerie Kozel, and Emil Tesliuc.

ii
Abstract
This paper offers a new set of data compiled from individual World Bank country reports. We give a brief textual description of patterns and trends in spending, and provide the raw data and documentation of its sources in the appendix. The data are also provided in an Excel spreadsheet on the safety nets website www.worldbank.org/safetynets so that others may use them. Mean spending on safety nets is 1.9 percent of GDP and median spending is 1.4 percent of GDP. For about half of the countries, spending falls between 1 and 2 percent of GDP. Some variation is apparent. Bosnia and Herzegovina, Pakistan, and Tajikistan, for example, spend considerably less than 1 percent of GDP, while spending on social safety nets in Ethiopia and Malawi is nearly 4.5 percent of GDP because international aid is counted, but would be more like 0.5 percent if only domestically financed spending were counted. Other high-spending countries—Mauritius, South Africa, and the Slovak Republic—finance their safety nets domestically. Spending on safety nets is less variable than spending on social protection or the social sectors.

1
Levels and Patterns of Safety Net Spending in Developing and Transition Countries
Introduction All countries have safety nets and the World Bank has an active portfolio of policy dialogue, training and lending for safety nets, having engaged with over one hundred countries on the theme in the last five years. Safety nets, or social protection more generally, are similarly a topic of policy concern for a number of international agencies. Good measures of spending on safety nets remain elusive. This paper offers a new set of data compiled from individual World Bank country reports. We give a brief textual description of patterns and trends in spending, and provide the raw data and documentation of its sources in the appendix. The data are also provided in an Excel spreadsheet on the safety nets website www.worldbank.org/safetynets so that others may use them. Definitions We take as the definition of safety nets non-contributory transfers targeted in some manner to the poor or vulnerable. This is a fairly commonly accepted definition (see Box 1). Some writers, especially in the United States, use the term “welfare” to mean roughly the same thing; others especially in Europe, equate it with “social assistance.”
Under this conceptual definition there are many variants of programs, the most common include the following:
• Cash transfers or food stamps, whether means tested or categorical as in child allowances or social pensions
• In-kind transfers, with food via school feeding programs or mother/child supplement programs being the most common, but also of take-home food rations, school supplies and uniforms, and so on
• Price subsidies meant to benefit households, often for food or energy
• Jobs on labor-intensive public works schemes, sometimes called workfare
• In-cash or in-kind transfers to poor households, subject to compliance to specific conditionalities on education or health
• Fee waivers for essential services, health care, schooling, utilities, or transport
The following further clarifies what we do and do not consider under the rubric of safety nets.
• Social protection. As used here, safety nets do not include the rest of social protection—that is, social insurance programs such as pensions and unemployment insurance. To the extent

2
that these schemes deliver benefits based on contributions of their own members, they are not safety nets; rather, they might be thought of as deferred compensation packages for affiliated employees.
• Labor. The extensive regulatory aspects of labor are separate from safety nets. Active labor market policies and income support to the unemployed are closely related to—and, indeed, sometimes directly overlap with—safety nets, but most of the programs used to these purposes are well covered elsewhere and are not discussed here.
• Health and education. In our nomenclature, safety nets are complemented by social insurance contributory programs such as pensions and unemployment insurance, and more broadly by the rest of social policy, especially in health and education, sometimes with important elements of housing or utility policy.
Finally, note that our definition concentrates on publicly financed safety nets—that is, those funded by national or local government or by official international aid. Most often, such safety nets are delivered by the state, although nongovernmental organizations may be used as well and certain functions contracted to the private sector. Even though private action via interhousehold transfers, community support arrangements, private zakat, private contributions to nongovernmental organizations, and other forms of charity may involve substantial flows of resources (indeed, sometimes exceeding public funds), and while the policy maker must understand the scope and shape of these privately financed safety nets, the main realm of public action is via publicly financed programs.
Because we define safety nets rather narrowly, their costs are lower than some people associate with safety nets. In Uruguay, for example, total social sector expenditure (social assistance, social insurance, health, education, and other) is quite high—accounting for between 20 and 25 percent of gross domestic product (GDP) between 2000 and 2005—but expenditures on safety nets per se are only 0.5 percent of GDP (World Bank 2007a).
Box 1: Definitions of Safety Nets and Social Assistance
• The Asian Development Bank defines social assistance as programs designed to assist the most vulnerable individuals, households, and communities meet a subsistence floor and improve living standards (Howell 2001).
• The U.K.’s Department for International Development defines social assistance as noncontributory transfers to those deemed eligible by society on the basis of their vulnerability or poverty. Examples include social transfers and initiatives such as fee waivers for education and health, and school meals (DFID 2005).
• The International Labour Organization defines social assistance as tax-financed benefits to those with low incomes (ILO 2000).
• The International Monetary Fund defines safety nets as instruments aimed at mitigating possible adverse effects of reform measures on the poor (Chu and Gupta 1998).

3
• The Organisation for Economic Co-operation and Development defines social assistance as support targeted to households that are clustered within the lower segment of the income distribution and is provided to prevent extreme hardship among those with no other resources, reduce social exclusion, minimize disincentives to paid employment, and promote self-sufficiency (Adema 2006).
• The Food and Agriculture Organization defines social safety nets as cash or in-kind transfer programs that seek to reduce poverty by redistributing wealth and/or protect households against income shocks. Social safety nets seek to ensure a minimum level of well-being, a minimum level of nutrition, or help households manage risk (FAO 2003).
Quantifying spending on safety nets is difficult because the conceptual definition does not fit within a single ministry’s mandate. Thus the most easily and regularly obtainable sets of numbers on government spending are not useful for tracking spending on safety nets. Figure 1, which shows responsibilities for Peru’s safety nets programs, illustrates the issue well. The main safety net programs fall under half a dozen ministries and three different levels of government. This is the case even though Peru only had about 20 major safety net programs, many fewer than commonly found elsewhere.
Figure 1: Institutional Responsibility for Safety Net Programs, Peru
Source: World Bank 2005
Social protection
Central government
Ministry of Economy/Finance
Ministry of Women/Social D l
Ministry of Labor Ministry of Housing
PRONAA: Food-based programs
FONCODES : basic infrastructure i t t
WAWA WASI: integrated day care
PNCVFS: Domestic and sexual violence
INABIF: integrated family services
Workfare: A Trabajar Urbano
Mi Vivienda: subsidized mortgages
Ministry of Agriculture
PRONAMACHCS: support for poor
f
Pensions: general public regime
Subnational governments
Provincial municipalities
(194)
District municipalities(1829)
Community kitchens
Shelters for at-risk youth
Food program: Glass of Milk [[OK?]]
FONCODES: basic social infrastructure
Food for work
Techo Propio: One-time housing subsidy
PAR: Repopulation/ IDPs/ violence areas
COOPOP: Community cooperatives
Ministry of Energy
Energy subsidy
Vocational training, employment services
Pensions: civil servants regime

4
Box 2: Literature Safety Net Spending Levels based on the International Monetary Fund Government Finance Statistics Social safety net programs typically represent about 1 to 2 percent or less of GDP in developing countries. This compares with spending levels of 2 to 4 percent of GDP in industrial countries (Atkinson 1995) Average spending levels tend to be higher in middle-income countries than in low-income countries, reflecting the low revenue base in the latter countries, but variability is large (Fox 2003). Spending levels also vary by region, with South Asian and Sub-Saharan African countries spending less than Latin American and Caribbean countries and countries in Eastern and Central Europe and the Middle East countries spending more (Besley, Burgess, and Rasul 2003). Various authors have tested for and found different factors that may affect the level of safety net spending or of social spending more broadly. Higher per capita incomes tend to be associated with higher spending on social assistance programs, while the incidence of poverty and inequality are not necessarily good predictors of the level of spending on social safety nets. This is because in many regions, for example, Latin America and the Caribbean, the system of social protection is split between social insurance for the (wealthier) formal sector worker and meager social assistance for the (poorer) worker in the informal sector. (Fiszbein 2004). Schwabish, Smeeding, and Osberg (2004) find that inequality between the middle class and the poor (as measured by the ratio of welfare between those at the 50th percentile and those at the 10th percentile has a small, positive impact on social spending, but that inequality between the ends of the distribution and the middle class (as measured by the 90th percentile and those at the 50th percentile) has a large and negative impact. Also spending levels tend to be higher for countries with better governance indicators (Baldacci, Hillman, and Kojo 2004), but are not necessarily different in decentralized and centralized economies (Ter Minassian 1997). Spending on social safety nets tends to be correlated with government size, but is generally negatively correlated with fiscal deficits and inflation. This is because countries with unstable macroeconomic conditions are more likely to have insufficient resources to finance the social safety net (de Ferranti and others 2000). The International Monetary Fund’s publication Government Finance Statistics (IMF, 2001) is accessible, published frequently, and takes care to establish comparability, but does not have a category that closely matches the concept of safety nets as used in this book. It lumps much social assistance in with social insurance to come up with a single figure for “social security and welfare,”1 other social assistance may fall under the 1 This category includes transfer payments (including in kind) to compensate recipients for reduction or loss of income or for inadequate earning capacity; sickness, maternity, disability, old-age, and survivors’ benefits; government employee pension schemes; unemployment compensation; family and child allowances; other social assistance for individuals; and payments to residential institutions for children and the elderly. 2 This category includes transfer payments to private social institutions such as hospitals and schools, learned societies, associations, and sports clubs that are not operated as enterprises and current payments in cash to households that add to their disposable income without any simultaneous, equivalent counterpart provided in exchange by the beneficiary and that does not generate or eliminate a financial claim, and is usually intended to cover charges incurred by households because of certain risks or needs.

5
“transfers to households and other organizations” category,2 and more will be reported in the accounts of the ministries that house or serve as umbrella organizations for the various programs, especially if these are in-kind programs. Despite their shortcomings, these numbers have been the basis of a literature on safety net spending summarized in box 2. Methods To fill the gap in knowledge about safety net spending in developing countries, we compile data from World Bank public expenditure reviews and other similar analytical work. We conducted an extensive search for such analysis both using and contributing to the inventory of over 250 such documents catalogued in Milazzo and Grosh, 2008. Steps taken to identify relevant documents were as follows: • Reviewed all documents listed on the World Bank Public Expenditure Reviews
(PERs) website as published • Reviewed all documents listed on the World Bank Social Protection/Safety Net
website • Reviewed all documents identified on the Social Protection Risk Management
category in the World Bank Country Analytic website • Search country-by-country for all developing countries in the World Bank Country
Analytic website and reviewed all studies that were not captured in the above, with particular attention to Poverty Assessments and PERs
• Review documents in the inventory of Milazzo and Grosh, which search involved any document coded in Business Warehouse to theme 54, key term searches in ImageBank, use of extensive subject bibliographies developed for other purposes, etc.
Within each document identified above, wesearched for the following key words: social protection ; social insurance ; social assistance; welfare; insurance; pensions to locate pertinent portions to read for spending numbers. Many of the studies referred to try to sort through countries’ budgets and programmatic structures to assemble comprehensive numbers, an exercise usually carried out for a given country not as part of the annual budgetary process, but as part of one-time or periodic reviews of social policy in that country. Several provide rather extensive detail on how they do this, others were much more summary. There are differences in how the authors of the underlying documents classify various elements of expenditure. This was especially true with respect to: • Non-contributory pensions - sometimes included as part of social insurance and other
times as part of social assistance; • Health insurance - most often included as part of health sector spending but
sometimes included as part of social protection spending • Active labor market programs –infrequent mention of active labor market programs
other than public works • Child welfare, social services and institutional care – variability in whether these
were included

6
• external financing - the data on Ethiopia and Malawi does include externally financed spending.
Which programs are covered in the data quoted for each country is described in more detail in the worksheet titled "DATA" in the appendix. Rules followed for data cleaning are as follows: • when 'year' was not available, data are assigned to the year of the report • when 'year' was available only in a 2 year range (ex. 2001/02), used the earlier year • when other data (Gini, other public expenditures, etc...) were not available for the
specific year for which spending data were available, we used the data which was closest to that year and/or most recent (and added comment to fields in 'DATA' sheet)
We supplement this information with data for a handful of OECD countries from the OECD social expenditure database (OECD, 2004) and with data from World Bank (2007b). There are three important caveats to these data: • Incomplete coverage: We provide data for 87 countries between 1996 and 2006.3
Coverage varies by region. It is high for Europe and Central Asia, with 25 of the 29 countries covered (and 96 percent of the population). Coverage is much worse for Sub-Saharan Africa, with 9 of the 47 countries covered (and 18 percent of the population).
• Comparability: Because the expenditure numbers compiled were calculated by the many different authors of the many country reports, the precise definition of what to include in the safety net or the social protection sector as a whole varies. We report the composites largely as they occur in the reports, trusting to the judgments of the authors of the individual reports to include what was pertinent and available in a given country. For health and education expenditures, we use World Bank (2007b), which has less serious comparability issues.
• Interpretation: What countries do spend is not necessarily what they should spend. The reports underlying the data reported here were undertaken because the level of spending was a policy issue at the time the individual country studies were done. This suggests that at least some parties thought that the level was “wrong” and that more or less should be spent.
Spending on safety nets as a percentage of GDP provides a summary measure of a government’s efforts to provide safety nets. We also broaden our view to consider wider concepts of spending. We define social protection as the sum of safety nets (social assistance) and social insurance (pensions, unemployment insurance). We define the social sectors as the sum of spending on social protection, health, and education.
3 For the analysis and discussion in this section, the dataset used excludes Iraq, an outlier that has been spending 15 percent of GDP spent on social assistance because of its unique circumstances.
7
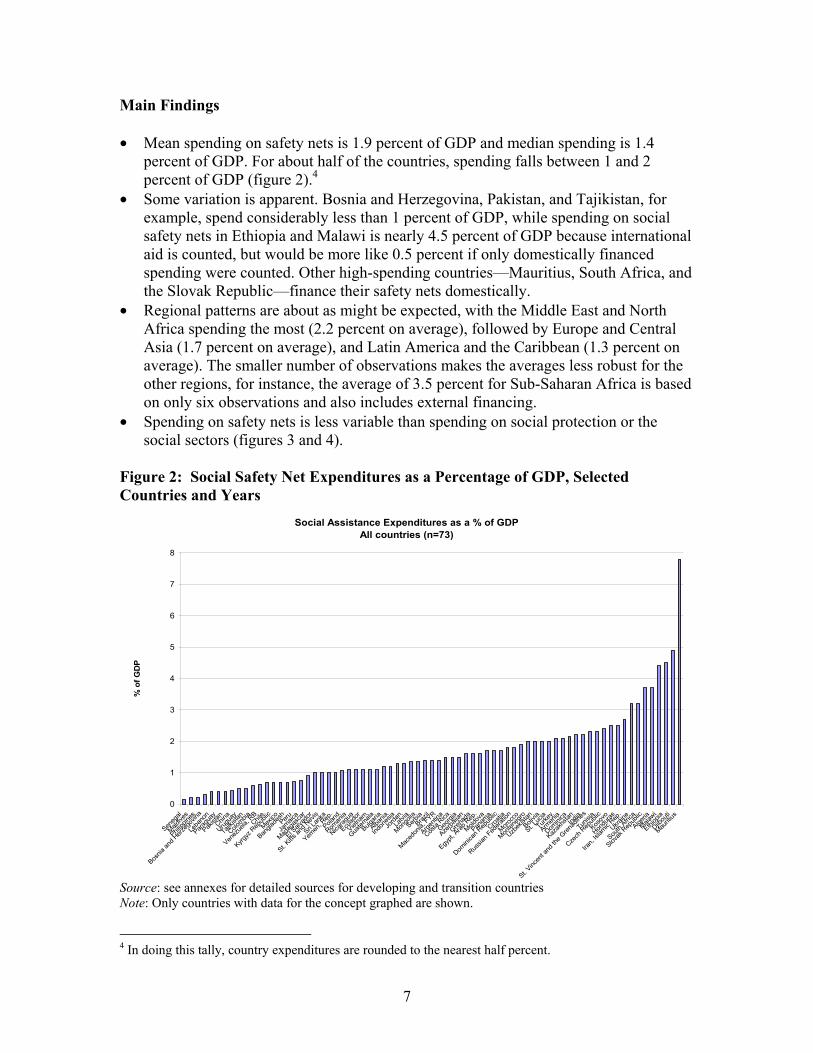
Main Findings • Mean spending on safety nets is 1.9 percent of GDP and median spending is 1.4
percent of GDP. For about half of the countries, spending falls between 1 and 2 percent of GDP (figure 2).4
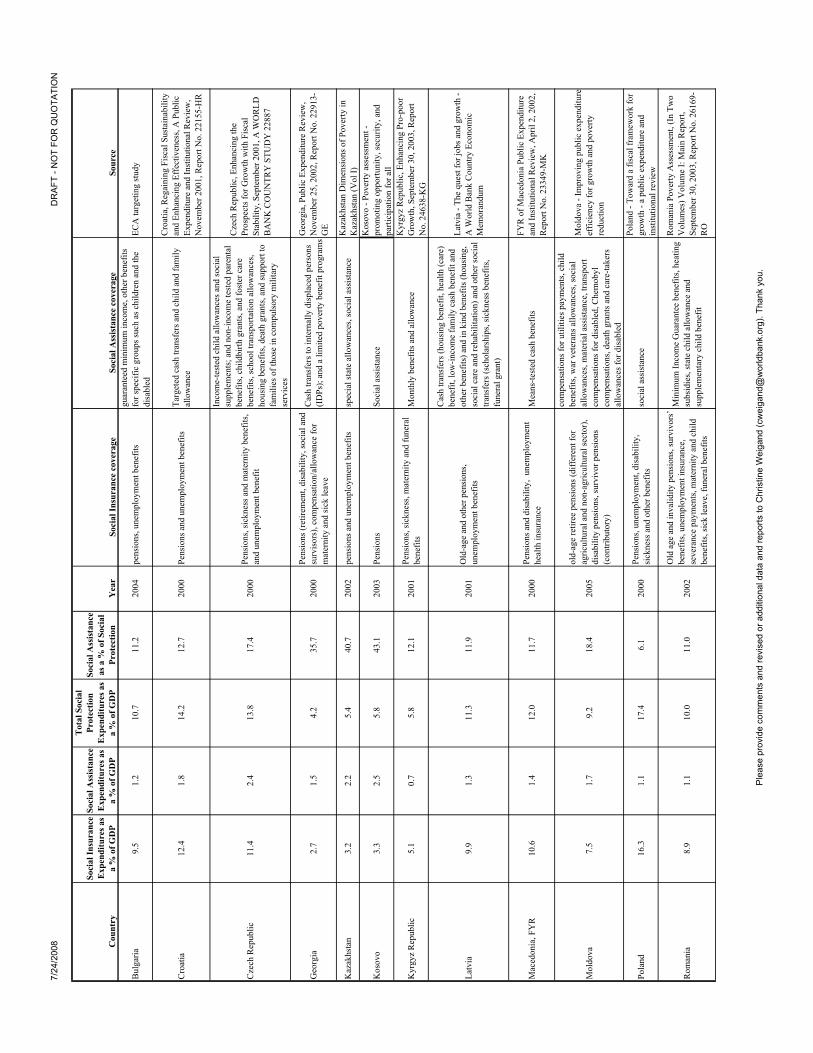
• Some variation is apparent. Bosnia and Herzegovina, Pakistan, and Tajikistan, for example, spend considerably less than 1 percent of GDP, while spending on social safety nets in Ethiopia and Malawi is nearly 4.5 percent of GDP because international aid is counted, but would be more like 0.5 percent if only domestically financed spending were counted. Other high-spending countries—Mauritius, South Africa, and the Slovak Republic—finance their safety nets domestically.
• Regional patterns are about as might be expected, with the Middle East and North Africa spending the most (2.2 percent on average), followed by Europe and Central Asia (1.7 percent on average), and Latin America and the Caribbean (1.3 percent on average). The smaller number of observations makes the averages less robust for the other regions, for instance, the average of 3.5 percent for Sub-Saharan Africa is based on only six observations and also includes external financing.
• Spending on safety nets is less variable than spending on social protection or the social sectors (figures 3 and 4).
Figure 2: Social Safety Net Expenditures as a Percentage of GDP, Selected Countries and Years
Social Assistance Expenditures as a % of GDPAll countries (n=73)
0
1
2
3
4
5
6
7
8
Seneg
al
Maldive
s
Philipp
ines
Bosnia
and H
erzeg
ovina
Leba
non
Paragu
ay
Pakist
anChin
a
Urugua
y
Tajikis
tan
Colombia
Venez
uela,
RBChil
e
Kyrgyz
Rep
ublic
Mexico
Bangla
deshPeru
Jamaic
a
Madag
asca
r
El Salv
ador
St. Kitts
and N
evis
Sri Lan
ka
Yemen
, Rep
.
Poland
Roman
ia
Nicarag
ua
Ecuad
or
Vietna
m
Guatem
ala
Bulgari
a
Albania
Indon
esia
Jorda
nLa
tvia
Mongo
lia
SerbiaBraz
il
Maced
onia,
FYR
Argenti
na
Costa
Rica
Georgi
a
Azerba
ijan
Grenad
a
Egypt,
Arab
Rep
.
Moldov
a
Panam
a
Domini
can R
epub
lic
Croatia
Russia
n Fed
eratio
n
Morocc
o
Monten
egro
Uzbek
istan
Bolivia
St. Luc
ia
Turkey
Armen
ia
Domini
ca
Kazak
hstanInd
ia
St. Vinc
ent a
nd th
e Gren
adine
s
Tunisi
a
Czech
Rep
ublic
Kosov
o
Hondu
ras
Iran,
Islam
ic Rep
.
Ukraine
South
Africa
Slovak
Rep
ublic
Algeria
Malawi
Ethiop
ia
Djibou
ti
Mauriti
us
% o
f GD
P
Source: see annexes for detailed sources for developing and transition countries Note: Only countries with data for the concept graphed are shown.
4 In doing this tally, country expenditures are rounded to the nearest half percent.

8
Figure 3. Social Assistance and Social Insurance as a Percentage of GDP by Region, Selected Years
Social Assistance and Social Insurance as a % of GDPALL REGIONS
0
2
4
6
8
10
12
14
Africa Sub-Saharan East Asia Pacific Eastern Europe andCentral Asia
Latin America andCarribean
Middle East andNorthern Africa
South Asia OECD 23
Social Assistance Social Insurance
n=9 n=9 n=25 n=25 n=13 n=5
Source: see annexes for detailed sources for developing and transition countries; OECD 2004. Note: Only countries with data for the concept graphed are shown. For the OECD, we used 23 countries, as such countries as Mexico and Poland are already accounted for in the regional averages. Figure 4. Social Assistance, Social Insurance, and Social Sector Spending by Region, Selected Years
Social Spending as a % of GDP ALL REGIONS
0
2
4
6
8
10
12
14
16
18
20
Africa Sub-Saharan
East Asia Pacific Eastern Europeand Central Asia
Latin America andCarribean
Middle East andNorthern Africa
South Asia OECD 23
% o
f GD
P
Social Assistance Social Insurance Education Health
n=9 n=13 n=5n=25n=25n=9
Source: see annexes for detailed sources for developing and transition countries; OECD 2004. Note: Only countries with data for the concept graphed are shown. For the OECD, we used 23 countries, as such countries as Mexico and Poland are already accounted for in the regional averages.

9
To try to understand the sources of variation in spending patterns, we look at spending patterns and their relationship to variables typically discussed in the literature on developed countries, namely: • Country income as measured by GDP per capita with purchasing power parity
adjustments, with the hypothesis that richer countries will spend more. • Inequality as measured by the Gini coefficient. The hypothesis varies with the model
of power assumed. A one person, one vote economy with higher inequality will face more pressure for redistribution, because the number of people with incomes below the mean will be higher. In a model with elite capture of government the elite may use private providers of social services and provide little support to public ones, so higher inequality may lead to lower spending.
• Voice as measured by the Kaufmann, Kraay, and Mastruzzi (2005) index for voice, with the hypothesis that greater voice will be positively related to spending on social safety nets, social protection, and/or the social sectors.
• Ethnic fragmentation as measured by Alesina and others (2002), with the hypothesis that greater fragmentation will lead to lower spending on social safety nets, social protection, and/or the social sectors.
• Democracy as measured by the Polity IV Project of the University of Maryland, with the hypothesis that greater democracy will lead to higher spending on social safety nets, social protection, and/or the social sectors.
• Attitudes about inequality as based on a question from the 1990–2004 questionnaires of the World Values Survey, which asks respondents to score their attitudes on a scale with “incomes should be made more equal” at one end and “we need larger income differences as incentives for individual efforts” at the other. We hypothesize that spending will be higher when more people believe in the need for greater equality.
We find that in simple correlations, most of the factors have the expected sign, but that the strength of the correlation is generally higher the broader the concept of spending used (table 1). For spending on safety nets alone, none of the factors examined correlate significantly. As concerns spending on social protection and the social sectors however, it is are significantly higher where income or voice are higher and lower where inequality is higher. Table 1: Correlations between Spending on Social Sectors and Other Factors
Factor
Safety Nets as a percentage of GDP
Social protection as a percentage of GDP
Social sectors as a percentage of GDP
Per capita GDP (purchasing power parity)
0.0768 0.5045** 0.5460**
Gini coefficient -0.1104 -0.3410** -0.2686* Voice 0.0678 0.2294** 0.2607** Ethnic fragmentation 0.1628 -0.0204 -0.0972 Democracy 0.1733 -0.0533 0.1907 Attitudes about inequality 0.1234 -0.1694 -0.1559 Source: Authors’ calculations. Note: * indicates that coefficients are significant at the 10 percent level or better. ** indicates that coefficients are significant at the 5 percent level or better.

10
The results on measured inequality are worth noting: the correlations are all negative, that is, higher Ginis are associated with lower spending on safety nets, social protection, and the social sectors as a whole. In examining the data in detail, most of the low Gini countries are in Europe and Central Asia, with its historical legacy of large social protection sectors, and the high Gini countries are in Latin America and the Caribbean, with their legacy of truncated welfare states. These two regions dominate the dataset. Thus the inequality variable used may be capturing a historical legacy more than the real workings of inequality in relation to decision making. Figure 5 illustrates the more robust correlations for broader concepts of spending. The relationship with GDP is much more marked for the social sectors than for safety nets alone. In looking at attitudes to inequality, the finding for the social sectors echoes Alesina and Glaeser’s (2004) findings for OECD economies presented in the previous section, but the pattern for social safety nets is not statistically significant, and indeed, of the opposite slope as expected
Figure 5. Spending, Income and Public Attitudes Social Assistance and GDP Per Capita Social Spending and GDP Per Capita
Ethiopia
Madagascar
Malawi
Mauritius
Senegal
South Af rica
China
IndonesiaMongolia
Philippines
Vietnam Albania
ArmeniaAzerbai jan
Bulgaria
C roatiaGeorgia
Kazakhstan
Ky rgyz Republic
LatviaMacedonia, FYRMoldova
PolandRomania
Russian Federation
Slovak Republic
Tajikistan
Turkey
Ukraine
UzbekistanArgentina
Boliv ia
Brazil
ChileColombia
Costa Rica
DominicaDominican Republic
EcuadorEl Salv ador
GrenadaGuatemala
Honduras
Jamaica MexicoN icaragua
Panama
ParaguayPeru
St. Kitts and Nev is
St. LuciaSt. Vincent and the Grenadines
UruguayVenezuela, RB
Algeria
Djibouti
Egypt, Arab Rep.
Iran, Is lamic Rep.
Jordan
Lebanon
MoroccoTunisia
Yemen, Rep.Bangladesh
India
Pakistan
Sri Lanka
02
46
895
% C
I/Fitt
ed v
alue
s/sa
_gdp
0 5000 10000 15000gdp_pc_ppp
95% CI Fitted valuessa_gdp
BotswanaMadagas car
Malawi
Mauritius
SenegalCambodia
Mongolia
Thailand
Albania
ArmeniaAzerbaijan
Belarus
Bulgaria
Croatia Czech Republic
GeorgiaKazakhstanKy rgy z Republic
Latv iaMacedonia, FYR
Poland
RomaniaRussian Federation
Slov ak Republic
Tajikistan
Turkey
Ukraine
ArgentinaBoliv ia
Brazil
ChileColom bia
Costa RicaDominica
Dominican RepublicEcuador
El Salvador
GrenadaGuy anaJamaica
Mexico
Nicaragua Panama
Paraguay
Peru St. Kitts and Nev isSt. Lucia
St. Vinc ent and the Grenadines
UruguayDjibouti
Iran, Islamic Rep.
Jordan
Lebanon
Morocco
Tunisia
Yemen, Rep.Bangladesh
India
Pakistan
510
1520
2595
% C
I/Fitt
ed v
alue
s/so
csec
_gdp
0 5000 10000 15000gdp_pc_ppp
95% CI Fitted valuessocsec_gdp
Social Assistance and Public Attitudes Social Spending and Public Attitudes about Inequality about Inequality
South Af rica
China
Indones ia
Philippines
VietnamAlbania
Armenia
Azerbaijan
Bosnia and Herzegov ina
Bulgaria
Croatia
Czech Republic
Georgia
Ky rgyz Republic
Macedonia, FYR
Moldova
PolandRomania
Russian Federation
Serbia
MontenegroTurkey
Ukraine
Argentina Brazil
Chile Colombia
Dominican Republic
El Salv adorMexico PeruUruguay Venezuela, RB
Algeria
Egypt, Arab Rep.
Iran, Islamic Rep.
Jordan
Bangladesh
India
Pakistan
01
23
495
% C
I/Fitt
ed v
alue
s/sa
_gdp
2 4 6 8 10w vse035_median
95% CI Fitted valuessa_gdp
Albania
Arm eniaAzerbaijan
Belarus
Bulgaria
CroatiaCzech Republic
Georgia
Ky rgy z Republic
Macedonia, FYR
Poland
RomaniaRussian FederationTurkey
Ukraine
Argentina
Brazil
ChileC olom bia
Dominican Republic
El Salv ador
Mexico Peru
Uruguay
Iran, Islamic Rep.
Jordan
Bangladesh
India
Pakistan
510
1520
2595
% C
I/Fitt
ed v
alue
s/so
csec
_gdp
2 4 6 8 10w vse035_median
95% CI Fitted valuessocsec_gdp
Source: Authors’ calculations.

11
We interpret the pattern of results—that the correlates of social spending viewed broadly are more definitive than the determinants of spending on safety nets—to mean that societies agree that a certain floor of safety nets is required, but that they also have reservations about making the safety net too large. Thus when support for social policy is higher, it tends not to be expressed through more spending on safety nets, but through more spending on allied social policies pertaining to social insurance, health, and/or education. This interpretation is also consistent with the patterns of spending shown in figure 5. Thus in sum, safety net spending as a share of GDP is not too diverse, with most countries concentrated in the 1 to 2 percent range. There may be a case for those much below this range to move into it and for higher spending in low-income countries, but clearly for many countries, the most pressing question will not be changing the size of the budget envelope devoted to safety nets, but making the most of that spending.

12
References
Note: references to the sources of country specific spending data are shown in the appendix for better clarity. References are provided here only for other materials. Adema, W. 2006. Social Assistance Policy Development and the Provision of a Decent
Level of Income in Selected OECD Countries. OECD Social Employment and Migration Working Papers No. 38.
Alesina, Alberto, and Edward L. Glaeser. 2004. Fighting Poverty in the US and Europe. Oxford, UK: Oxford University Press.
Alesina, Alberto F., Arnaud Devleeschauwer, William Easterly, Sergio Kurlat, and Romain T. Wacziarg. 2002. “Fractionalization.” Research Working Paper 1959. Harvard Institute, Cambridge, MA.
Atkinson, Anthony B. 1995. Incomes and the Welfare State: Essays on Britain and Europe. Cambridge, UK: Cambridge University Press.
Baldacci, Emanuele, Arye L. Hillman, and Naoko C. Kojo. 2004. “Growth, Governance, and Fiscal Policy Transmission Channels in Low-Income Countries.” European Journal of Political Economy 20 (3): 517–49.
Besley, Timothy, Robin Burgess, and Imran Rasul. 2003. “Benchmarking Government Provision of Social Safety Nets.” Social Protection Discussion Paper 0315. Washington, DC: World Bank.
Chu, Ke-Young and Sanjeev Gupta. 1998. Social Safety Nets: Issues and Recent Experiences. Washington, DC: International Monetary Fund.
De Ferranti, David, Guillermo E. Perry, Indermit Gill, and Luiz Serven. 2000. Securing Our Future in a Global Economy. Latin American and Caribeean Studies. Washington, DC: World Bank.
DFID (Department for International Development), 2005. Social Transfers and Chronic Poverty: Emerging Evidence and the Challenge Ahead. DFID Practice Paper. London: DFID
FAO (Food and Agriculture Organization), 2003. “Safety Nets and the Right to Food.”
Intergovernmental Working Group for the Elaboration of a Set of Voluntary Guidelines to Support the Progressive Realization of the Right to Adequate Food in the Context of National Food Security Information Paper.
Fiszbein, Ariel. 2004. “Beyond Truncated Welfare Status: Quo Vadis Latin America?”
Draft. Washington, DC: World Bank.
13
Fox, Louise. 2003. “Safety Nets in Transition Economies: A Primer.” Social Protection Discussion Paper 0306. Washington, DC: World Bank.
Howell, F. 2001. “Social Assistance: Theoretical Background.” In I. Ortiz, ed., Social Protection in Asia and the Pacific. Manila: Asian Development Bank.
ILO (International Labour Office). 2000. World Labour Report 2000: Income Security
and Social Protection in a Changing World. Geneva: ILO.
International Monetary Fund, 2001 Government Finance Statistics Washington, DC: International Monetary Fund.
Kaufmann, Daniel, Aart Kraay, and Massimo Mastruzzi. 2005. Governance Matters IV: Governance Indicators for 1996–2004. Washington, DC: World Bank.
Milazzo, Annamaria and Margaret Grosh. 2008. Social Safety Nets in World Bank Lending and Analytic Work: FY2002 – 2007. Social Protection Discussion Paper No. 0810. Washington, DC: World Bank.
OECD (Organisation for Economic Co-operation and Development). 2004. OECD Social Expenditure database (SOCX) http://www.oecd.org/els/social/expenditure.
Schwabish, Jonathan, Timothy M. Smeeding, and Lars Osberg. 2004. “Income Distribution and Social Expenditures: A Crossnational Perspective.” Luxembourg Income Study Working Paper 350. Luxembourg.
Ter-Minassian, Teresa. 1997. Fiscal Federalism in Theory and Practice. Washington, DC: International Monetary Fund.
University of Maryland, Polity IV Project: Political Regimes Characteristics and Transitions, 1800-2006 http://www.systemicpeace.org/polity/polity4.htm
World Bank, 2005. “Peru—Social Safety Nets in Peru: Background Paper for RECURSO Study.” World Bank, Latin America and the Caribbean Region, Human Development Department, Bolivia, Ecuador, Peru, and Venezuela Country Management Unit, Washington, DC.
—. 2007a. Income Transfer Policies in Uruguay: Closing the Gaps to Increase Welfare. Report No. 40084-UY. Washington, DC: World Bank. —. 2007b. World Development Indicators Washington, DC: World Bank World Values Survey, www.worldvaluessurvey.org.

14

7/24/2008 DRAFT - NOT FOR QUOTATION
Spending on Social Safety Nets: Comparative Data compiled from World Bank Analytic Work
The spending estimates presented here reflect the compilation of country-specific spending numbers reported in World Bank Analytical Work. The estimates in no way reflect the official position of the World Bank, its Executive Directors, or the countries they represent. As discussed in further detail below, these numbers are only estimates and are subject to a number of caveats. A complete list of the data and its sources can be found on the worksheet titled "DATA".
This spreadsheet presents the estimates of spending on social safety nets and social protection more broadly from 75 countries based on World Bank reports that tried to compile comprehensive country-specific numbers on the subject. Details of the methods used to find pertinent reports and interpret the data are given in Box 1 below. In addition, this file contains a number of graphs generated using this data as well as data on health and education expenditures and GDP/capita PPP*.
This compilation suffers from two main flaws, incomplete coverage and problems of comparability.
Incomplete coverage: We have been able to find data between the years of 1996 and 2006 that we are comfortable presenting for 87 countries. Coverage is variable by region. It is pretty good in ECA with 25 of 29 countries covered (and 96% of the population in the region covered). But it is much worse in Africa, with 9 of 47 of the countries covered (and 18% of the population in the region covered.). The countries we have data for are those where for some reason safety nets are prominent in the policy arena. How much and in which direction this biases the results is unclear. In some places the reason for prominence in policy dialogue is the fiscal need to reduce spending on social protection, in others it is because of a felt need to increase it.
Comparability: Because the compilations were done by authors almost as numerous as the number of countries covered, the precise definition of what to include in the safety net differed. We report the composites largely as they occur in the reports, trusting the judgment of the authors of the individual reports to include what was pertinent and manageable to find in any given country.
* source: WDI 2005. Series used are "health expenditure, public (% of GDP)" (SH.XPD.PUBL.ZS), "Public spending on education, total (% of GDP)" (SE.XPD.TOTL.GD.ZS) and "GDP per capita, PPP (current international $)" (NY.GDP.PCAP.PP.CD) for the same year as the data on social protection spending (or closest available).
Should you have data on a country not listed, corrections to the data quoted, or suggestions for additional sources of data, please contact Margaret Grosh ([email protected]) or Christine Weigand ([email protected]). This i i k d h i t h l d f db k
Box 1: DETERMINING SOCIAL PROTECTION EXPENDITURE
A. Procedures followed to identify relevant documents:1) Reviewed all documents listed on the World Bank Public Expenditure Reviews (PERs) website as published (http://www1.worldbank.org/publicsector/pe/pers.htm)2) Reviewed all documents listed on the World Bank Social Protection/Safety Net website (http://www1.worldbank.org/sp/safetynets)3) Reviewed all documents identified on the Social Protection Risk Management category in the World Bank Country Analytic website (http://imagebank.worldbank.org/servlet/main?pagePK=64146063&piPK=64146068&theSitePK=501889&function=BrowseFR&menuPK=64106936&siteName=IMAGEBANK&searchMenuPK=64258127&LeftNavVal=658100&conceptattcode=658100|Labor%20%26%20Social%20Protections~644291&pathtreeid=MAJDOCTY_SEARCH_SECTR&sortattcode=DOCDT+Descclass=)4) Went country-by-country for all developing countries in the World Bank Country Analytic website and reviewed all studies that were not captured in 1- 3 above, with particular attention to Poverty Assessments and PERs
B. Within each document searched for the following key words:1) Social Protection2) Social Insurance3) Social Assistance4) Welfare5) Insurance6) Pensions
C. Caveats on Data:Non-comparability due to the fact that some data may be outdated but especially to fact that documents differed widely on their definitions of social protection. This was especially true with respect to:1) Non-contributory pensions - sometimes included as part of social insurance and other times as part of social assistance;2) Health insurance - most often included as part of health sector spending but sometimes included as part of social protection spending3) Active labor market programs –infrequent mention of active labor market programs other than public works4) Child welfare, social services and institutional care – variability in whether these were included5) external financing - the data on Ethiopia and Malawi does include externally financed spending.Which programs are covered in the data quoted for each country is described in more detail in the worksheet titled "DATA".
D. Rules followed for data cleaning1) when 'year' was not available, used the year of the report2) when 'year' was available only in a 2 year range (ex. 2001/02), used the earlier of both3) when other data (Gini, other public expenditures, etc...) were not available for that specific year, used the data which was closest to that year and/or most recent (and added comment to fields in 'DATA' sheet)
Please provide comments and revised or additional data and reports to Christine Weigand ([email protected]). Thank you.

7/24
/200
8D
RA
FT -
NO
T FO
R Q
UO
TATI
ON
Cou
ntry
Soci
al In
sura
nce
Exp
endi
ture
s as
a %
of G
DP
Soci
al A
ssis
tanc
e E
xpen
ditu
res a
s a
% o
f GD
P
Tot
al S
ocia
l Pr
otec
tion
Exp
endi
ture
s as
a %
of G
DP
Soci
al A
ssis
tanc
e as
a %
of S
ocia
l Pr
otec
tion
Yea
rSo
cial
Insu
ranc
e co
vera
geSo
cial
Ass
ista
nce
cove
rage
Sour
ceA
frica
Sub
-Sah
aran
Ben
in0.
9N
AN
AN
A20
03pe
nsio
nsN
AB
enin
- En
hanc
ing
the
effe
ctiv
enes
s of
publ
ic sp
endi
ng -
a re
view
of t
hree
se
ctor
s
Bot
swan
aN
AN
A2.
7N
A19
96so
cial
secu
rity
and
wel
fare
Jam
aica
- Fi
scal
con
solid
atio
n fo
r gr
owth
and
pov
erty
redu
ctio
n - a
Pub
lic
Expe
nditu
re R
evie
w
Bur
kina
Fas
o0.
1N
AN
AN
A20
02so
cial
secu
rity
NA
Bur
kina
Fas
o - R
educ
ing
pove
rty
thro
ugh
sust
aine
d eq
uita
ble
grow
th -
pove
rty a
sses
smen
t
Ethi
opia
NA
4.5
NA
NA
2001
/02
NA
food
-for
-wor
k pr
ogra
m, f
ree
prov
isio
n of
food
pr
ovid
ed a
s rel
ief a
id, f
ood
aid
dist
ribut
ed
unde
r the
Em
ploy
men
t Gen
erat
ion
Sche
me
(all
off-
budg
et)
Ethi
opia
Pub
lic E
xpen
ditu
re R
evie
w -
The
Emer
ging
Cha
lleng
e, V
ol. 1
, Pub
lic
Spen
ding
in th
e So
cial
Sec
tors
200
0-20
20, 2
004.
Mad
agas
car
1.2
0.9
2.1
42.9
2002
pens
ions
labo
ur-in
tens
ive
wor
ks, n
utrit
ion,
em
erge
ncy
resp
onse
to n
atur
al d
isas
ters
, sch
ool a
nd h
ealth
fe
e w
aive
rs
Safe
ty N
et P
rogr
ams i
n M
adag
asca
r: St
rate
gic
Issu
es a
nd O
ptio
ns (2
004)
Mal
awi
1.7
4.4
6.1
72.1
1999
-200
0Pe
nsio
ns, r
etire
men
t gra
tuiti
es a
nd d
eath
gr
atui
ties f
or p
ublic
sect
or w
orke
rsTr
ansf
ers
Mal
awi P
ublic
Exp
endi
ture
s, Is
sues
and
O
ptio
ns, S
epte
mbe
r 200
1, R
epor
t No.
22
440
MA
I
Mau
ritiu
s4.
25.
39.
555
.820
01/0
2B
asic
Ret
irem
ent P
ensi
on (n
on-
cont
ribut
ory)
, civ
il se
rvan
ts sc
hem
edi
rect
tran
sfer
sche
mes
to h
ouse
hold
s, sy
stem
of
hou
sing
subs
idie
sM
aurit
ius -
The
New
Eco
nom
ic A
gend
a an
d Fi
scal
Sus
tain
abili
ty
Sene
gal
0.9
0.2
1.0
15.0
2004
soci
al se
curit
y fo
r for
mal
sect
or w
orke
rsna
tiona
l sol
idar
ity fu
nd, s
uppo
rt to
wom
en,
supp
ort t
o di
sadv
anta
ged
grou
ps
Sene
gal -
Man
agin
g R
isks
in R
ural
Se
nega
l: a
mul
ti-se
ctor
al re
view
of
effo
rts to
redu
ce v
ulne
rabi
lity
Sout
h A
fric
aN
A3.
2N
AN
A20
02/0
3N
A
soci
al g
rant
s, in
clud
ing
a ch
ild su
ppor
t gra
nt
(CSG
), a
fost
er c
are
gran
t (FC
G),
two
disa
bilit
y gr
ants
(one
for t
he d
isab
led
pers
on,
the
disa
bilit
y gr
ant (
DG
) and
one
for
care
take
rs, t
he c
are
depe
nden
cy g
rant
(CD
G))
, a
stat
e ol
d-ag
e pe
nsio
n (S
OA
P), a
nd g
rant
s-in
-ai
d (G
IA),
a fo
rm o
f loc
al so
cial
ass
ista
nce
Soci
al P
rote
ctio
n in
Sou
th A
fric
a: T
he
Soci
al G
rant
s Sys
tem
. A n
ote
prep
ared
fo
r the
Cou
ntry
Par
tner
ship
Stra
tegy
. 20
06
Eas
t Asi
a an
d P
acifi
c
Cam
bodi
aN
AN
A0.
7N
A20
02
Cam
bodi
a En
hanc
ing
Serv
ice
Del
iver
y th
roug
h Im
prov
ed R
esou
rce
Allo
catio
n an
d In
stitu
tiona
l Ref
orm
, Int
egra
ted
Fidu
ciar
y A
sses
smen
t and
Pub
lic
Expe
nditu
re R
evie
w, S
epte
mbe
r 8,
2003
, Rep
ort N
o. 2
5611
-KH
Chi
na1.
60.
42.
0720
.820
06so
cial
insu
ranc
e, a
ctiv
e la
bor m
arke
t pr
ogra
ms
soci
al w
elfa
re a
nd re
lief (
mos
tly so
cial
as
sist
ance
and
nat
ural
dis
aste
r rel
ief)
Stat
istic
al y
earb
ooks
(fro
m X
iaoq
ing)
Indo
nesi
aN
A1.
3N
AN
A20
06N
Aso
cial
ass
ista
nce
Indo
nesi
a pu
blic
exp
endi
ture
revi
ew
2007
- Sp
endi
ng fo
r dev
elop
men
t :
mak
ing
the
mos
t of I
ndon
esia
's ne
w
oppo
rtuni
ties
Kor
ea, R
ep.
NA
NA
1.9
NA
1997
/98
Pens
ions
, une
mpl
oym
ent,
heal
th in
sura
nce,
di
sabi
lity
insu
ranc
e/be
nefit
s
Cas
h tra
nfer
s, no
n-co
ntrib
utor
y pe
nsio
ns,
publ
ic w
orks
, wag
e su
bsid
ies,
hous
ing
subs
idie
s, fe
e w
aive
rs, f
ood
and
nutri
tion
Soci
al S
afet
y N
ets i
n R
espo
nse
to C
risis
: Le
sson
s and
Gui
delin
es fr
om A
sia
and
Latin
Am
eric
a, 2
001
(Sub
mitt
ed to
the
APE
C F
inan
ce M
inis
ters
, Feb
ruar
y 20
01)
soci
al p
rote
ctio
n (c
over
s a b
road
rang
e of
are
as, i
nclu
ding
une
mpl
oym
ent,
soci
al
excl
usio
n, a
nd d
isas
ter r
elie
f)
Ple
ase
prov
ide
com
men
ts a
nd re
vise
d or
add
ition
al d
ata
and
repo
rts to
Chr
istin
e W
eiga
nd (c
wei
gand
@w
orld
bank
.org
). Th
ank
you.

7/24
/200
8D
RA
FT -
NO
T FO
R Q
UO
TATI
ON
Cou
ntry
Soci
al In
sura
nce
Exp
endi
ture
s as
a %
of G
DP
Soci
al A
ssis
tanc
e E
xpen
ditu
res a
s a
% o
f GD
P
Tot
al S
ocia
l Pr
otec
tion
Exp
endi
ture
s as
a %
of G
DP
Soci
al A
ssis
tanc
e as
a %
of S
ocia
l Pr
otec
tion
Yea
rSo
cial
Insu
ranc
e co
vera
geSo
cial
Ass
ista
nce
cove
rage
Sour
ce
Mal
aysi
a1.
4N
AN
AN
A19
99Pe
nsio
ns
Wel
fare
for p
oor;
soci
al a
ssis
tanc
e pr
ogra
ms
for e
lder
ly, d
isab
led,
orp
hans
, and
oth
er
vuln
erab
le g
roup
s; re
train
ing
and
retre
nchm
ent
bene
fits f
or th
e un
empl
oyed
Mal
aysi
a Pu
blic
Exp
endi
ture
s, M
anag
ing
the
Cris
is; C
halle
ngin
g th
e Fu
ture
, May
22,
200
0, R
epor
t No.
20
371
-MA
Mon
golia
5.9
1.4
7.3
18.5
2000
Pens
ions
(old
-age
, per
man
ent d
isab
ility
an
d su
rviv
or's)
and
shor
t ter
m b
enef
its
(sic
knes
s, te
mpo
rary
dis
abili
ty, a
nd
mat
erni
ty b
enef
its, f
uner
al g
rant
, wor
k in
jury
and
illn
ess b
enef
its, u
nem
ploy
men
t be
nefit
)
Soci
al a
ssis
tanc
e pe
nsio
n (o
ld a
ge, p
erm
anen
t di
sabi
lity,
and
surv
ivor
s) o
ne ti
me
and
shor
t te
rm b
enef
its (m
ater
nity
, chi
ld c
are,
infa
nt
gran
t, tw
ins g
rant
, gua
rdia
n be
nefit
)
Mon
golia
Pub
lic E
xpen
ditu
re a
nd
Fina
ncia
l Man
agem
ent R
evie
w,
Brid
ging
the
Publ
ic E
xpen
ditu
re
Man
agem
ent G
ap, J
une
2002
, Rep
ort
No.
244
39-M
OG
Phili
ppin
esN
A0.
22N
AN
A20
05N
A
cash
and
in-k
ind
trans
fers
, pub
lic w
orks
pr
ogra
ms,
com
mun
ity-b
ased
pro
gram
s, liv
elih
ood
crea
tion,
pro
visi
on o
f bas
ic so
cial
se
rvic
es
Rev
iew
of G
over
nmen
t Pro
gram
s and
Sp
endi
ng P
riorit
ies f
or S
ocia
l Wel
fare
So
cial
Pro
tect
ion
and
Soci
al
Dev
elop
men
t: Ph
ase
I (R
osar
io
Man
asan
, Oct
ober
200
6)
Thai
land
NA
NA
0.6
NA
2001
Mat
erni
ty b
enef
its, i
llnes
s, di
sabi
lity
and
deat
h be
nefit
s, di
sabi
lity
bene
fits,
pens
ions
, chi
ld a
llow
ance
s
Cas
h tra
nsfe
rs (f
amily
allo
wan
ce, s
ocia
l pe
nsio
n );
in-k
ind
trans
fers
(sub
sidi
zed
med
ical
serv
ices
, hou
sing
pro
gram
s, sc
hool
fe
edin
g, so
cial
serv
ices
); jo
b cr
eatio
n sc
hem
es
and
publ
ic w
orks
Thai
land
Cou
ntry
Dev
elop
men
t Pa
rtner
ship
, Soc
ial P
rote
ctio
n, Ju
ne
2002
, Rep
ort N
o. 2
4377
Vie
tnam
1.5
1.1
2.6
42.3
1998
Soci
al a
nd H
ealth
Insu
ranc
eSo
cial
Gua
rant
ee a
nd P
rote
ctio
n C
ente
rs a
nd
Dire
ct T
rans
fers
Vie
tnam
, Man
agin
g Pu
blic
Res
ourc
es
Bet
ter,
Publ
ic E
xpen
ditu
re R
evie
w
2000
, (In
Tw
o V
olum
es) V
olum
e I a
nd
II, D
ecem
ber 1
3, 2
000,
Rep
ort N
o.
2102
1 -V
NE
aste
rn a
nd C
entra
l Eur
ope
Alb
ania
5.5
1.2
6.7
17.9
2005
pens
ions
, allo
wan
ces f
or v
eter
ans,
mat
erni
ty, l
abor
mar
ket p
rogr
ams
inco
me
assi
stan
ce, d
isab
ility
ben
efits
, soc
ial
inst
itutio
ns, o
ther
s
Alb
ania
Res
truct
urin
g Pu
blic
Exp
endi
ture
to
Sust
ain
Gro
wth
A P
ublic
Exp
endi
ture
an
d In
stitu
tiona
l Rev
iew
Arm
enia
3.0
2.1
5.1
41.1
2002
Old
-age
, dis
abili
ty, s
urvi
vors
pen
sion
s, si
ckne
ss, m
ater
nity
and
une
mpl
oym
ent
bene
fits)
Mon
thly
cas
h fa
mily
pov
erty
ben
efits
, soc
ial
pens
ion,
new
born
pay
men
t, ch
ild c
are
allo
wan
ce, p
ublic
wor
ks),
med
ico-
soci
al
reha
bilit
atio
n fo
r vet
eran
s and
the
disa
bled
, se
rvic
es a
t hom
e, in
stitu
tiona
l car
e an
d pr
ice
disc
ount
s.
Arm
enia
Pub
lic E
xpen
ditu
re R
evie
w,
Apr
il 28
, 200
3, R
epor
t No.
244
34-A
M
Aze
rbai
jan
3.7
1.6
5.3
30.2
2001
Pens
ions
, ill
ness
, dis
abili
ty a
nd
unem
ploy
men
t ben
efits
, sup
plem
enta
ry
allo
wan
ces f
or n
on-w
orki
ng p
ensi
oner
s
Chi
ld a
nd fa
mily
allo
wan
ces,
mat
erni
ty le
ave,
fu
nera
l allo
wan
ces,
sick
leav
e, sa
nato
rium
vo
uche
rs, m
onth
ly a
llow
ance
to p
erso
ns
disa
bled
dur
ing
mili
tary
serv
ice,
add
ition
al
mon
thly
allo
wan
ces t
o di
sabl
ed p
erso
ns, s
ocia
l pe
nsio
ners
and
Che
noby
l vic
tims
Aze
rbai
jan
Rep
ublic
Pov
erty
A
sses
smen
t, (I
n Tw
o V
olum
es) V
olum
e II
: The
Mai
n R
epor
t, Ju
ne 4
, 200
3,
Rep
ort N
o. 2
4890
-AZ
Bel
arus
NA
NA
14.4
NA
2001
Pens
ions
300
bene
fits,
subs
idie
s and
priv
ilege
s.B
elar
us S
treng
then
ing
Publ
ic R
esou
rce
Man
agem
ent,
June
20,
200
3, R
epor
t No.
26
041-
BY
Bos
nia
and
Her
zego
vina
8.9
6.9
15.8
43.7
2000
Pens
ions
Var
ious
cas
h tra
nsfe
rs, v
eter
ans b
enef
its,
soci
al se
rvic
es a
nd c
hild
pro
tect
ion
Bos
nia
and
Her
zego
vina
, Fro
m A
id
Dep
ende
ncy
to F
isca
l Sel
f-R
elia
nce,
A
Publ
ic E
xpen
ditu
re a
nd In
stitu
tiona
l R
evie
w, O
ctob
er 2
002,
Rep
ort
No.
2429
7-B
IH
Ple
ase
prov
ide
com
men
ts a
nd re
vise
d or
add
ition
al d
ata
and
repo
rts to
Chr
istin
e W
eiga
nd (c
wei
gand
@w
orld
bank
.org
). Th
ank
you.
7/24
/200
8D
RA
FT -
NO
T FO
R Q
UO
TATI
ON
Cou
ntry
Soci
al In
sura
nce
Exp
endi
ture
s as
a %
of G
DP
Soci
al A
ssis
tanc
e E
xpen
ditu
res a
s a
% o
f GD
P
Tot
al S
ocia
l Pr
otec
tion
Exp
endi
ture
s as
a %
of G
DP
Soci
al A
ssis
tanc
e as
a %
of S
ocia
l Pr
otec
tion
Yea
rSo
cial
Insu
ranc
e co
vera
geSo
cial
Ass
ista
nce
cove
rage
Sour
ce
Bul
garia
9.5
1.2
10.7
11.2
2004
pens
ions
, une
mpl
oym
ent b
enef
itsgu
aran
teed
min
imum
inco
me,
oth
er b
enef
its
for s
peci
fic g
roup
s suc
h as
chi
ldre
n an
d th
e di
sabl
edEC
A ta
rget
ing
stud
y
Cro
atia
12.4
1.8
14.2
12.7
2000
Pens
ions
and
une
mpl
oym
ent b
enef
itsTa
rget
ed c
ash
trans
fers
and
chi
ld a
nd fa
mily
al
low
ance
Cro
atia
, Reg
aini
ng F
isca
l Sus
tain
abili
ty
and
Enha
ncin
g Ef
fect
iven
ess,
A P
ublic
Ex
pend
iture
and
Inst
itutio
nal R
evie
w,
Nov
embe
r 200
1, R
epor
t No.
221
55-H
R
Cze
ch R
epub
lic11
.42.
413
.817
.420
00Pe
nsio
ns, s
ickn
ess a
nd m
ater
nity
ben
efits
, an
d un
empl
oym
ent b
enef
it
Inco
me-
test
ed c
hild
allo
wan
ces a
nd so
cial
su
pple
men
ts; a
nd n
on-in
com
e te
sted
par
enta
l be
nefit
s, ch
ildbi
rth g
rant
s, an
d fo
ster
car
e be
nefit
s, sc
hool
tran
spor
tatio
n al
low
ance
s, ho
usin
g be
nefit
s, de
ath
gran
ts, a
nd su
ppor
t to
fam
ilies
of t
hose
in c
ompu
lsor
y m
ilita
ry
serv
ices
Cze
ch R
epub
lic, E
nhan
cing
the
Pros
pect
s for
Gro
wth
with
Fis
cal
Stab
ility
, Sep
tem
ber 2
001,
A W
OR
LD
BA
NK
CO
UN
TRY
STU
DY
228
87
Geo
rgia
2.7
1.5
4.2
35.7
2000
Pens
ions
(ret
irem
ent,
disa
bilit
y, so
cial
and
su
rvis
ors)
, com
pens
atio
n/al
low
ance
for
mat
erni
ty a
nd si
ck le
ave
Cas
h tra
nsfe
rs to
inte
rnal
ly d
ispl
aced
per
sons
(I
DPs
); an
d a
limite
d po
verty
ben
efit
prog
ram
s
Geo
rgia
, Pub
lic E
xpen
ditu
re R
evie
w,
Nov
embe
r 25,
200
2, R
epor
t No.
229
13-
GE
Kaz
akhs
tan
3.2
2.2
5.4
40.7
2002
pens
ions
and
une
mpl
oym
ent b
enef
itssp
ecia
l sta
te a
llow
ance
s, so
cial
ass
ista
nce
Kaz
akhs
tan
Dim
ensi
ons o
f Pov
erty
in
Kaz
akhs
tan
(Vol
I)
Kos
ovo
3.3
2.5
5.8
43.1
2003
Pens
ions
Soci
al a
ssis
tanc
eK
osov
o - P
over
ty a
sses
smen
t -
prom
otin
g op
portu
nity
, sec
urity
, and
pa
rtici
patio
n fo
r all
Kyr
gyz
Rep
ublic
5.1
0.7
5.8
12.1
2001
Pens
ions
, sic
knes
s, m
ater
nity
and
fune
ral
bene
fits
Mon
thly
ben
efits
and
allo
wan
ceK
yrgy
z R
epub
lic, E
nhan
cing
Pro
-poo
r G
row
th, S
epte
mbe
r 30,
200
3, R
epor
t N
o. 2
4638
-KG
Latv
ia9.
91.
311
.311
.920
01O
ld-a
ge a
nd o
ther
pen
sion
s, un
empl
oym
ent b
enef
its
Cas
h tra
nsfe
rs (h
ousi
ng b
enef
it, h
ealth
(car
e)
bene
fit, l
ow-in
com
e fa
mily
cas
h be
nefit
and
ot
her b
enef
its) a
nd in
kin
d be
nefit
s (ho
usin
g,
soci
al c
are
and
reha
bilit
atio
n) a
nd o
ther
soci
al
trans
fers
(sch
olar
ship
s, si
ckne
ss b
enef
its,
fune
ral g
rant
)
Latv
ia -
The
ques
t for
jobs
and
gro
wth
- A
Wor
ld B
ank
Cou
ntry
Eco
nom
ic
Mem
oran
dum
Mac
edon
ia, F
YR
10.6
1.4
12.0
11.7
2000
Pens
ions
and
dis
abili
ty,
unem
ploy
men
t he
alth
insu
ranc
eM
eans
-test
ed c
ash
bene
fits
FYR
of M
aced
onia
Pub
lic E
xpen
ditu
re
and
Inst
itutio
nal R
evie
w, A
pril
2, 2
002,
R
epor
t No.
233
49-M
K
Mol
dova
7.5
1.7
9.2
18.4
2005
old-
age
retir
ee p
ensi
ons (
diff
eren
t for
ag
ricul
tura
l and
non
-agr
icul
tura
l sec
tor)
, di
sabi
lity
pens
ions
, sur
vivo
r pen
sion
s (c
ontri
buto
ry)
co
mpe
nsat
ions
for u
tiliti
es p
aym
ents
, chi
ld
bene
fits,
war
vet
eran
s allo
wan
ces,
soci
al
allo
wan
ces,
mat
eria
l ass
ista
nce,
tran
spor
t co
mpe
nsat
ions
for d
isab
led,
Che
mob
yl
com
pens
atio
ns, d
eath
gra
nts a
nd c
are-
take
rs
allo
wan
ces f
or d
isab
led
Mol
dova
- Im
prov
ing
publ
ic e
xpen
ditu
re
effic
ienc
y fo
r gro
wth
and
pov
erty
re
duct
ion
Pola
nd16
.31.
117
.46.
120
00Pe
nsio
ns, u
nem
ploy
men
t, di
sabi
lity,
si
ckne
ss a
nd o
ther
ben
efits
soci
al a
ssis
tanc
ePo
land
- To
war
d a
fisca
l fra
mew
ork
for
grow
th -
a pu
blic
exp
endi
ture
and
in
stitu
tiona
l rev
iew
Rom
ania
8.9
1.1
10.0
11.0
2002
Old
age
and
inva
lidity
pen
sion
s, su
rviv
ors’
be
nefit
s, un
empl
oym
ent i
nsur
ance
, se
vera
nce
paym
ents
, mat
erni
ty a
nd c
hild
be
nefit
s, si
ck le
ave,
fune
ral b
enef
its
Min
imum
Inco
me
Gua
rant
ee b
enef
its, h
eatin
g su
bsid
ies,
stat
e ch
ild a
llow
ance
and
su
pple
men
tary
chi
ld b
enef
it
Rom
ania
Pov
erty
Ass
essm
ent,
(In
Two
Vol
umes
) Vol
ume
I: M
ain
Rep
ort,
Sept
embe
r 30,
200
3, R
epor
t No.
261
69-
RO
Ple
ase
prov
ide
com
men
ts a
nd re
vise
d or
add
ition
al d
ata
and
repo
rts to
Chr
istin
e W
eiga
nd (c
wei
gand
@w
orld
bank
.org
). Th
ank
you.

7/24
/200
8D
RA
FT -
NO
T FO
R Q
UO
TATI
ON
Cou
ntry
Soci
al In
sura
nce
Exp
endi
ture
s as
a %
of G
DP
Soci
al A
ssis
tanc
e E
xpen
ditu
res a
s a
% o
f GD
P
Tot
al S
ocia
l Pr
otec
tion
Exp
endi
ture
s as
a %
of G
DP
Soci
al A
ssis
tanc
e as
a %
of S
ocia
l Pr
otec
tion
Yea
rSo
cial
Insu
ranc
e co
vera
geSo
cial
Ass
ista
nce
cove
rage
Sour
ce
Rus
sian
Fed
erat
ion
7.2
1.8
9.0
20.0
2006
Pens
ions
and
oth
er so
cial
insu
ranc
e,
unem
ploy
men
t ins
uran
ce a
nd A
LMPs
Priv
ilege
s for
hou
sing
and
com
mun
al se
rvic
es,
vict
ims o
f rad
iatio
n, a
nd re
habi
litat
ed p
erso
ns,
inco
me-
test
ed so
cial
ass
ista
nce
prog
ram
s in
clud
ing
child
allo
wan
ces,
hous
ing
and
utili
ty
allo
wan
ces a
nd re
gion
al p
rogr
ams f
or
poor
/vul
nera
ble
Rus
sia
Pove
rty A
sses
smen
t
Serb
ia12
.61.
414
.010
.020
05Pe
nsio
ns, v
eter
ans,
unem
ploy
ed
Wag
e co
mpe
nsat
ion
durin
g m
ater
nity
, chi
ld
allo
wan
ce, b
irth
gran
t (pa
rent
al a
llow
ance
), ed
ucat
iona
l pro
gram
bef
ore
first
gra
de, s
ocia
l as
sist
ance
to p
oor h
ouse
hold
s (M
OP)
, ca
regi
ver's
allo
wan
ce, s
ocia
l ins
titut
ions
Serb
ia S
ocia
l Ass
ista
nce
and
Chi
ld
Prot
ectio
n N
ote
Mon
tene
gro
16.0
2.0
18.0
11.1
2002
Pens
ions
vario
us so
cial
ass
ista
nce
prog
ram
s, in
clud
ing
child
allo
wan
ces
Serb
ia a
nd M
onte
negr
o Po
verty
A
sses
smen
t, V
olum
e I a
nd II
, Nov
embe
r 20
03, R
epor
t No.
2601
1-Y
U
Slov
ak R
epub
lic9.
43.
713
.128
.2no
t giv
enPe
nsio
ns, s
ickn
ess a
nd m
ater
nity
ben
efits
, un
empl
oym
ent b
enef
its
Cas
h an
d in
-kin
d be
nefit
s for
the
poor
and
di
sabl
ed, c
hild
and
par
ent a
llow
ance
s, so
cial
an
d w
ives
' pen
sion
, sub
sidi
es fo
r spa
car
e,
birth
and
dea
th g
rant
s, ho
usin
g al
low
ance
, in
stitu
tiona
l car
e, a
ctiv
e la
bor m
arke
t pr
ogra
ms
Slov
ak R
epub
lic D
evel
opm
ent P
olic
y R
evie
w, (
In T
wo
Vol
umes
) Vol
ume
II:
Mai
n R
epor
t, N
ovem
ber 2
002,
Rep
ort
No.
2521
1 -S
K
Tajik
ista
n1.
80.
21.
910
.519
99Pe
nsio
ns fo
r eld
erly
, dis
able
d an
d su
rviv
ors
cash
ben
efits
to fa
mili
es w
ith c
hild
ren,
st
uden
ts, t
he d
isab
led
Tajik
ista
n Po
verty
Ass
essm
ent
Turk
ey7.
22.
19.
322
.620
04so
cial
secu
rity
not s
peci
fied
[cal
cula
ted
spen
ding
as
diff
eren
ce b
etw
een
SP a
nd S
S]Tu
rkey
- Pu
blic
exp
endi
ture
revi
ew
Ukr
aine
9.8
3.2
13.0
24.6
2000
Pens
ions
, mat
erni
ty, c
hild
gra
nt,
empl
oym
ent r
elat
ed p
rogr
ams
Soci
al p
rivile
ges (
hous
ing,
hou
sing
m
aint
enan
ce, p
ublic
tran
spor
tatio
n, re
nova
tion
of re
side
nces
, acq
uisi
tion
of h
ousi
ng b
elow
m
arke
t cos
t, su
bsid
ized
cre
dit,
phon
e se
rvic
e,
drug
s and
med
ical
serv
ices
, fre
e or
subs
idiz
ed
auto
mob
iles,
tax
exem
ptio
ns, l
egal
serv
ices
); C
hern
obyl
ben
efits
; hou
sing
and
util
ities
al
low
ance
; 11
diff
eren
t cat
egor
ical
and
mea
ns
test
ed fa
mily
ben
efits
; and
oth
er p
rogr
ams.
Ukr
aine
: SO
CIA
L SA
FETY
NET
S A
ND
POV
ERTY
, VO
LUM
E 1,
June
15,
20
01, R
epor
t No.
226
77 U
A
Uzb
ekis
tan
7.0
2.0
9.0
22.2
2000
Pens
ions
, une
mpl
oym
ent b
enef
itsC
hild
allo
wan
ces,
pove
rty b
enef
its, s
ubsi
dize
d cr
edit,
hou
sing
priv
ilege
s
Uzb
ekis
tan
Livi
ng S
tand
ards
A
sses
smen
t, Po
licie
s To
Impr
ove
Livi
ng
Stan
dard
s, (I
n Tw
o V
olum
es) V
olum
e II
: Ful
l Rep
ort,
May
200
3, R
epor
t No.
25
923-
UZ
Latin
Am
eric
a an
d C
arrib
ean
Arg
entin
a7.
71.
59.
216
.320
04pe
nsio
n (s
ocia
l sec
urity
) and
em
ploy
men
t re
late
d be
nefit
s (ch
ild a
llow
ance
for f
orm
al
sect
or w
orke
rs &
une
mpl
oym
ent b
enef
its)
cash
tran
sfer
s (je
fes d
e ho
gar &
IDH
CC
T),
food
-bas
ed e
mer
genc
y pr
ogra
ms,
nonp
-co
ntrib
utor
y pe
nsio
ns, o
ther
pro
gram
s pr
ovid
ing
assi
stan
ce li
nked
to h
ealth
and
ed
ucat
ion
and
prov
idin
g fo
r bas
ic n
eeds
Red
istri
butin
g In
com
e to
the
Poor
and
th
e R
ich:
Pub
lic T
rans
fers
in L
atin
A
mer
ica
and
the
Car
ibbe
an. K
athy
Li
nder
t, Em
man
uel S
kouf
ias,
Jose
ph
Shap
iro. A
ugus
t 200
6
Bol
ivia
6.3
2.0
8.3
24.1
2002
soci
al se
curit
y, p
ensi
ons
BO
NO
SOL,
oth
er so
cial
ass
ista
nce
Bol
ivia
Pub
lic E
xpen
ditu
re M
anag
emen
t fo
r Fis
cal S
usta
inab
ility
and
Equ
itabl
e an
d Ef
ficie
nt P
ublic
Ser
vice
s, N
ovem
ber
18, 2
004,
Rep
ort N
o. 2
8519
-BO
Ple
ase
prov
ide
com
men
ts a
nd re
vise
d or
add
ition
al d
ata
and
repo
rts to
Chr
istin
e W
eiga
nd (c
wei
gand
@w
orld
bank
.org
). Th
ank
you.

7/24
/200
8D
RA
FT -
NO
T FO
R Q
UO
TATI
ON
Cou
ntry
Soci
al In
sura
nce
Exp
endi
ture
s as
a %
of G
DP
Soci
al A
ssis
tanc
e E
xpen
ditu
res a
s a
% o
f GD
P
Tot
al S
ocia
l Pr
otec
tion
Exp
endi
ture
s as
a %
of G
DP
Soci
al A
ssis
tanc
e as
a %
of S
ocia
l Pr
otec
tion
Yea
rSo
cial
Insu
ranc
e co
vera
geSo
cial
Ass
ista
nce
cove
rage
Sour
ce
Bra
zil
11.7
1.4
13.1
10.7
2004
pens
ion
bene
fits a
nd e
mpl
oym
ent-r
elat
ed
bene
fits
cond
ition
al c
ash
trans
fers
, tar
gete
d ca
sh
trans
fers
to th
e po
or d
isab
led
and
elde
rly,
soci
al a
ssis
tanc
e fo
r you
th a
nd c
hild
labo
rers
, sc
hool
feed
ing,
var
iety
of o
ther
soci
al se
rvic
es
and
prog
ram
s
Red
istri
butin
g In
com
e to
the
Poor
and
th
e R
ich:
Pub
lic T
rans
fers
in L
atin
A
mer
ica
and
the
Car
ibbe
an. K
athy
Li
nder
t, Em
man
uel S
kouf
ias,
Jose
ph
Shap
iro. A
ugus
t 200
6
Chi
le6.
90.
77.
69.
220
03pe
nsio
n sy
stem
cash
tran
sfer
pro
gram
s, po
tabl
e w
ater
su
bsid
ies,
non-
cont
ribut
ory
assi
stan
ce
pens
ions
, in-
kind
tran
sfer
s, ot
her p
rogr
ams
such
as f
ood-
base
d pr
ogra
ms,
scho
ol fe
edin
g an
d sc
hola
rshi
ps.
Red
istri
butin
g In
com
e to
the
Poor
and
th
e R
ich:
Pub
lic T
rans
fers
in L
atin
A
mer
ica
and
the
Car
ibbe
an. K
athy
Li
nder
t, Em
man
uel S
kouf
ias,
Jose
ph
Shap
iro. A
ugus
t 200
6
Col
ombi
a5.
90.
66.
59.
220
04
pay-
as-y
ou g
o pe
nsio
n sc
hem
e, sp
ecia
l pr
ogra
ms s
uch
as p
ensi
on so
lidar
ity fu
nd
for w
orke
rs in
info
rmal
sect
or, d
isab
led
wor
kers
, and
com
mun
ity m
othe
rs, f
amily
al
low
ance
fund
for l
ow-in
com
e w
orke
rs
and
thei
r fam
ilies
, and
uni
vers
al h
ealth
in
sura
nce
prog
ram
early
chi
ldho
od d
evel
opm
ent p
rogr
ams a
nd
scho
ol fe
edin
g, w
orkf
are
and
elde
rly
prog
ram
s, in
itiat
ives
ass
istin
g th
e in
tern
ally
di
spla
ced
popu
latio
n, n
atio
nal p
rogr
ams t
o al
levi
ate
the
impa
ct o
f hig
h un
empl
oym
ent r
ate
and
hum
an c
apita
l ris
k
Red
istri
butin
g In
com
e to
the
Poor
and
th
e R
ich:
Pub
lic T
rans
fers
in L
atin
A
mer
ica
and
the
Car
ibbe
an. K
athy
Li
nder
t, Em
man
uel S
kouf
ias,
Jose
ph
Shap
iro. A
ugus
t 200
6
Cos
ta R
ica
4.3
1.5
5.8
25.9
2004
cont
ribut
ory
pens
ions
non-
cont
ribut
ory
pens
ions
, cas
h an
d in
-kin
d tra
nsfe
rs, c
are
serv
ices
Cos
ta R
ica
Pove
rty A
sses
smen
t: R
ecap
turin
g M
omen
tum
for P
over
ty
Red
uctio
n
Dom
inic
a3.
42.
25.
638
.720
00-2
001
Pens
ions
, dis
abili
ty, s
urvi
vors
, sic
knes
s, m
ater
nity
, em
ploy
men
t rel
ated
inju
ry a
nd
redu
ndan
cy b
enef
its.
Cas
h tra
nsfe
rs, s
choo
l fee
ding
, edu
catio
n gr
ants
, pub
lic w
orks
, ski
lls tr
aini
ng a
nd a
dult
educ
atio
n, c
omm
unity
bas
ed p
rogr
ams,
off-
isal
nd m
edic
al c
are
Dom
inic
a - O
ECS
fisca
l iss
ues :
pol
icie
s to
ach
ieve
fisc
al su
stai
nabi
lity
and
impr
ove
effic
ienc
y an
d eq
uity
of p
ublic
ex
pend
iture
s
Dom
inic
an R
epub
lic0.
71.
72.
470
.820
04so
cial
insu
ranc
e pe
nsio
ns a
nd re
late
d be
nefit
s
cash
tran
sfer
pro
gram
s, fo
od-b
ased
pro
gram
s su
ch a
s sch
ool l
unch
es, d
irect
food
don
atio
ns,
prog
ram
s tha
t pro
vide
food
at s
ubsi
dize
d pr
ices
, con
sum
ptio
n su
bsid
ies s
uch
as g
as a
nd
esse
ntia
l dru
gs p
rogr
am
Red
istri
butin
g In
com
e to
the
Poor
and
th
e R
ich:
Pub
lic T
rans
fers
in L
atin
A
mer
ica
and
the
Car
ibbe
an. K
athy
Li
nder
t, Em
man
uel S
kouf
ias,
Jose
ph
Shap
iro. A
ugus
t 200
6
Ecua
dor
1.8
1.1
2.9
37.9
2004
Pens
ions
Soci
al w
elfa
re (c
ash
trans
fers
, oth
er)
Ecua
dor -
Cre
atin
g fis
cal s
pace
for
pove
rty re
duct
ion
- A fi
scal
man
agem
ent
and
publ
ic e
xpen
ditu
re re
view
(Vol
. 1 o
f 2)
: M
ain
repo
rt (E
nglis
h)
El S
alva
dor
4.2
1.0
5.2
19.2
2000
NA
52 d
iffer
ent p
rogr
ams,
incl
udin
g so
cial
fund
Soci
al sa
fety
net
ass
essm
ents
from
C
entra
l Am
eric
a : c
ross
-cou
ntry
revi
ew
of p
rinci
pal f
indi
ngs
Gre
nada
1.8
1.6
3.4
47.1
2001
Long
and
shor
t-ter
m e
nefit
s for
sick
ness
, di
sabi
lity,
retir
emen
t and
surv
ivor
s ben
efits
Cas
h tra
nsfe
rs, s
choo
l fee
ding
, nee
dy st
uden
ts
prog
ram
for u
nifo
rms a
nd sc
hool
supp
lies,
gran
ts fo
r nee
dy st
uden
ts, d
ay c
are
cnte
rs, f
ee
wai
vers
for h
ealth
car
e, o
ff-is
land
med
ical
ca
re, s
ubsi
dize
d de
ntal
, opt
ical
cae
and
ph
arm
aceu
tical
s, sk
ills t
rain
ing,
m
icro
ente
rpris
e de
velo
pmen
t, pu
blic
wor
ks,
hous
ing
repa
irs a
ssis
tanc
e, a
ssis
tanc
e w
ith
wat
er, h
omes
for e
lder
ly a
nd in
firm
and
oth
er
prog
ram
.
Gre
nada
- O
ECS
fisca
l iss
ues :
pol
icie
s to
ach
ieve
fisc
al su
stai
nabi
lity
and
impr
ove
effic
ienc
y an
d eq
uity
of p
ublic
ex
pend
iture
Gua
tem
ala
0.70
1.1
1.8
61.1
2000
pens
ion
sche
me
for f
orm
al, p
rivat
e an
d pu
blic
sect
ors,
mai
n su
b-pr
ogra
ms b
eing
ac
cide
nt c
over
age,
mat
erni
ty a
nd si
ckne
ss,
disa
bilit
y, o
ld a
ge p
ensi
ons a
nd su
rviv
al
trans
fers
, sub
sidi
es, d
isas
ter m
anag
emen
t, m
icro
-cre
dit p
rogr
ams
Red
istri
butin
g In
com
e to
the
Poor
and
th
e R
ich:
Pub
lic T
rans
fers
in L
atin
A
mer
ica
and
the
Car
ibbe
an. K
athy
Li
nder
t, Em
man
uel S
kouf
ias,
Jose
ph
Shap
iro. A
ugus
t 200
6G
uyan
aN
AN
A2.
0N
A20
00N
AN
AG
uyan
a - P
ublic
exp
endi
ture
revi
ew
Ple
ase
prov
ide
com
men
ts a
nd re
vise
d or
add
ition
al d
ata
and
repo
rts to
Chr
istin
e W
eiga
nd (c
wei
gand
@w
orld
bank
.org
). Th
ank
you.

7/24
/200
8D
RA
FT -
NO
T FO
R Q
UO
TATI
ON
Cou
ntry
Soci
al In
sura
nce
Exp
endi
ture
s as
a %
of G
DP
Soci
al A
ssis
tanc
e E
xpen
ditu
res a
s a
% o
f GD
P
Tot
al S
ocia
l Pr
otec
tion
Exp
endi
ture
s as
a %
of G
DP
Soci
al A
ssis
tanc
e as
a %
of S
ocia
l Pr
otec
tion
Yea
rSo
cial
Insu
ranc
e co
vera
geSo
cial
Ass
ista
nce
cove
rage
Sour
ce
Hon
dura
s1.
62.
54.
161
.019
99al
l spe
ndin
g fo
r old
age
, dis
abili
ty a
nd
heal
th in
sura
nce
Soci
al In
vest
men
t Fun
d (F
HIS
), th
e Fa
mily
A
ssis
tanc
e Pr
ogra
m a
nd o
ther
pub
lic a
nd n
on-
publ
ic p
rogr
ams
Soci
al sa
fety
net
ass
essm
ents
from
C
entra
l Am
eric
a : c
ross
-cou
ntry
revi
ew
of p
rinci
pal f
indi
ngs
Jam
aica
1.0
0.8
1.8
42.9
2005
/06
pens
ions
, hea
lth b
enef
its
inco
me
supp
ort p
rogr
ams,
scho
ol b
ased
pr
ogra
ms,
com
mun
ity b
ased
pro
gram
s, la
bor
mar
ket i
nter
vent
ions
, hou
sing
pro
gram
s, fe
edin
g pr
ogra
ms,
gran
ts to
NG
Os
data
from
Cor
nelia
Tes
liuc
(LC
SHS)
Mex
ico
2.6
1.0
3.5
28.6
2002
soci
al se
curit
y pr
ogra
m fo
r for
mal
sect
or
wor
kers
incl
udin
g in
divi
dual
retir
emen
t fu
nds,
disa
bilit
y an
d lif
e in
sura
nce
prog
ram
s, fo
r gov
ernm
ent w
orke
rs
incl
udin
g re
tirem
ent p
ensi
on, a
cces
s to
heal
th fa
cilit
ies,
subs
idiz
ed p
harm
acie
s and
re
tail
stor
es, a
nd h
ousi
ng fi
nanc
e as
sist
ance
, and
bas
ic h
ealth
cov
erag
e fo
r w
orke
rs n
ot c
over
ed b
y so
cial
secu
rity.
cash
tran
sfer
pro
gram
s, fo
od-b
ased
pro
gram
s, sc
hool
scho
lars
hips
for v
ulne
rabl
e po
pula
tion,
la
bour
pro
gram
s. Ex
clud
es h
ousi
ng.
Red
istri
butin
g In
com
e to
the
Poor
and
th
e R
ich:
Pub
lic T
rans
fers
in L
atin
A
mer
ica
and
the
Car
ibbe
an. K
athy
Li
nder
t, Em
man
uel S
kouf
ias,
Jose
ph
Shap
iro. A
ugus
t 200
6
Nic
arag
ua5.
41.
16.
516
.920
00
Old
Age
, Dis
abili
ty, a
nd S
urvi
vors
In
sura
nce,
em
ploy
ees'
Hea
lth C
are
Insu
ranc
e an
d w
orke
rs' C
ompe
nsat
ion
Insu
ranc
e.
Prog
ram
s for
chi
ldre
n an
d ad
oles
cent
s, pr
ogra
ms f
or h
urric
ace
ctim
s, co
mm
unity
em
ploy
men
t pro
gram
s, so
cial
ass
ista
nce
unde
rs so
cial
fund
, nat
ural
dis
aste
r pro
gram
, et
c.
Soci
al sa
fety
net
ass
essm
ents
from
C
entra
l Am
eric
a : c
ross
-cou
ntry
revi
ew
of p
rinci
pal f
indi
ngs
Pana
ma
5.0
1.7
6.7
25.4
2005
pens
ions
, une
mpl
oym
ent a
nd h
ealth
(?)
insu
ranc
eca
sh tr
ansf
ers,
scho
ol fe
edin
g, su
bsid
ies
Soci
al P
rote
ctio
n in
Pan
ama
Para
guay
1.8
0.4
2.2
17.9
2000
pens
ion,
hea
lth a
nd m
ater
nity
fund
and
ad
min
istra
tion
vario
us p
rogr
ams f
or t
he p
oor,
wom
en,
disa
bled
, ind
igen
ous
Para
guay
- D
efin
ing
a st
rate
gy fo
r soc
ial
prot
ectio
n po
licy
Peru
3.2
0.7
3.9
18.3
2005
pens
ions
, pub
lic su
bsid
y
Food
-bas
ed p
rogr
ams (
glas
s of M
ilk (V
aso
de
Lech
e)),
Scho
ol B
reak
fast
(Des
ayun
os
Esco
lare
s), C
omm
unity
Kitc
hen
(Com
edor
es
Popu
lare
s), P
AC
FO (f
ood
supp
lem
ent f
or a
t-ris
k ch
ildre
n), W
awa
Was
i (da
ycar
e), S
choo
l lu
nch
(Alm
uerz
on e
scol
ares
)), W
orkf
are
(A
Trab
ajar
Urb
ano,
A T
raba
jar R
ural
), So
cial
Fu
nd/C
omm
unity
-Driv
en D
evel
opm
ent
(FO
NC
OD
ES, P
RO
NA
MC
HC
S)
Prot
ecci
on S
ocia
l en
el P
eru
- Com
o m
ejor
ar lo
s res
ulta
dos p
ara
los p
obre
s?
St. K
itts a
nd N
evis
2.7
1.0
3.7
27.0
2000
Pens
ions
, dis
abili
ty, t
empo
rary
illn
ess,
surv
ivor
s, m
ater
nity
, em
ploy
men
t inj
ury,
m
edic
al a
nd fu
nera
l exp
ense
s and
fund
s fr
non-
cont
ribut
ory
pens
ions
and
inva
lidity
as
sist
ace
Cas
h tra
nsfe
rs, f
ood
vouc
hers
, com
mun
ity
assi
stan
ce fo
r eld
erly
, sch
ool u
nifo
rms,
scho
ol
feed
ing,
edu
cato
n gr
ants
, cat
egor
ical
and
m
eans
test
ed fe
e w
aive
rs fo
r hea
lth c
are,
off
-is
alnd
med
ical
car
e, b
uria
l ass
ista
nce,
skill
s tra
inin
g, a
dult
educ
atio
n, m
icro
ente
rpris
e de
velo
pmen
t, se
vera
nce
sche
me,
feed
ling
prog
ram
, hom
es fo
r the
eld
erly
and
oth
er
prog
ram
s
Sain
t Kitt
s and
Nev
is -
OEC
S fis
cal
issu
es :
polic
ies t
o ac
hiev
e fis
cal
sust
aina
bilit
y an
d im
prov
e ef
ficie
ncy
and
equi
ty o
f pub
lic e
xpen
ditu
res (
2003
)
Ple
ase
prov
ide
com
men
ts a
nd re
vise
d or
add
ition
al d
ata
and
repo
rts to
Chr
istin
e W
eiga
nd (c
wei
gand
@w
orld
bank
.org
). Th
ank
you.

7/24
/200
8D
RA
FT -
NO
T FO
R Q
UO
TATI
ON
Cou
ntry
Soci
al In
sura
nce
Exp
endi
ture
s as
a %
of G
DP
Soci
al A
ssis
tanc
e E
xpen
ditu
res a
s a
% o
f GD
P
Tot
al S
ocia
l Pr
otec
tion
Exp
endi
ture
s as
a %
of G
DP
Soci
al A
ssis
tanc
e as
a %
of S
ocia
l Pr
otec
tion
Yea
rSo
cial
Insu
ranc
e co
vera
geSo
cial
Ass
ista
nce
cove
rage
Sour
ce
St. L
ucia
0.6
2.0
2.6
76.9
2000
-200
1
Shor
t-ter
m b
enef
its fo
r sic
knes
, em
ploy
men
t inj
ur, m
ater
nity
and
fune
ral
expe
nses
, lon
g te
rm b
enef
its fo
r inv
alid
y gr
ants
/pen
sion
, ret
irem
et g
rant
s/pe
nsio
n an
d su
rviv
ors g
rant
s/pe
nsio
n
Cas
h tra
nsfe
rs, s
choo
l fee
ding
, stu
dent
w
elfa
re, d
ay c
are,
subs
idiz
ed m
edic
al c
are
and
phar
mac
eutic
al, o
ff-il
and
med
ical
car
e, sk
ills
train
ing,
mic
roen
terp
rise
deve
lopm
et, a
dult
educ
atio
n an
d lit
erac
y tra
inin
g, sk
ills t
rain
ing,
sh
ort-t
erm
em
ploy
men
t, so
cial
inve
stm
ent
fund
and
oth
er c
omm
unity
bas
ed p
rogr
ams,
hom
es fo
r the
eld
erly
, low
-inco
me
rent
al u
nits
, ho
suin
g re
pairs
pro
gram
s,
OEC
S Fi
scal
Issu
es, d
raft,
200
2
St. V
ince
nt a
nd th
e G
rena
d1.
32.
33.
664
.420
02ad
min
istra
tion
of th
e N
IS (N
atio
nal
Insu
ranc
e) a
nd c
ontri
buto
ry b
enef
its
Publ
ic A
ssis
tanc
e (in
clud
ing
mon
thly
cas
h be
nefit
s and
shor
t-ter
m im
med
iate
ass
ista
nce
in c
ash
and
in-k
ind)
to p
oor f
emal
e-he
aded
ho
useh
olds
with
chi
ldre
n, th
e el
derly
poo
r, an
d th
e di
sabl
ed (i
rres
pect
ive
of in
com
e), a
nd a
va
riety
of o
ther
mea
ns te
sted
wel
fare
pr
ogra
ms,
incl
udin
g ed
ucat
ion
assi
stan
ce fo
r un
iform
s, fe
es a
nd o
ther
rela
ted
expe
nses
, hot
m
eals
for i
ndig
ents
, tra
nspo
rtatio
n su
bsid
ies,
elde
r car
e, a
nd o
ther
pro
gram
s
Sain
t Vin
cent
and
the
Gre
nadi
nes -
O
ECS
fisca
l iss
ues :
Pol
icie
s to
achi
eve
fisca
l sus
tain
abili
ty a
nd im
prov
e ef
ficie
ncy
and
equi
ty o
f pub
lic
expe
nditu
res
Uru
guay
9.6
0.5
10.1
5.0
2005
Pens
ion,
une
mpl
oym
ent i
nsur
ance
fam
ily a
llow
ance
, citi
zen
inco
me
Inco
me
Tran
sfer
Pol
icie
s in
Uru
guay
: C
losi
ng th
e G
aps
Ven
ezue
la, R
B1.
10.
61.
737
.419
98so
cial
secu
rity
Cas
h tra
nsfe
rs to
poo
r fam
ilies
, num
erou
s su
bsid
ies (
food
, med
icin
e, tr
ansp
ort),
scho
ol
feed
ing
prog
ram
s, sc
hool
uni
form
pro
gram
s, he
alth
-bas
ed p
rogr
ams,
child
car
e pr
ogra
ms,
empl
oym
ent a
nd tr
aini
ng p
rogr
ams
Inve
stin
g in
hum
an c
apita
l for
gro
wth
, pr
ospe
rity,
and
pov
erty
redu
ctio
n
Mid
dle
Eas
t and
Nor
th A
frica
Alg
eria
5.0
3.7
8.7
42.5
2000
retir
emen
t, di
sabi
lity
and
surv
ivor
s' pe
nsio
ns, u
nem
ploy
men
t and
hea
lth c
are
insu
ranc
e
fam
ily a
llow
ance
, pen
sion
s for
war
vet
eran
s, ca
sh a
nd in
-kin
d tra
nsfe
rs fo
r chi
ldre
n,
disa
bled
, vic
tims o
f ter
roris
m
Alg
eria
- Pu
blic
exp
endi
ture
revi
ew o
f th
e so
cial
sect
or, V
olum
e 1
Bah
rain
1.4
NA
NA
NA
2000
Con
tribu
tory
pen
sion
s (10
0%)
NA
MEN
A d
atab
ase;
Red
ucin
g V
ulne
rabi
lity
and
Incr
easi
ng
Opp
ortu
nity
, Soc
ial P
rote
ctio
n in
M
ENA
, 200
0
Djib
outi
5.1
4.9
10.0
49.0
2003
pens
ions
and
hea
lth in
sura
nce
trans
fers
to h
ouse
hold
s and
inst
itutio
nsD
jibou
ti - P
ublic
Exp
endi
ture
Rev
iew
(P
ER) -
mak
ing
publ
ic fi
nanc
es w
ork
for
grow
th a
nd p
over
ty re
duct
ion
Egyp
t, A
rab
Rep
.2.
71.
64.
337
.420
00-2
001
Con
tribu
tory
pen
sion
s (10
0%)
Food
subs
idie
s (81
%),
casu
al w
orke
rs sc
hem
e (1
0%),
soci
al a
ssis
tanc
e to
poo
r fam
ilies
(9%
)
MEN
A d
atab
ase;
Red
ucin
g V
ulne
rabi
lity
and
Incr
easi
ng
Opp
ortu
nity
, Soc
ial P
rote
ctio
n in
the
Mid
dle
East
and
Nor
th A
fric
a, R
epor
t N
o.24
559
Iran
, Isl
amic
Rep
.1.
12.
73.
870
.720
00C
ontri
buto
ry p
ensi
ons (
100%
)C
onsu
mer
subs
idie
s (10
0%)
MEN
A d
atab
ase;
Red
ucin
g V
ulne
rabi
lity
and
Incr
easi
ng
Opp
ortu
nity
, Soc
ial P
rote
ctio
n in
the
Mid
dle
East
and
Nor
th A
fric
a, R
epor
t N
o.24
559
Iraq
3.2
15.9
19.1
83.5
2004
pens
ions
, em
ploy
men
t and
trai
ning
fam
ily c
are
allo
wan
ce, d
emob
iliza
tion
allo
wan
ce, p
ublic
wor
kfar
e, P
DS
food
ratio
n
IRA
Q. S
ocia
l Pro
tect
ion
in
Tran
sitio
n: L
abor
Pol
icy,
Saf
ety
Net
s an
d P
ensi
ons.
A P
olic
y N
ote
Ple
ase
prov
ide
com
men
ts a
nd re
vise
d or
add
ition
al d
ata
and
repo
rts to
Chr
istin
e W
eiga
nd (c
wei
gand
@w
orld
bank
.org
). Th
ank
you.

7/24
/200
8D
RA
FT -
NO
T FO
R Q
UO
TATI
ON
Cou
ntry
Soci
al In
sura
nce
Exp
endi
ture
s as
a %
of G
DP
Soci
al A
ssis
tanc
e E
xpen
ditu
res a
s a
% o
f GD
P
Tot
al S
ocia
l Pr
otec
tion
Exp
endi
ture
s as
a %
of G
DP
Soci
al A
ssis
tanc
e as
a %
of S
ocia
l Pr
otec
tion
Yea
rSo
cial
Insu
ranc
e co
vera
geSo
cial
Ass
ista
nce
cove
rage
Sour
ce
Jord
an4.
01.
35.
324
.720
02pu
blic
pen
sion
s
Inco
me
Supp
lem
ent P
rogr
am, C
ash
Ass
ista
nce
for H
andi
capp
ed C
are
Prog
ram
, Em
erge
ncy
and
Exce
ptio
nal A
id P
rogr
am, V
ocat
iona
l R
ehab
ilita
tion
Prog
ram
, Phy
sica
l R
ehab
ilita
tion
Prog
ram
, Dev
elop
men
t of t
he
Educ
atio
nal L
oan
Prog
ram
, Voc
atio
nal
Trai
ning
Pro
gram
and
hou
sing
subs
idy
prog
ram
(0.7
%)
Jord
an ,
Pove
rty A
sses
smen
t, M
ain
Rep
ort,
Vol
ume
2
Kuw
ait
5.9
NA
NA
NA
1996
Con
tribu
tory
pen
sion
s (10
0%)
NA
MEN
A d
atab
ase;
Red
ucin
g V
ulne
rabi
lity
and
Incr
easi
ng
Opp
ortu
nity
, Soc
ial P
rote
ctio
n in
M
ENA
, 200
0
Leba
non
2.5
0.4
2.9
13.8
2004
Pens
ions
and
end
-of i
ndem
nity
serv
ices
for
civi
l ser
vant
s, m
ilita
ry a
nd G
over
nmen
t’s
cont
ract
ual w
orke
rs
amou
nt a
ttrib
uted
to 's
ocia
l aff
airs
' (in
clud
es
0.1%
of a
dmin
exp
endi
ture
s attr
ibut
ed to
so
cial
aff
airs
)
Leba
non
- Pub
lic e
xpen
ditu
re re
view
: re
form
prio
ritie
s for
fisc
al a
djus
tmen
t, gr
owth
and
pov
erty
alle
viat
ion
Mor
occo
2.8
1.9
4.7
40.7
1998
-199
9C
ontri
buto
ry p
ensi
ons (
76%
), he
alth
in
sura
nce
(6%
), fa
mily
allo
wan
ces (
18%
)Fo
od su
bsid
ies (
84%
), pu
blic
wor
ks (1
1%),
Entra
ide
Nat
iona
le (5
%)
MEN
A d
atab
ase;
Kin
gdom
of M
oroc
co
Pove
rty U
pdat
e, (I
n Tw
o V
olum
es)
Vol
ume
II: A
nnex
es, M
arch
30,
200
1,
Rep
ort N
o. 2
1506
-MO
R; R
educ
ing
Vul
nera
bilit
y an
d In
crea
sing
O
ppor
tuni
ty, S
ocia
l Pro
tect
ion
in th
e M
iddl
e Ea
st a
nd N
orth
Afr
ica,
Rep
ort
No.
2455
9
Syria
n A
rab
Rep
ublic
0.6
NA
NA
NA
1999
Con
tribu
tory
pen
sion
s (10
0%)
NA
MEN
A d
atab
ase;
Red
ucin
g V
ulne
rabi
lity
and
Incr
easi
ng
Opp
ortu
nity
, Soc
ial P
rote
ctio
n in
M
ENA
, 200
0
Tuni
sia
4.2
2.3
6.5
35.6
2000
-200
1C
ontri
buto
ry p
ensi
ons (
79%
), he
alth
in
sura
nce
(21%
), do
es n
ot in
clud
e fa
mily
al
low
ance
s
Food
subs
idie
s (73
%),
dire
ct tr
ansf
ers t
o th
e po
or a
nd h
andi
capp
ed (2
2%),
publ
ic w
orks
(5
%)
MEN
A d
atab
ase;
Soc
ial C
ondi
tions
U
pdat
e, 2
000;
Red
ucin
g V
ulne
rabi
lity
and
Incr
easi
ng O
ppor
tuni
ty, S
ocia
l Pr
otec
tion
in th
e M
iddl
e Ea
st a
nd N
orth
A
fric
a, R
epor
t No.
2455
9
Wes
t Ban
k an
d G
aza
NA
NA
5.7
NA
not g
iven
Soci
al se
curit
y, g
over
nmen
t em
ploy
ee
pens
ion
sche
mes
, une
mpl
oym
ent
com
pens
atio
n be
nefit
s
Inco
me
trans
fers
,cas
h as
sist
ance
, foo
d ai
d,
publ
ic w
orks
, sub
sidi
zed
heal
th in
sura
nce
to
fam
ilies
of p
rison
ers
Pove
rty in
the
Wes
t Ban
k an
d G
aza,
Ju
ne 1
8, 2
001,
Rep
ort N
o. 2
2312
-GZ
Yem
en, R
ep.
0.9
1.0
1.9
52.6
1999
Con
tribu
tory
pen
sion
s (10
0%)
Soci
al W
elfa
re F
und
(100
%)
MEN
A d
atab
ase;
Red
ucin
g V
ulne
rabi
lity
and
Incr
easi
ng
Opp
ortu
nity
, Soc
ial P
rote
ctio
n in
the
Mid
dle
East
and
Nor
th A
fric
a, R
epor
t N
o.24
559
Sou
th A
sia
Ban
glad
esh
1.3
0.7
2.0
35.0
2004
pens
ions
, lab
or m
arke
t
soci
al sa
fety
net
pro
gram
s suc
h as
cas
h tra
nsfe
rs (i
nclu
ding
edu
catio
n st
ipen
d an
d as
sist
ance
pro
gram
s as w
ell a
s old
age
al
low
ance
a.o
.) an
d fo
od tr
ansf
ers (
incl
udin
g fo
od fo
r wor
k pr
ogra
ms,
and
food
relie
f pr
ogra
ms)
Soci
al S
afet
y N
ets i
n B
angl
ades
h: A
n A
sses
smen
t. 20
06
Indi
a2.
12.
24.
351
.220
04pu
blic
pen
sion
spu
blic
wor
ks, f
ood
subs
idy,
var
ious
wel
fare
sc
hem
es, m
idda
y m
eals
Soci
al P
rote
ctio
n fo
r a C
hang
ing
Indi
a
Ple
ase
prov
ide
com
men
ts a
nd re
vise
d or
add
ition
al d
ata
and
repo
rts to
Chr
istin
e W
eiga
nd (c
wei
gand
@w
orld
bank
.org
). Th
ank
you.

7/24
/200
8D
RA
FT -
NO
T FO
R Q
UO
TATI
ON
Cou
ntry
Soci
al In
sura
nce
Exp
endi
ture
s as
a %
of G
DP
Soci
al A
ssis
tanc
e E
xpen
ditu
res a
s a
% o
f GD
P
Tot
al S
ocia
l Pr
otec
tion
Exp
endi
ture
s as
a %
of G
DP
Soci
al A
ssis
tanc
e as
a %
of S
ocia
l Pr
otec
tion
Yea
rSo
cial
Insu
ranc
e co
vera
geSo
cial
Ass
ista
nce
cove
rage
Sour
ce
Mal
dive
s0.
20.
20.
450
.020
04pe
nsio
ns
abso
lute
pov
erty
sche
me,
ass
ista
nce
for s
choo
l m
ater
ials
for p
oor f
amili
es, a
ssis
tanc
e fo
r he
alth
-rel
ated
nee
ds (p
re-ts
unam
i, po
st-
tsun
ami=
0.7)
Mal
dive
s - S
ocia
l pro
tect
ion
in th
e M
aldi
ves:
Opt
ions
for r
efor
min
g pe
nsio
ns a
nd sa
fety
net
s
Paki
stan
1.4
0.4
1.8
22.2
2004
/05
pens
ions
cash
tran
sfer
pro
gram
s (Za
kat,
Bai
t-u-M
al),
soci
al w
elfa
re se
rvic
es, m
icro
finan
ce,
wor
kfar
e, sc
hool
feed
ing,
whe
at su
bsid
y
Soci
al P
rote
ctio
n in
Pak
ista
n: M
anag
ing
Hou
seho
ld R
isks
and
Vul
nera
bilit
y
Sri L
anka
2.0
1.0
3.0
33.3
2004
civi
l ser
vice
pen
sion
s
Sam
urdh
i inc
ome
trans
fer t
o th
e po
or, i
ncom
e su
ppor
t for
dis
able
d so
ldie
rs a
nd fa
mili
es o
f se
rvic
e pe
rson
nel w
ho d
ied
in th
e co
nflic
t, as
sist
ance
for p
erso
ns d
ispl
aced
by
the
conf
lict,
emer
genc
y as
sist
ance
to p
eopl
e af
fect
ed b
y na
tura
l dis
aste
rs su
ch a
s dro
ught
an
d flo
ods,
prov
isio
n of
free
text
book
s and
sc
hool
uni
form
s to
child
ren,
and
ass
ista
nce
for
indi
gent
eld
ers a
nd fa
mili
es w
ith d
isab
led
pers
ons a
nd p
eopl
e w
ith in
capa
cita
ting
illne
ss w
ho a
re u
nabl
e to
wor
k
Sri L
anka
Stre
ngth
enin
g So
cial
Pro
tect
ion
Ple
ase
prov
ide
com
men
ts a
nd re
vise
d or
add
ition
al d
ata
and
repo
rts to
Chr
istin
e W
eiga
nd (c
wei
gand
@w
orld
bank
.org
). Th
ank
you.

7/24
/200
8D
RA
FT -
NO
T FO
R Q
UO
TATI
ON
Cou
ntry
Soci
al In
sura
nce
Exp
endi
ture
s as
a %
of G
DP
Soci
al A
ssis
tanc
e E
xpen
ditu
res a
s a
% o
f GD
P
Tot
al S
ocia
l Pr
otec
tion
Exp
endi
ture
s as
a %
of G
DP
Soci
al A
ssis
tanc
e as
a %
of S
ocia
l Pr
otec
tion
Yea
rE
duca
tion
Hea
lthSS
tota
lT
otal
Gov
tG
DP/
capi
ta
PPP
Gin
i co
effic
ient
AFR
Ben
in0.
9N
AN
AN
A20
033.
12.
2N
A13
.31,
074
36A
FRB
otsw
ana
NA
NA
2.7
NA
1996
10.7
2.1
8.0
27.3
5,89
5N
AA
FRB
urki
na F
aso
0.1
NA
NA
NA
2002
4.7
2.3
NA
13.1
1,06
740
AFR
Ethi
opia
NA
4.5
NA
NA
2001
3.9
2.9
NA
15.2
879
30A
FRM
adag
asca
r1.
20.
92.
142
.920
022.
92.
77.
48.
176
947
AFR
Mal
awi
1.7
4.4
6.1
72.1
1999
4.6
2.7
11.4
13.4
577
39A
FRM
aurit
ius
4.2
5.3
9.5
55.8
2001
3.3
2.0
14.8
12.9
10,3
48N
AA
FRSe
nega
l0.
90.
21.
015
.020
044.
12.
46.
313
.91,
678
41A
FRSo
uth
Afr
ica
NA
3.2
NA
NA
2002
5.2
3.4
NA
18.4
9,44
558
EA
PC
ambo
dia
NA
NA
0.7
NA
2002
1.8
2.0
6.0
5.4
1,98
042
EA
PC
hina
1.6
0.4
2.1
20.8
2006
NA
1.8
NA
11.1
7,66
047
EA
PIn
done
sia
NA
1.3
NA
NA
2006
0.9
1.0
NA
7.1
4,13
034
EA
PK
orea
, Rep
.N
AN
A1.
9N
A19
97N
A2.
2N
A11
.614
,247
NA
EA
PM
alay
sia
1.4
NA
NA
NA
1999
5.7
1.7
NA
11.0
7,88
349
EA
PM
ongo
lia5.
91.
47.
318
.520
006.
75.
912
.618
.11,
523
33E
AP
Phili
ppin
esN
A0.
2N
AN
A20
052.
71.
4N
A9.
75,
140
45E
AP
Thai
land
NA
NA
0.6
NA
2001
5.0
1.9
5.9
11.3
6,55
243
EA
PV
ietn
am1.
51.
12.
642
.319
98N
A1.
5N
A7.
61,
785
36E
CA
Alb
ania
5.5
1.2
6.7
17.9
2005
2.9
3.0
12.0
9.3
5,31
831
EC
AA
rmen
ia3.
02.
15.
141
.120
023.
21.
310
.410
.03,
161
34E
CA
Aze
rbai
jan
3.7
1.6
5.3
30.2
2001
3.5
0.9
10.6
13.6
2,76
437
EC
AB
elar
usN
AN
A14
.4N
A20
016.
05.
019
.721
.65,
169
30E
CA
Bos
nia
and
Her
zego
vina
8.9
6.9
15.8
43.7
2000
NA
4.9
NA
NA
NA
26E
CA
Bul
garia
9.5
1.2
10.7
11.2
2004
4.2
4.6
16.0
18.3
8,38
529
EC
AC
roat
ia12
.41.
814
.212
.720
004.
57.
819
.524
.89,
116
28E
CA
Cze
ch R
epub
lic11
.42.
413
.817
.420
004.
06.
019
.121
.115
,450
25E
CA
Geo
rgia
2.7
1.5
4.2
35.7
2000
2.2
1.2
9.5
8.5
1,99
838
EC
AK
azak
hsta
n3.
22.
25.
440
.720
023.
01.
910
.711
.65,
652
31E
CA
Kos
ovo
3.3
2.5
5.8
43.1
2003
NA
NA
NA
NA
NA
NA
EC
AK
yrgy
z R
epub
lic5.
10.
75.
812
.120
013.
12.
311
.117
.51,
602
29E
CA
Latv
ia9.
91.
311
.311
.920
015.
53.
016
.620
.58,
873
38E
CA
Mac
edon
ia, F
YR
10.6
1.4
12.0
11.7
2000
4.1
5.3
17.3
18.2
6,05
528
EC
AM
oldo
va7.
51.
79.
218
.420
054.
3N
AN
A15
.22,
298
33E
CA
Pola
nd16
.31.
117
.46.
120
004.
83.
922
.718
.610
,772
33E
CA
Rom
ania
8.9
1.1
10.0
11.0
2002
3.5
3.7
15.3
6.8
7,02
331
EC
AR
ussi
an F
eder
atio
n7.
21.
89.
020
.020
063.
63.
714
.316
.711
,974
40E
CA
Serb
ia12
.61.
414
.010
.020
05N
AN
AN
A20
.9N
AN
AE
CA
Mon
tene
gro
16.0
2.0
18.0
11.1
2002
NA
NA
NA
26.0
NA
NA
EC
ASl
ovak
Rep
ublic
9.4
3.7
13.1
28.2
2002
4.3
6.0
18.4
21.1
12,7
51N
AE
CA
Tajik
ista
n1.
80.
21.
910
.519
992.
80.
97.
28.
698
933
EC
ATu
rkey
7.2
2.1
9.3
22.6
2004
4.0
5.6
14.6
13.2
7,69
944
EC
AU
krai
ne9.
83.
213
.024
.620
004.
22.
918
.320
.94,
037
29E
CA
Uzb
ekis
tan
7.0
2.0
9.0
22.2
2000
NA
2.6
NA
18.7
1,49
845
LAC
Arg
entin
a7.
71.
59.
216
.320
043.
84.
314
.511
.112
,826
51LA
CB
oliv
ia6.
32.
08.
324
.120
026.
24.
113
.616
.02,
489
60LA
CB
razi
l11
.71.
413
.110
.720
044.
44.
818
.419
.28,
206
57LA
CC
hile
6.9
0.7
7.6
9.2
2003
4.1
2.9
12.9
12.0
10,2
9855
LAC
Col
ombi
a5.
90.
66.
59.
220
044.
96.
711
.818
.86,
906
59LA
CC
osta
Ric
a4.
31.
55.
825
.920
044.
95.
111
.114
.19,
504
50LA
CD
omin
ica
3.4
2.2
5.6
38.7
2000
5.0
4.6
10.9
21.2
5,67
7N
ALA
CD
omin
ican
Rep
ublic
0.7
1.7
2.4
70.8
2004
1.2
1.9
7.7
8.7
7,08
452
LAC
Ecua
dor
1.8
1.1
2.9
37.9
2004
1.0
2.2
8.2
11.4
4,08
3N
ALA
CEl
Sal
vado
r4.
21.
05.
219
.220
002.
53.
610
.510
.24,
597
52LA
CG
rena
da1.
81.
63.
447
.120
015.
25.
98.
717
.37,
039
NA
Ple
ase
prov
ide
com
men
ts a
nd re
vise
d or
add
ition
al d
ata
and
repo
rts to
Chr
istin
e W
eiga
nd (c
wei
gand
@w
orld
bank
.org
). Th
ank
you.

7/24
/200
8D
RA
FT -
NO
T FO
R Q
UO
TATI
ON
Cou
ntry
Soci
al In
sura
nce
Exp
endi
ture
s as
a %
of G
DP
Soci
al A
ssis
tanc
e E
xpen
ditu
res a
s a
% o
f GD
P
Tot
al S
ocia
l Pr
otec
tion
Exp
endi
ture
s as
a %
of G
DP
Soci
al A
ssis
tanc
e as
a %
of S
ocia
l Pr
otec
tion
Yea
rE
duca
tion
Hea
lthSS
tota
lT
otal
Gov
tG
DP/
capi
ta
PPP
Gin
i co
effic
ient
LAC
Gua
tem
ala
0.7
1.1
1.8
61.1
2000
NA
2.2
NA
7.0
4,04
855
LAC
Guy
ana
NA
NA
2.0
NA
2000
8.5
4.6
7.3
24.7
3,92
243
LAC
Hon
dura
s1.
62.
54.
161
.019
99N
A3.
6N
A11
.32,
725
56LA
CJa
mai
ca1.
00.
81.
842
.920
055.
32.
87.
115
.14,
293
46LA
CM
exic
o2.
61.
03.
528
.620
025.
32.
78.
812
.19,
518
50LA
CN
icar
agua
5.4
1.1
6.5
16.9
2000
3.9
3.7
11.8
12.2
3,13
143
LAC
Pana
ma
5.0
1.7
6.7
25.4
2005
3.8
5.2
12.0
13.1
7,64
456
LAC
Para
guay
1.8
0.4
2.2
17.9
2000
4.9
3.4
7.6
12.7
4,16
557
LAC
Peru
3.2
0.7
3.9
18.3
2005
2.4
1.9
9.2
10.1
6,04
252
LAC
St. K
itts a
nd N
evis
2.7
1.0
3.7
27.0
2000
6.4
3.6
9.0
21.1
11,1
32N
ALA
CSt
. Luc
ia0.
62.
02.
676
.920
007.
53.
37.
923
.25,
897
NA
LAC
St. V
ince
nt a
nd th
e G
rena
d1.
32.
33.
664
.420
029.
94.
18.
921
.05,
470
NA
LAC
Uru
guay
9.6
0.5
10.1
5.0
2005
2.6
3.6
15.4
11.3
10,4
1945
LAC
Ven
ezue
la, R
B1.
10.
61.
737
.419
98N
A3.
4N
A13
.55,
917
50M
EN
AA
lger
ia5.
03.
78.
742
.520
00N
A2.
6N
A13
.65,
327
NA
ME
NA
Bah
rain
1.4
NA
NA
NA
2000
NA
2.7
NA
17.6
15,5
45N
AM
EN
AD
jibou
ti5.
14.
910
.049
.020
036.
14.
015
.329
.31,
993
NA
ME
NA
Egyp
t, A
rab
Rep
.2.
71.
64.
337
.420
00N
A2.
3N
A11
.23,
527
34M
EN
AIr
an, I
slam
ic R
ep.
1.1
2.7
3.8
70.7
2000
4.3
2.3
9.1
13.9
5,80
643
ME
NA
Iraq
3.2
15.9
19.1
83.5
2004
NA
4.2
NA
NA
NA
NA
ME
NA
Jord
an4.
01.
35.
324
.720
024.
94.
710
.616
.34,
599
39M
EN
AK
uwai
t5.
9N
AN
AN
A19
966.
62.
4N
A27
.319
,471
NA
ME
NA
Leba
non
2.5
0.4
2.9
13.8
2004
2.6
3.2
8.2
15.3
5,38
8N
AM
EN
AM
oroc
co2.
81.
94.
740
.719
986.
11.
510
.018
.03,
477
40M
EN
ASy
rian
Ara
b R
epub
lic0.
6N
AN
AN
A19
99N
A2.
0N
A10
.63,
090
NA
ME
NA
Tuni
sia
4.2
2.3
6.5
35.6
2000
6.8
2.9
11.8
15.6
6,27
940
ME
NA
Wes
t Ban
k an
d G
aza
NA
NA
5.7
NA
2001
NA
NA
NA
30.5
NA
NA
ME
NA
Yem
en, R
ep.
0.9
1.0
1.9
52.6
1999
9.9
1.9
7.2
13.4
795
33S
AB
angl
ades
h1.
30.
72.
035
.020
042.
20.
97.
35.
51,
917
33S
AIn
dia
2.1
2.2
4.3
51.2
2004
3.8
0.9
9.6
11.0
3,11
037
SA
Mal
dive
s0.
20.
20.
450
.020
047.
26.
35.
724
.2N
AN
AS
APa
kist
an1.
40.
41.
822
.220
042.
00.
47.
18.
22,
209
31S
ASr
i Lan
ka2.
01.
03.
033
.320
04N
A2.
0N
A8.
14,
276
40
Ple
ase
prov
ide
com
men
ts a
nd re
vise
d or
add
ition
al d
ata
and
repo
rts to
Chr
istin
e W
eiga
nd (c
wei
gand
@w
orld
bank
.org
). Th
ank
you.
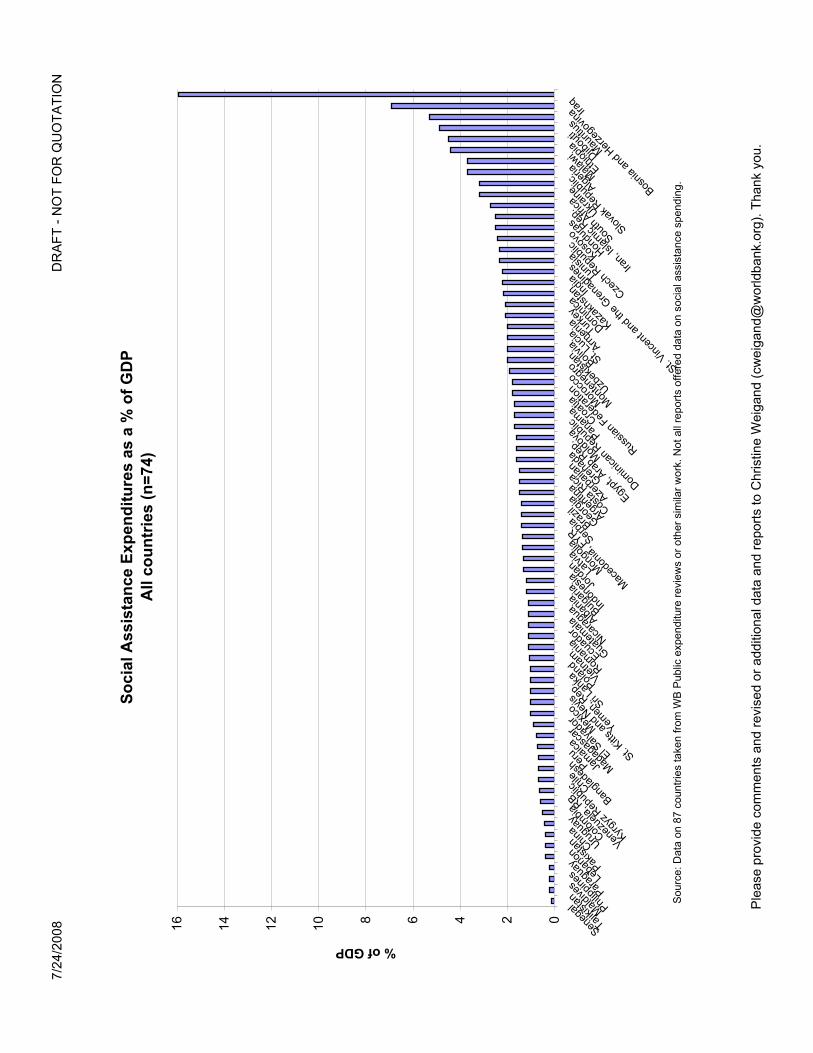
7/24
/200
8D
RA
FT -
NO
T FO
R Q
UO
TATI
ON
Ple
ase
prov
ide
com
men
ts a
nd re
vise
d or
add
ition
al d
ata
and
repo
rts to
Chr
istin
e W
eiga
nd (c
wei
gand
@w
orld
bank
.org
). Th
ank
you.
Soci
al A
ssis
tanc
e Ex
pend
iture
s as
a %
of G
DP
All
coun
trie
s (n
=74)
0246810121416 Seneg
al
Tajikis
tanMald
ives
Philipp
ines
Paragu
ayLe
bano
nPak
istan Chin
aUrug
uay
Colombia
Venez
uela,
RB
Kyrgyz
Rep
ublic Chile
Bangla
desh Peru Ja
maica
Madag
asca
r
El Salv
ador Mexico
St. Kitts
and N
evis
Yemen
, Rep
.
Sri Lan
ka Poland
Vietna
mRom
ania
Ecuad
or
Guatem
ala
Nicarag
ua Albania Bulgari
aInd
ones
ia Jorda
n Latvi
aMon
golia
Maced
onia,
FYR Serbia Brazil
Georgi
aArge
ntina
Costa
Rica
Azerba
ijan
Grenad
a
Egypt,
Arab
Rep
.Mold
ova
Domini
can R
epub
licPan
ama
Croatia
Russia
n Fed
eratio
nMoro
cco
Monten
egro
Uzbek
istan Bolivia
St. Luc
iaArm
enia Turkey
Domini
ca
Kazak
hstan Ind
ia
St. Vinc
ent a
nd th
e Gren
adine
sTun
isia
Czech
Rep
ublic
Kosov
oHon
duras
Iran,
Islam
ic Rep
.
South
Africa
Ukraine
Slovak
Rep
ublic Algeria Malawi
Ethiop
iaDjib
outi
Mauriti
us
Bosnia
and H
erzeg
ovinaIra
q% of GDP
Sou
rce:
Dat
a on
87
coun
tries
take
n fro
m W
B P
ublic
exp
endi
ture
revi
ews
or o
ther
sim
ilar w
ork.
Not
all
repo
rts o
ffere
d da
ta o
n so
cial
ass
ista
nce
spen
ding
.

7/24
/200
8D
RA
FT -
NO
T FO
R Q
UO
TATI
ON
Ple
ase
prov
ide
com
men
ts a
nd re
vise
d or
add
ition
al d
ata
and
repo
rts to
Chr
istin
e W
eiga
nd (c
wei
gand
@w
orld
bank
.org
). Th
ank
you.
Soci
al A
ssis
tanc
e Ex
pend
iture
s as
a %
of G
DP
All
coun
trie
s (n
=73)
01234567
Seneg
al
Tajikis
tanMald
ives
Philipp
ines
Paragu
ayLe
bano
nPak
istan Chin
aUrug
uay
Colombia
Venez
uela,
RB
Kyrgyz
Rep
ublic Chile
Bangla
desh Peru Ja
maica
Madag
asca
r
El Salv
ador Mexico
St. Kitts
and N
evis
Yemen
, Rep
.
Sri Lan
ka Poland
Vietna
mRom
ania
Ecuad
or
Guatem
ala
Nicarag
ua Albania Bulgari
aInd
ones
ia Jorda
n Latvi
aMon
golia
Maced
onia,
FYR Serbia Brazil
Georgi
aArge
ntina
Costa
Rica
Azerba
ijan
Grenad
a
Egypt,
Arab
Rep
.Mold
ova
Domini
can R
epub
licPan
ama
Croatia
Russia
n Fed
eratio
nMoro
cco
Monten
egro
Uzbek
istan Bolivia
St. Luc
iaArm
enia Turkey
Domini
ca
Kazak
hstan Ind
ia
St. Vinc
ent a
nd th
e Gren
adine
sTun
isia
Czech
Rep
ublic Kosov
oHon
duras
Iran,
Islam
ic Rep
.
South
Africa
Ukraine
Slovak
Rep
ublic Algeria Malawi
Ethiop
iaDjib
outi
Mauriti
us
Bosnia
and H
erzeg
ovina
% of GDP
Sou
rce:
Dat
a on
87
coun
tries
take
n fro
m W
B P
ublic
exp
endi
ture
revi
ews
or o
ther
sim
ilar w
ork.
Not
all
repo
rts o
ffere
d da
ta o
n so
cial
ass
ista
nce
spen
ding
.

7/24
/200
8D
RA
FT -
NO
T FO
R Q
UO
TATI
ON
Ple
ase
prov
ide
com
men
ts a
nd re
vise
d or
add
ition
al d
ata
and
repo
rts to
Chr
istin
e W
eiga
nd (c
wei
gand
@w
orld
bank
.org
). Th
ank
you.
Soc
ial I
nsur
ance
Exp
endi
ture
s as
a %
of G
DP
All
coun
tries
(n=7
6)
0.0
2.0
4.0
6.0
8.0
10.0
12.0
14.0
16.0
Burkina
Faso
Maldive
sSt. L
ucia
Syrian
Arab
Rep
ublic
Guatem
ala
Domini
can R
epub
licSen
egal
Yemen
, Rep
. Benin
Jamaic
a
Venez
uela,
RB
Iran,
Islam
ic Rep
.
Madag
asca
r
St. Vinc
ent a
nd th
e Gren
adine
s
Bangla
desh
Bahrai
nPak
istan
Malays
iaViet
nam
Hondu
ras China
Malawi
Tajikis
tan Ecuad
orGren
ada
Paragu
aySri L
anka India
Leba
non
Mexico
St. Kitts
and N
evis
Georgi
a
Egypt,
Arab
Rep
.Moro
cco
Armen
ia Iraq Peru
Kazak
hstan Kosov
oDom
inica
Azerba
ijan
Jorda
n
El Salv
ador
Tunisi
aMau
ritius
Costa
RicaPan
ama
Algeria
Kyrgyz
Rep
ublic
Djibou
ti
Nicarag
ua Albania
Colombia Kuw
ait
Mongo
lia Bolivia Chil
e
Uzbek
istan
Russia
n Fed
eratio
nTurk
eyMold
ova
Argenti
naRom
ania
Bosnia
and H
erzeg
ovina
Slovak
Rep
ublic
Bulgari
aUrug
uay
Ukraine Latvi
a
Maced
onia,
FYR
Czech
Rep
ublic Braz
ilCroa
tia Serbia
Monten
egro Poland
% of GDP
Sou
rce:
Dat
a on
87
coun
tries
take
n fro
m W
B P
ublic
exp
endi
ture
revi
ews
or o
ther
sim
ilar w
ork.
Not
all
repo
rts o
ffere
d da
ta o
n so
cial
insu
ranc
e sp
endi
ng.

7/24
/200
8D
RA
FT -
NO
T FO
R Q
UO
TATI
ON
Ple
ase
prov
ide
com
men
ts a
nd re
vise
d or
add
ition
al d
ata
and
repo
rts to
Chr
istin
e W
eiga
nd (c
wei
gand
@w
orld
bank
.org
). Th
ank
you.
Soc
ial P
rote
ctio
n E
xpen
ditu
res
as a
% o
f GD
PA
ll co
untri
es (n
=77)
02468101214161820 Maldive
sTha
iland
Cambo
dia Seneg
al
Venez
uela,
RB
Jamaic
a
Guatem
alaPak
istan
Yemen
, Rep
.
Tajikis
tan
Korea,
Rep.
Bangla
desh
Guyan
a China
Madag
asca
r
Paragu
ay
Domini
can R
epub
licSt. L
ucia
Vietna
mBots
wana
Ecuad
orLe
bano
nSri L
anka
Grenad
aMex
ico
St. Vinc
ent a
nd th
e Gren
adine
s
St. Kitts
and N
evis
Iran,
Islam
ic Rep
. Peru
Hondu
ras Georgi
a India
Egypt,
Arab
Rep
.Moro
cco
Armen
ia
El Salv
ador
Azerba
ijan
Jorda
n
Kazak
hstan
Domini
ca
Wes
t Ban
k and
Gaz
aKos
ovo
Costa
Rica
Kyrgyz
Rep
ublic Malawi
Nicarag
uaColo
mbia Tunisi
aPan
ama
Albania
Mongo
lia Chile
Bolivia Algeria
Uzbek
istan
Russia
n Fed
eratio
nArge
ntina
Moldov
aTurk
eyMau
ritius Djibou
ti
Roman
iaUrug
uay
Bulgari
a Latvi
a
Maced
onia,
FYRUkra
ine
Slovak
Rep
ublic Braz
il
Czech
Rep
ublic Serbia
Croatia
Belarus
Bosnia
and H
erzeg
ovina Poland
Monten
egro Iraq
% of GDP
Sou
rce:
Dat
a on
87
coun
tries
take
n fro
m W
B P
ublic
exp
endi
ture
revi
ews
or o
ther
sim
ilar w
ork.
Not
all
repo
rts o
ffere
d da
ta o
n so
cial
pro
tect
ion
spen
ding
.

Soci
al A
ssis
tanc
e an
d So
cial
Insu
ranc
e as
a %
of G
DP
ALL
REG
ION
S
3.1
0.9
2.0
1.3
3.6
0.9
2.5
1.5
2.6
8.0
3.8
3.0
1.4
13.2
02468101214
Afri
ca S
ub-S
ahar
anE
ast A
sia
Pac
ific
Eas
tern
Eur
ope
and
Cen
tral A
sia
Latin
Am
eric
a an
dC
arrib
ean
Mid
dle
Eas
t and
Nor
ther
n A
frica
Sou
th A
sia
OE
CD
23
Soc
ial A
ssis
tanc
eS
ocia
l Ins
uran
ce
n=9
n=9
n=25
n=25
n=14
n=5
Not
es: D
ata
on 8
7 co
untri
es ta
ken
from
WB
Pub
lic e
xpen
ditu
re re
view
s or
oth
er s
imila
r wor
k. W
e us
ed O
EC
D-2
3 si
nce
OE
CD
cou
ntrie
s su
ch a
s P
olan
d an
d M
exic
o ar
e al
read
y ac
coun
ted
for i
n th
e re
gion
al a
vera
ges.
OE
CD
dat
a fro
m th
e O
EC
D S
ocia
l Exp
endi
ture
dat
abas
e (O
EC
D, 2
004)
.

Soci
al A
ssis
tanc
e an
d So
cial
Insu
ranc
e as
a %
of G
DP
ALL
REG
ION
S
3.1
0.9
2.0
1.3
2.2
0.9
2.5
1.5
2.6
8.0
3.8
3.0
1.4
13.2
02468101214
Afri
ca S
ub-S
ahar
anE
ast A
sia
Pac
ific
Eas
tern
Eur
ope
and
Cen
tral A
sia
Latin
Am
eric
a an
dC
arrib
ean
Mid
dle
Eas
t and
Nor
ther
n A
frica
Sou
th A
sia
OE
CD
23
Soc
ial A
ssis
tanc
eS
ocia
l Ins
uran
ce
n=9
n=9
n=25
n=25
n=13
n=5
Not
es: D
ata
on 8
6 co
untri
es ta
ken
from
WB
Pub
lic e
xpen
ditu
re re
view
s or
oth
er s
imila
r wor
k. W
e us
ed O
EC
D-2
3 si
nce
OE
CD
cou
ntrie
s su
ch a
s P
olan
d an
d M
exic
o ar
e al
read
y ac
coun
ted
for i
n th
e re
gion
al a
vera
ges.
OE
CD
dat
a fro
m th
e O
EC
D S
ocia
l Exp
endi
ture
dat
abas
e (O
EC
D, 2
004)
.

7/24
/200
8D
RA
FT -
NO
T FO
R Q
UO
TATI
ON
Ple
ase
prov
ide
com
men
ts a
nd re
vise
d or
add
ition
al d
ata
and
repo
rts to
Chr
istin
e W
eiga
nd (c
wei
gand
@w
orld
bank
.org
). Th
ank
you.
Soci
al S
pend
ing
as a
% o
f GD
P A
LL R
EGIO
NS
02468101214
Afri
ca S
ub-
Sah
aran
Eas
t Asi
a P
acifi
cE
aste
rn E
urop
ean
d C
entra
l Asi
aLa
tin A
mer
ica
and
Car
ribea
nM
iddl
e E
ast a
ndN
orth
ern
Afri
caS
outh
Asi
aO
EC
D 2
3
% of GDP
Soc
ial A
ssis
tanc
eS
ocia
l Ins
uran
ceE
duca
tion
Hea
lth
n=3
n=2
n=6
n=20
n=21
n=6
n=11
n=11
n=3
n=3
n=4
n=7
n=18
n=22
n=18
8n=
25n=
22n=
21n=
3n=
9n=
4n=
3n=
2n=
3
Not
es: D
ata
on 8
7 co
untri
es ta
ken
from
WB
Pub
lic e
xpen
ditu
re re
view
s or
oth
er s
imila
r wor
k. W
e us
ed O
EC
D-2
3 si
nce
OE
CD
cou
ntrie
s su
ch a
s P
olan
d an
d M
exic
o ar
e al
read
y ac
coun
ted
for i
n th
e re
gion
al a
vera
ges.
OE
CD
dat
a fro
m th
e O
EC
D S
ocia
l Exp
endi
ture
dat
abas
e (O
EC
D, 2
004)
.

7/24
/200
8D
RA
FT -
NO
T FO
R Q
UO
TATI
ON
Ple
ase
prov
ide
com
men
ts a
nd re
vise
d or
add
ition
al d
ata
and
repo
rts to
Chr
istin
e W
eiga
nd (c
wei
gand
@w
orld
bank
.org
). Th
ank
you.
Soci
al S
pend
ing
as a
% o
f GD
P A
LL R
EGIO
NS
02468101214161820
Afri
ca S
ub-
Sah
aran
Eas
t Asi
a P
acifi
cE
aste
rn E
urop
ean
d C
entra
l Asi
aLa
tin A
mer
ica
and
Car
ribea
nM
iddl
e E
ast a
ndN
orth
ern
Afri
caS
outh
Asi
aO
EC
D 2
3
% of GDP
Soc
ial A
ssis
tanc
eS
ocia
l Ins
uran
ceE
duca
tion
Hea
lth
n=9
n=14
n=5
n=25
n=25
n=9
Not
es: D
ata
on 8
7 co
untri
es ta
ken
from
WB
Pub
lic e
xpen
ditu
re re
view
s or
oth
er s
imila
r wor
k. W
e us
ed O
EC
D-2
3 si
nce
OE
CD
cou
ntrie
s su
ch a
s P
olan
d an
d M
exic
o ar
e al
read
y ac
coun
ted
for i
n th
e re
gion
al a
vera
ges.
OE
CD
dat
a fro
m th
e O
EC
D S
ocia
l Exp
endi
ture
dat
abas
e (O
EC
D, 2
004)
.

7/24
/200
8D
RA
FT -
NO
T FO
R Q
UO
TATI
ON
Ple
ase
prov
ide
com
men
ts a
nd re
vise
d or
add
ition
al d
ata
and
repo
rts to
Chr
istin
e W
eiga
nd (c
wei
gand
@w
orld
bank
.org
). Th
ank
you.
Soci
al S
pend
ing
as a
% o
f GD
P A
LL R
EGIO
NS
02468101214161820
Afri
ca S
ub-
Sah
aran
Eas
t Asi
a P
acifi
cE
aste
rn E
urop
ean
d C
entra
l Asi
aLa
tin A
mer
ica
and
Car
ribea
nM
iddl
e E
ast a
ndN
orth
ern
Afri
caS
outh
Asi
aO
EC
D 2
3
% of GDP
Soc
ial A
ssis
tanc
eS
ocia
l Ins
uran
ceE
duca
tion
Hea
lth
n=9
n=13
n=5
n=25
n=25
n=9
Not
es: D
ata
on 8
6 co
untri
es ta
ken
from
WB
Pub
lic e
xpen
ditu
re re
view
s or
oth
er s
imila
r wor
k. W
e us
ed O
EC
D-2
3 si
nce
OE
CD
cou
ntrie
s su
ch a
s P
olan
d an
d M
exic
o ar
e al
read
y ac
coun
ted
for i
n th
e re
gion
al a
vera
ges.
OE
CD
dat
a fro
m th
e O
EC
D S
ocia
l Exp
endi
ture
dat
abas
e (O
EC
D, 2
004)
.


Social Protection Discussion Paper Series Titles No. Title 0820 China: Improving Unemployment Insurance
by Milan Vodopivec and Minna Hahn Tong, July 2008 (online only) 0819 Management Information Systems in Social Safety Net Programs: A Look at
Accountability and Control Mechanisms by Cesar Baldeon and Maria D. Arribas-Baños, July 2008 (online only)
0818 Guidance for Responses from the Human Development Sectors to Rising
Food Prices by Margaret Grosh, Carlo del Ninno and Emil Daniel Tesliuc, June 2008
(online only) 0817 Levels and Patterns of Safety Net Spending in Developing and Transition
Countries by Christine Weigand and Margaret Grosh, June 2008 (online only)
0816 Labor Regulation and Employment in India’s Retail Stores by Mohammad Amin, June 2008 (online only) 0815 Beyond DALYs: Developing Indicators to Assess the Impact of Public
Health Interventions on the Lives of People with Disabilities by Daniel Mont and Mitchell Loeb, May 2008 0814 Enforcement of Labor Regulation and Firm Size
by Rita Almeida and Pedro Carneiro, May 2008 (online only) 0813 Labor Markets Lending and Analytical Work at the World Bank: FY2002-
2007 by Milan Vodopivec, Jean Fares and Michael Justesen, May 2008 0812 Risk and Vulnerability Analysis in the World Bank Analytic Work: FY2000-
2007 by Valerie Kozel, Pierre Fallavier and Reena Badiani, May 2008 0811 Pension Lending and Analytical Work at the World Bank: FY2002-2007 by Richard Hinz, Melike Egelmelzer and Sergei Biletsky, May 2008 (online
only) 0810 Social Safety Nets Lending and Analytical Work at the World Bank:
FY2002-2007 by Margaret Grosh and Annamaria Milazzo, May 2008

0809 Social Funds as an Instrument of Social Protection: An Analysis of Lending Trends - FY2000-2007
by Samantha De Silva and June Wei Sum, May 2008 0808 Disability Activities at the World Bank: FY2002-2007 by Jeanine Braithwaite, Richard Carroll, and Karen Peffley, May 2008 0807 Migration, Labor Markets, and Integration of Migrants: An Overview for
Europe by Rainer Münz, April 2008 (online only) 0806 Is the Window of Opportunity Closing for Brazilian Youth? Labor Market
Trends and Business Cycle Effects by Michael Justesen, April 2008 0805 Disability and Poverty: A Survey of World Bank Poverty Assessments and
Implications by Jeanine Braithwaite and Daniel Mont, February 2008 0804 Poverty Traps and Social Protection by Christopher B. Barrett, Michael R. Carter and Munenobu Ikegami,
February 2008 0803 Live Longer, Work Longer: Making It Happen in the Labor Market by Milan Vodopivec and Primoz Dolenc, February 2008 (online only) 0802 Disability in Kazakhstan: An Evaluation of Official Data by Ai-Gul S. Seitenova and Charles M. Becker, February 2008 (online only) 0801 Disability Insurance with Pre-funding and Private Participation: The Chilean
Model by Estelle James, Augusto Iglesias and Alejandra Cox Edwards, January
2008 0719 The Life-Course Perspective and Social Policies: An Issues Note by A.L. Bovenberg, November 2007 0718 Social Safety Nets and Targeted Social Assistance: Lessons from the
European Experience by Chris de Neubourg, Julie Castonguay and Keetie Roelen, November 2007
(online only) 0717 Informality and Social Protection: Preliminary Results from Pilot Surveys in
Bulgaria and Colombia by Franco Peracchi, Valeria Perotti and Stefano Scarpetta, October 2007
(online only)

0716 How Labor Market Policies can Combine Workers’ Protection with Job
Creation: A Partial Review of Some Key Issues and Policy Options by Gaëlle Pierre and Stefano Scarpetta, October 2007 (online only) 0715 A Review of Interventions to Support Young Workers: Findings of the Youth
Employment Inventory by Gordon Betcherman, Martin Godfrey, Susana Puerto, Friederike Rother,
and Antoneta Stavreska, October 2007 0714 Performance of Social Safety Net Programs in Uttar Pradesh by Mohamed Ihsan Ajwad, October 2007 0713 Are All Labor Regulations Equal? Assessing the Effects of Job Security,
Labor Dispute and Contract Labor Laws in India by Ahmad Ahsan and Carmen Pagés, June 2007 0712 Convention on the Rights of Persons with Disabilities: Its Implementation
and Relevance for the World Bank by Katherine Guernsey, Marco Nicoli and Alberto Ninio, June 2007 0711 Reaching the Poor and Vulnerable: Targeting Strategies for Social Funds and
other Community-Driven Programs by Julie Van Domelen, May 2007 0710 The Macedonia Community Development Project: Empowerment through
Targeting and Institution Building by Caroline Mascarell, May 2007 0709 The Nuts and Bolts of Brazil’s Bolsa Família Program: Implementing
Conditional Cash Transfers in a Decentralized Context by Kathy Lindert, Anja Linder, Jason Hobbs and Bénédicte de la Brière, May
2007 (online only) 0708 Globalization and Employment Conditions Study by Drusilla K. Brown, April 2007 0707 The Kosovo Pension Reform: Achievements and Lessons by John Gubbels, David Snelbecker and Lena Zezulin, April 2007 (online
only) 0706 Measuring Disability Prevalence by Daniel Mont, March 2007

0705 Social Safety Nets in World Bank Lending and Analytic Work: FY2002-2006
by Annamaria Milazzo and Margaret Grosh, March 2007 (online only) 0704 Child Labor and Youth Employment: Ethiopia Country Study by Lorenzo Guarcello and Furio Rosati, March 2007 0703 Aging and Demographic Change in European Societies: Main Trends and
Alternative Policy Options by Rainer Muenz, March 2007 (online only)
0702 Seasonal Migration and Early Childhood Development
by Karen Macours and Renos Vakis, March 2007 0701 The Social Assimilation of Immigrants by Domenico de Palo, Riccardo Faini and Alessandra Venturini, February
2007 (online only) 0616 Pension Systems in Latin America: Concepts and Measurements of Coverage by Rafael Rofman and Leonardo Lucchetti, November 2006 (online only).
Also available in Spanish. 0615 Labor Market Outcomes of Natives and Immigrants: Evidence from the
ECHP by Franco Peracchi and Domenico Depalo, November 2006 (online only) 0614 The Relative Merits of Skilled and Unskilled Migration, Temporary and
Permanent Labor Migration, and Portability of Social Security Benefits by Johannes Koettl under guidance of and with input from Robert Holzmann
and Stefano Scarpetta, November 2006 (online only) 0613 The Limited Job Prospects of Displaced Workers: Evidence from Two Cities
in China by Gordon Betcherman and Niels-Hugo Blunch, October 2006 0612 Unemployment Insurance in Chile: A New Model of Income Support for
Unemployed Workers by Germán Acevedo, Patricio Eskenazi and Carmen Pagés, October 2006 0611 Evaluating Social Fund Impact: A Toolkit for Task Teams and Social Fund
Managers by Sarah Adam, October 2006 0610 Risk and Vulnerability Considerations in Poverty Analysis: Recent Advances
and Future Directions by Carlo Cafiero and Renos Vakis, October 2006

0609 Comparing Individual Retirement Accounts in Asia: Singapore, Thailand, Hong Kong and PRC
by Yasue Pai, September 2006 (online only) 0608 Pension System Reforms by Anita M. Schwarz, September 2006 (online only) 0607 Youth Labor Market in Burkina Faso: Recent Trends by Daniel Parent, July 2006 0606 Youth in the Labor Market and the Transition from School to Work in
Tanzania by Florence Kondylis and Marco Manacorda, July 2006 0605 Redistributing Income to the Poor and the Rich: Public Transfers in Latin
America and the Caribbean by Kathy Lindert, Emmanuel Skoufias and Joseph Shapiro, August 2006
(online only) 0604 Uninsured Risk and Asset Protection: Can Conditional Cash Transfer
Programs Serve as Safety Nets? by Alain de Janvry, Elisabeth Sadoulet, Pantelis Solomon and Renos Vakis,
June 2006 0603 Examining Conditional Cash Transfer Programs: A Role for Increased Social
Inclusion? by Bénédicte de la Brière and Laura B. Rawlings, June 2006 (online only) 0602 Civil-service Pension Schemes Around the World by Robert Palacios and Edward Whitehouse, May 2006 (online only) 0601 Social Pensions Part I: Their Role in the Overall Pension System by Robert Palacios and Oleksiy Sluchynsky, May 2006 (online only)
To view Social Protection Discussion papers published prior to 2006, please visit www.worldbank.org/sp.

This paper offers a new set of data compiled from individual World Bank countryreports. We give a brief textual description of patterns and trends in spending,and provide the raw data and documentation of its sources in the appendix. Thedata are also provided in an Excel spreadsheet on the safety nets websitewww.worldbank.org/safetynets so that others may use them. Mean spending onsafety nets is 1.9 percent of GDP and median spending is 1.4 percent of GDP. Forabout half of the countries, spending falls between 1 and 2 percent of GDP. Somevariation is apparent. Bosnia and Herzegovina, Pakistan, and Tajikistan, forexample, spend considerably less than 1 percent of GDP, while spending onsocial safety nets in Ethiopia and Malawi is nearly 4.5 percent of GDP becauseinternational aid is counted, but would be more like 0.5 percent if only domesticallyfinanced spending were counted. Other high-spending countries—Mauritius,South Africa, and the Slovak Republic—finance their safety nets domestically.Spending on safety nets is less variable than spending on social protection or thesocial sectors.
HUMAN DEVELOPMENT NETWORK
About this series...Social Protection Discussion Papers are published to communicate the results of The World Bank’swork to the development community with the least possible delay. The typescript manuscript of thispaper therefore has not been prepared in accordance with the procedures appropriate to formallyedited texts. The findings, interpretations, and conclusions expressed herein are those of the author(s),and do not necessarily reflect the views of the International Bank for Reconstruction and Development/ The World Bank and its affiliated organizations, or those of the Executive Directors of The World Bankor the governments they represent. The World Bank does not guarantee the accuracy of the dataincluded in this work. For free copies of this paper, please contact the Social Protection AdvisoryService, The World Bank, 1818 H Street, N.W., Room G7-703, Washington, D.C. 20433-0001.Telephone: (202) 458-5267, Fax: (202) 614-0471, E-mail: [email protected] or visit theSocial Protection website at www.worldbank.org/sp.