level 2 energy audit
TRANSCRIPT

Level 2 Energy Audit
NRSBU Bell Island Wastewater Treatment Plant
Performed for: Johan Thiart
Engineering Advisor Nelson Regional Sewerage Business Unit (NRSBU)
June 2012

NRSBU BISTP – Level 2 Energy Audit
CONTENTS
EXECUTIVE SUMMARY............................................................................................ 1
1 INTRODUCTION ................................................................................................. 5
1.1 BACKGROUND ........................................................................................ 5
1.2 PURPOSE OF ENERGY AUDIT ............................................................... 6
1.3 ENERGY REVIEW PERIOD ..................................................................... 6
2 HISTORIC ENERGY USE .................................................................................. 7
2.1 HISTORIC ELECTRICITY USE ................................................................ 7
2.2 ELECTRICITY USE CONSUMPTION PROFILES .................................... 8
2.3 ELECTRICITY SPLIT .............................................................................. 11
3 TARIFF REVIEW .............................................................................................. 12
3.1 ELECTRICITY ......................................................................................... 12
4. PROCESS DESCRIPTION ............................................................................... 15
4.1 PRELIMINARY TREATMENT ................................................................. 16
4.2 PRIMARY TREATMENT ......................................................................... 17
4.3 SECONDARY TREATMENT ................................................................... 19
4.4 SOLIDS TREATMENT ............................................................................ 21
4.5 AUXILIARY PROCESSES AND EQUIPMENT ....................................... 26
5 ENERGY MANAGEMENT OPPORTUNITIES .................................................. 27
5.1 ELECTRICITY SUPPLY.......................................................................... 27
5.2 MAIN PROCESSES ................................................................................ 30
5.3 HEATING, VENTILATION AND AIR CONDITIONING (HVAC) .............. 36
5.4 LIGHTING ............................................................................................... 37
5.5 MISCELLANEOUS EQUIPMENT ........................................................... 39
APPENDIX A – SITE MAP WITH MAIN PROCESS LOCATIONS
APPENDIX B – TYPICAL ELECTRICITY BILL
APPENDIX C – ELECTRICITY METERS
APPENDIX D – POWER FACTOR READINGS
APPENDIX E – QUOTES
APPENDIX F – TECHNICAL RESOURCES

NRSBU BISTP – Level 2 Energy Audit 1
EXECUTIVE SUMMARY An energy audit at the Nelson Regional Sewerage Business Unit (NRSBU) Bell Island Sewerage Treatment Plant (BISTP) was conducted by Enercon for the following reasons:
• To find methods to improve energy efficiency; o An energy audit had never been performed on the site since its inception
in 1982 • To develop an energy balance of the entire plant; • To analyse the optimal performance of the overall waste water treatment
process on site. Overall, the plant is operating very energy efficiently, with many energy conserving features and practices already in place. Site staff have a proactive and knowledgeable approach towards energy management, which is encouraging when considering long term efficiency. The Bell Island Sewerage Treatment Plant is administered by NRSBU, and is operated by a contractor, “CPG”. Reduce Energy Consumption The Bell Island Sewerage Treatment Plant has an annual energy spend of approximately $535,000 based on the year ending March 2012. The site was found to be highly energy efficient in regards to the operation of existing processes, and would fit in the top 1% of Energy audits we have done for operating efficiency. Examples of this efficiency are:
• Variable speed drives are installed as and where appropriate; • Site equipment is regularly maintained and reviewed, including the cost and
payback period of more efficient approaches; • Power factor is universally high, ensuring no supplied power is wasted through
poor distribution; • Operational issues are quickly dealt with, resulting in little equipment left
operating to compensate for the issues; • Process equipment is easily controlled and monitored from the SCADA system
in the main office; • Staff are knowledgeable about what each water treatment process is trying to
achieve and what needs to be operating as a result; • Air conditioning use is kept to a minimum; • Lighting is sparingly used and relates closely to occupancy (e.g. there were
almost no lights on overnight when staff had left the island).

NRSBU BISTP – Level 2 Energy Audit 2
Electricity is not currently generated on site. A number of Energy Management Opportunities (EMOs) have been identified that, when implemented, will decrease the electricity consumed (and therefore the cost). Table 0.2 summarises the energy consumption and the savings that can be made. Note that average energy prices from February 2011 to January 2012 have been used. Table 0.2: Summary of Annual Energy Usage for Bell Island Sewerage Treatment Plant
Electricity (kWhe)
Electricity Generated
(kWhe)
Electricity Imported (kWhe)
Total Cost ($)
Cost Savings
($)
Cost Savings
(%)
Current 3,824,100 0 3,824,100 $534,900 - -
If T1 met 3,682,100 0 3,682,100 $512,400 $22,500 4.2%
If T1 & T2 met
3,680,300 0 3,680,300 $512,200 $22,700 4.2%
Table 0.3 provides benchmark figures for the energy consumption of the plant. The total electricity consumption can be expressed with index values of 0.701kWhe/m³ of wastewater and 9.80¢/m³ of wastewater, or 9,161 kWhe/tonne ($1,281/tonne) of biochemical oxygen demand (BOD) removal.
Table 0.3: Summary of Benchmark Energy Consumption Figures
Annual Wastewater
Flow
Annual BOD
Consumption Benchmark Cost Benchmark
(m³) tonne (kWhe/m³ Wastewater)
(kWhe/tonne BOD)
(¢/m³ Wastewater)
($/tonne BOD)
Current 5,456,900 417.4 0.701 9,162 9.80 1,281
If T1 met 5,456,900 417.4 0.675 8,822 9.39 1,228
If T1 &T2 met 5,456,900 417.4 0.674 8,817 9.39 1,227
Table 0.4 compares the energy consumption of the Bell Island Sewerage Treatment Plant to two other wastewater treatment plants in New Zealand (North Shore and Christchurch).
Table 0.4: Summary of Benchmark Energy Consumption Figures
BISTP North Shore Christchurch
(kWhe/m³) (¢/m³) (kWhe/m³) (¢/m³) (kWhe/m³) (¢/m³)
Current 0.701 9.80 0.220 2.91 -0.031 -0.37
As can be seen in Table 0.4, the Bell Island Sewerage Treatment Plant is more energy intensive than the North Shore and Christchurch wastewater treatment plants. North Shore and Christchurch wastewater treatment plants both use anaerobic digesters, while the Bell Island Sewerage Treatment Plant uses aerobic digesters.
The Bell Island Sewerage Treatment Plant has the potential to be a net exporter of energy (as is the case at the Christchurch wastewater treatment plant), were it to convert from aerobic to anaerobic digesters. This measure is discussed further in EMO 2.1 of this report, which states 4,400,000 kWh/year could potentially be generated /

NRSBU BISTP – Level 2 Energy Audit 3
saved using anaerobic digesters, compared to the 3,824,100 kWh/year used over the 12 month historical period analysed. Significant energy saving opportunities with short paybacks can be found by:
• Having CPG pay for energy accounts as part of their performance contract • Replacing the flow meter for gravity fed outflow • Removing the time-of-use metering at the dewatering plant
Possible longer term investments include:
• Anaerobic Digesters • Gravity Belt Thickener (GBT) use instead of Dissolved Air Floatation unit (DAF)
use This audit needs to be seen as the first step to reducing and managing energy costs. The next phase is to implement the recommendations from this report. Thereafter, ongoing energy management will be needed to ensure energy savings are realised into the future. Energy management will also ensure operating and maintenance issues are identified early and assist in improving the energy awareness of employees. Energy audits should be conducted at sites every 3 – 5 years to achieve good energy management. Continual energy management will ensure operating and maintenance issues are identified early, new technologies are utilised as they become available and cost efficient, and assist in improving the energy awareness of staff. A summary of the Energy Management Opportunities (EMOs) recommended is shown in Tables 0.5, 0.6 and 0.7. Note that the capital costs are budget figures only. A full description of each of these EMOs is given in Section 5. EMO Designation: The decimal number labels each EMO in a sequence. The first number is coded:
1 Electricity Supply 2 Main Processes 3 Lighting 4 HVAC 5 Office Equipment
Note that some EMOs are further separated into the following:
a Paybacks less than 1 year b Paybacks between 1 and 5 years c Paybacks over 5 years

NRSBU BISTP – Level 2 Energy Audit 4
Table 0.5: T1 EMOs (payback less than one year)
EMO Action Capital Cost Annual savings
Simple Payback
1.1 Include energy account payments in the performance contract for CPG
Negotiable $~21,000 N/A
1.2 Remove the non-half-hourly metering at the dewatering plant
$500 $2,700 0.2 years
2.2 Replace the flow meter for gravity fed outfall $6,000 $19,500 0.3 years
2.4 Optimise O2 levels in Aeration Basin Management Needs further
investigation
Needs further investigation
3.1 Place the Aeration Basin Distribution-Board Room fan on a thermostat $150 $250 0.6 years
5.1 Use one freezer instead of two in the room next to the tea room $0 $80 Immediate
Total – T1 (Note: exc. EMO 1.1)
$6,700+
$22,500+
0.3 years
Table 0.6: T2 EMOs (payback between one and five years)
EMO Action Capital Cost Annual savings
Simple Payback
4.1 Switch outside lighting off during the day $290 $160 1.8 years
4.2 Occupancy sense freezer room lights $150 $70 2.2 years
Total – T2
$440
$230
1.9 years
Total – T1 + T2
$7,100+ $22,700+ 0.3 years
Table 0.7: T3 EMOs (payback over five years)
EMO Action Capital Cost Annual savings
Simple Payback
1.3 Investigate metering requirements for the ponds Needs Further Investigation
$1,750 - $3,500
Needs Further Investigation
2.1 Use anaerobic digesters instead of aerobic digesters $7,200,000 $400,000 18 years
2.3 Investigate using the Gravity Belt Thickener instead of the Dissolved Air Floatation unit for secondary sludge thickening
Needs Further Investigation $~$7,000 Needs Further
Investigation
Note: All costs in this report exclude GST.

NRSBU BISTP – Level 2 Energy Audit 5
1 INTRODUCTION
1.1 Background Occupying 53ha of Bell Island on the Waimea Inlet, the Bell Island Sewerage Treatment Plant (BISTP) serves the communities of Nelson South, Richmond and Mapua. The plant was commissioned in 1983, with an original design population of 33,000 people, and the plant consisted of a fully mixed aeration basin, three facultative oxidation ponds (in parallel), two maturation ponds (in series) and a tidal discharge. As of 2007, the plant had a design population of 133,000 people. Bell Island Sewerage Treatment Plant processes approximately 5.5 million cubic meters of wastewater per year. The plant provides primary and secondary treatment. Two-thirds of this flow originates from residential sources; the remaining one-third comes from commercial and industrial producers. However, the industrial users produce two-thirds of the biochemical oxygen demand (BOD). Peak flows and loads are highly variable due to the combined effects of storm water filtration and the seasonal nature of industrial food processing activities. Treated effluent is discharged into the inlet on the outgoing tide. Stabilised sludge (bio-solids) is beneficially applied to forests on Rabbit Island. The treatment plant consists of an aeration basin, clarifier, Dissolved Air Flotation unit (DAF) and an Autothermal Thermophilic Aerobic Digestion (ATAD) plant that treats captured solids to produce bio-solids. A system of pumps and pipework transfers bio-solids to Rabbit Island. The oxidation pond system at Bell Island Sewerage Treatment Plant consists of three facultative ponds in parallel and two maturation ponds in series. Effluent from the last maturation pond is discharged into the Waimea Inlet via an outfall pipeline and diffusers. To manage increasing flows and tightening environmental requirements, a number of process upgrades have been made since the plant’s construction. Following a review in 1992 the following were installed:
• Desludging of the oxidation ponds was undertaken from 1993-1995 due to the overloading (and subsequent malodour generation) of these ponds caused by stratification and organic load build up in excess of treatment capacity.
• Mechanical aeration mixing (completed 1996) • Clarifier and Autothermal Thermophilic Aerobic Digestion (completed
1996). This phase of the project was implemented to reduce the loadings entering the oxidation ponds, thus reducing odour nuisance from the plant.
From 2003-2005, a retrofit of the plant took place that included installation of the Dissolved Air Flotation unit. More recently, a Gravity Belt Thickener (GBT) has been installed on site. This was used for 2 months, before it was decided the system was not required at that stage. As of 2007, the following developments were being considered in future planning. Anaerobic digestion is explored in this report.

NRSBU BISTP – Level 2 Energy Audit 6
2007/08 Inlet load reduction (primary clarifier) 2008/09 Outfall capacity upgrade 2010/11 Expand bio-solids treatment facilities 2013/15 Anaerobic Digestion and Co-generation 2015/16 Nitrogen / phosphorous Removal 2015/16 Pond De-sludging A 15 year review of all site equipment is typical, although exceptions could be made for systems that are proven to be more energy efficient or more productive.
A full process description can be found in Section 4. Bell Island Sewerage Treatment Plant has the following operating hours:
Operation Days/week Hours/day Comments Process 7 24 -
Control Room 7 0730 – 1600 BMS remotely accessible Offices Mon – Fri 0730 – 1600 6 employees
1.2 Purpose of Energy Audit
The Nelson Regional Sewerage Business Unit decided to have an energy audit performed at the Bell Island Sewerage Treatment Plant for the following reasons:
• To find methods to improve energy efficiency • To develop an energy balance of the entire plant • To analyse the optimal performance of the overall waste water treatment
process on site.
1.3 Energy Review Period
The energy review was performed with two day-time site visits. An evening inspection was performed as well. Energy figures throughout the report are based on energy data from February 2011 to January 2012 (unless otherwise specified).
NRSBU BISTP – Level 2 Energy Audit 7
2 HISTORIC ENERGY USE
2.1 Historic Electricity Use
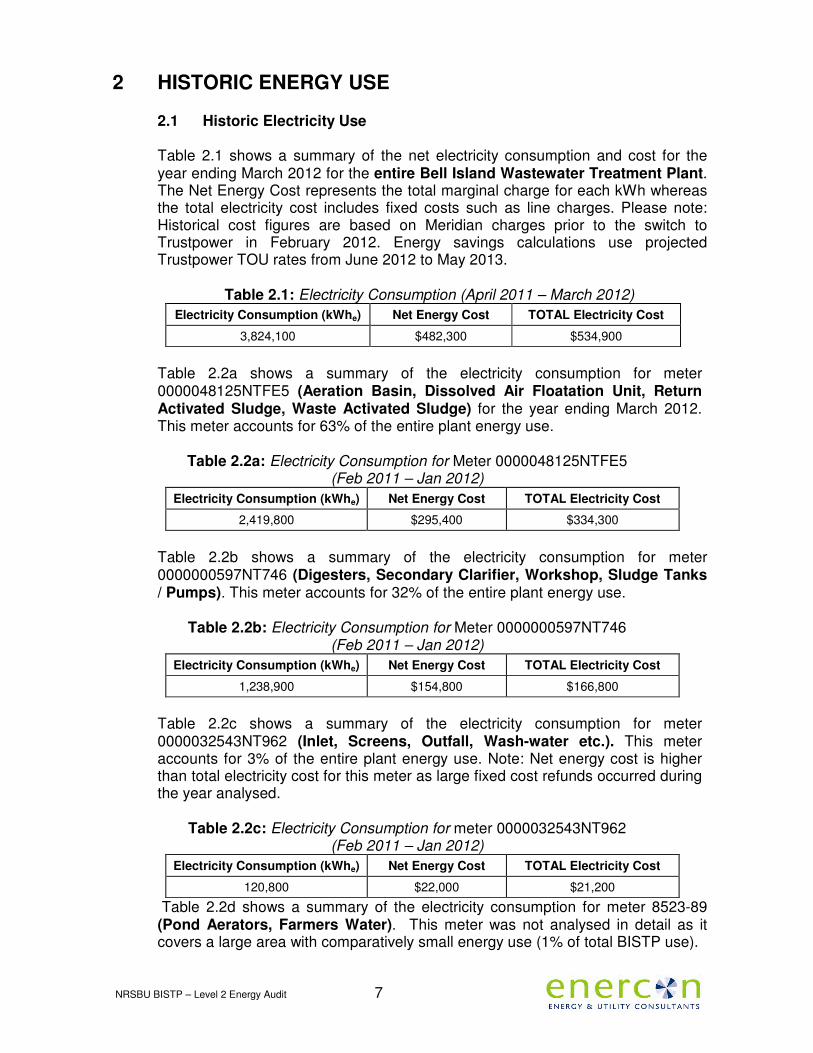
Table 2.1 shows a summary of the net electricity consumption and cost for the year ending March 2012 for the entire Bell Island Wastewater Treatment Plant. The Net Energy Cost represents the total marginal charge for each kWh whereas the total electricity cost includes fixed costs such as line charges. Please note: Historical cost figures are based on Meridian charges prior to the switch to Trustpower in February 2012. Energy savings calculations use projected Trustpower TOU rates from June 2012 to May 2013.
Table 2.1: Electricity Consumption (April 2011 – March 2012)
Electricity Consumption (kWhe) Net Energy Cost TOTAL Electricity Cost
3,824,100 $482,300 $534,900
Table 2.2a shows a summary of the electricity consumption for meter 0000048125NTFE5 (Aeration Basin, Dissolved Air Floatation Unit, Return Activated Sludge, Waste Activated Sludge) for the year ending March 2012. This meter accounts for 63% of the entire plant energy use.
Table 2.2a: Electricity Consumption for Meter 0000048125NTFE5 (Feb 2011 – Jan 2012)
Electricity Consumption (kWhe) Net Energy Cost TOTAL Electricity Cost
2,419,800 $295,400 $334,300
Table 2.2b shows a summary of the electricity consumption for meter 0000000597NT746 (Digesters, Secondary Clarifier, Workshop, Sludge Tanks / Pumps). This meter accounts for 32% of the entire plant energy use.
Table 2.2b: Electricity Consumption for Meter 0000000597NT746 (Feb 2011 – Jan 2012)
Electricity Consumption (kWhe) Net Energy Cost TOTAL Electricity Cost
1,238,900 $154,800 $166,800
Table 2.2c shows a summary of the electricity consumption for meter 0000032543NT962 (Inlet, Screens, Outfall, Wash-water etc.). This meter accounts for 3% of the entire plant energy use. Note: Net energy cost is higher than total electricity cost for this meter as large fixed cost refunds occurred during the year analysed.
Table 2.2c: Electricity Consumption for meter 0000032543NT962 (Feb 2011 – Jan 2012)
Electricity Consumption (kWhe) Net Energy Cost TOTAL Electricity Cost
120,800 $22,000 $21,200
Table 2.2d shows a summary of the electricity consumption for meter 8523-89 (Pond Aerators, Farmers Water). This meter was not analysed in detail as it covers a large area with comparatively small energy use (1% of total BISTP use).

NRSBU BISTP – Level 2 Energy Audit 8
Table 2.2d: Electricity Consumption for meter 8523-89 (Feb 2011 – Jan 2012)
Electricity Consumption (kWhe) Net Energy Cost TOTAL Electricity Cost
42,600 $9,200 $9,600
The Bell Island Wastewater Treatment Plant also has a small meter (000005092NT-B86) for the Dewatering Plant and Electrician’s Workshop, but as Table 2.2e shows, this only consumes around 1,800 kWh/year. The meter costs Bell Island Wastewater Treatment Plant $2,900, of which only $400 is for energy that only keeps this filter on standby. It is recommended this meter be removed.
Table 2.2e: Electricity Consumption for meter (000005092NT-B86)
(Feb 2011 – Jan 2012)
Electricity Consumption (kWhe) Net Energy Cost TOTAL Electricity Cost
1,800 $400 $2,900
2.2 Electricity Use Consumption Profiles Figure 2.1 compares the monthly electricity consumption for the main site to the amount of wastewater treated for January 2011 – March 2012. The amount of electricity consumption has a very weak relationship to the throughput of wastewater with much of the equipment operating at a set load throughout the year. As expected, the electricity consumption profile is relatively flat throughout the year. However, the discharge rate varies by as much as 400% (e.g. between February and June 2011) due to changes in weather conditions, while the corresponding electricity use variation is only around 30%. Note that the inflows become high with heavy rains due to storm water entering the waste water catchment area. The energy use per m3 of water also varies greatly. The energy use per unit of discharged treated water was particularly high for February – April 2011.
0
100,000
200,000
300,000
400,000
500,000
600,000
700,000
800,000
Jan
-11
Feb
-11
Ma
r-1
1
Ap
r-1
1
Ma
y-1
1
Jun
-11
Jul-
11
Au
g-1
1
Sep
-11
Oct
-11
No
v-1
1
De
c-1
1
Jan
-12
Feb
-12
Ma
r-1
2
Ave
rag
e
Mo
nth
ly m
3 /
Mo
nth
ly k
Wh
Electricity use and water discharge
Discharge (m3) Electricity Use (kWh)
0.00
0.20
0.40
0.60
0.80
1.00
1.20
1.40
1.60
1.80
Jan
-11
Feb
-11
Ma
r-1
1
Ap
r-1
1
Ma
y-1
1
Jun
-11
Jul-
11
Au
g-1
1
Sep
-11
Oct
-11
No
v-1
1
De
c-1
1
Jan
-12
Feb
-12
Ma
r-1
2
Ave
rag
e
kW
h/
m3
Energy use / m3 of water
Discharge Inflow
Figure 2.1 - Electricity Consumption and Wastewater Flow Figure 2.2 reinforces the findings of Figure 2.1. The electricity consumption and generation have relatively flat profiles and do not vary significantly with wastewater flow. Only 26% of the variation in electricity consumption can be

NRSBU BISTP – Level 2 Energy Audit 9
attributed to changes in treated water discharge (as indicated by an R² value of 26%). Only 9% of the variation in electricity consumption is related to changes in wastewater inflow.
y = 0.0672x + 285588
R² = 0.2635
0
50,000
100,000
150,000
200,000
250,000
300,000
350,000
400,0000
10
0,0
00
20
0,0
00
30
0,0
00
40
0,0
00
50
0,0
00
60
0,0
00
70
0,0
00
80
0,0
00
kW
h
Water discharge (m3)
Discharge (m3) vs. Energy use (kWh)
y = 0.04x + 295056
R² = 0.0861
0
50,000
100,000
150,000
200,000
250,000
300,000
350,000
400,000
0
10
0,0
00
20
0,0
00
30
0,0
00
40
0,0
00
50
0,0
00
60
0,0
00
70
0,0
00
80
0,0
00
90
0,0
00
kW
h
Water discharge (m3)
Inflow (m3) vs. Energy use (kWh)
Figure 2.2 - Electricity Consumption vs. Wastewater Flow
Biochemical oxygen demand (BOD) has only been logged at Bell Island Wastewater Treatment Plant since September 2011. BOD is the amount of dissolved oxygen needed by aerobic biological organisms in a body of water to break down organic material present in a given water sample at certain temperature over a specific time period. BOD is sometimes used as a gauge of the effectiveness of wastewater treatment plants. For Bell Island Sewerage Treatment Plant, 2/3 of BOD (though 1/3 of flow) is from industry. Figure 2.3 compares electricity use against BOD.
y = 0.1156x + 203175
R² = 0.007
0
50,000
100,000
150,000
200,000
250,000
300,000
0 10,000 20,000 30,000 40,000 50,000 60,000
En
erg
y U
se (
kW
h/m
on
th)
Inlet BOD (kg/month)
Monthly Energy Use vs. Monthly Inlet BOD
y = -0.0342x + 10902
R² = 0.0369
0
2,000
4,000
6,000
8,000
10,000
12,000
14,000
16,000
0 2,000 4,000 6,000 8,000 10,000 12,000 14,000 16,000
En
erg
y U
se (
kW
h/d
ay
)
Inlet BOD (kg/day)
Daily Energy Use vs. Daily Inlet BOD
Figure 2.3 - Electricity Consumption vs. Biochemical Oxygen Demand (BOD)
The data above highlights unexpected relationships between BOD and energy use for Bell Island Wastewater Treatment Plant. It is expected that the higher the BOD is, the higher the energy use is. However, only 4% of the daily variation in electricity consumption can be attributed to changes in BOD (as indicated by an R² value of 4%). The daily recordings are sporadic (i.e. are not recorded every day of the week). This would help to establish the relationship between BOD and energy use more accurately. The establishment of a benchmark for which to compare wastewater treatment productivity to energy use requires further investigation.

NRSBU BISTP – Level 2 Energy Audit 10
Figure 2.4 shows the hourly load and load duration curve for each time-of-use meter for the historical energy use period (February 2011 – January 2012). • The load for the Aeration Basin etc. meter is inconsistent but one-off peak
loads are rare. The kVA load duration pattern sees two sharp increases in kVA with no corresponding changes to kW readings. This is likely to be due to one or two large items of equipment.
• The load for the Autothermal Thermophilic Aerobic Digesters (ATAD) etc. follows a seasonal pattern and a smooth load duration curve with the exception of the highest few loads.
• The Inlet, Outfall etc. meter had a poor power factor before June 2011 and peak load reductions have resulted since its improvement. The peaks well above normal operation are likely to be the result of wet weather.
Aeration Basin etc.: Load Aeration Basin etc.: Load Duration
0
50
100
150
200
250
300
350
400
Fe
b 1
1
Ma
r 1
1
Ap
r 1
1
Ma
y 1
1
Jun
11
Jul 1
1
Au
g 1
1
Se
p 1
1
Oct
11
No
v 1
1
De
c 1
1
Jan
12
kV
A/k
W
Percentile
kW kVA
0
50
100
150
200
250
300
350
400
0 0.1 0.2 0.3 0.4 0.5 0.6 0.7 0.8 0.9
kV
A/k
W
Percentile
kW kVA
ATAD Plant etc.: Load ATAD Plant etc.: Load Duration
0
20
40
60
80
100
120
140
160
180
200
Fe
b 1
1
Ma
r 1
1
Ap
r 1
1
Ma
y 1
1
Jun
11
Jul 1
1
Au
g 1
1
Se
p 1
1
Oct
11
No
v 1
1
De
c 1
1
Jan
12
kV
A/k
W
Percentile
kW kVA
0
20
40
60
80
100
120
140
160
180
200
0 0.1 0.2 0.3 0.4 0.5 0.6 0.7 0.8 0.9
kV
A/k
W
Percentile
kW kVA
Inlet, Outfall etc.: Load Inlet, Outfall etc.: Load Duration
0
5
10
15
20
25
30
35
40
45
Fe
b 1
1
Ma
r 1
1
Ap
r 1
1
Ma
y 1
1
Jun
11
Jul 1
1
Au
g 1
1
Se
p 1
1
Oct
11
No
v 1
1
De
c 1
1
Jan
12
kV
A/k
W
Percentile
kW kVA
0
5
10
15
20
25
30
35
40
45
0 0.1 0.2 0.3 0.4 0.5 0.6 0.7 0.8 0.9
kV
A/k
W
Percentile
kW kVA
Figure 2.4 - Load Duration Curve

NRSBU BISTP – Level 2 Energy Audit 11
2.3 Electricity Split Figure 2.5 shows the electric energy split for the entire process area. Energy splits provide the basis for audit calculations and are used to identify areas with high energy consumption and methods to reduce this. The electricity splits shown below have been estimated from data recorded during the site visits and from the motor list data provided. The processes which consume the most electricity are aeration (58%) and the Autothermal Thermophilic Aerobic Digestion plant (ATAD) (26%). Note: ATAD includes pumps and motors associated with each train of digesters. Pumps / motors at either end of the trains are included within “sludge tanks / pumps”. The review period used for the total electricity consumption and cost is the year ending January 2012.
Aeration
57.7%
ATAD
26.5%
Sludge tanks/
pumps
6.3%
DAF
2.7%
RAS/WAS
2.0%
Ponds & Farmers
Water 1.8%
Clarifiers
0.9%Preliminary
0.8%Outfall
0.6% Washwater
0.4% Other
0.7%
Figure 2.5 - Electric Energy Split
Figure 2.6 shows the annual cost split for the entire process area.
Aeration
56.8%ATAD
25.3%
Sludge tanks/
pumps
6.3%
DAF
2.7%
RAS/WAS
1.9%
Ponds & Farmers
Water 1.8%
Clarifiers
1.1%Preliminary
1.0%Outfall
0.7% Washwater
0.5% Other
1.2%
Figure 2.6 - Electricity Cost Split

NRSBU BISTP – Level 2 Energy Audit 12
3 TARIFF REVIEW
3.1 Electricity Meridian Energy supplied electricity to Bell Island Wastewater Treatment Plant through multiple 11kV feeders via Network Tasman during the 12 months of energy data analysed (February 2011 – January 2012). Copies of typical electricity bills for each tariff are shown in Appendix B. Bells Island Wastewater Treatment Plant has 3 time-of-use meters. These are:
• 0000048125NTFE5 (Aeration Basin, Dissolved Air Floatation, Return Activated Sludge, Waste Activated Sludge)
• 0000032543NT962 (Inlet, Screens, Outfall, Wash Water) • 0000000597NT746 (Autothermal Thermophilic Aerobic Digestion plant,
(ATAD), Secondary Clarifier, Workshop, Sludge Tanks and Pumps) There is also a small fraction of energy use on non-half-hourly (NHH) metering.
• 0000050923NT-B86 (Dewatering Plant and Electrician’s Workshop) • 8523-89 (Pond Aerators, Farmers Water)
Energy Charges For the time-of-use meters, electricity is purchased at a Fixed Price Variable Volume (FPVV) which divides the year into 144 time slots for time of day (4 hour slots), day of week (business days and non-business days) and month of year. Each time slot has a fixed hedge rate based on a number of variables related to the time of year. The average hedged rate for these meters for the year ending January 2012 was 9.6 ¢/kWh. (Note: Under the new electricity tariff in effect February 2012, the average hedged rate will decrease to 8.7 ¢/kWh for the year ending January 2013 and 9.2 ¢/kWh for the year ending January 2014).
The energy tariff for meters has the following components:
Variable Charges: ATAD Plant etc. Aeration basin etc. Inlet, Outfall etc.
Hedged Energy Charge 4-17 ¢/kWh 4-17 ¢/kWh 4-17 ¢/kWh
Nelson City Council Electricity Authority Charge 0.240 ¢/kWh 0.240 ¢/kWh 0.240 ¢/kWh
Fixed Charges:
Data Reconciliation / Reading Fee $32 /month $32 /month $32 /month
CT Monthly Fee (sewerage plant only) $15 /month
TOTAL ENERGY COST $125,900 /year $240,100 /year $10,600 /year
For ICP number 0000050923NT-B86 electricity is purchased on an anytime tariff.
Variable Charges:
Anytime Rate 24.51 ¢/kWh
TOTAL ENERGY COST
$780 /year

NRSBU BISTP – Level 2 Energy Audit 13
For ICP number 8523-89 electricity is purchased on a day/night tariff.
Variable Charges:
Day Rate (7 am – 11 pm) 25.06 ¢/kWh
Night Rate (11 pm – 7 am) 14.83 ¢/kWh
TOTAL ENERGY COST $9,200 /year
The energy prices used for savings calculations are listed below. Time-of-use rates (hedged energy charges), have been reduced compared to those for the analysed historical energy use period (Feb 2011 – Jan 2012) due to Bell Island Sewerage Treatment Plant changing power suppliers from Meridian to Trustpower in February 2012. ATAD Plant etc. and Aeration Basin etc. Inlet, Outfall etc.
Non-Business
Day Business Day
Non-Business Day Business Day 2300-0700
0700-2300
2300-0700
0700-2300
2300-0700
0700-2300
2300-0700
0700-2300
Jun-12 11.07 14.48 11.26 17.32 13.04 19.74 13.23 22.58 Jul-12 11.13 14.61 11.32 17.13 13.10 19.87 13.29 22.39
Aug-12 10.58 13.81 10.75 16.20 12.55 19.07 12.72 21.46 Sep-12 9.00 12.03 9.14 13.47 10.97 17.29 11.11 18.73 Oct-12 6.59 7.42 6.69 9.51 8.56 14.83 8.66 16.92 Nov-12 6.05 6.87 6.15 8.84 8.02 14.28 8.12 16.25 Dec-12 5.91 6.74 6.01 8.57 7.88 14.15 7.98 15.98 Jan-13 5.74 6.58 5.95 8.99 7.71 13.99 7.92 16.40 Feb-13 6.37 7.35 6.56 10.31 6.37 7.35 6.56 10.31 Mar-13 7.29 8.42 7.49 12.07 7.29 8.42 7.49 12.07 Apr-13 9.79 10.98 10.02 13.42 11.76 18.39 11.99 20.83
May-13 11.57 15.07 11.76 17.70 13.54 20.33 13.73 22.96 Average 8.42 10.36 8.59 12.79 10.07 15.64 10.23 18.07
10.91 14.98
The anytime electricity rate for ICP number 0000050923NT-B86 is assumed to remain at 24.51 ¢/kWh throughout the year. The rates for ICP number 8523-89 are assumed to remain at 25.06 ¢/kWh (day) and 14.83 ¢/kWh (night). Network Charges Bell Island Sewerage Treatment Plant has connections through the Network Tasman distribution network. Network Tasman bills Bell Island Sewerage Treatment Plant through the electricity retailer (Meridian Energy until February 2012, Trustpower since). The following network charges are applicable to Bell Island Sewerage Treatment Plant.
Variable Charges: ATAD Plant etc. Aeration basin etc. Inlet, Outfall etc.
Winter RCPD Average Rate $0.2272/kVA-day $0.2272/kVA-day $0.0405/kVA-day
Variable Distribution Charge 0.67-3.43 ¢/kWh 0.67-3.43 ¢/kWh 2.64-8.69 ¢/kWh
Fixed Charges:
Anytime Capacity Distribution $8,720 /year $24,180 /year $0 /year
TOTAL NETWORK COST $41,000 /year $94,200 /year $10,500 /year

NRSBU BISTP – Level 2 Energy Audit 14
The Winter Regional Coincident Peak Demand (Winter RCPD) Charge is based on the average of the 12 hourly peaks for each billed site co-incident with the highest peak demands experienced by Transpower. The amount charged stays constant on each meter for the year of energy use analysed (April 2011 – March 2012). This equated to $0.2272/kVA-day for the ATAD Plant etc. and Aeration Basin etc. and $0.0405 /kVA-day for the Inlet / Outfall etc. The winter peak demand for billed sites is said by Network Tasman to regularly match the peak demand for Transpower due to weather, time of day etc. Therefore, sites that can move their peak demand to atypical times of the day should see a reduction in energy costs. As the load pattern for most of Bell Island Sewerage Treatment Plant is flat, a reduction in installed load should result in peak demand savings. The Anytime Capacity Distribution Charge equates to $0.139 /kVA-day. During the year April 2011 – March 2012, the capacity considered to be required remained at the following for each of the sites:
• 172 kVA – ATAD Plant etc. • 477 kVA – Aeration Basin etc.
This capacity charge is billed based on the previous year of data, and is also independent of any site requirements for capacity (e.g. fuse sizes). Therefore, if the demand can be reduced, this charge can be reduced without capital expenditure on-site. For ICP number 5800402110-25 (Dewatering Plant), the capacity charge is $0.052 /kVA-day. The required capacity was determined to be 110 kVA for the year from April 2011 – March 2012. This charge equates to around 80% of the total annual cost of electricity for this meter. Given the very sparse energy use of this site, reducing this charge is the key to energy savings for this meter.
Variable Charges:
Capacity Charge $0.052 /kVA-day
TOTAL NETWORK COST $2,465 /year
The electricity bills for ICP number 8523-89 were not analysed. It is assumed for this meter there are no network charges and fixed costs are 96.50 ¢/day.
It is recommended the names of some meters be changed from those used on the Meridian electricity bills (if not done so already by Trustpower), as these are confusing. Names used by Meridian Energy (and proposed changes in brackets) are below:
• Sewerage Plant (Aeration Basin and DAF) • Aeration Basin (Primary clarifier, inlet and outlet) • New Sewerage ATAD Plant, Bell Island (Dewatering and Electrician’s
Workshop) • No change is necessary for the main ATAD Plant meter.

NRSBU BISTP – Level 2 Energy Audit 15
4. PROCESS DESCRIPTION The Bell Island Sewage Treatment Plant (BISTP) processes 15,000 cubic metres of wastewater each day (on average). Sewage is transported through a network of underground pipes and pumps to BISTP. Pipe diameters increase in size as the water combines from pipe branches and approaches the treatment plant. Considerable infiltration of storm water occurs during heavy rains which can raise the hydraulic load of the plant by up to five times (13,000 m3 for a dry day, 50,000 m3 for a very wet day and 70,000 m3 for a worst-case wet day). Weather conditions have a much greater impact on wastewater volume than the time of day, although there are peaks associated with each. Approximately 67% by volume of the sewage flow is from domestic sources (33% of biochemical oxygen demand (BOD) concentration), with the remaining 33% of flow (67% of BOD) coming from industrial and commercial sources. A site map with locations of major items of equipment is shown in Appendix A. Power ratings witnessed for pumps, motors etc. are included in Appendix C.

NRSBU BISTP – Level 2 Energy Audit 16
4.1 Preliminary Treatment Inflow and Screening: At the time of the site visit, the sewage entered Bell Island Wastewater Treatment Plant through two channels, the main 800 mm diameter plastic / polyurethane pipe from Nelson, and a 300 mm steel / polyurethane pipe from Mapua. There is also a 600 mm concrete pipe, although this is currently leaking. The leak has been found and the pipe will be repaired and used again. The inflow valve for the 600 mm pipe was appropriately closed during viewing due to not being in service. There are 2 screens to remove solid material larger than 3mm from the inlet sewage flow. The primary has a rated capacity of 760 litres / second per screen (2,730 m3 / hour). The secondary screen is added to the process by means of a trip switch when the inlet sewage flow is above 760 L/second. Weir overflow makes the screen rotate and let water through, while the solids are held. The screened solids then pass through a classifier screw. The non-biodegradable solids are transferred into a skip. Flow meters are used to determine the fractions of total inflow that occur through the main pipes and the Mapua pipe. The classifier screw was seen to be on 24/7. Good practice is to operate this on a 20 minute cycle (for which the screen pump is typically on for around 5 minutes and off for 15 minutes), due to there often being few solids to screen. However, staff operate the classifier screw 24/7 as they had problems with the screw being blocked when operated sporadically. Therefore, changing classifier screw operation is not a savings opportunity. Grit Removal: Grit is removed early in the process to prevent damage to pumps / pipes further along in the process. The screened liquid flows via gravity to a grit arrester, which introduces compressed air to the water which is pumped to a grit classifier. This classifier forces dense (inorganic) matter to travel towards its centre and then discharges it to a skip for removal. The grit arrester is only on occasionally, which suggests it receives a signal to switch on given a level indication. This is good practice.
• The “Fring” aerators (at the Aeration Basin and the Autothermal Thermophilic Aerobic Digesters (ATAD)) can lose efficiency due to wear from sludge contents. This places importance on the solids screening and grit stages of the process.
Wash water:
• Wash water pumps provide clean effluent to the grit system 24/7. This typically requires one of three pumps which run on a duty cycle. These pumps operate on a variable speed drive (VSD), which is good practice.
• There appears to be a submersible pump on the water supply. The load of this pump should be determined.

NRSBU BISTP – Level 2 Energy Audit 17
4.2 Primary Treatment Primary Clarifier The Primary Clarifier removes settle-able solids (“sinkers”) and floatable solids (“floaters”) from the wastewater. Waste water flows from the liquid output of the primary screen to the centre of the Primary Clarifier. Clean effluent flows out of the edge of each clarifier due to gravity and this flow is controlled via small weirs. The wash water pumps take the effluent overflow to the aeration basin (or to the grit system as necessary). Primary sludge is removed by a large scrape arm along the radius of the clarifier and paddles beneath which draw sludge to the centre of the clarifier. The two scrape arm motors are controlled together using a variable speed drive and operate at around 50% of full load.
The Primary Clarifier is designed to allow bypass for the regulation of water if flows are very high and therefore energy savings (per m3 of effulent) can be made by utilising this bypass as often as possible. The Primary Clarifier produces (and hence removes) 60-70% (7 tonne/day) of overall sludge production on site. The other 30-40% is removed in the Aeration Basin/ Secondary Clarifier, while the Nelson North sludge is imported.
Aeration Basin: The Aeration Basin is positioned between the Primary and Secondary Clarifiers in the effluent flow sequence. The aeration basin is 5 metres deep and grows bugs for the treatment of solids using oxygen. The aeration basin accounts for 92% of the time-of-use meter 0000048125NTFE5. Flow through the aeration basin is said to peak 07:00 – 10:00 and 22:00 – 24:00 each day. The load profile of this meter is shown in Appendix C.
The Aeration Basin contains 6 x 75 kW aerators and 5 x 30 kW aerators (600 kW in total), known as “Fring” aerators (being manufactured by Fring). A typical aerator is shown in Figure 4.2. Aeration operates 24/7, but due to three aerators being out of commission the facility is currently under-aerated.

NRSBU BISTP – Level 2 Energy Audit 18
Figure 4.2 – Typical Aerator The aerators suck air and water through tubes, which is then dispersed through the outer prongs. The aeration load is higher during the day, thus requiring more oxygen. If oxygen is below intended levels, an “odour event” can result.
• The Fring aerators are rebuilt annually due to their arduous duty. Different parts of the Fring aerators are replaced at different times, as expensive parts are often retained for longer. This is also most likely due to the need to keep the plant operating at maximum capacity for all but a few hours. The annual schedule of maintenance seems to be a reasonable approach.
• The oxygen (O2) level of the aeration basin is typically kept between 0.5 and 1.5 ppm, with an alarm being raised when O2 is below 0.1 ppm, as at this level odour becomes a problem. During the site visit, the O2
concentration was 0.07 ppm (with one 75 kW motor and two 30 kW motors not working). However, since the facultative ponds were receiving ample sunlight, a significant amount of aeration was being performed at the ponds.
• The aerators are controlled by dissolved oxygen (DO) levels. • The Fring aerators operate with an efficiency of around 0.9 kg O2 / kW. A
diffused air system produces 1.24 kg O2 / kW, thus using 27% less power for the same result. However installing diffused air is an expensive undertaking, costing around $3.2 million for the entire site compared to $0.8 million for Fring motors. Air diffusion systems are currently not on the Nelson Regional Sewerage Business Unit plan.
o Even if the diffused air system were only used at the aeration basin, and the 27% saving extended to demand as well as energy efficiency, the payback would be in the order of 30 years given:

NRSBU BISTP – Level 2 Energy Audit 19
� An estimated cost for replacing aerators with diffused air at the aeration basin of $2.2 million.
� 27% savings on $278,000/year (the estimated cost of running the aerators in the aeration basin)
Therefore, this measure is not economically feasible while the Fring aerators are in good order. However, if at some stage in the future, the Fring aerators have to be replaced, then replacing those with a diffused air system needs to be re-examined as the payback period will be shorter.
• The Fring motors are 6-speed and are all attached to variable speed drives (VSDs). 5 aeration basin VSDs were read on site, the results of which are shown in Appendix C1. A 75 kW pump is assumed to use 43 kW on average, and a 30 kW pump is assumed to use 19 kW on average.
Trickling filters are an alternative solution to the Aeration Basin for the removal of colloidal and dissolved solids (i.e. not settle-able or floatable). For an aeration basin, the removal of biochemical oxygen demand (BOD) from wastewater varies from 75 - 90 % depending on the amount of time the water is retained. Correspondingly, a low-rate or standard-rate trickling filter (assumed to apply to Bell Island Sewerage Treatment Plant), should remove from 80 - 85 % of the applied BOD. Therefore, the two approaches have similar BOD removal capabilities. It is recommended that trickling filters be re-examined if favourable information becomes available regarding improved BOD removal efficiency / reduced effluent duration when using a trickling filter.
4.3 Secondary Treatment
Secondary Clarifier: The Secondary Clarifier receives gravity fed sludge /and water from the Aeration Basin. The Secondary Clarifier provides additional solids / liquids separation, using a similar configuration to the Primary Clarifier. After the Secondary Clarifier, the effluent can be transferred to the Facultative Ponds (F1, F2 and F3). Remaining sludge is separated into two streams, “return activated sludge” (RAS) and “waste activated sludge” (WAS), as detailed in Section 4.5. Whether liquid is transferred to WAS / RAS or to the ponds depends on the concentration of “Mixed Liquor Suspended Solids (MLSS)”. If MLSS concentration is above 2000 ppm (g/m3), the liquid goes to WAS / RAS. If it is less than 2000 ppm, the liquid goes to the ponds. On average, the waste activated sludge pumps receive 3000-4000 ppm solids from the secondary clarifier. Energy use of the Aeration Basin (etc.) time-of-use meter is plotted against MLSS in Figure 4.1. Note: This meter does not include the Secondary Clarifier, but is used in this comparison due to being highly energy intensive.

NRSBU BISTP – Level 2 Energy Audit 20
y = 0.0726x + 6006.1
R² = 0.199
0
2,000
4,000
6,000
8,000
10,000
12,000
0 5,000 10,000 15,000 20,000 25,000 30,000 35,000 40,000 45,000
En
erg
y U
se (
kW
h/d
ay
)
MLSS(kg/day)
Daily Energy Use vs. MLSS
y = -0.0781x + 156583
R² = 0.004
0
50,000
100,000
150,000
200,000
250,000
0 50,000 100,000 150,000 200,000 250,000 300,000
En
erg
y U
se (
kW
h/m
on
th)
MLSS(kg/month)
Monthly Energy Use vs. MLSS
Figure 4.1 – Energy use vs. Mixed Liquor Suspended Solids (MLSS) Only 20% of the variation in Aeration Basin (etc.) electricity consumption can be attributed to changes in MLSS (as indicated by an R² value of 20%). There is almost no relationship between MLSS and Aeration Basin (etc.) energy use according to available monthly figures.
Ponds: After secondary treatment, the treated wastewater is split between three facultative ponds (F1, F2 and F3 - formerly called oxidation ponds). These cover 30 hectares in total and are in parallel. Bacteria and nutrient in the waste promote vigorous growths of algae. During the day, near the surface, the algae generate oxygen by photosynthesis, further stabilising the wastes. The remaining solids settle to the bottom and are treated by anaerobic processes. Each pond has a 4 kW aerator. The water travels from these ponds to the Maturation Ponds (two in series – M1 and M5).
The status of the Facultative Ponds was read on two occasions during the site visit. Results were: Pond Total Flow Date and time Inflow l/s Dissolved oxygen
(DO) concentration F1 8,780,335 15/05/12 11:00 115 1.41 16/05/12 14:30 107 0.61 F2 7,406,024 15/05/12 11:00 67 9.58 16/05/12 14:30 49 9.61 F3 10,136,005 15/05/12 11:00 81 2.48 16/05/12 14:30 55 1.84
The ponds vary in DO concentration due to differing types of algae present, with F2 having significantly higher DO concentration than F1 or F3. Daylight savings settings on the SCADA system appeared to have been left on for the winter season with respect to the oxidation pond controls. This should be checked.
Maturation Ponds: The two 10ha Maturation Ponds (in series) complete the stabilisation process and reduce bacteria numbers. They also provide storage capacity for intermittent release of the effluent.

NRSBU BISTP – Level 2 Energy Audit 21
Discharge: After an average retention time of 50-60 days (since primary inflow), the treated wastewater is discharged from the Maturation Ponds through a gravity driven outfall, into the Waimea Inlet. The treated effluent is typically discharged from high tide until 3 hours after high tide, so as to be taken out with the tide. For the most part the effluent discharge is gravity fed, although a discharge pump has been installed to increase the discharge capacity. The discharge pump is designed to operate during bouts of heavy rain as this is the driver for increased effluent throughput. During the audit process, the discharge pump was adjusted so that it only operates during high discharge flow (caused by high rainfall), with gravity-fed discharge flow becoming the default discharge strategy. Energy savings from this measure are discussed in EMO 2.1.
The final effluent quality standards for discharge are shown in Table 4.2. The biochemical oxygen demand (BOD) and suspended solids standards are not as stringent as at North Shore Wastewater Treatment Plant (as an example).
Table 4.2: Designed final effluent quality standards Pollution type Outlet Concentration (g/m
3)
BISTP, Nelson North Shore BOD5 <40 <10
Suspended Solids <100 <15 Total nitrogen 10-20
Ammonia & Ammonium <2 Pollution type Outlet Concentration (kg/day)
Total nitrogen 500 Phosphorus 150
Oysters are known to collect on the discharge diffuser, although this area was not witnessed on site. Currently the approach is to clean the oysters off the discharge diffusers; however there may be ways to do this using ultrasonic technology. For example, boat hulls can be kept free of barnacles by using an ultrasonic device, thus improving the fuel efficiency the boat. Automating discharge diffuser cleaning would save maintenance costs rather than energy costs.
4.4 Solids Treatment
Figure 4.3 shows the sludge throughflow for the three main components of digester sludge ever since all three were recorded on a day-to-day basis.
• Primary sludge accounts for just over 50% of the total sludge sent to the digesters (~63% of on-site sludge);
• Dissolved Air Flotation (DAF) sludge accounts for just over 30% (~37% of on-site sludge);
• Nelson North sludge accounts for just under 20% of the digester sludge.

NRSBU BISTP – Level 2 Energy Audit 22
0
1,000
2,000
3,000
4,000
5,000
6,000
12
-Ma
r
19
-Ma
r
26
-Ma
r
2-A
pr
9-A
pr
16
-Ap
r
23
-Ap
r
30
-Ap
r
7-M
ay
14
-Ma
y
21
-Ma
y
m3
Slu
dg
e
FT638 (Primary Sludge) FT531 (DAF) FT511 (North Nelson)
Figure 4.3 - Sludge Flow Meter Volume: 12 March 2012 – 21 May 2012
Primary Sludge The sludge that settles and is removed within the primary clarifiers is called “primary sludge”. Sludge from the base of the clarifier is pumped to the digesters. The means of measuring sludge concentration at various stages of the process is desired but has not been planned or implemented yet. Primary sludge is currently pumped directly to the sludge storage tank (T202), although there is functionality on the SCADA (Supervisory Control and Data Acquisition) system to send primary sludge to the Gravity Belt Thickener or the Dissolved Air Floatation unit, or to turn the sludge pumping off. The primary clarifier sludge pumps (P618 and P624) operate when there is enough sludge. These pumps run most efficiently at higher speeds; therefore they are on a timed sequencer with one operating on duty and one standby. They can become worn down if the initial grit system lets grit through. This reduces their efficiency.
Low density organic matter such as fats (referred to as “scum”) float to the surface of the Primary Clarifier. These are scraped away to a scum tank, where they are pumped downwards so as to exit the clarifier at the same point as the settleable solids.
Dissolved Air Floatation (DAF) unit In 2005, the Dissolved Air Floatation (DAF) process was added as a gravity separation system that uses air bubbles in the wastewater holding tank to help float insoluble materials to the surface so they can be removed. The separation process is aided by dosing the effluent with polyelectrolytes. The polyelectrolytes are introduced to the process early for maximum contact / binding time (1 kg/m3 of solids). The resulting flocculants cause these materials to join together in clusters that are lighter than water and therefore float. Based on site observations, the DAF is assumed to operate for 5 days a week, 24 hours a day on average, though this can vary from 3 days a week to 24/7, depending on other treatment plant loads.

NRSBU BISTP – Level 2 Energy Audit 23
Part of the clean effluent out of the Dissolved Air Floatation (DAF) unit is pressurised by two 15 kW pumps on VSDs, operating at about 5 kW each, and pumped into the compression tank. An air compressor supplies air at 6.5-8.1 bar to the compression tank. Here the air is absorbed in the high pressure effluent water. This air saturated effluent water is discharged at the bottom of the DAF unit (below the main feed). Once the water pressure is reduced, the absorbed air releases in the form of fine bubbles, which carry sludge to the top of the DAF unit. The sludge is then scraped off the surface to a collection tank using a skimmer and the remaining underflow water is sent to the ponds. The sludge from the DAF is transported to the sludge holding tank.
The installed maximum load of the DAF should be reviewed with regards to EMO 3.1. It is believed the Gravity Belt Thickener (GBT) would use less energy than the DAF to perform the same function (though at a greater polyelectrolyte cost). As mentioned in EMO 1.1, an asset register should be established that documents the energy use and intended operation of each item of process equipment. P506 (believed to be the DAF Feed Flow pump) was listed as having 196 Hz frequency on the SCADA (Supervisory Control And Data Acquisition) graphic for the secondary clarifier. This was read elsewhere to be 19.6 Hz. The SCADA graphic should be checked and adjusted accordingly.
Return Activated Sludge (RAS)
The return activated sludge system takes the sludge from the secondary clarifier and returns it to the Aeration Basin. This increases the contact time of the waste with the micro-organisms required for water treatment and is used to promote the growth of more micro-organisms. Two 11 kW pumps are used in this area (one on / one standby). This return activated sludge was seen to be operating at 74 litres/ second.
The pump operation for return activated sludge is very efficient in that pumps operate for a length of time relative to the thickness of the blanket of sludge it is trying to move from the secondary clarifier. The following steps are used:
Step Return Level (mm)
Total pump min/hour (2 pumps)
1 100 12 2 200 24 3 300 36 4 400 48 5 500 60 6 600 72
Waste Activated Sludge (WAS) Waste activated sludge is removed directly from the secondary clarifier and sent to the Dissolved Air Floatation (DAF) unit using the waste activated sludge pump.

NRSBU BISTP – Level 2 Energy Audit 24
This pump is controlled with a variable speed drive. The waste activated sludge was seen to be operating at 4.4 litres/ second (a small fraction of the return activated sludge flow). The waste activated sludge is about 0.6 - 1% solids when it reaches the Dissolved Air Floatation (DAF) unit.
Solids Dewatering Building (SDB) There is currently provision for the primary solids to be sent to the Solids Dewatering Building where they can be processed for removal to landfill. The Solids Dewatering Building dewaters the digested sludge for bio-solids disposal. Several potential practical uses for digested bio-solids exist including soil regeneration, but these usages usually have to overcome political and health barriers. This facility is currently inactive due to the consistent and safe use of solids for fertilising trees on Rabbit Island. There is also an activated carbon filter external to the Solids Dewatering Building, which only operates when the Solids Dewatering Building is operating. The Solids Dewatering Building currently uses its own meter resulting in significant annual cost. This is discussed further in EMO 1.2.
Gravity Belt Thickener (GBT) plant: The Gravity Belt Thickener is currently not in operation as the DAF has been seen to be sufficient for the separation of solids. It could act as an alternative to the DAF and is still set up for sludge separation. Like the DAF, the Gravity Belt Thickener is polymer dosed. It is said to have only been in operation for 2 months after which it was not required. During the site visit, it was noted the Gravity Belt Thickener could potentially use significantly less energy than the DAF to thicken sludge due to much reduced pumping equipment. This is discussed in EMO 2.3.
Sludge Storage Tank: Sludge from the bottom of the primary clarifier (pumped by P618 and P624) and sludge from the DAF (pumped using a 7.5 kW “worm pump”), go to the sludge storage tank. The “Nelson North” sludge tank receives (by truck) sludge unable to be used at the Nelson North water treatment plant. This is also pumped to the main sludge tank. The Nelson North sludge pump only operates when required to by Nelson North. This can be anywhere from once a day to twice a month. The power used by the associated pump should reflect this variance. The amount of sludge fed to the sludge storage tank is monitored carefully. The age of sludge that reaches the storage tank can vary from 1 to 30 days (longer in a few cases). Sludge is on average around 5 days old when it reaches the storage tank. Autothermal Thermophilic Aerobic Digesters (ATAD): The two-stage ATAD process uses heat released by microbial activity to achieve and sustain optimal temperature range for thermophilic digestion. The digesters are fed sludge from the sludge storage tank and deliver it to the Bio-solids tank to be pumped to Rabbit Island. Two pumps operating in duty/standby feed the pipes which split the sludge between the A, B and C trains. Each train has a valve and actuator. A heat exchanger was installed to pre-heat

NRSBU BISTP – Level 2 Energy Audit 25
the sludge before entering the digesters. However this heat exchanger was found to not be needed and was subsequently disconnected. There are 6 digesters: 2 in the “A” train (A1, A2), 2 in the “B” train (B1, B2), and 2 in the “C” train (A1, A2). The main sludge storage tank feeds to A1/B1/C1, which discharge into A2/B2/C2, which act as a buffer between A1/B1/C1 and the Bio-solids Storage Tank. All 6 tanks are used evenly. For example, the sludge storage tank empties into A1, which empties into A2, which empties into the Bio-solids tank. The same path is taken for sludge through the B and C trains. The A train operates slightly differently to the B and C trains.
• A1 and A2 have two recirculating blowers between them to inject air into the sludge to ensure the required bugs keep working. The blowers are in parallel and operate with one on duty, one standby serving both digesters.
• Each “A” digester also has two sludge recirculation pumps, one on duty and one on standby.
• “B” and "C” digester each has one 36 kW Fring aerator instead of a blower / pump configuration.
• Each tank has a supply which injects air into the sludge and spreads it out to the bottom of the tank. This assists with the aerobic reaction. The same supply sends sludge up and across to A1 at high level.
• All 6 tanks each have a “foam cutter” at the top of the tank to ensure the tanks do not overflow with foam. A vacuum pipe removes odours and discharges them to the bio-filter.
Aerobic digestion is used at Bell Island Sewerage Treatment Plant. Anaerobic digestion is still under consideration, which if it went ahead would reduce electricity consumption, use the existing digesters and would produce around 350 kW of power for use on site (given 2007 effluent loads). This technology would replace the Autothermal Thermophilic Aerobic Digesters (ATAD), but as it produces power, the resulting savings can be applied to the whole plant. The implementation of anaerobic digestion is said to be a Nelson Regional Sewerage Business Unit (NRSBU) decision due to its size, cost and environmental impact. This measure is discussed further in EMO 3.2.
Discharge of Solids Disposal of bio-solids is via application every three years within the forested area of Rabbit and Bell Islands. The resultant boisolids from the ATAD Plant are transferred to a storage tank before being pumped across the Waimea Inlet (by two duty / standby pumps) to holding tanks on Rabbit Island. This ends the sludge processing at Bell Island. By this time, the sludge is 2-4% solids. The sludge pumped from Bell Island to Rabbit Island typically varies from ~50 m3 to ~150 m3 / day. Alarms are reported when the Bio-solids Storage Tank level is to low (< 6 m3) or too high (>100 m3). Transfer to Rabbit Island is started if there is at least 10 m3 in the Bio-solids tank. Transfer stops at 6 m3. This is a reasonable approach in terms of energy efficiency.

NRSBU BISTP – Level 2 Energy Audit 26
4.5 Auxiliary Processes and Equipment
Odour Control: Bio-filters are used. Much of this equipment has to remain on to ensure odours do not form and drift towards mainland Nelson. Many sources of foul air including Screening, Grit Removal and the aerobic digesters are enclosed. The foul air is collected and sent to the bio-filter. The bio-filter consists of a mix of bark and soil where the odorous compounds are absorbed into the bark and soil and destroyed by naturally occurring bacteria. These bacteria require both temperature and moisture control.

NRSBU BISTP – Level 2 Energy Audit 27
5 ENERGY MANAGEMENT OPPORTUNITIES EMO Designation: The decimal number labels each EMO in a sequence. The first number is coded:
1 Electricity Supply 2 Main Processes 3 Lighting 4 HVAC 5 Office Equipment
Note that some EMOs are further separated into the following:
a Paybacks less than 1 year b Paybacks between 1 and 5 years c Paybacks over 5 years
5.1 Electricity supply A description of the electricity usage is shown in Section 2. The electricity tariffs for Bells Island Sewerage Treatment Plant are described in Section 3. The power factor correction on site is excellent as shown by the data in Appendix D and the spot readings made during the site visit (as shown below):
• Aeration Basin power factor: 0.98 • Caretaker’s Block: 0.99 • Autothermal Thermophilic Aerobic Digesters: 0.97 • Return Activated Sludge: 0.98

NRSBU BISTP – Level 2 Energy Audit 28
EMO 1.1 Include energy account payments in the performance contract “CPG” presently have a performance contract with Nelson Regional Sewerage Business Unit (NRSBU) under which the waste water treatment facility at Bell Island Wastewater Treatment Plant is managed with regards to maintenance, quality and quantity of wastewater treated and discharged etc. However, NRSBU pay the electricity bills and have little input into the day-to-day management of the site itself. As CPG are highly knowledgeable of the site and its relative energy efficiency, it is recommended that the payment of energy accounts be transferred to CPG as an incentive for energy savings measures.
For example, CPG maintains the aerators on an annual basis. These aerators lose efficiency over time as diffuser and impeller gets eroded. If CPG were responsible for the electricity cost, CPG would optimise the overhauls for optimum performance and efficiency. The same applies for the direct displacement sludge pump.
The performance contract should include the establishment and maintenance of an asset register. This will provide thorough documentation of installed equipment loads and intended operation.
The performance contract should also include the conductance of tests on pumping equipment with the following areas of focus:
• Obtain data from the manufacturer regarding how the pump should operate in theory
• Measurements of pressure, flow and current • How the pump is functioning in practice • How the pump should be functioning in practice
It is believed 4% of total energy use and cost ($534,900) can be saved by incentivising energy efficiency in this manner.
Implementation Cost Annual Electricity Savings Cost Savings Payback Period
$500 0 kWh $21,000 0.2 years
NRSBU BISTP – Level 2 Energy Audit 29
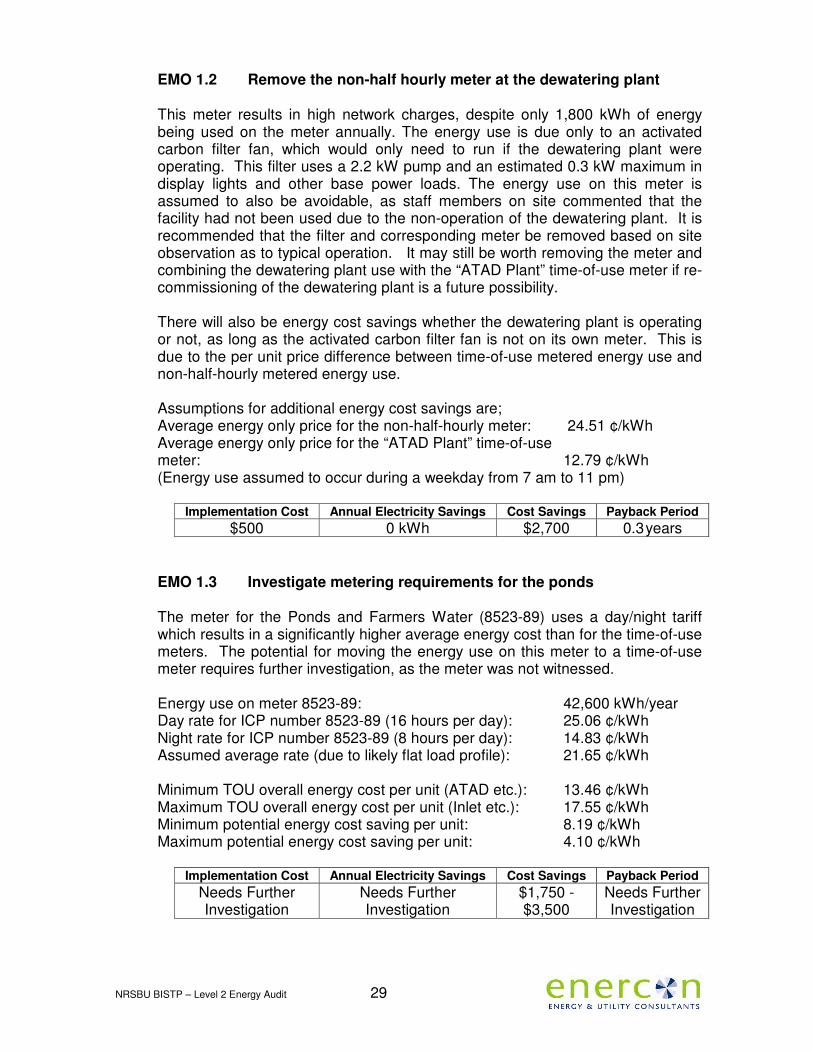
EMO 1.2 Remove the non-half hourly meter at the dewatering plant This meter results in high network charges, despite only 1,800 kWh of energy being used on the meter annually. The energy use is due only to an activated carbon filter fan, which would only need to run if the dewatering plant were operating. This filter uses a 2.2 kW pump and an estimated 0.3 kW maximum in display lights and other base power loads. The energy use on this meter is assumed to also be avoidable, as staff members on site commented that the facility had not been used due to the non-operation of the dewatering plant. It is recommended that the filter and corresponding meter be removed based on site observation as to typical operation. It may still be worth removing the meter and combining the dewatering plant use with the “ATAD Plant” time-of-use meter if re-commissioning of the dewatering plant is a future possibility.
There will also be energy cost savings whether the dewatering plant is operating or not, as long as the activated carbon filter fan is not on its own meter. This is due to the per unit price difference between time-of-use metered energy use and non-half-hourly metered energy use.
Assumptions for additional energy cost savings are; Average energy only price for the non-half-hourly meter: 24.51 ¢/kWh Average energy only price for the “ATAD Plant” time-of-use meter: 12.79 ¢/kWh (Energy use assumed to occur during a weekday from 7 am to 11 pm)
Implementation Cost Annual Electricity Savings Cost Savings Payback Period
$500 0 kWh $2,700 0.3 years
EMO 1.3 Investigate metering requirements for the ponds
The meter for the Ponds and Farmers Water (8523-89) uses a day/night tariff which results in a significantly higher average energy cost than for the time-of-use meters. The potential for moving the energy use on this meter to a time-of-use meter requires further investigation, as the meter was not witnessed.
Energy use on meter 8523-89: 42,600 kWh/year Day rate for ICP number 8523-89 (16 hours per day): 25.06 ¢/kWh Night rate for ICP number 8523-89 (8 hours per day): 14.83 ¢/kWh Assumed average rate (due to likely flat load profile): 21.65 ¢/kWh
Minimum TOU overall energy cost per unit (ATAD etc.): 13.46 ¢/kWh Maximum TOU overall energy cost per unit (Inlet etc.): 17.55 ¢/kWh Minimum potential energy cost saving per unit: 8.19 ¢/kWh Maximum potential energy cost saving per unit: 4.10 ¢/kWh
Implementation Cost Annual Electricity Savings Cost Savings Payback Period
Needs Further Investigation
Needs Further Investigation
$1,750 - $3,500
Needs Further Investigation

NRSBU BISTP – Level 2 Energy Audit 30
5.2 Main Processes
Most sizable pumps have variable speed drives (VSDs) and/or soft start technology. This is excellent practice. There are some pumps for which VSDs could be switched off; however the savings from this are minimal (around 4%) and switching off variable speed equipment is known to cause issues with the smoothness of overall wastewater treatment plant operation. The majority of the motorised equipment is direct driven, which is the most efficient configuration. 2 pumps were found that were belt driven, utilising V belts (these pumps were for transport of Nelson North / Dissolved Air Floatation unit sludge to the sludge holding tank). Replacing these V-belt drives with synchronous (or cogged) belt drives would eliminate slippage and provide higher drive efficiency (~97% compared to ~93%). However, synchronous belts can only be used on equipment that does not require slippage during start-up, or when a blockage occurs. For the latter reason, V-belt drives are likely to be appropriate for the application they are used in at Bell Island Wastewater Treatment Plant as a slipped belt is the worst-case scenario compared to a synchronous pump clogging up. It is however recommended that due to the overall condition of the V-belt drives witnessed that they be reviewed for replacement for the next site-wide equipment upgrade. When replacing, evaluate belt effectiveness for different types. The solid screw feed appeared to be operating on manual (i.e. consistently regardless of the quantity of solids needing to be filtered). However, the solid screw feed was in the process of being repaired at the time of the site visit, and typically operates on a 20 minute cycle, for which it is on for around 5 minutes. This is a sufficient cycling of this equipment for the purposes witnessed; therefore no further energy efficiency measures are advised for the solid screw feed.

NRSBU BISTP – Level 2 Energy Audit 31
EMO 2.1 Use anaerobic digesters instead of aerobic digesters Anaerobic digesters have already been explored for the Bell Island Sewerage Treatment Plant as documented in the report titled: “1-729520-NRSBU Report 193 - Preliminary Assessment of Anaerobic Digestion for Bell Island Wastewater Treatment Plan – Waste Solutions - September_2007” (hereafter referred to as the September 2007 report). The report recommends using the existing aerobic digesters for another 5-7 years (hence ending 2012-2014) and using anaerobic digesters when the existing digester plant capacity is exceeded, which in 2007 was estimated to occur between 2012 and 2015.
The potential gas production of the anaerobic system outlined in the September 2007 report equates to an additional electrical generation potential of around 350 kW (550 kW under future loads projected at the time). This would increase to 1.1 MW were major putrescible wastes in the Nelson/Tasman area (such as apple waste from ENZA, meat waste from Alliance, dairy from Fonterra etc.), used as fuel. The estimated cost of the system in was $7.25 million, based on two biogas generators each rated at 500 kW. Net present value (NPV) calculations done in 2007 projected anaerobic digestion to have an NPV of $7.8 million if future load was taken into account (sewage sludge only i.e. 550 kW electrical generation potential), compared to $7.4 million NPV for the existing aerobic system (based on a 20 year period and an interest rate of 8%, and a rate for electricity sales of 6 ¢/kWh).
The September 2007 report states that “should the average energy cost increase to 7 ¢/kWh, the AD (anaerobic digestion) system would be economic now” (2007) and “within 3 years it is expected the AD system will have the most favourable NPV”. Given these projections, the anaerobic digestion system should be looked into more closely as soon as possible.
• As shown in Section 3.1, the average energy only price for the “ATAD Plant” meter for the year ending May 2013 will be 10.91 ¢/kWh, assuming energy is used evenly throughout each hour (due to the very flat profile of the “ATAD Plant” meter). It is assumed that electricity can be sold back to the grid at 80% of the purchase cost (8.73 ¢/kWh).
The anaerobic digestion system was estimated in the September 2007 report to save $100,000 /year in operating costs, plus the value of the energy sold back to the grid (estimated then to be $250,000 /year at 6 ¢/kWh). The NRSBU Asset Management Plan (2007) states the following: “…consider switching to anaerobic digestion rather than replace the existing tanks and add a fourth train (train D). The capital costs of either option would be similar but the operating cost of anaerobic digestion are considerably less than ATADs (Autothermal Thermophilic Aerobic Digesters) particularly if the biogas is used for co-generation of electricity and heat for pasteurisation in a Temperature Phased Anaerobic Digestion (TPAD) system. An additional electrical cost saving of approximately $95,000 (at $0.06/kWh) would result because the mixing energy required for TPAD is much less than the aeration energy required in the ATADs”.

NRSBU BISTP – Level 2 Energy Audit 32
• The total operating cost of the existing aerobic digesters was assumed to be $138,000 for February 2011 – January 2012 (83% of the consumption of the “ATAD Plant” time-of-use meter). The $100,000 operating cost savings for the anaerobic digestion plant originally projected seem high. We anticipate a 25% saving across the total electricity cost (energy and demand) for the existing aerobic digesters can be saved ($34,500).
• It is assumed the energy generated by the anaerobic digestion design reviewed in September 2007 would be 4,200,000 kWh (based on $250,000/ $0.06 /kWh). At 8.73 ¢/kWh, the savings from energy sold increase to $364,000 / year ($400,000 / year in total).
Implementation
Cost Annual Electricity Savings Cost Savings Payback Period
205,000 kWh (saved) $34,500 N/A 4,200,000 kWh (generated) $364,000 N/A
$7,200,000 ~4,400,000 kWh (total) ~$400,000 18 years
This calculation shows that the Bell Island Sewerage Treatment Plant has the potential to be a net exporter of energy were it to convert from aerobic to anaerobic digesters, as the total annual energy used on site (from February 2011 – January 2012) is only 3,824,100 kWh/year, compared to the 4,400,000 kWh/year that could potentially be generated / saved. Anaerobic digestion can reduce the amount of organic material left over after the wastewater treatment process. However, this has been mitigated at Bell Island by off-setting sludge to Rabbit Island for the encouragement of tree growth. There may a point at which sludge cannot be sent to Rabbit Island. There are two types of processes within anaerobic digestion, “mesophilic” digestion (which operates at 30-40°C) and “thermophilic” digestion (which operates at 50-60°C). Further documentation on these processes can be found in Appendix F1. When selecting between the mesophilic and thermophilic digestion, the gas qualities and gas consistency need to be examined for the effect on the engines.
NRSBU BISTP – Level 2 Energy Audit 33
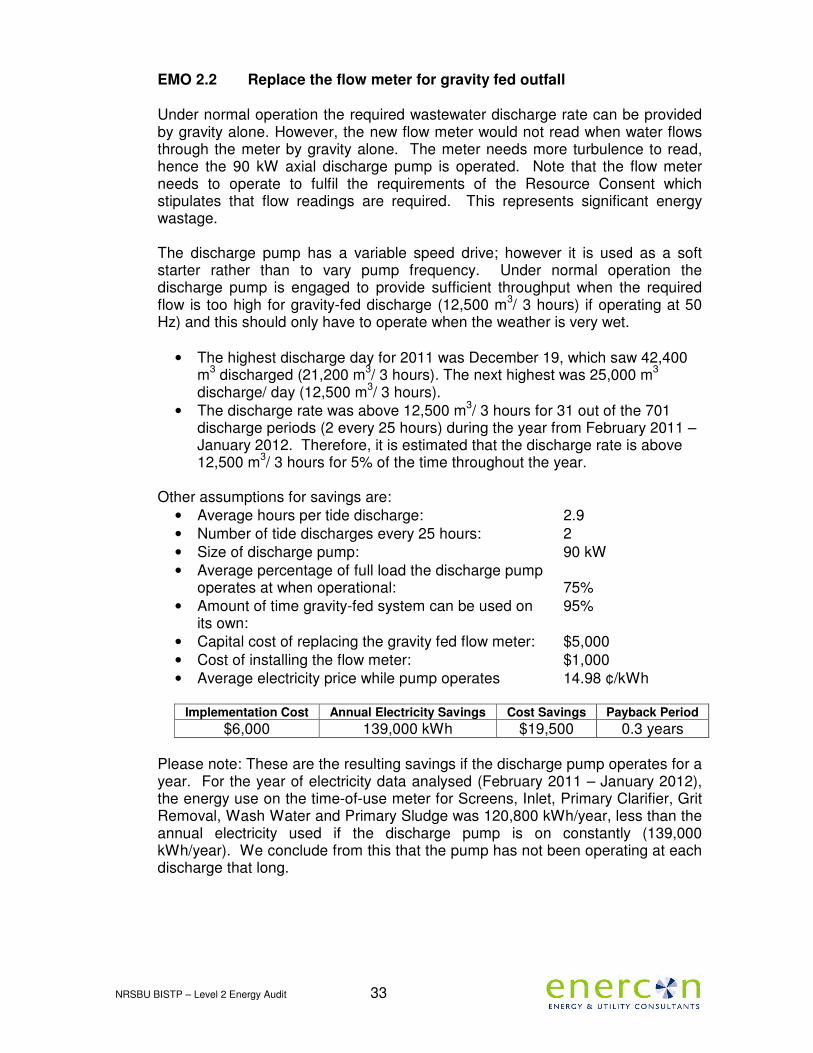
EMO 2.2 Replace the flow meter for gravity fed outfall Under normal operation the required wastewater discharge rate can be provided by gravity alone. However, the new flow meter would not read when water flows through the meter by gravity alone. The meter needs more turbulence to read, hence the 90 kW axial discharge pump is operated. Note that the flow meter needs to operate to fulfil the requirements of the Resource Consent which stipulates that flow readings are required. This represents significant energy wastage.
The discharge pump has a variable speed drive; however it is used as a soft starter rather than to vary pump frequency. Under normal operation the discharge pump is engaged to provide sufficient throughput when the required flow is too high for gravity-fed discharge (12,500 m3/ 3 hours) if operating at 50 Hz) and this should only have to operate when the weather is very wet.
• The highest discharge day for 2011 was December 19, which saw 42,400
m3 discharged (21,200 m3/ 3 hours). The next highest was 25,000 m3 discharge/ day (12,500 m3/ 3 hours).
• The discharge rate was above 12,500 m3/ 3 hours for 31 out of the 701 discharge periods (2 every 25 hours) during the year from February 2011 – January 2012. Therefore, it is estimated that the discharge rate is above 12,500 m3/ 3 hours for 5% of the time throughout the year.
Other assumptions for savings are:
• Average hours per tide discharge: 2.9 • Number of tide discharges every 25 hours: 2 • Size of discharge pump: 90 kW • Average percentage of full load the discharge pump
operates at when operational: 75% • Amount of time gravity-fed system can be used on 95%
its own: • Capital cost of replacing the gravity fed flow meter: $5,000 • Cost of installing the flow meter: $1,000 • Average electricity price while pump operates 14.98 ¢/kWh
Implementation Cost Annual Electricity Savings Cost Savings Payback Period
$6,000 139,000 kWh $19,500 0.3 years
Please note: These are the resulting savings if the discharge pump operates for a year. For the year of electricity data analysed (February 2011 – January 2012), the energy use on the time-of-use meter for Screens, Inlet, Primary Clarifier, Grit Removal, Wash Water and Primary Sludge was 120,800 kWh/year, less than the annual electricity used if the discharge pump is on constantly (139,000 kWh/year). We conclude from this that the pump has not been operating at each discharge that long.

NRSBU BISTP – Level 2 Energy Audit 34
EMO 2.3 Investigate using the Gravity Belt Thickener instead of the Dissolved Air Floatation unit for secondary sludge
During the site visit, it was noted the gravity belt thickener (GBT) could potentially use significantly less energy to perform the same function as the Dissolved Air Floatation unit (DAF) due to much reduced pumping equipment. The waste activated sludge to the DAF was seen to be 4.4 litres / second. The DAF is likely to reduce in use during summer and was seen to operate around 75% of the time in winter. Therefore 4 days a week of DAF operation is assumed for this recommendation.
Based on the equipment count and assumed operation in Appendix C1: Estimated energy use of the DAF per year: 106,400 kWh/year Cost of energy use of the DAF per year: $14,700 /year
Installed power of the GBT pumps: P924: 11 kW (24/4) M919-P03: 2.2 kW (24/7) M917: 1.1 kW (24/7)
Fraction of full load assumed to be used by the GBT if replacing the DAF: M919-P03: 75% (on 24/7) M917: 75% (on 24/7) P924 33% (on 24/4) (P924 is assumed to be on a variable speed drive if replacing the DAF and operating similarly to the DAF pumps, which operate at 5 kW despite having an installed power of 15 kW):
Estimated energy use of the GBT per year: 39,850 kWh/year Cost of energy use of the GBT per year: $5,500 /year.
Therefore, the difference in energy cost is $9,200 / yr. However, the cost of the polymer used to thicken the sludge is high:
The GBT requires 6 kg polymer / m3 dry solids @ $12/kg ($72 kg/m3) The DAF requires 1 kg polymer / m3 dry solids @ $12/kg ($12 kg/m3). Note: This assumes one m3 of solids is approximately one dry tonne. Assumptions for the cost of polymer are: May 2011 – April 2012 DAF sludge output: 4,885 m3 / year % of sludge to the DAF that is dry solids: 0.6 – 1.0
Cost of polymer for gravity belt thickener: $2,100 – $3,500 Cost of polymer for DAF: $300 – $600 Extra cost of polymer: $1,800 – $2,900
Implementation Cost Annual Electricity Savings Cost Savings Payback Period
Needs Further Investigation
66,550 kWh $6,300 - $7,400
Needs Further Investigation

NRSBU BISTP – Level 2 Energy Audit 35
This measure requires further investigation into annual operating costs of the two facilities (as facilities for secondary sludge thickening) and requirements for extra piping for the Gravity Belt Thickener (GBT) were it used to thicken secondary sludge. Currently, the Dissolved Air Floatation unit (DAF) is the only building able to receive sludge from the secondary clarifier. The GBT is currently only set up for primary sludge thickening, which is not required due to the primary sludge being sufficiently thick as it is. Energy cost savings resulting from thickening secondary clarifier sludge at the GBT would most likely be significantly offset by new piping requirements (as the GBT is 30-40 m away from the secondary clarifier).
EMO 2.4 Optimise O2 levels in Aeration Basin
Energy cost for aeration basin: $278,400/year Energy use for aeration basin: 2,015,000 kWh/year Estimated percentage savings: Up to 5%
Implementation Cost Annual Electricity Savings Cost Savings Payback Period
Management Needs further investigation
Needs further
investigation
Needs further investigation
This measure is to be investigated.
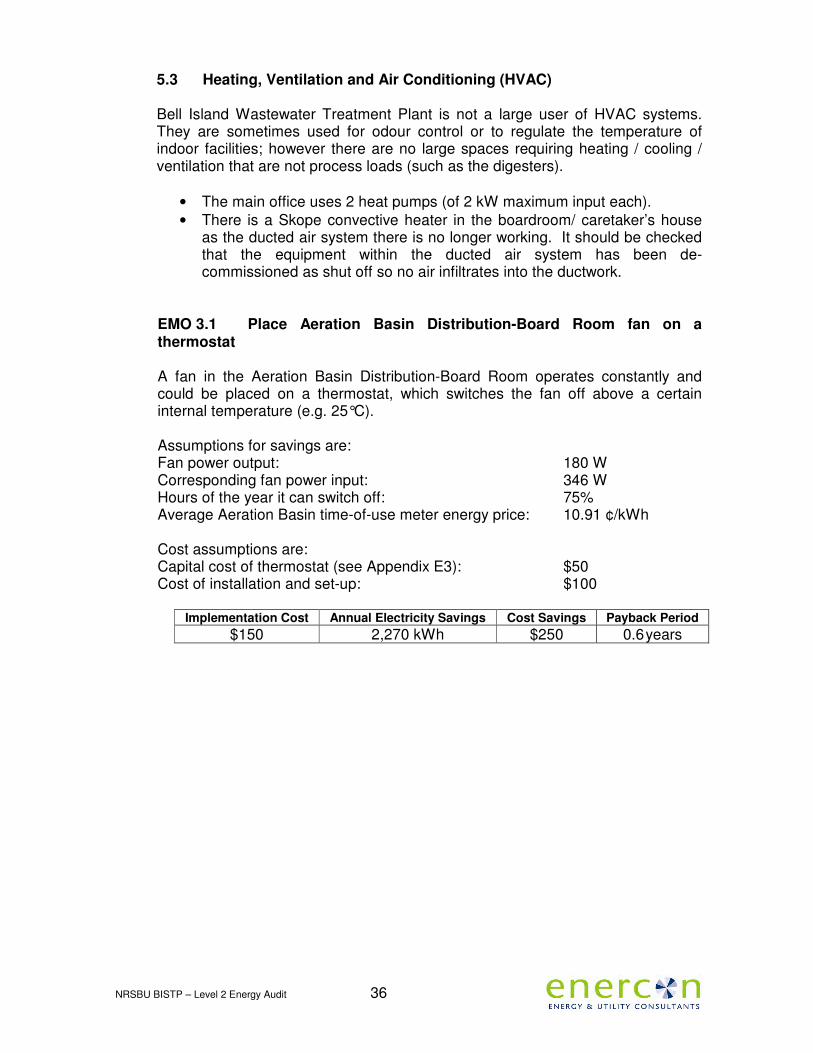
NRSBU BISTP – Level 2 Energy Audit 36
5.3 Heating, Ventilation and Air Conditioning (HVAC)
Bell Island Wastewater Treatment Plant is not a large user of HVAC systems. They are sometimes used for odour control or to regulate the temperature of indoor facilities; however there are no large spaces requiring heating / cooling / ventilation that are not process loads (such as the digesters).
• The main office uses 2 heat pumps (of 2 kW maximum input each). • There is a Skope convective heater in the boardroom/ caretaker’s house
as the ducted air system there is no longer working. It should be checked that the equipment within the ducted air system has been de-commissioned as shut off so no air infiltrates into the ductwork.
EMO 3.1 Place Aeration Basin Distribution-Board Room fan on a thermostat
A fan in the Aeration Basin Distribution-Board Room operates constantly and could be placed on a thermostat, which switches the fan off above a certain internal temperature (e.g. 25°C).
Assumptions for savings are: Fan power output: 180 W Corresponding fan power input: 346 W Hours of the year it can switch off: 75% Average Aeration Basin time-of-use meter energy price: 10.91 ¢/kWh
Cost assumptions are: Capital cost of thermostat (see Appendix E3): $50 Cost of installation and set-up: $100
Implementation Cost Annual Electricity Savings Cost Savings Payback Period
$150 2,270 kWh $250 0.6 years
NRSBU BISTP – Level 2 Energy Audit 37
5.4 Lighting Artificial lighting at Bell Island Sewerage Treatment Plant is provided from a variety of different sources. Tubular T-8 fluorescent lamps are used in high use areas with low ceilings such as offices and some equipment buildings. Tubular fluorescent lighting is the most efficient source of light for these areas. High intensity discharge lamps (high pressure sodium and metal halide) are utilised for external lighting towers. These were not seen to be in use at any point and it is unlikely they are used significantly throughout the year due to the occupancy pattern of the site (i.e. very little occupancy after 4 pm beyond the front office). Occupants are most likely to use flashlights for orientation around site after dark. There are a few incandescent lamps in the caretakers’ house. This is an inefficient form of lighting and should be replaced with compact fluorescents upon replacement. However, they were seen to be in very infrequent use on site, therefore there is no need to replace them immediately due to their insignificant energy use.
During our evening inspection, most external lights were switched off. Work hours are 7 am to 4 pm and a torch is considered sufficient on the occasion when night time tasks are required to be done. The need for security is minimal due to the geographical location of the facility. There were some internal lights seen to be left on during the night inspection. Daytime use in the caretaker’s house was not seen to be high (around 20%); therefore average night-time use is estimated to be similar. Automatic control of lights is not a significant issue at Bell Island Sewerage Treatment Plant as compared with many other sites. This is due to the comparatively small contribution of lighting use to overall energy use, and the relatively diligent manual switching-off of lights by staff. Occupancy sensors were considered for spaces such as the shed in the dewatering building. However, high end ballasts (as opposed to the existing normal electronic ballasts) are required to make the occupancy sensors worthwhile. This is due to the tendency for lamps with normal ballasts to have reduced life-cycle hours with occupancy sensors installed.

NRSBU BISTP – Level 2 Energy Audit 38
EMO 4.1 Switch outside lighting off during the day
The twin lamps outside the office were seen to be on 24 hours a day and were seen to have a daylight sensor that was not working and was positioned into the wall rather than towards the sky. Replacing this daylight sensor will ensure the lights switch off during the day.
Assumptions for savings are: Number of hours/day the lights are able to be switched off: 12 Number of days/year the lights are able to be switched off: 365 Number of lamps: 2 Power usage of each lamp: 150 W Average electricity price for 7 am- 7 pm use 12.10 ¢/kWh
Cost assumptions are: Capital cost of daylight sensor (see Appendix E2): $189 Cost of installation and set-up: $100
Implementation Cost Annual Electricity Savings Cost Savings Payback Period
$290 1,300 kWh $160 2.2 years
The caretaker’s house / boardroom building was also seen to have lights left on at night. These should be manually switched off at 4 pm when facility occupancy ends for the day.
EMO 4.2 Occupancy sense freezer room lights There were four lights on in the freezer room. If these are on for 8 hours a day more than they should be, savings from an occupancy sensor can be calculated as follows.
Assumptions for savings are: Number of hours/day the lights are able to be switched off: 4 Number of days/year the lights are able to be switched off: 365 Number of lamps: 4 Power usage of each lamp: 58 W Average electricity price for weekday daytime use 12.79 ¢/kWh
Cost assumptions are: Capital cost of occupancy sensor (see Appendix E1): $98 Cost of installation and set-up: $50
Implementation Cost Annual Electricity Savings Cost Savings Payback Period
$150 510 kWh $65 2.3 years
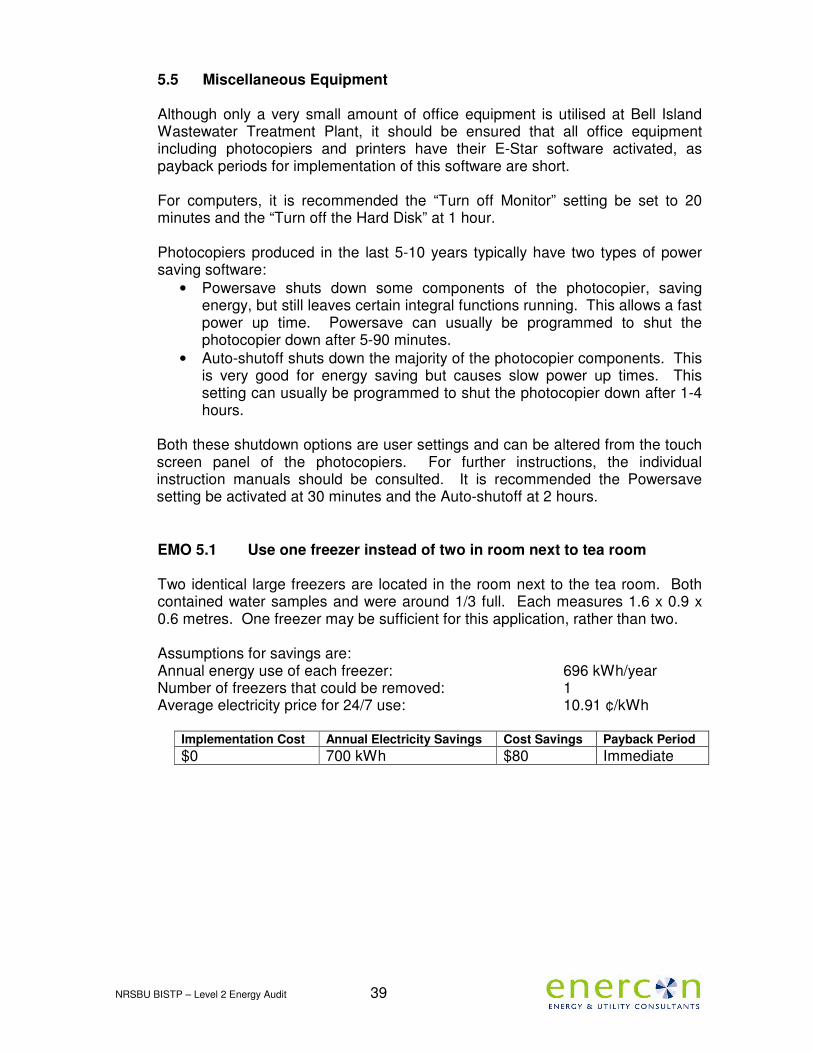
NRSBU BISTP – Level 2 Energy Audit 39
5.5 Miscellaneous Equipment Although only a very small amount of office equipment is utilised at Bell Island Wastewater Treatment Plant, it should be ensured that all office equipment including photocopiers and printers have their E-Star software activated, as payback periods for implementation of this software are short. For computers, it is recommended the “Turn off Monitor” setting be set to 20 minutes and the “Turn off the Hard Disk” at 1 hour. Photocopiers produced in the last 5-10 years typically have two types of power saving software:
• Powersave shuts down some components of the photocopier, saving energy, but still leaves certain integral functions running. This allows a fast power up time. Powersave can usually be programmed to shut the photocopier down after 5-90 minutes.
• Auto-shutoff shuts down the majority of the photocopier components. This is very good for energy saving but causes slow power up times. This setting can usually be programmed to shut the photocopier down after 1-4 hours.
Both these shutdown options are user settings and can be altered from the touch screen panel of the photocopiers. For further instructions, the individual instruction manuals should be consulted. It is recommended the Powersave setting be activated at 30 minutes and the Auto-shutoff at 2 hours. EMO 5.1 Use one freezer instead of two in room next to tea room
Two identical large freezers are located in the room next to the tea room. Both contained water samples and were around 1/3 full. Each measures 1.6 x 0.9 x 0.6 metres. One freezer may be sufficient for this application, rather than two.
Assumptions for savings are: Annual energy use of each freezer: 696 kWh/year Number of freezers that could be removed: 1 Average electricity price for 24/7 use: 10.91 ¢/kWh
Implementation Cost Annual Electricity Savings Cost Savings Payback Period
$0 700 kWh $80 Immediate

NRSBU BISTP – Level 2 Energy Audit
Appendix A – Site Map with Main Process Locations
ATAD
Primary Clarifier
Aeration Basin
Dissolved Air Floatation unit (DAF)
Secondary Clarifier
Gravity Belt Thickener
(GBT)
Inlet / Screen / Grit Removal
MAIN PLANT – SEE BELOW
Outfall
Maturation Ponds
Facultative Ponds

NRSBU BISTP – Level 2 Energy Audit
Appendix B – Typical Electricity Bill B1 Aeration Basin, Dissolved Air Floatation plant, Return Activated Sludge
pumps, Waste Activated Sludge pumps

NRSBU BISTP – Level 2 Energy Audit
B2 Digesters, Secondary Clarifier, Sludge tanks and pumps

NRSBU BISTP – Level 2 Energy Audit
B3 Inlet, Screens, Outfall, Wash water, Primary treatment

NRSBU BISTP – Level 2 Energy Audit
B4 Dewatering Plant and Electrician’s Workshop

NRSBU BISTP – Level 2 Energy Audit
Appendix C – Electricity Meters C1 Aeration Basin, Dissolved Air Floatation plant, Return Activated Sludge
pumps, Waste Activated Sludge pumps
0
50
100
150
200
250
300
350
400
0:00 3:00 6:00 9:00 12:00 15:00 18:00 21:00 0:00
kW
Time of Day
Hourly Average kW: January 2012
Weekday Weekend Average Weekday Average Weekend
0
50
100
150
200
250
300
350
400
0:00 3:00 6:00 9:00 12:00 15:00 18:00 21:00 0:00
kW
Time of Day
Hourly Average kW: April 2012
27-Apr 28-Apr Average Weekday Average Weekend
0
50
100
150
200
250
300
350
400
0:00 3:00 6:00 9:00 12:00 15:00 18:00 21:00 0:00
kW
Time of Day
Hourly Average kW: July 2011
Weekday Weekend Average Weekday Average Weekend
0
50
100
150
200
250
300
350
400
0:00 3:00 6:00 9:00 12:00 15:00 18:00 21:00 0:00
kW
Time of Day
Hourly Average kW: October 2011
Weekday Weekend Average Weekday Average Weekend
0
50,000
100,000
150,000
200,000
250,000
300,000
350,000
Jan
-09
Fe
b-0
9
Ma
r-0
9
Ap
r-0
9
Ma
y-0
9
Jun
-09
Jul-
09
Au
g-0
9
Se
p-0
9
Oct
-09
No
v-0
9
De
c-0
9
Jan
-10
Fe
b-1
0
Ma
r-1
0
Ap
r-1
0
Ma
y-1
0
Jun
-10
Jul-
10
Au
g-1
0
Se
p-1
0
Oct
-10
No
v-1
0
De
c-1
0
Jan
-11
Fe
b-1
1
Ma
r-1
1
Ap
r-1
1
Ma
y-1
1
Jun
-11
Jul-
11
Au
g-1
1
Se
p-1
1
Oct
-11
No
v-1
1
De
c-1
1
Jan
-12
Fe
b-1
2
Ma
r-1
2
Ap
r-1
2
kWh/month

NRSBU BISTP – Level 2 Energy Audit
Item Number
Purpose Power (kW)
Current Reading
(A)
Freq. Reading (Hz)
Control Status Comment
Aeration basin DB A101 Aeration basin 75 Soft Starter On A102 Aeration basin 30 Soft Starter Off Fault A103 Aeration basin 30 Soft Starter On A104 Aeration basin 75 Soft Starter On A105 Aeration basin 30 Soft Starter On A106 Aeration basin 75 Soft Starter Off Fault A118 Aeration basin 75 Soft Starter On P107 Aeration basin 10 50 Soft Starter On SS Off A119 Aeration basin 30 Soft Starter On A120 Aeration basin 75 Soft Starter On A121 Aeration basin 30 Soft Starter Off SS Locked A122 Aeration basin 75 Soft Starter On M108 Aeration basin 22 Soft Starter On M109 Aeration basin 22 Soft Starter Off Fault P501 RAS 1 11 VSD Duty/standby On P502 RAS 2 11 VSD Duty/standby Off M541-P01 RAS VAC PUMP 0.75 WAS Pump 4 VSD On V113 Load gate 7.5 Open Open On manual V114 Sludge gate 7.5 Closed Closed External floodlights Off
Aeration basin VSD readings:
Current Voltage Power Factor Estimated Power 81 A 400 V 0.86 48 kW 62 A 400 V 0.86 37 kW 30 A 400 V 0.86 18 kW 29 A 400 V 0.86 17 kW 38 A 400 V 0.86 23 kW
Though it was not clear which VSD corresponds to which motor, there is clearly a difference in current signifying the 75 kW and 30 kW motors. From this, the average running load of a 75 kW pump is assumed to be 43 kW, and the average running load of a 30 kW pump is assumed to be 19 kW.
Item Number
Purpose Power (kW)
Current Reading (A)
Freq. Reading (Hz)
Control Status Comment
DAF (assumed to run for 4 out of 7 days / week) P521 DAF 15 39 VSD On 5 kW when read P503 DAF 15 38 VSD On 5 kW when read P505 Top of the DAF 0.37 0 60 Soft Starter P506 DAF Feed Flow 2.6 19.6 M520 Underneath the DAF 0.37 Assumed pump position DAF Compressor 7.5 7 M504 DAF 3.0 M525 DAF 0.5 0.4 37 VSD T=13% M537 DAF 1.0 P973 DAF 3.0 0 Off
DAF compressor readings:
Pressure reading Time, Date Status 6.5 bar 10:02:44, 16/5/2012 ON 8.1 bar 10:05:00, 16/5/2012 ON (running unloaded) 6.5 bar 10:07:20 16/5/2012 OFF 6.5 bar 10:08:22, 16/5/2012 ON 8.0 bar 10:09:40, 16/5/2012 ON (running unloaded)
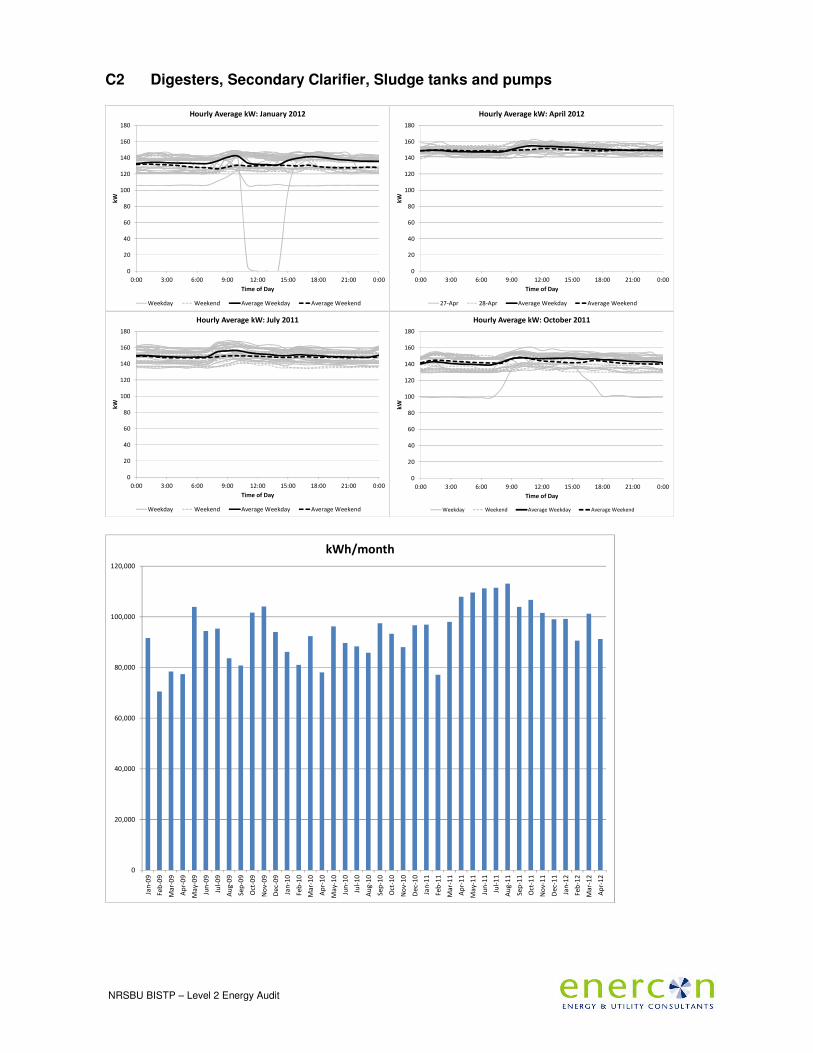
NRSBU BISTP – Level 2 Energy Audit
C2 Digesters, Secondary Clarifier, Sludge tanks and pumps
0
20
40
60
80
100
120
140
160
180
0:00 3:00 6:00 9:00 12:00 15:00 18:00 21:00 0:00
kW
Time of Day
Hourly Average kW: January 2012
Weekday Weekend Average Weekday Average Weekend
0
20
40
60
80
100
120
140
160
180
0:00 3:00 6:00 9:00 12:00 15:00 18:00 21:00 0:00
kW
Time of Day
Hourly Average kW: April 2012
27-Apr 28-Apr Average Weekday Average Weekend
0
20
40
60
80
100
120
140
160
180
0:00 3:00 6:00 9:00 12:00 15:00 18:00 21:00 0:00
kW
Time of Day
Hourly Average kW: July 2011
Weekday Weekend Average Weekday Average Weekend
0
20
40
60
80
100
120
140
160
180
0:00 3:00 6:00 9:00 12:00 15:00 18:00 21:00 0:00
kW
Time of Day
Hourly Average kW: October 2011
Weekday Weekend Average Weekday Average Weekend
0
20,000
40,000
60,000
80,000
100,000
120,000
Jan
-09
Feb
-09
Ma
r-0
9
Ap
r-0
9
Ma
y-0
9
Jun
-09
Jul-
09
Au
g-0
9
Sep
-09
Oct
-09
No
v-0
9
De
c-0
9
Jan
-10
Feb
-10
Ma
r-1
0
Ap
r-1
0
Ma
y-1
0
Jun
-10
Jul-
10
Au
g-1
0
Sep
-10
Oct
-10
No
v-1
0
De
c-1
0
Jan
-11
Feb
-11
Ma
r-1
1
Ap
r-1
1
Ma
y-1
1
Jun
-11
Jul-
11
Au
g-1
1
Sep
-11
Oct
-11
No
v-1
1
De
c-1
1
Jan
-12
Feb
-12
Ma
r-1
2
Ap
r-1
2
kWh/month

NRSBU BISTP – Level 2 Energy Audit
Item Number
Purpose Power (kW)
Current Reading
(A)
Freq. Reading (Hz)
Control Status Comment
“ATAD” Plant
R201 A/B Clarifier Rake Motors 0.75 2.7 24 (T=43%) 0.75 2.7 24 (T=43%) P507 DAF Sludge Pump 7.5 6 Belt driven
P512 NCC Sludge pump 7.5 50
Belt driven. Almost totally off current reading scale (20A)
M201 Mixed Thickened Sludge Storage
8 Auto/Run
P201A ATAD feed pump for Nelson North
7.5 0 PSC
P201B ATAD effluent to Heat Exchange
7.5 0 Not used Off
P202A Supernatant Return Pump A 0 Fault P202B Supernatant Return Pump B 2.5 On A301A A1 ATAD Pump 1 18.5 25 Auto/Run On 120 A scale
A303A A2 ATAD Pump 1 18.5 0 Off Due to repairs on A2
A302A A1 ATAD Waste Pump 2 18.5 25 Auto/Run On 80A scale
A303B A2 ATAD Waste Pump 2 18.5 0 Off Due to repairs on A2
M301À A1 Foam cutter 4.0 3 Auto/Run
M302A A2 Foam cutter 4.0 0 Off Due to repairs on A2
A505A A Train Blower 14.0 0 0 Off Due to repairs on A2
A506A A Train Blower 14.0 22 15 29% Wattage at 22A and 15 Hz
A301C B1 Aerator 36.0 30 Auto/Run On 120 A scale A303C B2 Aerator 36.0 30 Auto/Run On 120 A scale M301B B1 Foam cutter 4.0 3 Auto/Run M302B B2 Foam cutter 4.0 3 Auto/Run A302B C1 Aerator 36.0 35 Auto/Run On 120 A scale A304B C2 Aerator 36.0 28 Auto/run On 120 A scale M301C C1 Foam cutter 4.0 3 Auto/Run M302C C2 Foam cutter 4.0 3 Auto/Run
P302A B1 / C1 Transfer to Bio-solids Storage Tank
2.3 9.5 50 VSD (Duty/Standby)
On
P302B B1 / C1 Transfer to Bio-solids Storage Tank
2.3 9.5 50 VSD (Duty/Standby)
Off
P301A ATAD Discharge Pump A 2.0 Duty/Standby P301B ATAD Discharge Pump B 1.4 Duty/Standby
M303 Mixer – Bio-solids Storage Tank
7.5 Auto/Run
Bio-solids to Heat exchanger 7.5 Not used Off Bio-solids to Rabbit Island 15.0 Duty/Standby On Bio-solids to Rabbit Island 15.0 Duty/Standby Off

NRSBU BISTP – Level 2 Energy Audit
C3 Inlet, Screens, Outfall, Wash water, Primary treatment
0
5
10
15
20
25
0:00 3:00 6:00 9:00 12:00 15:00 18:00 21:00 0:00
kW
Time of Day
Hourly Average kW: January 2012
Weekday Weekend Average Weekday Average Weekend
0
5
10
15
20
25
0:00 3:00 6:00 9:00 12:00 15:00 18:00 21:00 0:00
kW
Time of Day
Hourly Average kW: April 2012
27-Apr 28-Apr Average Weekday Average Weekend
0
5
10
15
20
25
0:00 3:00 6:00 9:00 12:00 15:00 18:00 21:00 0:00
kW
Time of Day
Hourly Average kW: July 2011
Weekday Weekend Average Weekday Average Weekend
0
5
10
15
20
25
0:00 3:00 6:00 9:00 12:00 15:00 18:00 21:00 0:00
kW
Time of Day
Hourly Average kW: October 2011
Weekday Weekend Average Weekday Average Weekend
0
2,000
4,000
6,000
8,000
10,000
12,000
14,000
16,000
18,000
Jan
-09
Feb
-09
Ma
r-0
9
Ap
r-0
9
Ma
y-0
9
Jun
-09
Jul-
09
Au
g-0
9
Sep
-09
Oct
-09
No
v-0
9
De
c-0
9
Jan
-10
Feb
-10
Ma
r-1
0
Ap
r-1
0
Ma
y-1
0
Jun
-10
Jul-
10
Au
g-1
0
Sep
-10
Oct
-10
No
v-1
0
De
c-1
0
Jan
-11
Feb
-11
Ma
r-1
1
Ap
r-1
1
Ma
y-1
1
Jun
-11
Jul-
11
Au
g-1
1
Sep
-11
Oct
-11
No
v-1
1
De
c-1
1
Jan
-12
Feb
-12
Ma
r-1
2
Ap
r-1
2
kWh/month

NRSBU BISTP – Level 2 Energy Audit
Item Number
Purpose Power (kW)
Current Reading
(A)
Freq. Reading (Hz)
Control Status Comment
Preliminary/Primary Treatment: Primary Screen 5.5 Secondary Screen 2.2
P522 Classifier Screw / Poly screw 5.5 39 VSD Off
Runs 5 minutes out of 20. Status and frequency are for poly screw.
Bio-filter 4
Grit arrester motor 7.5 On occasionally. Appears to operate on level signal
P410 Grit Pump 0 57 Off Unclear which grit pump this is for
Grit arrester pump 1.1 Grit classifier 1.1 Grit classifier pumps 0.75 0.75 P1 Wash water pump 2.2 Duty P2 Wash water pump 4 Standby P3 Wash water pump 2.2 Standby
Storm-water pump 0 Shows good practice
Discharge pump 90 VSD
P629/630 Primary Clarifier Scraper 1.7 25 VSD Manual On manual so will likely stay at 1.7 A for long periods
P607 Scum Tank North (T610) 4.9 P612 Scum Tank South (T615) 4.9 P624 Primary Sludge Pump 18.5 0 30 Duty/standby Off P618 Primary Sludge Pump 18.5 0 30 Duty/standby Off
C4 Dewatering plant and Electricians workshop
Item Number
Purpose Power (kW)
Current Reading (A)
Freq. Reading (Hz)
Control Status Comment
M917 Dewatering 1.1 SD45008 M919-P03 Dewatering 2.2 P924 Dewatering 11 SD45524

NRSBU BISTP – Level 2 Energy Audit
Appendix D – Power Factor Readings D1 Aeration Basin, Dissolved Air Floatation plant, Return Activated Sludge
pumps, Waste Activated Sludge pumps
0
0.1
0.2
0.3
0.4
0.5
0.6
0.7
0.8
0.9
1
01
/01
/09
01
/07
/09
01
/01
/10
01
/07
/10
01
/01
/11
01
/07
/11
01
/01
/12
Po
we
r Fa
cto
r
Aeration Basin etc. Power Factor - Jan 2009 - April 2012
D2 Digesters, Secondary Clarifier, Sludge tanks and pumps
0
0.1
0.2
0.3
0.4
0.5
0.6
0.7
0.8
0.9
1
01
/01
/09
01
/07
/09
01
/01
/10
01
/07
/10
01
/01
/11
01
/07
/11
01
/01
/12
Po
we
r Fa
cto
r
ATAD etc. Power Factor - Jan 2009 - April 2012
D3 Inlet, Screens, Outfall, Wash water, Primary treatment
0
0.1
0.2
0.3
0.4
0.5
0.6
0.7
0.8
0.9
1
01
/01
/09
01
/07
/09
01
/01
/10
01
/07
/10
01
/01
/11
01
/07
/11
01
/01
/12
Po
we
r Fa
cto
r
Inlet, Outfall etc. Power Factor - Jan 2009 - April 2012

NRSBU BISTP – Level 2 Energy Audit
Appendix E – Quotes E1 Occupancy sensors – Internal

NRSBU BISTP – Level 2 Energy Audit
E2 Daylight sensors

NRSBU BISTP – Level 2 Energy Audit
E3 Thermostat

NRSBU BISTP – Level 2 Energy Audit
Appendix F – Technical Resources F1 Anaerobic Digestion From: http://www.esru.strath.ac.uk/EandE/Web_sites/03-04/biomass/background%20info8.html
In an anaerobic digestion plant, there are two types of AD process:
• Mesophilic digestion
• Thermophilic digestion (50-60°C)
Mesophilic Digestion Mesophilic digestion is the most commonly used process for anaerobic digestion, in particular waste sludge treatment. Decomposition of the volatile suspended solids (VSS) is around 40% over a retention time of 15 to 40 days at a temperature of 30 to 40oC, which requires larger digestion tanks. It is usually more robust than the thermophilic process, but the biogas production tends to be less, and additional sanitisation is usually required. Thermophilic Digestion
Thermophilic digestion is less common and not as mature a technology as mesophilic digestion. The digester is heated to 55oC and held for a period of 12 to 14 days.
Thermophilic digestion systems provides higher biogas production, faster throughput and an improved pathogen and virus ‘kill’, but the technology is more expensive, more energy is needed and it is necessary to have more sophisticated control & instrumentation.
The two conventional operational temperature levels for anaerobic digesters are determined by the species of methanogens in the digesters:
• Mesophilic digestion takes place optimally around 30 to 38 °C, or at ambient temperatures between 20 and 45 °C, where mesophiles are the primary microorganism present.
• Thermophilic digestion takes place optimally around 49 to 57 °C, or at elevated temperatures up to 70 °C, where thermophiles are the primary microorganisms present.
• Mesophilic species outnumber thermophiles, and they are also more tolerant to changes in environmental conditions than thermophiles. Mesophilic systems are, therefore, considered to be more stable than thermophilic digestion systems.
• Though thermophilic digestion systems are considered to be less stable and the energy input is higher, more energy is removed from the organic matter. The increased temperatures facilitate faster reaction rates and, hence, faster gas yields.

NRSBU BISTP – Level 2 Energy Audit
F2 Trickling Filters From: http://en.wikipedia.org/wiki/File:Trickle_Filter.svg
All sewage trickling filter systems share the same fundamental components:
• A septic tank for fermentation and primary settling of solids • A filter medium upon which beneficial microbes (biomass, biofilm) are promoted
and developed • A container which houses the filter medium • A distribution system for applying wastewater to be treated to the filter medium • A distribution system for disposal of the treated effluent or percolation ponds.
From: http://www.bluevistaengineering.com/wastewater101.html In the Trickling Filter Process, the wastewater is spread over the microorganisms and is allowed to "trickle down" through the microorganism-covered media. A trickling filter is a secondary treatment process, and therefore follows primary treatment. Primary treatment removes settleable and floatable solids; so by the time the wastewater reaches the trickling filter it contains mostly colloidal and dissolved solids. The purpose of the trickling filter is to remove these colloidal and dissolved solids through the aerobic biological decomposition process. From: http://water.me.vccs.edu/courses/ENV149/trickling.htm With proper loadings the low-rate trickling filter, including primary and secondary sedimentation units, should remove from 80 to 85% of the applied BOD.