@let@token what we learned (and how it's all...
TRANSCRIPT

What we learned(and how it’s all connected)
Eli Gurarie
Stat 311 - Lecture 25University of Washington - Seattle
March 15, 2013
1 / 1

From Lecture 1: Broad outline of course
1 Descriptive statistics:
visualizations and statistical summaries and experimental Design.
2 Probability theory
random processes and distributions and Central Limit Theorem.
3 Inference statistics:
Parameter estimates, hypothesis testing, and modeling.
2 / 1

From Lecture 1: Basic definitions
The research question.
A population is the collection of all possible individuals of interest.
A sample is a subset of the population.
An individual (or experimental unit) is an object on which observationsare made.
A variable is any quantity that can be measured on an individual.
A dependent or response variable the focus of our researchquestion, or very closely linked to itAn independent variable or covariate or explanatory factor is anadditional factor we consider for explaining the response
3 / 1

From Lecture 1: Basic definitions
The research question.
A population is the collection of all possible individuals of interest.
A sample is a subset of the population.
An individual (or experimental unit) is an object on which observationsare made.
A variable is any quantity that can be measured on an individual.
A dependent or response variable the focus of our researchquestion, or very closely linked to it
An independent variable or covariate or explanatory factor is anadditional factor we consider for explaining the response
3 / 1

From Lecture 1: Basic definitions
The research question.
A population is the collection of all possible individuals of interest.
A sample is a subset of the population.
An individual (or experimental unit) is an object on which observationsare made.
A variable is any quantity that can be measured on an individual.
A dependent or response variable the focus of our researchquestion, or very closely linked to itAn independent variable or covariate or explanatory factor is anadditional factor we consider for explaining the response
3 / 1

From Lecture 1: Basic definitions
The research question.
A population is the collection of all possible individuals of interest.
A sample is a subset of the population.
An individual (or experimental unit) is an object on which observationsare made.
A variable is any quantity that can be measured on an individual.
A dependent or response variable the focus of our researchquestion, or very closely linked to itAn independent variable or covariate or explanatory factor is anadditional factor we consider for explaining the response
3 / 1

Descriptive statistics
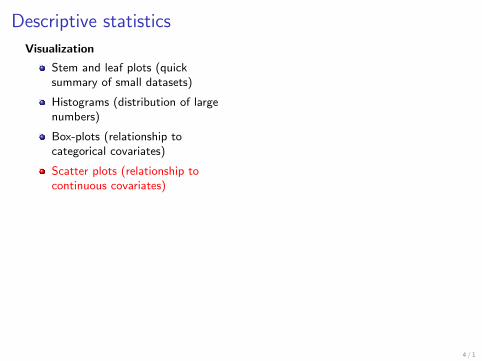
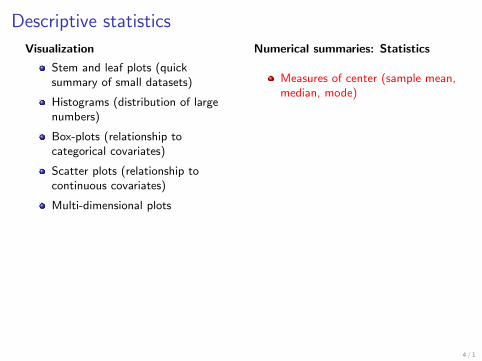
Visualization
Stem and leaf plots (quicksummary of small datasets)
Histograms (distribution of largenumbers)
Box-plots (relationship tocategorical covariates)
Scatter plots (relationship tocontinuous covariates)
Multi-dimensional plots
Numerical summaries: Statistics
Measures of center (sample mean,median, mode)
Measures of spread (samplestandard deviation, variance)
Measures of weirdness (skewness,outliers)
Describing relationships betweencontinuous covariates variables:
Correlations coefficientCoefficient of determinationSlope / Intercept estimates
Sums of squares:
of Model/Group(SSM/G )of Error/Residual(SSE/R)of Total variation (SST )
4 / 1

Descriptive statistics
Visualization
Stem and leaf plots (quicksummary of small datasets)
Histograms (distribution of largenumbers)
Box-plots (relationship tocategorical covariates)
Scatter plots (relationship tocontinuous covariates)
Multi-dimensional plots
Numerical summaries: Statistics
Measures of center (sample mean,median, mode)
Measures of spread (samplestandard deviation, variance)
Measures of weirdness (skewness,outliers)
Describing relationships betweencontinuous covariates variables:
Correlations coefficientCoefficient of determinationSlope / Intercept estimates
Sums of squares:
of Model/Group(SSM/G )of Error/Residual(SSE/R)of Total variation (SST )
4 / 1

Experimental Design
Causality vs. Correlation
Precision vs. Accuracy (Bias, sample size)
Observational vs. Experimental studies
Randomization
Treatments
Control groups
Stratification / Blocking
Blinding
Balanced vs. Unbalanced design
Placebo
Replication
Confounding variables
5 / 1

Experimental Design
Causality vs. Correlation
Precision vs. Accuracy (Bias, sample size)
Observational vs. Experimental studies
Randomization
Treatments
Control groups
Stratification / Blocking
Blinding
Balanced vs. Unbalanced design
Placebo
Replication
Confounding variables
5 / 1

Experimental Design
Causality vs. Correlation
Precision vs. Accuracy (Bias, sample size)
Observational vs. Experimental studies
Randomization
Treatments
Control groups
Stratification / Blocking
Blinding
Balanced vs. Unbalanced design
Placebo
Replication
Confounding variables
5 / 1

Experimental Design
Causality vs. Correlation
Precision vs. Accuracy (Bias, sample size)
Observational vs. Experimental studies
Randomization
Treatments
Control groups
Stratification / Blocking
Blinding
Balanced vs. Unbalanced design
Placebo
Replication
Confounding variables
5 / 1

Experimental Design
Causality vs. Correlation
Precision vs. Accuracy (Bias, sample size)
Observational vs. Experimental studies
Randomization
Treatments
Control groups
Stratification / Blocking
Blinding
Balanced vs. Unbalanced design
Placebo
Replication
Confounding variables
5 / 1

Experimental Design
Causality vs. Correlation
Precision vs. Accuracy (Bias, sample size)
Observational vs. Experimental studies
Randomization
Treatments
Control groups
Stratification / Blocking
Blinding
Balanced vs. Unbalanced design
Placebo
Replication
Confounding variables
5 / 1

Experimental Design
Causality vs. Correlation
Precision vs. Accuracy (Bias, sample size)
Observational vs. Experimental studies
Randomization
Treatments
Control groups
Stratification / Blocking
Blinding
Balanced vs. Unbalanced design
Placebo
Replication
Confounding variables
5 / 1

Experimental Design
Causality vs. Correlation
Precision vs. Accuracy (Bias, sample size)
Observational vs. Experimental studies
Randomization
Treatments
Control groups
Stratification / Blocking
Blinding
Balanced vs. Unbalanced design
Placebo
Replication
Confounding variables
5 / 1

Experimental Design
Causality vs. Correlation
Precision vs. Accuracy (Bias, sample size)
Observational vs. Experimental studies
Randomization
Treatments
Control groups
Stratification / Blocking
Blinding
Balanced vs. Unbalanced design
Placebo
Replication
Confounding variables
5 / 1

Experimental Design
Causality vs. Correlation
Precision vs. Accuracy (Bias, sample size)
Observational vs. Experimental studies
Randomization
Treatments
Control groups
Stratification / Blocking
Blinding
Balanced vs. Unbalanced design
Placebo
Replication
Confounding variables
5 / 1

Experimental Design
Causality vs. Correlation
Precision vs. Accuracy (Bias, sample size)
Observational vs. Experimental studies
Randomization
Treatments
Control groups
Stratification / Blocking
Blinding
Balanced vs. Unbalanced design
Placebo
Replication
Confounding variables
5 / 1

Experimental Design
Causality vs. Correlation
Precision vs. Accuracy (Bias, sample size)
Observational vs. Experimental studies
Randomization
Treatments
Control groups
Stratification / Blocking
Blinding
Balanced vs. Unbalanced design
Placebo
Replication
Confounding variables
5 / 1

Experimental Design
Causality vs. Correlation
Precision vs. Accuracy (Bias, sample size)
Observational vs. Experimental studies
Randomization
Treatments
Control groups
Stratification / Blocking
Blinding
Balanced vs. Unbalanced design
Placebo
Replication
Confounding variables
5 / 1

From Lecture 9: Experiments can be very powerful!
Experiments
Are your best chance to test causal relationships
Good experimental design can be very tricky.
Controlling for all confounding or lurkingvariables is hard.But there are some design choices andtechniques (randomization, stratification,blocking, balance, blinding) that help thedata you collect answer the questions you areasking
If the design is good - then the analysis is trivial!
6 / 1

Lecture 10: Observational Studies Can Be TrickyEmage 1: 12/25/1996
estimate: 453K, CI: 181 − 3715K
Density (n/km^2)
124
81632
Ice Concentration
02040
6080100
50 100 150 200 250
0.5
2.0
5.0
20.0
100.
0
1
Distance to Ice Edge (km)
dens
0 50 100 150
0.5
1.0
2.0
5.0
10.0
50.0
2a
Distance to Ice Edge (km)
dens
0 20 40 60 80 120
0.5
2.0
5.0
20.0
100.
0
2b
Distance to Ice Edge (km)
dens
10 20 30 40 50 60
110
010
000
3
Distance to Ice Edge (km)
dens
0 50 100 150
12
510
2050
100
4
Distance to Ice Edge (km)
dens
0 50 100 200 300
0.5
2.0
5.0
20.0
100.
050
0.0
5a
Distance to Ice Edge (km)
dens
50 100 150 200 250
12
510
2050
100
5b
Distance to Ice Edge (km)
dens
lm(Dt ∼ OnShelf * (IC.r + IC + IC2) * (DIce.r + DIce + DIce2) - 1)
height Df Sum Sq Mean Sq F value Pr(>F)
OnShelf 2 195.80 97.90 4898.23 0.0000 ***IC.r 1 0.42 0.42 21.18 0.0000 ***IC 1 0.05 0.05 2.31 0.1291IC2 1 0.03 0.03 1.33 0.2488DIce.r 1 0.01 0.01 0.52 0.4722DIce 1 0.05 0.05 2.51 0.1140DIce2 1 1.52 1.52 75.97 0.0000 ***OnShelf:IC.r 1 0.02 0.02 1.24 0.2672OnShelf:IC 1 0.00 0.00 0.00 0.9592OnShelf:IC2 1 0.01 0.01 0.27 0.6024OnShelf:DIce.r 1 0.08 0.08 4.02 0.0458 *OnShelf:DIce 1 0.00 0.00 0.00 0.9907OnShelf:DIce2 1 0.01 0.01 0.57 0.4500IC.r:DIce.r 1 0.01 0.01 0.37 0.5409IC.r:DIce 1 0.01 0.01 0.52 0.4707IC.r:DIce2 1 0.00 0.00 0.17 0.6798IC:DIce.r 1 0.11 0.11 5.34 0.0214 *IC:DIce 1 0.00 0.00 0.24 0.6251IC:DIce2 1 0.01 0.01 0.33 0.5665IC2:DIce.r 1 0.09 0.09 4.69 0.0311 *IC2:DIce 1 0.00 0.00 0.03 0.8676IC2:DIce2 1 0.00 0.00 0.01 0.9202OnShelf:IC.r:DIce.r 1 0.05 0.05 2.74 0.0987 ·OnShelf:IC.r:DIce 1 0.05 0.05 2.34 0.1271OnShelf:IC.r:DIce2 1 0.18 0.18 8.79 0.0032 **OnShelf:IC:DIce.r 1 0.02 0.02 0.92 0.3391OnShelf:IC:DIce 1 0.00 0.00 0.05 0.8193OnShelf:IC:DIce2 1 0.00 0.00 0.12 0.7286OnShelf:IC2:DIce.r 1 0.07 0.07 3.46 0.0635 ·OnShelf:IC2:DIce 1 0.00 0.00 0.07 0.7884OnShelf:IC2:DIce2 1 0.04 0.04 2.02 0.1559Residuals 343 6.86 0.02
7 / 1

Probability Theory
Random variables
Parameters
Discrete distributions:
probability mass functions (pdf)Bernoulli, Binomial, relationships between them
Continuous distributions
Probability density functions (pdf)Normal/Gaussian, Uniform, T-distribution, F-distribution
Expectations / Variances
Central limit theorem
8 / 1

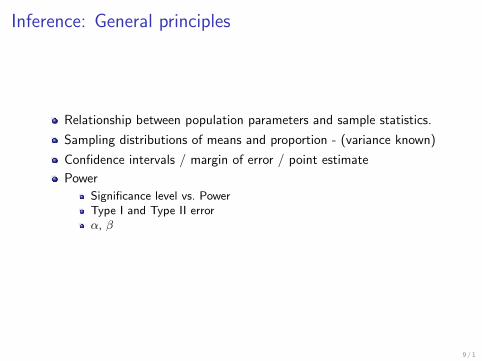
Inference: General principles
Relationship between population parameters and sample statistics.
Sampling distributions of means and proportion - (variance known)
Confidence intervals / margin of error / point estimate
Power
Significance level vs. PowerType I and Type II errorα, β
9 / 1

Inference: General principles
Relationship between population parameters and sample statistics.
Sampling distributions of means and proportion - (variance known)
Confidence intervals / margin of error / point estimate
Power
Significance level vs. PowerType I and Type II errorα, β
9 / 1

Inference: General principles
Relationship between population parameters and sample statistics.
Sampling distributions of means and proportion - (variance known)
Confidence intervals / margin of error / point estimate
Power
Significance level vs. PowerType I and Type II errorα, β
9 / 1

Inference: General principles
Relationship between population parameters and sample statistics.
Sampling distributions of means and proportion - (variance known)
Confidence intervals / margin of error / point estimate
Power
Significance level vs. PowerType I and Type II errorα, β
9 / 1
Inference: General principles
Relationship between population parameters and sample statistics.
Sampling distributions of means and proportion - (variance known)
Confidence intervals / margin of error / point estimate
Power
Significance level vs. PowerType I and Type II errorα, β
9 / 1

10 / 1

Sampling distribution - under H0 and HA
X ∼ N(µA,σA√n)
0 1 2 3 4 5 6 7
0.0
0.2
0.4
0.6
0.8
x
f1 (
x)
n = 4 X = 2.82
0 1 2 3 4 5 6 7
0.0
0.4
0.8
x
f1 (
x)
n = 8 X = 2.58
0 1 2 3 4 5 6 7
0.0
0.5
1.0
1.5
x
f1 (
x)
n = 16 X = 2.41
β = 12% β = 2.2% β = 0.07%
11 / 1

Back in Lecture 20: What we’ve done so far...
We started with the coinflip
... derived the binomialdistribution
... obtained the CentralLimit Theorem
... calculated the sampling distribution ofthe mean: X ∼ N(µ, σ√
n) ... and developed the machinery of
hypothesis tests.
This is a big piece of classical statistics... and the best part is we derived(almost) all of the math behind it from “scratch”!
12 / 1

Inference: Specifics
Sampling distribution of mean or proportion
σ known, large sample size, proportion
Z-test of means and difference of means and proportions
T-statistic (σ unknown)
T-tests of means and difference of means
Equal/unequal standard deviationEqual/unequal sample sizes
F-tests for ratios of variance estimates
13 / 1


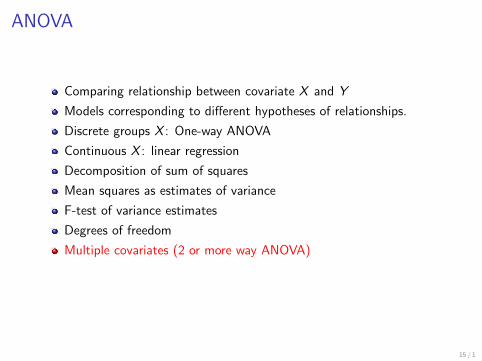
ANOVA
Comparing relationship between covariate X and Y
Models corresponding to different hypotheses of relationships.
Discrete groups X : One-way ANOVA
Continuous X : linear regression
Decomposition of sum of squares
Mean squares as estimates of variance
F-test of variance estimates
Degrees of freedom
Multiple covariates (2 or more way ANOVA)
Model selection
15 / 1

Statistics ...
16 / 1

Statistics ...
Good luck!
16 / 1