lessons learned from deploying splunk uba
TRANSCRIPT

© 2 0 1 9 S P L U N K I N C .
Teresa ChilaCybersecurity Data Scientist | Chevron
Lessons Learned from Deploying Splunk UBA
Maria SanchezTechnical Support Engineer | Splunk
This document is intended only for use by Chevron for presentation at .conf2019 and inclusion by Splunk on a conference website that is
available to the public. No portion of this document may be copied, displayed, distributed, reproduced, published, sold, licensed, downloaded, or used to create a derivative work, unless the use has been specifically authorized by Chevron in writing.

© 2 0 1 9 S P L U N K I N C .
Cybersecurity Data Scientist | Chevron
Teresa ChilaTechnical Support Engineer | Splunk
Maria Sanchez

During the course of this presentation, we may make forward‐lookingstatements regarding
future events or plans of the company. We caution you that such statements reflect our
current expectations and estimates based on factors currently known to us and that actual
events or results may differ materially. The forward-lookingstatements made in the this
presentation are being made as of the time and date of its live presentation. If reviewed after
its live presentation, it may not contain current or accurate information. We do not assume
any obligation to update any forward‐lookingstatements made herein.
In addition, any information about our roadmap outlines our general product direction and is
subject to change at any time without notice. It is for informational purposes only, and shall
not be incorporated into any contract or other commitment.Splunk undertakes no obligation
either to develop the features or functionalities described or to include any such feature or
functionality in a future release.
Splunk, Splunk>, Turn Data Into Doing, The Engine for Machine Data, Splunk Cloud, Splunk
Light and SPL are trademarks and registered trademarks of Splunk Inc. in the United States
and other countries. All other brand names, product names, or trademarks belong to their
respective owners. © 2019 Splunk Inc. All rights reserved.
Forward-LookingStatements
© 2 0 1 9 S P L U N K I N C .

© 2 0 1 9 S P L U N K I N C .
Basically, Teresa opened a lot of support tickets and Maria resolved them all. That’s
how this presentation came about
Maria
UBA Team
Splunk
UBATeresa
© 2 0 1 9 S P L U N K I N C .
1. Intro
2. About Splunk User Behavioral Analytics (UBA)
3. Why UBA at Chevron
4. Top 10 lessons learned at Chevron while deploying UBA
5. Q&A
Agenda

© 2 0 1 9 S P L U N K I N C .
Intro

© 2 0 1 9 S P L U N K I N C .
Teresa• Studied Electrical and Computer
Engineering
• Data Scientist in the Cyber Intelligence
Center in Chevron
• Over 20 years of experience in
software development, security
technologies, and data analytics
• Native from Hong Kong and enjoys
travelling around the world

© 2 0 1 9 S P L U N K I N C .
Chevron Corporation
One of the world’s leading integrated energy companies
Upstream: exploration and production
Downstream & Chemicals: refine & distribute
Midstream: safe movement of products
Headquarters in San Ramon, CA
Substantial business activities in over 20+ countries with over 45K employees
140 years of human progress

© 2 0 1 9 S P L U N K I N C .
Maria• Studied Systems Engineering
• Over 15 years of experience
supporting enterprise software
• Splunker for 4 years, supporting UBA
• Based out of San Jose, CA
• From Colombia, loves spending time at
the beach with her dogs, gardening
and enjoying nature

© 2 0 1 9 S P L U N K I N C .
About Splunk UBA

© 2 0 1 9 S P L U N K I N C .
What is Splunk UBA?Splunk UBA is an out-of-the-box solution that helps organizations find known, unknown, and hidden threats using data science, machine learning, behavior baseline, and peer group analytics

© 2 0 1 9 S P L U N K I N C .
Splunk UBA Fundamentals
Real-Time & Big
Data Architecture
Behavior Baseline
& Modelling
Unsupervised
Machine Learning
Anomaly
Detection
Threat
Detection

© 2 0 1 9 S P L U N K I N C .
How Does Splunk UBA Work?Multi-pass Machine Learning
• 165+ Detections
• 60+ Anomaly Types
• IOCs
• Contextual Intelligence
• Entity Scoring
25+ Threat Types
7 Use Cases
• Account Misused
• Compromised User Account
• Compromised/Infected Machine
• Data Exfiltration
• External Attack
• Lateral Movement
• Suspicious Behavior/Unknown Threat
Raw Events
Kill-chain Analysis
15 Signatures(Threat Rules)
Graph Analysis
Specialized Threat Models
55+ Signatures(Anomaly Rules)
60+ Batch/Offline Models
15+ Streaming Models
Threat DetectionsAnomaly Detections
Behavior ModelsBehavior Models
Aggregated
Events

© 2 0 1 9 S P L U N K I N C .
Network Activity
Application Activity
Login Attempts
Removable Media
Badge Scans
Printer Activity
User’s activity
Departmental activity
Region’s activity
Company’s activity
Data Analyzed Baselining
(and more…)
Threat Score: 8
4Threat Score:
> > Advanced Threat Detection
Examples:
• Data Exfiltration by Suspicious User or Device
• Data Storage Attached by Unusual Number of Times
• Unusual Printer Usage
• Privilege Escalation
• Multiple Failed Login Attempts
• Malware
• Blacklisted IP Address
• Compromised Account
Splunk UBA Workflow Powered by Big Data and Machine Learning

© 2 0 1 9 S P L U N K I N C .
Splunk UBA Entities
Threats
Anomalies
Users
Devices
Apps
• Each of these has a score
• Additional contextual
Information/feedback can
be added

© 2 0 1 9 S P L U N K I N C .
Why UBA at Chevron?

© 2 0 1 9 S P L U N K I N C .
Why UBA at Chevron?
Augment our threat detection with advanced analytics
Prioritize by aggregating anomalies into threats
Accelerate our capability via buying instead of building
Integrate with our Core Splunk environment

© 2 0 1 9 S P L U N K I N C .
How has UBA helped so far?
Increase network visibility
Large collection of detections out
of the box
Readily available for
quickly creating behavioral
models
Integrate with Enterprise Security to
provide a single pane of glass
Provide additional
context that helps surface
cases

© 2 0 1 9 S P L U N K I N C .
Lessons Learned

© 2 0 1 9 S P L U N K I N C .
Have Free Disk Space
Follow the hardware spec. Spec asked for 50GB for “/” drive
• We got 30GB
Not a problem at first, but after 3 or 4 weeks, rare things started to happen (models failing, not ingesting data, etc.)
• Disks > 95% full
• Clearing up disk space resolved the issue
• Models need disk space to offload memory
Now have a maintenance script to rotate/archive log files to help maintain a healthy
amount of free disk space
1

© 2 0 1 9 S P L U N K I N C .
Splunk UBA Hardware Requirements
CPUs: 16 cores
Memory: 64 GB RAM
Storage: Three disks - 1200 IOPS
• Disk 1 - 50GB disk space for the Splunk UBA installation
• Disk 2 - 1TB additional disk space for metadata storage
• Disk 3 - 1TB additional disk space for each Spark node
© 2 0 1 9 S P L U N K I N C .
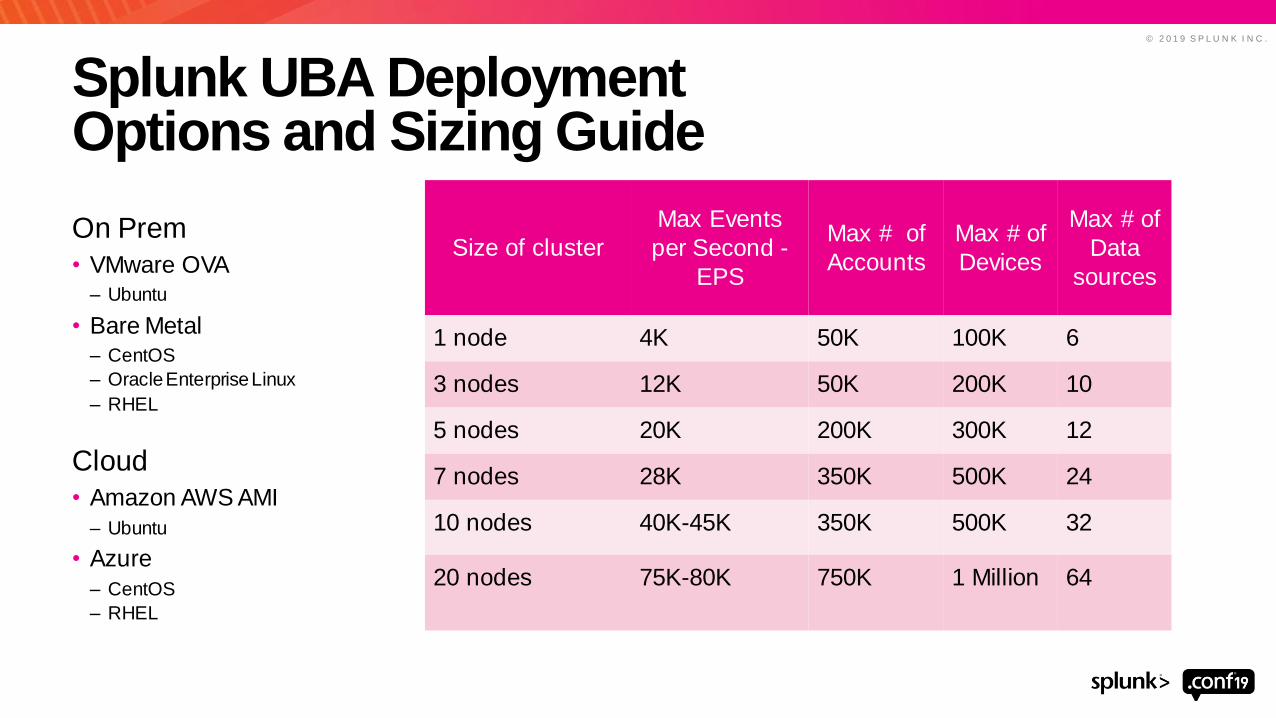
Splunk UBA Deployment Options and Sizing Guide
On Prem
• VMware OVA – Ubuntu
• Bare Metal– CentOS
– Oracle Enterprise Linux
– RHEL
Cloud
• Amazon AWS AMI
– Ubuntu
• Azure
– CentOS
– RHEL
Size of cluster
Max Events
per Second -
EPS
Max # of
Accounts
Max # of
Devices
Max # of
Data
sources
1 node 4K 50K 100K 6
3 nodes 12K 50K 200K 10
5 nodes 20K 200K 300K 12
7 nodes 28K 350K 500K 24
10 nodes 40K-45K 350K 500K 32
20 nodes 75K-80K 750K 1 Million 64

© 2 0 1 9 S P L U N K I N C .
Tips for Data Ingestion
Use a dedicated search head for UBA if you can
• UBA issues real-time searches to pull data from the search head, based on indexed time
• Good for late coming data or summary index with known delay
Version 4.3 supports micro-batch scheduled search
• Run at 1-minute interval
• Can backtrace
• Has health monitor app
2
Native parser works better for these data sources:
• Palo Alto Networks, Cisco ASA, and Windows Event Log
• Others can use Splunk Direct method using CIM compliant data sources

© 2 0 1 9 S P L U N K I N C .
Splunk UBA Data Requirements
PROXY SERVER
FIREWALL
WINDOWS SECURITY
EVENTS
DNS, DHCP
SPLUNK ENTERPRISE
OPTIONAL
DLP
END POINT
VPN
THREAT INTEL -
BLACK/WHITE LISTS
SPLUNK ASSETS
HRDATA (LDAP Accounts)
EXTERNAL ALERTS
CLOUD
ES_NOTABLES
PRINTER
BADGE
Contextual Data
Event Data

© 2 0 1 9 S P L U N K I N C .
Pay Attention to Users and Devices
Spend time to review users and devices output early
• If they are not set up correctly, you have to reset the database
• This means losing existing profiles and anomalies, the system has to rebuild the behavioral baseline → practically starting over again
We had to reset twice:
• 1) after realizing the normal account and the admin account were not tied correctly, 2) after discovering incorrect devices
• Examples: Internal vs. external, service account vs. real device, web site name vs. real device, IP-to-device mapping
• There is a support tool to delete devices, but gets difficult when the devices are associated with anomalies
Set expectation and leave room in your deployment to allow for at least one database reset
3

© 2 0 1 9 S P L U N K I N C .
3.Remaining Data Sources
• E.g. email, AV, VPN, ES notables, etc.
Data Ingestion Order
2. Firewall and Proxy Data
• These generate a lot of anomalies
• For a large environment, enable one at a time. Spend time to review the new anomalies before enabling the 2nd data source
Enable the data sources in sequence
4
1. Windows Event Log, DNS, and DHCP
• Enable them first since they are used for Identity Resolution (i.e. Device creation)
• Let them run for a few days. Good to review the devices at this time

© 2 0 1 9 S P L U N K I N C .
Splunk UBA Data Requirements
PROXY SERVER
FIREWALL
WINDOWS SECURITY
EVENTS
DNS, DHCP
SPLUNK ENTERPRISE
OPTIONAL
DLP
END POINT
VPN
THREAT INTEL -
BLACK/WHITE LISTS
SPLUNK ASSETS
HRDATA (LDAP Accounts)
EXTERNAL ALERTS
CLOUD
ES_NOTABLES
PRINTER
BADGE
Contextual Data
Event Data

© 2 0 1 9 S P L U N K I N C .
Daily Health Monitoring
During initial deployment, allocate 5-10 minutes every day to check UBA
Check for sudden increase of anomalies• Can be due to new data source or new/change in anomaly rules
• We had a sudden rise of >500K anomalies overnight, clogging the system
• For a 10-node cluster, do not exceed 1M anomalies
Check for Events Per Second (EPS) consistency• May indicate search head or indexers issue
Check for new anomalies and threats• No new anomaly and threat may indicate the models are not running
Use the Health Monitor or App to check each UBA service
Run Health Check script (cron daily)
5

© 2 0 1 9 S P L U N K I N C .
How to Monitor Splunk UBA
Health Monitor UI
Monitoring App
Health Check Script
• System health
• Services
• Datasources and ingestion
• Containers
• Identity Resolution
• Events (Overall EPS)
• Models
• Rules

© 2 0 1 9 S P L U N K I N C .
Navigating UBA
Learn to use these features in the UI
• Filtering
– With or without wildcard
– Aware of display limit
– Further filtering at the Anomaly Type level
• Grouping
• Adding columns
– E.g. Model name
Watch the training video:
• https://education.splunk.com/elearning/uba-hunter-walkthrough
6

© 2 0 1 9 S P L U N K I N C .
Filter Anomalies by Type and Device
1. Go to Anomaly Table
2. Select Anomaly Type
3. Group by Individual Devices

© 2 0 1 9 S P L U N K I N C .
Filter Anomalies by Type and Event Metadata
1. Go to Anomaly Table
2. Select Anomaly Type
3. Click on the funnel icon
4. Filter by specific process

© 2 0 1 9 S P L U N K I N C .
Group Anomalies by Devices and filter using Wildcard
1. Go to Anomaly Table
2. Group by Individual Devices
3. Add Filter for Specific Devices
4. Search using wildcards
5. Click on + Any device matching *XYZ*

© 2 0 1 9 S P L U N K I N C .
Group Anomalies by Category and display Model
1. Go to Anomaly Table
2. Group by Anomaly Category
3. Add column to display Model

© 2 0 1 9 S P L U N K I N C .
When to Start Tuning
Install & Config
Data Ingestion
Tuning & Content Management
Threat Monitoring & Hunting• Start looking at anomalies and threat in
tuning perspective. Focus on breadth.
• Behavioral-based anomalies may
require 20-30 days for meaningful
results
Start monitoring threats for
detection and investigation.
Focus on depth
Iterate
Professional Services
7

© 2 0 1 9 S P L U N K I N C .
How to Start Tuning
Models generate anomalies
One anomaly type can comprise of multiple models
Much more descriptive, easier to communicate with analysts
1. Start with anomalies. Find the biggest offenders:
– Filter to display only one Anomaly Type or Model
– Then group by “Individual Device”
– The top device with the highest count is likely a tuning candidate, or something bad
2. Then look at top Threats. Look at the anomalies in the threat, and find the biggest offenders in those anomalies. Repeat
Look at threat first or anomaly first?
Suspicious
Data
Movement
• Data transfer over email
• Http transfer to storage
• Transfer to USB
• Unusual activity amount
• Etc.
Anomaly Type Model Name
8
Look at the model name

© 2 0 1 9 S P L U N K I N C .
Tuning OptionsHow to adjust UBA anomalies to your needs
9
Exclude unwanted events in the data
ingestion SPL
Used to suppress anomalies or change score
Override model parameters in
configuration file
Clone configuration to
make new models
Create your custom model
Change
Source
Query
Anomaly
Action
Rule
Override
Model
Clone
ModelSDK

© 2 0 1 9 S P L U N K I N C .
Avoid Viewing Fatigue
By default, all models are turned on
Some are more useful to you, some are less• Anomalies for Insider Threat vs. External Threat
• Some anomalies don’t have enough details about the contributing events, hard for analysts to further investigate
Compile a list of models that are more impactful to you, and leave the rest as boosting factor or contextual events• Allow you to be more focused, and help create better threats later
• You can either suppress the anomaly, or lower or raise the score for importance
Goal is to start alerting on meaningful threats built from anomalies
10

© 2 0 1 9 S P L U N K I N C .
1. Understand UBA sizing constraints and deploy for growth
2. Become familiar with UBA services and troubleshooting
3. Learn how to navigate UBA
4. Perform iterative tuning
5. Identify new use cases
Key Takeaways

© 2 0 1 9 S P L U N K I N C .
1. Visit Splunk UBA booth and watch the demos
2. Check out other UBA talks at .conf
• Innovation Labs: UBA Custom Machine Learning Use-Case Framework
• SEC2109 - Hunting Threats with Splunk UBA
• SEC1230 - It is Normal or Suspicious? Detecting Anomalies via market Basket Analysis
• SEC1732 - Let's Get Hands-On with Splunk Enterprise, Splunk Phantom, Splunk UBA & Real Boss of the SOC Data
• SEC2083 - Catch exfiltration from cloud file stores early!
• SEC1248 - Advanced Threat Hunting & Anomaly Detection with SplunkUBA
3. Watch Splunk Education Videos
• UBA Analyst: https://education.splunk.com/elearning/uba-soc-analyst-walkthrough
• UBA Hunter: https://education.splunk.com/elearning/uba-hunter-walkthrough
• UBA Admin: https://education.splunk.com/elearning/uba-administration-walkthrough
Additional Resources


RATE THIS SESSION
Go to the .conf19 mobile app to
© 2 0 1 9 S P L U N K I N C .
You!
Thank