lesson topics covered: biosphere, lithosphere, hydrosphere nitrogen cycle, characteristics of...
TRANSCRIPT

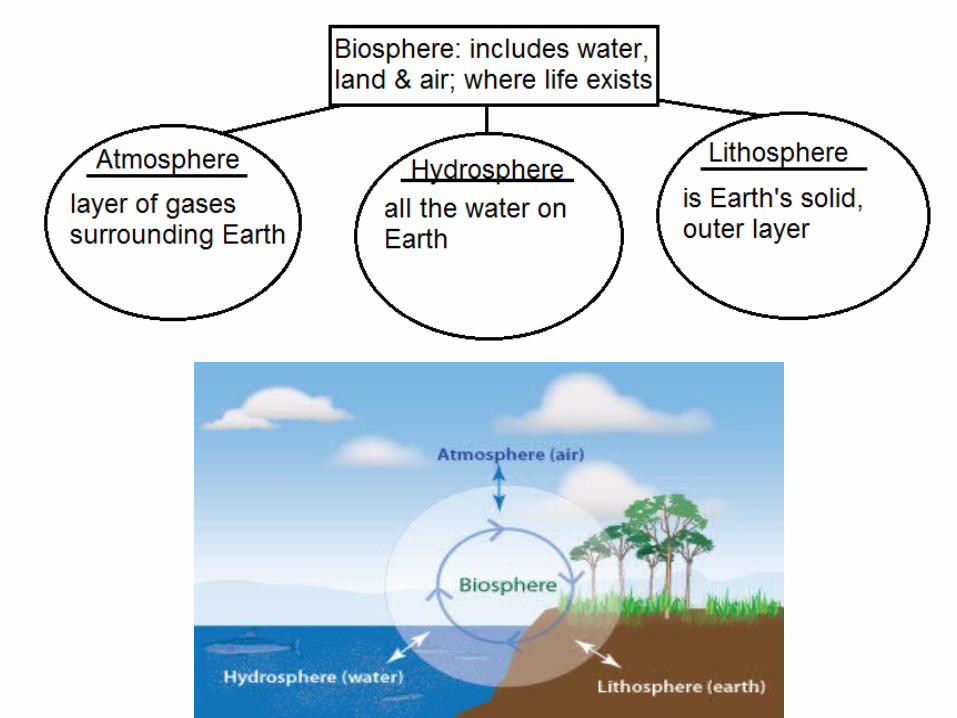
LessonTopics covered:
Biosphere, lithosphere, hydrosphere Nitrogen cycle, Characteristics of population Exotic species


Nitrogen fixation process
Denitrification process
Artificial fixation of N2 using fossil fuel
Fe
rtilizer ap
plic
ation
sTHE NITROGEN CYCLE

Nitrogen cycle- key terms to know
Complete Nitrogen cycle HW: Matching onto diagram
Processes Done by1. Nitrogen fixation = convert N2 into NH3 Nitrogen fixing bacteria
2. Nitrification = converts NH4+ into NO2
- and then NO3
-
Nitrifying bacteria
3. Denitrification = converts NO3- back to N2 Denitrification bacteria
N2 nitrogen gas
NH3 ammonia gas
NO2- nitrite ion
NH4+ ammonium ion usable forms of
nitrogen by most living thingsNO3
- nitrate ion

Nitrogen fixation process
Denitrification process
Artificial fixation of N2 using fossil fuel
Fe
rtilizer ap
plic
ation
sTHE NITROGEN CYCLE

Characteristics of a population
Exponential (unrestricted) growth: The growth rate of a population accelerates rapidly producing a J-shaped curve when plotted
• Occurs when resources are abundant
• Short-lived phenomenon

is reached
The # of rabbit births = # rabbit deathsThe population is said to be at equilibrium
Carrying capacity is the maximum number of individuals that an ecosystem can support indefinitely.
Equilibrium: the number of individuals of a population stays the same over time
Why does this happen?

Limiting factors• are any resources that is in short supply (or limited)• Any abiotic and biotic factor can be a limiting factor on a population. • Examples of limiting factors?
• What can limiting factors do to a population?
-help prevent over-population
• Can most populations be affected by more than one factor at a time?
- yes

What does this graph tell you about the hare and lynx population? Why does such pattern exist?
Case study- Snowshoe hare and Lynx population cycles

What does this graph tell you about the hare and lynx populations?
- Hare and lynx population decrease and increase every 10 years - Lynx population closely follows that of the hare

How can we explain such pattern in the hare-lynx population cycles?
1. As hare population increases, the lynx can capture hares more easily. Thus, lynx population increases.
2. Increased lynx number causes hares to decrease. Thus, lynx food supply gets smaller and the lynx population declines as well.
3. Finally, with fewer lynx preying on them, the hare population begins to recover and the cycle repeats.

Summary lynx & hare cycle
more lynx less hares less lynx more hares more
lynx less hares…

Q1. What would happen when a new species introduced whether accidentally or deliberately into a new ecosystem?
New species as new food source for native species
Competition with native species occurs
Q2. How do exotic species get into new ecosystem?•Natural migration, air travel, fishing, import, waterway travel
Q3. How alien species differs from invasive species? Alien species: accidentally or deliberately introduced into a new location
Invasive species:take over the habitat of native species

Invasive species case study: Zebra mussels in Lake Erie

Why zebra mussels problematic?-Grow on any hard surface-Cost industries billions of dollars to clean up- Cause decline in population of native species

Graphing activity 2-2TO BE HANDED IN
DUE
• Follow Procedure #1-3• To add line of best fit:
• Right click mouse when cursor is place over graph;
• Add trendline• Select Linear
• Answer Questions #1-3 and 5 (no 4)
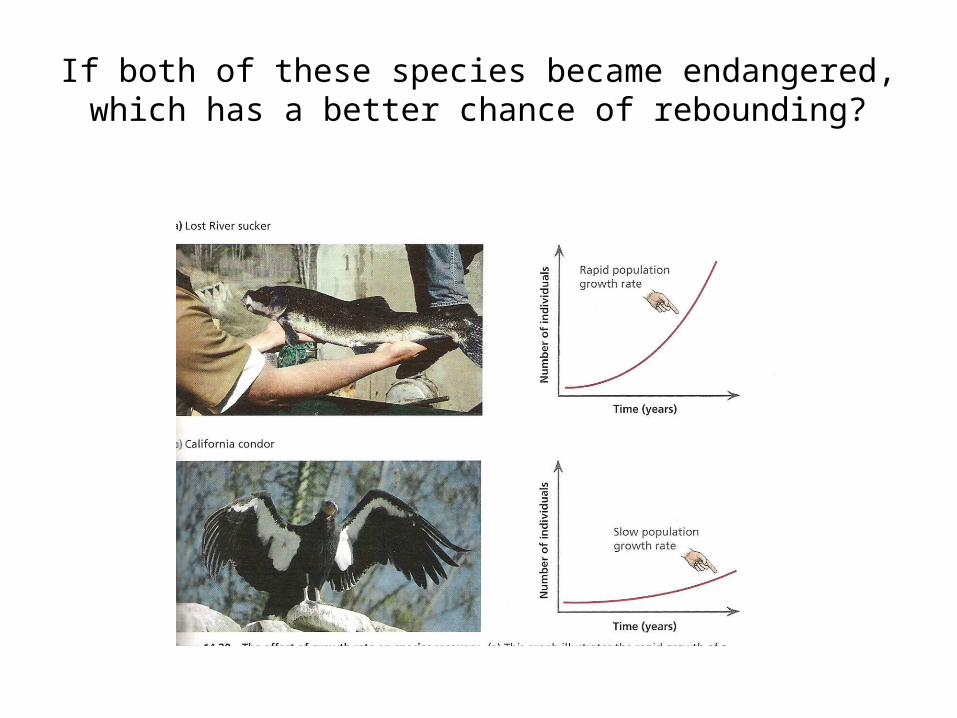
If both of these species became endangered, which has a better chance of rebounding?