lesson plan solving systems by graphing - geogebra ebsary multimedia #2 lesson plan: solving systems...
TRANSCRIPT
Norm Ebsary Multimedia #2 Lesson Plan: Solving Systems by Graphing
1
Lesson Plan Solving Systems by Graphing
Introduction to the Lesson: Systems of linear equations will have 1 solution (independent), no unique solution (dependent), and no solution (inconsistent). Students will learn to graph, analyze, and solve systems of equations by using slope- intercept, standard, and point- slope forms of equations. Students will learn how to find 1 solution, no unique solution, or no solution by graphing system of equations. Emphasis will be on graphing systems of equations, with students leveraging their graphing skills as well as using GeoGebra to capture exact solutions.
Explanation of Math Involved: The primary math involved in solving systems by graphing is graphing. By graphing these linear equations, the solution needs to be common to both equations. By graphing these linear equations, students in addition will have to perform substitution to verify the solution is valid for both equations.
Use 3- Steps as shown below- 1. Graph both equations using slope- intercept format.
a. Plot y intercept (b). b. Count- out slope by rise and run, plot 2nd point. c. Connect 2 points with straight line.
2. Determine the solution, if it exists: a. One solution- point of intersection. b. Infinite solution- coincident, equivalent equations. c. No solution- parallel lines, slopes of both lines are equal.
3. Validate solution, by performing check. a. Substitute x and y coordinates found (if exists) back into
original equations. Solve equations to ensure correctness, that equations balance properly.
Instructional Methods: Visual based using Interactive Electronic text, PowerPoint, and GeoGebra with interactive kinesthetic exercises. So students will follow teacher with classroom examples- using handout of graph paper. After graphing examples in class, students will have classroom assignment using GeoGebra- exploring solutions of 2 linear equations manipulating slope (m) and y intercept (b) of each equation.

Norm Ebsary Multimedia #2 Lesson Plan: Solving Systems by Graphing
2
Step by step procedure: A Daily Agenda is organized, to keep the students aware of the class lesson that day. The lesson is organized as shown below in the PowerPoint, the students see this as they enter the classroom and it is reviewed at the start of the class by the teacher.
Figure 1: Classroom Lesson Daily Agenda The step by step procedure will follow the Daily Agenda shown above:
1. Warmup- See Appendix A for 6 graphing problems. 2. Lesson Introduction- based on PowerPoint and electronic textbook,
students review linear equations with slope- intercept, standard, and point- slope forms, then are introduced to lesson concepts with systems of equations and how to solve by graphing.
a. Students do 3 classwork examples using graph paper b. Students work in teams of 2 to 3 for GeoGebra activity
3. Lesson Quiz assesses students comprehension of the lesson. 4. Homework start- students have the 15 minutes or more to start
the homework and ask questions about the assignment.
Norm Ebsary Multimedia #2 Lesson Plan: Solving Systems by Graphing
3
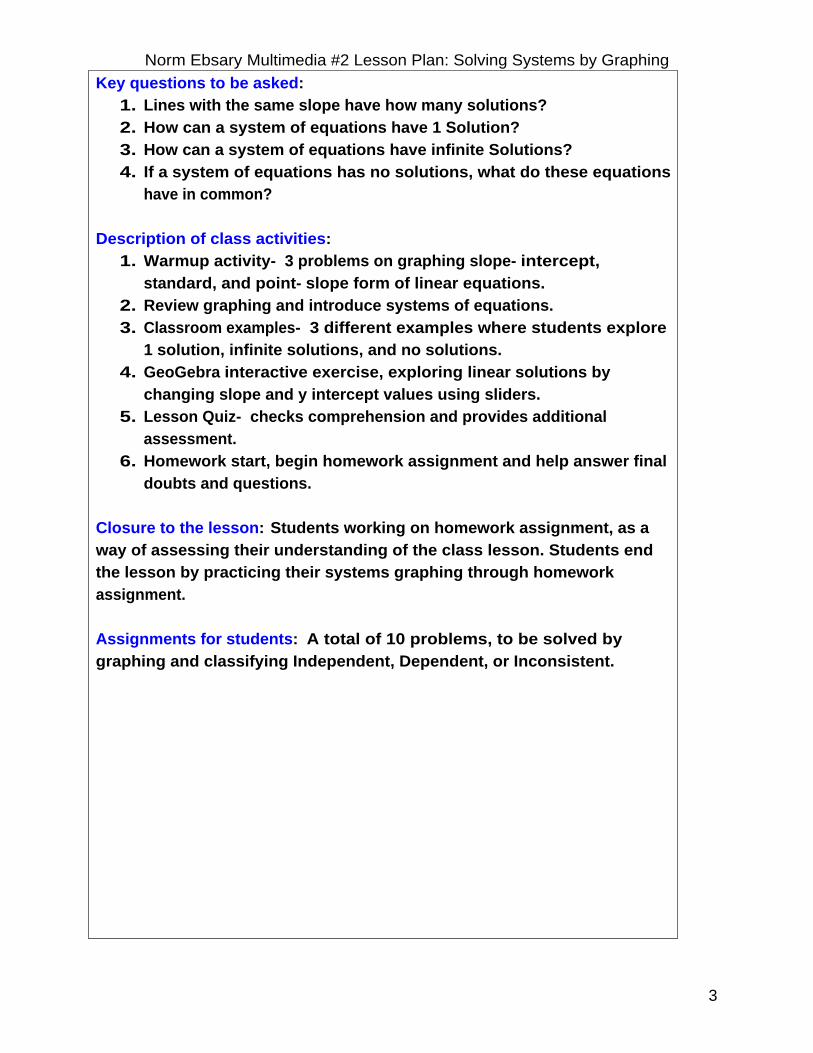
Key questions to be asked:
1. Lines with the same slope have how many solutions? 2. How can a system of equations have 1 Solution? 3. How can a system of equations have infinite Solutions? 4. If a system of equations has no solutions, what do these equations
have in common?
Description of class activities: 1. Warmup activity- 3 problems on graphing slope- intercept,
standard, and point- slope form of linear equations. 2. Review graphing and introduce systems of equations. 3. Classroom examples- 3 different examples where students explore
1 solution, infinite solutions, and no solutions. 4. GeoGebra interactive exercise, exploring linear solutions by
changing slope and y intercept values using sliders. 5. Lesson Quiz- checks comprehension and provides additional
assessment. 6. Homework start, begin homework assignment and help answer final
doubts and questions.
Closure to the lesson: Students working on homework assignment, as a way of assessing their understanding of the class lesson. Students end the lesson by practicing their systems graphing through homework assignment.
Assignments for students: A total of 10 problems, to be solved by graphing and classifying Independent, Dependent, or Inconsistent.

Norm Ebsary Multimedia #2 Lesson Plan: Solving Systems by Graphing
4
Assessments: in 6 levels as follows-
1. Classwork activity- observations on how students complete exercise activities for length of time and correctness of content.
2. Homework- review homework for completeness and correctness of content.
3. Warmup- Warmup is based on previous lesson, so the ease in which students complete the Warmup correctly is observed and noted.
4. Lesson Quiz- at the end of lesson to check for understanding. 5. Quiz- section short assessment using system of equations by
graphing, 10 problems total. 6. Test- chapter test provides measure of how students comprehend
the graphing of system equations and how this interacts with earlier and later sections of the chapter.
Plan for providing feedback: for classwork activity and Warmup, the feedback will be interactive as student’s progress through the assignment- I will be walking around the classroom interacting with students and providing direct feedback on my observations. For homework, I also provide direct feedback while grading the assignments for completeness and correctness as I take attendance and students are working on their Warmup assignments. For Quiz and Tests, students receive their corrected versions back in a timely manner and problems are reviewed in class.
Answer keys to assignments and assessments: See Appendix A
Supplement activities lesson: See Appendix B
Norm Ebsary Multimedia #2 Lesson Plan: Solving Systems by Graphing
5
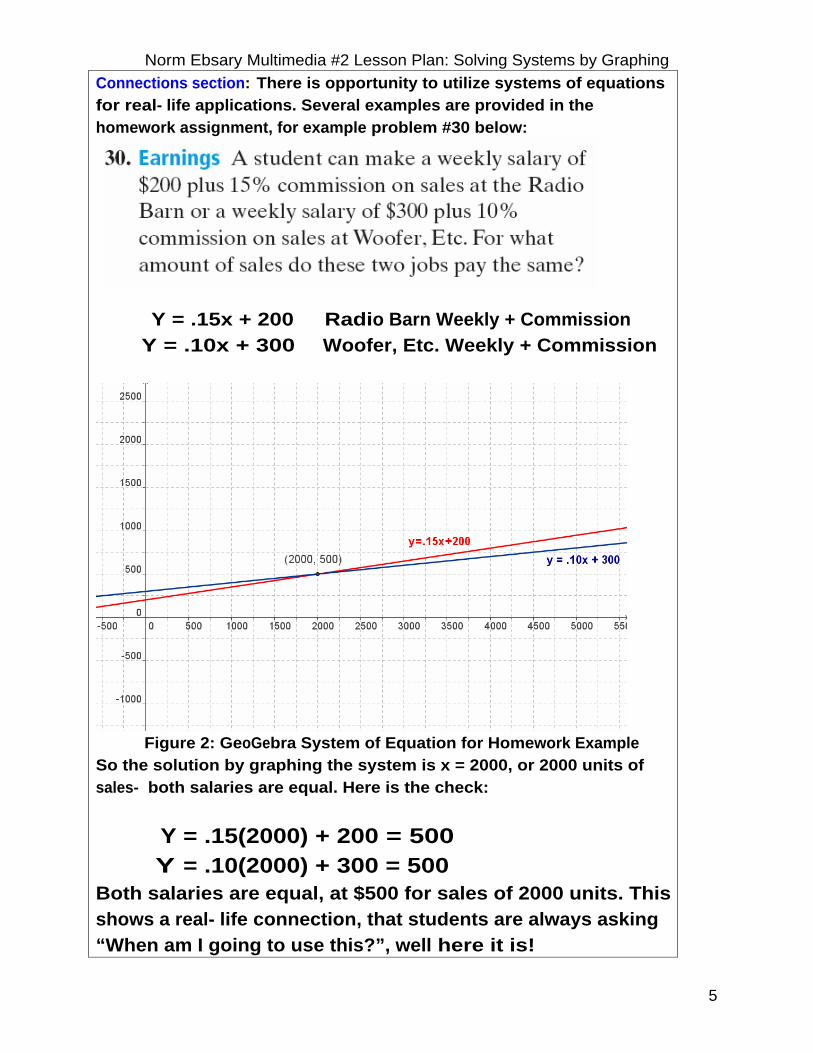
Connections section: There is opportunity to utilize systems of equations for real- life applications. Several examples are provided in the homework assignment, for example problem #30 below:
Y = .15x + 200 Radio Barn Weekly + Commission Y = .10x + 300 Woofer, Etc. Weekly + Commission
Figure 2: GeoGebra System of Equation for Homework Example So the solution by graphing the system is x = 2000, or 2000 units of sales- both salaries are equal. Here is the check:
Y = .15(2000) + 200 = 500 Y = .10(2000) + 300 = 500 Both salaries are equal, at $500 for sales of 2000 units. This shows a real- life connection, that students are always asking “When am I going to use this?”, well here it is!

Norm Ebsary Multimedia #2 Lesson Plan: Solving Systems by Graphing
6
Appendix A: Answer keys to assignments and assessments
Figure 3: Lesson Warm- Up

Norm Ebsary Multimedia #2 Lesson Plan: Solving Systems by Graphing
7
Figure 4: Lesson Warm- Up solution key
Gr aphing Syst ems of Equations
1. Graph and solve the system.
Classify each system by graphing. Tell how many solutionsthere are.
2. 3. 4.
4x + y = –1–x + 3y = 10
5x + 3y = 10–x – 0.6y = –2
12x – 18y = 9–6x + 9y = 13
4x + 5y = –103x – 8y = 15
(–1, 3)
dependent; infinitely many
inconsistent; no solutions
independent; one solution
Figure 5: Lesson Quiz with solution key
Norm Ebsary Multimedia #2 Lesson Plan: Solving Systems by Graphing
8
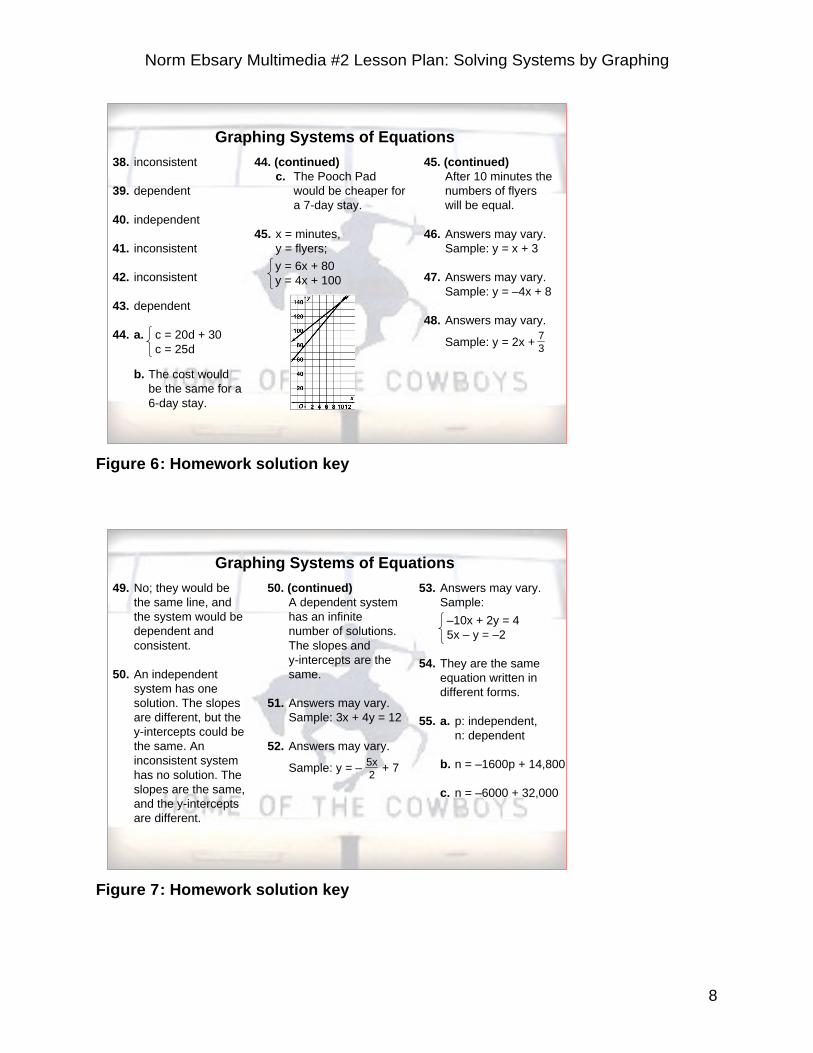
Graphing Systems of Equations
38. inconsistent
39. dependent
40. independent
41. inconsistent
42. inconsistent
43. dependent
44. a. c = 20d + 30c = 25d
b. The cost would be the same for a 6-day stay.
44. (continued)c. The Pooch Pad
would be cheaper for a 7-day stay.
45. x = minutes, y = flyers;
45. (continued)After 10 minutes the numbers of flyers will be equal.
46. Answers may vary. Sample: y = x + 3
47. Answers may vary. Sample: y = –4x + 8
48. Answers may vary.
Sample: y = 2x + 73
y = 6x + 80y = 4x + 100
Figure 6: Homework solution key
Graphing Systems of Equations
49. No; they would be the same line, and the system would be dependent and consistent.
50. An independent system has one solution. The slopes are different, but the y-intercepts could be the same. An inconsistent system has no solution. The slopes are the same, and the y-intercepts are different.
50. (continued)A dependent system has an infinite number of solutions. The slopes and y-intercepts are the same.
51. Answers may vary. Sample: 3x + 4y = 12
52. Answers may vary.
Sample: y = – + 75x2
53. Answers may vary. Sample:
–10x + 2y = 45x – y = –2
54. They are the same equation written in different forms.
55. a. p: independent, n: dependent
b. n = –1600p + 14,800
c. n = –6000 + 32,000
Figure 7: Homework solution key

Norm Ebsary Multimedia #2 Lesson Plan: Solving Systems by Graphing
9
Graphing Systems of Equations
55. (continued)d. About
(3.91, 8545); profits are maximized if about 8545 widgets are sold for about $3.91 each.
56. C
57. G
58. B
59. H
60. [2] The slope of 2x – 5y = 23 is and the slope of
3y – 7x = –8 is . Since the slopes are not equal,
the lines are not parallel and they do not coincide. Therefore, the lines intersect; the system has exactly one solution and is consistent.
[1] does not include explanation
61. [4] Answers may vary. Sample:(a) A second equation is 4x – 6y = 10, or any
equation of the form 2ax – 3ay = 5a.
(b) A second equation is 2x – 3y = 6 or any equation of the form 2ax – 3ay = 5b, where a b.
[3] minor error in either part (a) or (b)
25
73
=/
Figure 8: Homework solution key
Figure 9: Quiz on Linear Systems

Norm Ebsary Multimedia #2 Lesson Plan: Solving Systems by Graphing
10
Figure 10: Chapter Test on Linear Systems

Norm Ebsary Multimedia #2 Lesson Plan: Solving Systems by Graphing
11
Appendix B: Supplement activities lesson Downloaded from UnitedStreaming.com a video on Linear Equations with emphasis on graphing. The tile of the video is “Adventurous_World_of_Algebra__The__Program_3__Linear_Equations” and has a run-time of approximately 45 minutes. The supporting cast is called the “Standard Deviants”, that provide an effective yet humorous at times lesson on Linear Algebra
Figure 11: Vide from UnitedStreaming.com on Linear Algebra

This document was created with Win2PDF available at http://www.win2pdf.com.The unregistered version of Win2PDF is for evaluation or non-commercial use only.This page will not be added after purchasing Win2PDF.