lesson 2-7: cross-sectional study – in school teacher note: module 2 overview content area:...
TRANSCRIPT

Lesson 2-7: Cross-Sectional Study – In School
Teacher Note: Module 2 Overview
Content Area: Hypothesis-Testing: Cross-Sectional Study
Essential Questions: How can I select groups of people and collect data/evidence from them that will test my hypothesis? If my causal hypothesis is correct, how would the exposure and outcome be distributed in these groups? Enduring Understanding: Causal hypotheses can be tested by conducting investigations of the exposures and outcomes of selected groups of people as they go about their lives. Information from these observational studies can be used to determine if an exposure and an outcome are associated. Because observational studies are complicated by factors not controlled by the observer, when an association is found, other explanations in addition to causality also must be considered.
Core Concepts:• Testing hypotheses• Association• Exposure/outcome• Control group• 2x2 table• Observational studies• Study design/study plan• Study samples• Prevalence rate• Prevalence ratio• Statement of effect
Lessons:
2-1 Looking for Associations
2-2 Cross-sectional Studies
2-3 Developing Hypothesis and Study Questions
2-4 Respect – Part II
2-5 Planning Study Conduct
2-6 Cross-Sectional Study - In Class
2-7 Cross-Sectional Study – In School
1Revised Sept 14, 2011

Lesson 2-7: Cross-Sectional Study – In School
Teacher Note: Enduring Epidemiological Understandings for the Epidemiology and the Energy Balance Equation Curriculum
1. Health and disease are not distributed haphazardly in a
population. There are patterns to their occurrence that can be identified through surveillance. Analysis of the patterns of health and disease distribution can provide clues for formulating hypotheses about their possible causes.
2. Causal hypotheses can be tested by conducting investigations of the exposures and outcomes of selected groups of people as they go about their lives. Information from these observational studies can be used to determine if an exposure and an outcome are associated. Because observational studies are complicated by factors not controlled by the observer, other explanations also must be considered.
2

Lesson 2-7: Cross-Sectional Study – In School
Teacher Note: Authentic Assessment for Module 2 of the Epidemiology and the Energy Balance Equation Curriculum
3
Students will conduct, analyze, and interpret observational, cross-sectional studies among students in their class and then among students outside their class. Working in teams, students will have the opportunity to demonstrate their abilities to select a reasonable hypothesis of interest to them, design study questions about exposure and outcome, obtain informed consent, collect and manage data, calculate and compare prevalence rates, make accurate statements about whether their data support that hypothesis, and consider alternate explanations for what they observed. Reporting of results will be required, such as a written report, an item for the school newspaper, or an oral presentation or poster for students, teachers, and/or parents. Specific performance criteria will be used to help ensure that the experiences allow a genuine, realistic, and fair assessment of students’ comprehension of the Module 2 Enduring Epidemiological Understanding.

Lesson 2-7: Cross-Sectional Study – In School 4
Teacher Note: Photos of Worksheets for Lesson 2-7
2-5a2-3a 2-3d
2-7a 2-7b 2-7c

Lesson 2-7: Cross-Sectional Study – In School
Teacher Note: Cross-Sectional Study - In School
5

Lesson 2-7: Cross-Sectional Study – In School
Start of Lesson 2-7
(estimate 4 class periods)
6

Lesson 2-7: Cross-Sectional Study – In School 7
Big Ideas in Lesson 2-6
• The in-class studies are final practice for conducting the in-school studies.
• This is simulated research, not actual research, because the results are not generalizable.
• Steps and materials should all be ready prior to starting.
• In all aspects of the study, every effort should be made to protect the privacy of participants and their information.
• The study allows us to test a hypothesis: it yields counts, that can be turned into prevalence rates, that can be compared as a prevalence ratio, that provides information about an association versus no association.
Review

Lesson 2-7: Cross-Sectional Study – In School
Rubric for Evaluating In-School Study and Poster
8
Criteria Got It Getting It Will Get It SoonParticipation All study team
members participateMost study team members participate
Some study team members participate
Use of Epidemiology Terminology such as Prevalence, Prevalence Ratio, and others
All are appropriate and accurate
Most are appropriate and accurate
Some are appropriate and accurate
Understanding of Importance of Informed Consent
Full understanding of importance
Some understanding of importance
Limited understanding of importance
Thoughtful discussion of challenges in data collection and management
At least 2 challenges well discussed
One challenge well discussed
Little discussion of challenges
Accurate calculation of prevalence and prevalence ratio
All prevalence rates and ratios correctly calculated
Some correctly calculated
Mostly or completely incorrectly calculated
Thoughtful discussion of whether the data support or do not support the hypothesis
A thorough and reasonable discussion of whether the data support the hypothesis
Some reasonable thoughts about whether the data support the hypothesis
Little thoughtful discussion of whether the data support the hypothesis
Understanding of limitations of their study
Identified at least 2 reasonable and logical limitations
Identified 1 reasonable and logical limitation
Did not identify any reasonable or logical limitations

Lesson 2-7: Cross-Sectional Study – In School
Lesson 2-7: Cross-Sectional Study - In School
9

Lesson 2-7: Cross-Sectional Study – In School
Preparation for In-School Cross-Sectional Studies
Who is going to be in your study population among all the students in your school?
10

Lesson 2-7: Cross-Sectional Study – In School
Preparation for In-School Cross-Sectional Studies
Any other tweaks or adjustments based on experience from your in-
class study?
11

Lesson 2-7: Cross-Sectional Study – In School
2-3Study Hypothesis - Statement of a hypothesized association between an exposure and an outcome
2-3Study Variables - Developing questions about exposure and outcome , and additional questions about participants
2-3Questionnaire - Preparing a one-page sheet that study participants will fill out (typed and copies made)
2-4Draft Informed Consent Script - Preparing a script to be read to possible study participants (typed and copies made)
2-5 Plans for Study Conduct – Having assignments for study day
Notebook
Study
2-3a
Checklist - Study Planning
Components and Expectations
Consider adjustments to improve the quality of your study.

Lesson 2-7: Cross-Sectional Study – In School13
Consider
re-assignments
as appropriate,
based on
experience during the
in-class study.
2-5a
Assignments for Day of Study Notebook
Study

Lesson 2-7: Cross-Sectional Study – In School14
Next Class
Conducting In-School Surveys

Lesson 2-7: Cross-Sectional Study – In School
Putting It All Together on Study Day
15

Lesson 2-7: Cross-Sectional Study – In School
Conduct Steps for Study Held in Each Class
CDC
16
• Introduce team
• Read informed consent statement and remind class of their right to not participate.
• Review questionnaire with the entire class
+ Read over all the questions
+ Remind them to NOT write their name on the paper
• Instruct participants to voluntarily and anonymously fill out the questionnaire.
• When they are finished, instruct students to fold their paper in half and to put the paper into the large envelope that will be passed around (participants and non-participants should do this)
• Thank participants.

Lesson 2-7: Cross-Sectional Study – In School17
Next Class
Data Analysis

Lesson 2-7: Cross-Sectional Study – In School 18
Data Management and Calculations for the In-School Cross-Sectional Study
2-7a Notebook
Study

Lesson 2-7: Cross-Sectional Study – In School 19
In-School Cross-Sectional Study: Analysis by Gender
OPTIONAL - 2-7b Notebook
Study

Lesson 2-7: Cross-Sectional Study – In School 20
Honor RollTotal
12070 50
No Honor Roll
120No Healthy Breakfast 7050
Healthy Breakfast
Prevalence Rates
Total Study Population

Lesson 2-7: Cross-Sectional Study – In School 21
Honor RollTotal
12070 50
No Honor Roll
70
120or 58%
120No Healthy Breakfast 7050
Healthy Breakfast
Prevalence Rates
Total Study Population

Lesson 2-7: Cross-Sectional Study – In School 22
Honor RollTotal
12070 50
No Honor Roll
70
120or 58%
120No Healthy Breakfast 7050 or
Healthy Breakfast
Prevalence Rates
50
12042%
Total Study Population

Lesson 2-7: Cross-Sectional Study – In School 23
Honor RollTotal
12070 50
No Honor Roll
70
120or 58%
120No Healthy Breakfast 7050
Prevalence Ratio
or
Healthy Breakfast
Prevalence Rates
50
12042%
1.4
Total Study Population
Students who eat a healthy breakfast are 1.4 times as likely to make the honor role compared to students who do not eat a healthy breakfast.

Lesson 2-7: Cross-Sectional Study – In School 24
Honor RollTotal
6040 20
No Honor Roll
40No Healthy Breakfast 3010
Healthy Breakfast
Prevalence Rates
Males Only

Lesson 2-7: Cross-Sectional Study – In School 25
Honor RollTotal
6040 20
No Honor Roll
40
60or 67%
40No Healthy Breakfast 3010
Healthy Breakfast
Prevalence Rates
Males Only
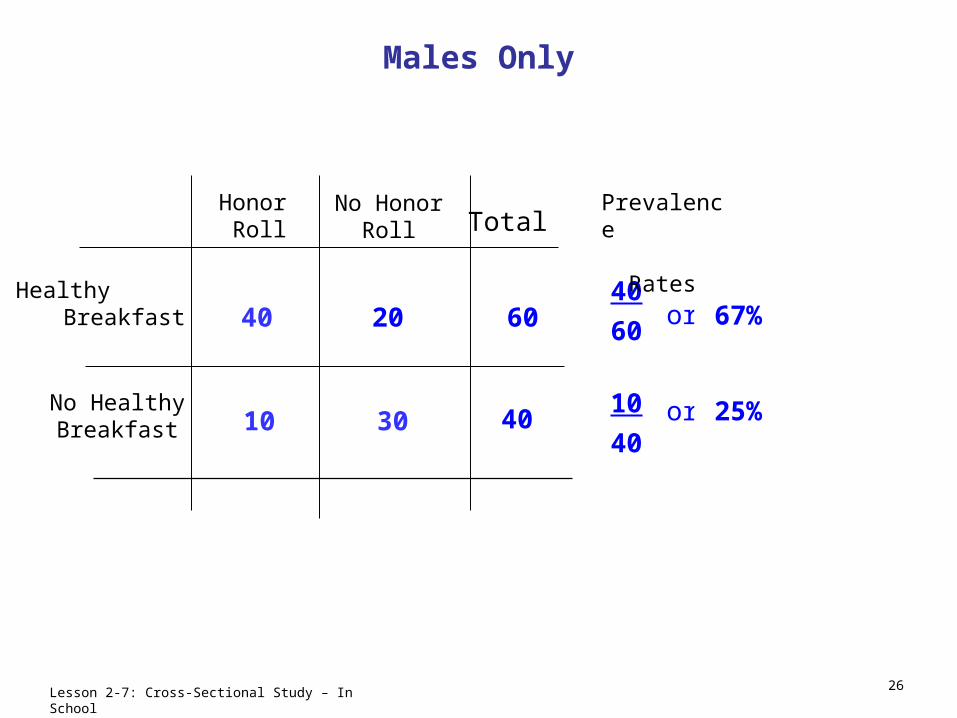
Lesson 2-7: Cross-Sectional Study – In School 26
Honor RollTotal
6040 20
No Honor Roll
40
60or 67%
40No Healthy Breakfast 3010 or
Healthy Breakfast
Prevalence Rates
10
4025%
Males Only

Lesson 2-7: Cross-Sectional Study – In School 27
Honor RollTotal
6040 20
No Honor Roll
40
60or 67%
40No Healthy Breakfast 3010
Prevalence Ratio
or
Healthy Breakfast
Prevalence Rates
10
4025%
2.7
Males Only
Boys who eat a healthy breakfast are 2.7 times as likely to make the honor role compared to boys who do not eat a healthy breakfast.

Lesson 2-7: Cross-Sectional Study – In School 28
Honor RollTotal
6030 30
No Honor Roll
80No Healthy Breakfast 4040
Healthy Breakfast
Prevalence Rates
Females Only

Lesson 2-7: Cross-Sectional Study – In School 29
Honor RollTotal
6030 30
No Honor Roll
30
60or 50%
80No Healthy Breakfast 4040
Healthy Breakfast
Prevalence Rates
Females Only

Lesson 2-7: Cross-Sectional Study – In School 30
Honor RollTotal
6030 30
No Honor Roll
30
60or 50%
80No Healthy Breakfast 4040 or
Healthy Breakfast
Prevalence Rates
40
8050%
Females Only

Lesson 2-7: Cross-Sectional Study – In School 31
Honor RollTotal
6030 30
No Honor Roll
30
60or 50%
80No Healthy Breakfast 4040
Prevalence Ratio
or
Healthy Breakfast
Prevalence Rates
40
8050%
1.0
Females Only
Girls who eat a healthy breakfast are 1.0 times as likely to make the honor role compared to girls who do not eat a healthy breakfast.

Lesson 2-7: Cross-Sectional Study – In School 32
Interpretation of Analysis by Gender
Boys who eat a healthy breakfast are 2.7 times as likely to make the honor role compared to boys who do not eat a healthy breakfast.
Girls who eat a healthy breakfast are 1.0 times as likely to make the honor role compared to girls who do not eat a healthy breakfast.
What do these findings suggest?

Lesson 2-7: Cross-Sectional Study – In School
Next Class
Reporting Out
33

Lesson 2-7: Cross-Sectional Study – In School 34
2-7a – Basis for Report Out and Discussion Notebook
Study

Lesson 2-7: Cross-Sectional Study – In School
1. 2x2 tables and calculations
2. Accurate statements about results
3. Do the results support the hypothesis?
4. What limitations exist?
Report Out and Discussion of Results In Class
35

Lesson 2-7: Cross-Sectional Study – In School
Interpretation of Prevalence Ratios
36
Results Interpretation
Prevalence Ratio At or Near 1.0
NO ASSOCIATION – the prevalence rate among the exposed group is similar or the same as the prevalence rate among the unexposed group
Prevalence Ratio Above 1.0
POSITIVE ASSOCIATION - the prevalence rate among the exposed group is greater than the prevalence rate among the unexposed group
Prevalence Ratio Below 1.0
NEGATIVE ASSOCIATION the prevalence rate among the exposed group is lower than the prevalence rate among the unexposed group
• A prevalence ratio of 1.1 is a weak positive association, while a prevalence ratio of 3.1 is a strong positive association
• A prevalence ratio of 0.95 is a weak negative association, while a ratio of 0.45 is a strong negative association

Lesson 2-7: Cross-Sectional Study – In School37
“ This study has several limitations.”
“The dietary intake data are self-reported, making them subject to errors.”
“A single question was used to address each dietary behavior, and questions ask about diet on the previous day, which might not be representative of the respondents’ overall diet patterns.”
“Additionally, we did not assess or control for the social desirability of bringing lunch.”
An important limitation of the cross-sectional study design is that exposure and outcome are measured at the same point in time - - can we tell the time order?

Lesson 2-7: Cross-Sectional Study – In School
2-7c
38
Notebook
Study
Rubric for Poster of In-School Study Results

Lesson 2-7: Cross-Sectional Study – In School 39
Assessment of Simulated Research Experience
Study PlanningTeamwork
Report Out
Respect for Participants
Study Conduct
Understanding of Study Strengths and Limitations
Data Analysis
Interpretation
of Study
Data Management
Study Communications

Lesson 2-7: Cross-Sectional Study – In School 40
Big Ideas in Lesson 2-7
• Same big ideas as in Lesson 2-7.• The independent (to the extent
possible) conduct of an in-school study by the study team constitutes an authentic assessment of their knowledge and skills related to the second enduring understanding.Causal hypotheses can be tested by conducting investigations of the
exposures and outcomes of selected groups of people as they go about their lives. Information from these observational studies can be used to
determine if an exposure and an outcome are associated. Because observational studies are complicated by factors not controlled by the
observer, other explanations also must be considered.
Re-Cap

Lesson 2-7: Cross-Sectional Study – In School
Optional - A Little History
41

Lesson 2-7: Cross-Sectional Study – In School 42
Examples from Pioneer Epi Club Members 8th Graders at Charles J. Riley School 9 Paterson, New Jersey – Spring
20101. Epi Stars - Drinking at least 2 cans or a 20 ounce bottle of
non-diet soda every day leads to a crash (feeling tired) - Prevalence ratio = 2.5
2. Pop Science – A healthy breakfast is associated with playing in an organized sport - Prevalence ratio = 0.96
3. Hypertensions – Receiving a daily, weekly, or monthly allowance is related to eating junk food/unhealthy food more than twice a day - Prevalence ratio = 1.6
4. Dr. Observation – Healthy eating (at least 2 servings of fruit and vegetables a day) results in better grades (“doing well in school”) - Prevalence ratio = 1.0

Lesson 2-7: Cross-Sectional Study – In School
Making a Poster to Display Survey Results
Examples on next slides from Epi Club Members 8th Graders at Charles J. Riley School 9
Paterson, New Jersey – Spring 2011
43

Lesson 2-7: Cross-Sectional Study – In School
Making a Poster to Display Survey Results
44

Lesson 2-7: Cross-Sectional Study – In School
Making a Poster to Display Survey Results
45

Lesson 2-7: Cross-Sectional Study – In School
Making a Poster to Display Survey Results
46

Lesson 2-7: Cross-Sectional Study – In School
Making a Poster to Display Survey Results
47

Lesson 2-7: Cross-Sectional Study – In School 48