leicester operational pilot final report...seev4-city: final report leicester city hall 2 executive...
TRANSCRIPT

Final report - Leicester City Hall Operational
Pilot
Subtitle: V2B and V2G at Leicester City Hall – case study
Authors: Edward Bentley, Ghanim Putrus, Richard Kotter, Mousa Marzband, Yue Wang, Ridoy Das, Xuewu
Dai (Northumbria University), Chris Randall (Leceister City Council), Chris Rimmer (Cenex UK) and Jorden
van der Hoogt (Cenex Nederland)
Date: 11 September 2020
Participants:
Hogeschool van Amsterdam: Jos Warmerdam
Cenex Nederland: Esther van Bergen
Document control
Version Date Authors Approved Comment
V0.9 28/08/2020 EB, GP, RK, MM, YW, RD,
XD, CRa, CRi, JvdH
GP Internal release SEEV4-City
V1.0 03/09/2020 EB, GP, RK, MM, YW, RD,
XD, CRa, CRi, JvdH
GP Final version for public release.
Updated with feedback from
partners and finalized layout

SEEV4-City: Final report Leicester City Hall
2
Executive Summary
This report provides evaluation of the SEEV4-City Operational Pilot at Leicester City Hall, in the city of
Leicester, U.K. In cooperation with Cenex UK, a demonstration project was set up to evaluate the technical
requirements and commercial benefits of V2B (Vehicle to Building) technology at Leicester City Hall, U.K.
It is part of a collection of reports published by the project covering a variation of specific and cross-cutting
analysis and evaluation perspectives and spans 6 operational pilots. This report is dedicated to the
analysis of the pilot itself. Below an indication of the set of repots is provided, including an indication
where this OP report fits in.
A large council building in Leicester, its central HQ called City Hall, aims to link on site renewable energy
(PV) generation to electric vehicles (EVs) used by the Council staff. Leicester City Hall based staff are
utilising four EVs for their work and charging these, when possible, from local renewable energy (PV)
generation. This study presents the analysis of the use of four such EVs and their charging profiles that
take place at the City Hall.
This is a relatively small-scale operational pilot (OP) studied by the EU Interreg North Sea Region (NSR)
funded SEEV4-City project. It aims to demonstrate the benefit of smart (controlled) charging to better
integrate renewable energy generation and EV charging in order to reduce carbon footprint, alleviate low
voltage (LV) grid stress and achieve an economically viable solution to sustainable electrical transportation
and renewable energy supply. The different aspects mentioned in this report constitute the key elements
of a viable/successful business model, which is essential for a wider implementation of this concept in
real-life applications beyond that of a financially assisted innovation and demonstration one.
This report explores these different dimensions of the business model by making use of smart charging
of electric vehicles (EVs). Four Nissan Leaf electric vehicles are used in this pilot. The SEEV4-City project
uses three key performance indicators (KPIs), namely energy autonomy, CO2 emission savings, and grid
investment deferral, to measure the environmental and economic benefits achieved by providing Electric-
Vehicle-for-Energy-Services (eV4ESs).
The results are summarised in the table below, showing the degree to which the OP was able to address
the various KPI dimensions. Owing to circumstances beyond the control of the participants, no V2B
equipment was installed prior to the end of the pilot / SEEV4-City Project, thus the available outputs were
less comprehensive than had been originally intended. Nevertheless, analysis could be performed using
actual and available data to assess results of the OP for the achieved set-up. This show the OP exceeds its
target for CO2 reduction through different measures, mostly as result of ICE vehicle replacement. Because
most of the PV generation was absorbed by the energy use of the building, the ZE km increase did not
meet its full target, although the connection capacity indicates there is room to increase the amount of PV
which could be dedicated to EV charging. The current set-up, where the planned V2B has not yet been

SEEV4-City: Final report Leicester City Hall
3
implemented, also indicates no Energy Autonomy increase. However, using existing data to assess the
V2B in the ‘virtual carport’ model shows an achievable result of Energy Autonomy for the site increases to
41%,
Analysis, using NPV techniques, of potential eV4ES provided by this OP shows that for the proposed V2G
installation to be profitable, the investment cost per V2G charger/controller should not exceed £11,015.90.
Leicester City Hall Operational Pilot - KPIs
KPI Target Results
A CO2 Reduction 2-5 tonnes 7.19 tonnes/year
Sub-KPI: ZE km increase
factor
1.3 x increase 26793.66 km/year (1.07 x
increase)
B Energy Autonomy increase 1% increase (36 to 37%) N/A (future achievable
indication 39% increase)
C Grid Investment deferral
(by peak demand
reduction)
N/A N/A

SEEV4-City: Final report Leicester City Hall
4
Table of Contents
EXECUTIVE SUMMARY................................................................................................................................. 2
GLOSSARY .................................................................................................................................................... 6
1. ABOUT THE PILOT ............................................................................................................................. 7
Background ....................................................................................................................................... 7 1.1.1. Local context and Energy Profile .................................................................................................................. 7 1.1.2. Local partners ................................................................................................................................................. 7 1.1.3. Objectives and SEEV4-City KPI targets ......................................................................................................... 7 1.1.4. Operational Pilot V2B/V2G System design .................................................................................................. 8
2. DATA COLLECTION AND PROCESSING ........................................................................................... 10
Assumptions and research questions .......................................................................................... 10
Data Processing .............................................................................................................................. 10 2.2.1. EV usage data ................................................................................................................................................ 10 2.2.2. Leicester City Hall energy data ................................................................................................................... 12 2.2.3. Yearly data selection .................................................................................................................................... 14
3. SEEV4-CITY RESULTS – KPIS ............................................................................................................. 15
Methodology ................................................................................................................................... 15
Baseline and Final measurements ............................................................................................... 16 3.2.1. Component data requirements ................................................................................................................. 16 3.2.2. Baseline and Final measurements ............................................................................................................. 17
KPI results ....................................................................................................................................... 18 3.3.1. CO2 Reduction or Savings ............................................................................................................................ 18 3.3.2. Energy Autonomy increase ......................................................................................................................... 21 3.3.3. Grid Investment Deferral ............................................................................................................................ 21 3.3.4. EV transportation and charging patters .................................................................................................... 21
4. COST-BENEFIT ANALYSIS ................................................................................................................ 22
Generic Business Model ................................................................................................................. 22
Specific Business Model ................................................................................................................. 23
EV battery degradation cost .......................................................................................................... 26
Smart charging methodology ........................................................................................................ 28
Annual evaluation results ............................................................................................................. 29
Initial KPI evaluation results ......................................................................................................... 30
V2G – Frequency Regulation provision ......................................................................................... 32
Investment/ return analysis ......................................................................................................... 34
Application of Smart Charging ...................................................................................................... 36
5. DATA MINING TO IDENTIFY TYPES OF EV USE BEHAVIOUR ......................................................... 38
6. LESSONS LEARNT FROM THE DIFFERENT PILOT PHASES ............................................................. 46

SEEV4-City: Final report Leicester City Hall
5
Preparation and initiation ............................................................................................................. 46
Procurement ................................................................................................................................... 46
Implementation and installation ................................................................................................. 47
Operation ........................................................................................................................................ 47
7. CONCLUSIONS AND RECOMMENDATIONS ................................................................................... 48
Key messages .................................................................................................................................. 48
Policy suggestions .......................................................................................................................... 48
Relevant dimensions for Upscaling and Transnational transfer potential .............................. 49 7.3.1. Within the country of the OP (UK) .............................................................................................................. 49 7.3.2. Transfer to other countries ......................................................................................................................... 50 7.3.3. Policy suggestions ........................................................................................................................................ 53
8. REFERENCES ..................................................................................................................................... 55
APPENDIX (A) ............................................................................................................................................. 57
A1. Study to ascertain limitations of the City Hall Power Distribution System ................................ 57
SEEV4-City: Final report Leicester City Hall
6
Glossary
Abbreviations Terms
BEV Battery Electric Vehicle
BESS Battery Energy Storage System
CCGT Combined Cycle Gas Turbine
CCS Combined Charging System
CHAdeMO CHArge de MOde: e-mobility collaboration platform around the CHAdeMO
system
C-Rate Battery charging/discharging rate relative to its maximum capacity
(1 C refers to charging of a battery from flat to full capacity in 1 hour).
DFFR Dynamic Firm Frequency Response
Do
DESS
Depth of Discharge
Energy Storage System
EA Energy Autonomy
EV Electric Vehicle
FCR Frequency Containment Reserve
FFR Firm Frequency Response
FiT Feed-in Tariff
ICE Internal Combustion Engine
ICT Information and Communication Technology
KPI Key Performance Indicator
LCOE Levelised Cost of Energy
LV Low Voltage
NPV Net Present Value
OCGT Open Cycle Gas Turbine
OCPP Open Charge Point Protocol
OSCP
OEM
Open Smart Charging Protocol
Original Equipment Manufacturer
OLEV Office of Low Emission Vehicles (UK)
OP
OSCP
Operational Pilot
Open Smart Charging Protocol
PV Photovoltaic
RE Renewable Energy
SFFR Static Firm Frequency Response
SoC State of Charge
USD US dollar
V2G Vehicle to Grid
V2H Vehicle to Home
V2X Vehicle to Anything
V4ES (electric) Vehicle for Energy Service (eV4ES)

SEEV4-City: Final report Leicester City Hall
7
1. About the pilot
Background
1.1.1. Local context and Energy Profile
In 2014, following a refurbishment, Leicester City Council (LCC) offices returned to their premises in
Charles Street, Leicester, originally built in 1938, making City Hall (as the building is now called) its new
headquarters.
The Leicester City Hall operational pilot is based on an office building already provided with roof-top
Photovoltaic (PV) system. LCC runs a fleet of 800 vehicles delivering a number of services. Prior to
commencement of the project LCC had 17 Ultra Low Emission Vehicles; 7 electric vans and 10 electric cars,
of which 4 Nissan Leaf EVs are studied as part of this project.
1.1.2. Local partners
In cooperation with Cenex UK, a demonstration project was set up to evaluate the technical requirements
and commercial benefits of V2B and V2G technology. A large council building in Leicester, its central HQ
called City Hall, aims to link on site renewable energy (PV) generation to electric vehicles. Leicester City
Hall based staff are utilising four electric vehicles for charging, when possible, from local PV renewable
energy generation. This study deals with the use of four such EVs and their charging that takes place at
the City Hall. In addition, Western Power Distribution (WPD), the local distribution network operator, is
another key project stakeholder; they need to assess the grid impact due to EV charging requirements
before tendering takes place for the associated equipment and integrating the energy
generation/consumption. From communications between LCC and WPD, it emerges that a formal
application with reference to the proposed V2B system is being made via the Energy Networks Association
website. LCC’s installer seeks authority to potentially export electricity to the grid on LCC's behalf, with a
letter of authority giving them permission to discuss LCC’s supply with WPD. WPD will work to provide G99
approval once the formal application is received. It appears that no WPD equipment will be required. This
V2B system is a behind the meter project with no intended export to the grid.
Cenex UK advise that energy export can be avoided by steering the charging/discharging profiles from the
vehicles to match the building's demand. CT clamps will provide the V2B control interface with mains
import and solar generation data, which will permit the controller to work out what power to discharge to
avoid any export to the grid beyond the parameters to be agreed with WPD. WPD want LCC's existing
generating capacity agreement to be increased to cover both the PV and the V2B system, which they state
has the potential to export.
1.1.3. Objectives and SEEV4-City KPI targets
This is a relatively small-scale operational pilot studied by the EU Interreg North Sea Region funded SEEV4-
City project. It aims to demonstrate the benefit of smart (controlled) charging to better integrate
renewable energy generation and EV charging in order to reduce carbon footprint, alleviate low voltage
(LV) power system stress and achieve an economically feasible solution to sustainable electrical
transportation and renewable energy supply. The different aspects mentioned in this report constitute
the key elements of a viable/successful business model, which is essential for a wider implementation of
this concept in real-life applications beyond that of a financially assisted innovation and demonstration
one.

SEEV4-City: Final report Leicester City Hall
8
This report explores these different dimensions of the business model by making use of smart charging
of electric vehicles (EVs). Four Nissan Leaf full battery electric vehicles (BEV) are used in this pilot, which is
referred to as EV in the rest of this report. The SEEV4-City project uses three key performance indicators
(KPIs), namely energy autonomy, CO2 emission savings, and grid investment deferral, to measure the
environmental and economic benefits achieved by providing Electric-Vehicle-for-Energy-Services (eV4ESs).
The objectives for the location system design therefore focused on using eV4ES solutions to:
1. Increase the level of Energy Autonomy as defined by the concept of energy self-sufficiency
discussed hereafter;
2. Create CO2 emission savings by substituting ICE vehicle miles by EV use, and to a degree using PV
to charge the EV rather than charging from the fossil fuel rich energy mix when power is drawn
from the Grid;
3. Investigate the possibility of postponing the need for grid reinforcement by minimising the system
load at times of peak system demand.
The Leicester OP’s SEEV4-City KPI targets as stated at the start of the project were:
KPI Target for OP
A CO2 Reduction 2 – 5 tonnes yearly
(sub-KPI) ZE km increase factor: 1.3
B Energy Autonomy
Increase
From 36 to 37% Δ +1
1.1.4. Operational Pilot V2B/V2G System design
The pilot site of Leicester City Hall combines a number of components for the (eV)ES solutions. Those
currently in place or in the process of being adopted are visualised in Figure 1.
Figure 1: Pilot site overview - design components

SEEV4-City: Final report Leicester City Hall
9
The outline of the system is shown in Figure 2. The system under consideration comprises 4 X 7 kW EV
chargers connected to the City Hall’s main distribution board, with charging sockets. A 23 kWp PV system
had been installed prior to the inception of this project. In the future, it is proposed to install bidirectional
chargers to enable energy stored in the EVs to be used for V2B or V2G service, as required [1]. A summary
of the system components is given in Table 1.
Figure 2: System schematic
Table 1: Summary of system components
Overview Initial stage
Number of EVs known vehicles 4
by RIFD 4
by charging events 4
Est. Average Annual Mileage (per EV) (km) #7241 8111 km/year; #7242 5627 km/year;
#7243 5,865 km/year; for the 4th EV mileage
is not available, and hence is estimated.
No. of existing unidirectional EV Charge Points 5 x 7 kW
Size of PV/ PV generation 24 kWp (16,622 kWh/annum in 2017)
Size of Battery Storage None
Other generation None
Total Annual Electricity Consumption - kWh* 894,910 kWh/annum in 2018/2019
Number of smart charging points 0
Number of proposed V2B units 4
Charging protocol for proposed V2B units CHAdeMO
V2B Charging output (variable) 7 kW maximum per unit
V2B Discharging output (variable) 10 kW maximum per unit
Plug connector JEVS G105
Back Office Requirement Compliant with OCPP 1.6 or above
PV
CP1
City hallElectricity demand
CP2
CP3
CP3
Main electricity board

SEEV4-City: Final report Leicester City Hall
10
2. Data collection and processing
Assumptions and research questions
In conducting the evaluation of the Leicester City Hall pilot business model, as defined in the SEEV4-City
project specification, the following key assumptions were made:
EV charging at the pilot location, Leicester City Hall, is regarded here as the only charging method.
Charging events that may have taken place elsewhere are not considered as part of the pilot.
The battery degradation cost used in this report is based on the empirical model that is derived
from laboratory tests performed by Northumbria University on commercial EV cells. Currently this
model is solely dependent on the C-rate and temperature.
The eV4ES considered in this analysis covers both smart charging and V2B/V2G. Note that only
simulation work has been conducted to verify V2B/V2G, as these services are not yet implemented
at Leicester City Hall in view of the delays encountered in commissioning the requisite bi-
directional EV charging equipment.
A lifetime of 10 years is assumed for the V2B charger, and 20 years for the PV system (section 4.8).
As per industry standards, a 2% discount rate has been used for the Net Present Value (NPV)
calculation (see section 4.8).
Research Questions
In cooperation with Cenex UK, LCC proposed a demonstration project to evaluate the technical
requirements and commercial benefits of Smart Charging and V2B/V2G technologies. The project is aimed
at developing the cost benefit analysis of these technologies with the City local authority in Leicester, the
grid and energy companies, large building owners, EV fleet operators and EV owners. A large council
building in Leicester has on-site renewable energy (PV) generation and this feeds into the building power
distribution system where EV chargers are connected. The possibility that a large public (or in principle
this could also be a commercial) building in Leicester might utilise electric vehicles for short term energy
storage from local renewable energy generation using smart charging and V2B/V2G is considered via
simulation only, as real data was not available due to delay in procurement of new equipment.
Data Processing
The available data from the Leicester City Hall pilot was provided by the Planning, Development &
Transportation as well as the Energy departments of Leicester City Council from their own measurements.
This data set is used to derive the four parameters that will be used in the cost-benefit analyses for smart
charging and V2B (described in Section 3). The four parameters are PV generation, the building’s electricity
base load, the EVs’ driving energy consumption and EVs’ availability for charging and provision of non-
driving services (eV4ES). The data processing with associated assumptions is presented as follows.
2.2.1. EV usage data
Four Nissan Leaf EVs are involved in the Leicester City Hall study, namely:
‘7241’, 30 kWh battery, registration number BT16 APO RFID 840ABFDA 100% charging at City Hall
‘7242’, 24 kWh battery, registration number BD16 ABX RFID 040ABFDA/13BA876A 100% charging
at City Hall
‘7243’, 24 kWh battery, registration number BD16 AEB RFID B4E7BADA 100% charging at City Hall
‘5132’, 24 kWh battery, registration number BL16 TOJ RFID 9490BCDA 100% charging at City Hall.

SEEV4-City: Final report Leicester City Hall
11
The first three EVs are 100% charged at Leicester City Hall, the fourth one ‘5132’ initially had a
comparatively lesser % in this regard, being mostly charged at Duke Street, away from the City Hall, but
this EV is now, like the other 3, entirely charged at City Hall. Leicester City Council has confirmed that ‘5132’
has the same charging arrangements as the other EVs; namely mostly at City Hall and occasionally at the
depot, when it returns for maintenance or repairs. The council expects that the 2018/19 telemetry &
charging data to show that there is not a marked difference in the way ‘5132’ is used compared to the
other 3 EVs, even though the mileage of ‘5132’ was not directly recorded .
From the EV usage data, three parameters, namely the drive mode, the GPS position and the charging EV
energy were used to determine the EV driving energy consumption and their EV availability for eV4ES
within the OP boundaries set. The EVs in this pilot are used by Leicester City Hall staff for their duties, and
City Hall based EV charging was considered to be the only charging method. Charging events that took
place when the EV was away from this base (such as public charging, or during long trips) were not
considered in this report. Therefore, an EV is assumed to be available when it is parked at the City Hall
base and unavailable otherwise. When the EVs return to City Hall during their working day they can benefit
from smart charging. Between 16:00 & 23:00 (DUoS Red & Amber periods) they will be available for V2B
bi-directional charging. EV availability is determined by checking the telemetry data (vehicle GPS). Base
location is GPS bounded in the vicinity of the City Hall. As such, EV availability is shown in Figure 3 for a
typical period in 2017. In subsequent years, EV use was better established amongst staff than in 2017; so
idle times should be somewhat lower.
It can be seen from Figure 3, which is based on telemetry data for March to May 2017, that the 4 EVs are
idle at base for 34.5%, 41.4%, 46% and 48.2% of the time. An EV’s driving energy consumption is found
from the charging energy requirement for each base arrival, which depends on EV usage. The charging
energy input is recorded, and this may be compared with miles driven to enable calculation of CO2 savings
when compared to driving a normal ICE - powered comparative vehicle.
Figure 3: EV usage data March to May 2017
In Figure 4, the charging profile for the four EVs is shown, superimposed onto the PV output for the period
from the 6th to the 12th of March 2017. It can be seen that, generally speaking, the EVs are arranged to
charge in a ‘smart’ way when PV output is available. The EVs do not charge during the hours of darkness
so it may be anticipated that some PV energy will be available for charging. EVs may or may not charge at
the same time; even the power taken by a single 7 kW charger will often exceed the available PV output.
In this situation grid power must be used to make up the shortfall in charging power. If variable power
chargers were available, more of the PV energy could be used for charging if a lower power setting for a
longer period was used. A discussion of the possibilities offered by Smart Charging is provided in section
4.9 below.

SEEV4-City: Final report Leicester City Hall
12
2.2.2. Leicester City Hall energy data
Figure 2 depicts the power flow within the pilot. Power consumption for the City Hall is monitored, as is
PV generation and EV charging data is measured separately. The City Hall baseload profile (including the
EVs’ charging) and PV generation profile are shown in Figure 4.
In Figure 5, the electrical load of the office building is shown, together with the recorded PV output, for
the period March to June 2018. Prior to March 2018 the PV data was only recorded monthly, and so cannot
be used in this analysis for comparison purposes. The PV output figures are probably subject to inaccurate
measurement according to LCC. The Baseload includes the EV charging. As may be seen, the PV output
never approaches the minimum building demand, so there will be no possibility of PV energy export, and
all of the PV production is consumed within the building, thus reducing the import of power flow from the
Grid. It was thought worthwhile to consider the PV generation as comprising a ‘virtual carport’ in which it
is assumed that PV output is preferentially used to charge the available four EVs. In fact no such physical
carport exists but the electrical measurements can reveal the performance of an actual carport with the
EV charging fed directly from the PV output, rather than flowing through the City Hall distribution system.
In this way one may obtain information which can inform a possible further development of the upcoming
V2B installation at City Hall, (which does not include prioritising PV for EVs) or EV4ES schemes elsewhere
in Leicester.
Figure 4: EV charging profile and PV output 06/03/2017 to 12/03/2017
Figure 5: Electricity demand & PV data for the period March to May 2018
Table 2 gives a description of the available energy flow data to be used in this report.
06/03/17 07/03/17 08/03/17 09/03/17 10/03/17 11/03/17 12/03/17

SEEV4-City: Final report Leicester City Hall
13
In addition, driving telemetry data is recorded, as shown in Table 3. Unfortunately changes in battery SoC
were not recorded, but the overall energy consumption may be gleaned from the charging data. The
proposed new V2B control interface will be specified to gauge the battery SoC.
Table 2: Energy flow variable list
Name in the database Interpretation Data source
1 Grid to Building kWh Half hourly figures Recorded
2 PV Output kWh Half hourly figures Recorded
3 Charging connector Socket type used Recorded
4 Charging start time and date Time and date Recorded
5 Charging end time and date Time and date Recorded
6 Charging duration Time in hours Recorded
7 RFID number Number of card used for charge Recorded
8 Energy Amount of charge in kWh Recorded
Table 3: Traffilog telemetry data recorded
Name in the database Interpretation Data source
1 Vehicle number Vehicle ID code Recorded
2 Vehicle group Driver ID Recorded
3 Start drive Time and date Recorded
4 Start location Address Recorded
5 End drive Time and date Recorded
6 End location Address Recorded
7 Distance Miles Recorded
8 Drive time Journey time Recorded
As an example, Figure 6 shows the charging profile in kWh per charge for RFID 13BA876A which represents
EV ‘7242’ 24 kWh Leaf EV registration number BD16 ABX for the period 13th March 2019 to 29th March
2019. Figure 7 shows the duration of connection time for the same EV over the same period. It is evident
that some connections are for a very long period, well in excess of that required to charge the EV. 15th and
29th March 2019 were both Fridays, so it would appear that the very long connection times represent
leaving the EV connected over the weekend. There would be scope for increasing energy autonomy and
green EV charging by enabling the charging function over the weekends when the EVs are not being
utilised. At present all EVs are fully charged by mid/late evening, but they are not required until 7 a.m. at
the very earliest the following day. With the proposed V2B scheme as designed, after discharging to the
City Hall onwards from 11 p.m. the EVs will be able to recharge from the mains on the Council's cheaper
overnight rate. There may be scope here to use the smart functionality of the chargers to achieve some
battery management good practice. Thus the EVs could be brought up to 50% SoC by the early hours and
held here until 4 a.m. or 5 a.m. when the remainder of the charging could be completed. Normally the EVs
are only used in weekday office hours and not at weekends. Thus at weekends at Bank Holidays charging
would either be split between the night of the last working day and the night of the next working day, or
fully take place during the latter. Normally the EVs are only used in weekday office hours and not at

SEEV4-City: Final report Leicester City Hall
14
weekends. Thus at weekends at Bank Holidays charging would either be split between the night of the last
working day and the night of the next working day, or fully take place during the latter. However, if the
battery management approach is taken there will be little or no opportunity for EV charging to benefit
from weekend solar generation. To date, no batteries on any of the Leicester City Councils’ EVs (mostly
purchased in 2016) have needed replacing.
Figure 6: Charging profile in kWh for EV ‘7242’
Figure 7: Charging profile connection time in hours for EV ‘7242’
2.2.3. Yearly data selection
The aforementioned parameters, PV generation, base load, EV driving consumption and EV availability,
have all been prepared in the format of a 30-minute resolution and were used in the cost-benefit analysis
of (smart charging) presented in Section 4.
Calendar Year 2017 was initially selected to carry out the yearly analysis. However, the period between
the 5th March 2018 to 31st March 2019 was subsequently chosen since before the 5th March 2018, when
the PV was connected to the Automatic Meter Reading system (AMR), data was recorded manually on a
monthly basis from a panel on the front of the inverter, and thus is not available for processing on a 30-
minute resolution basis.
SEEV4-City: Final report Leicester City Hall
15
3. SEEV4-City Results – KPIs
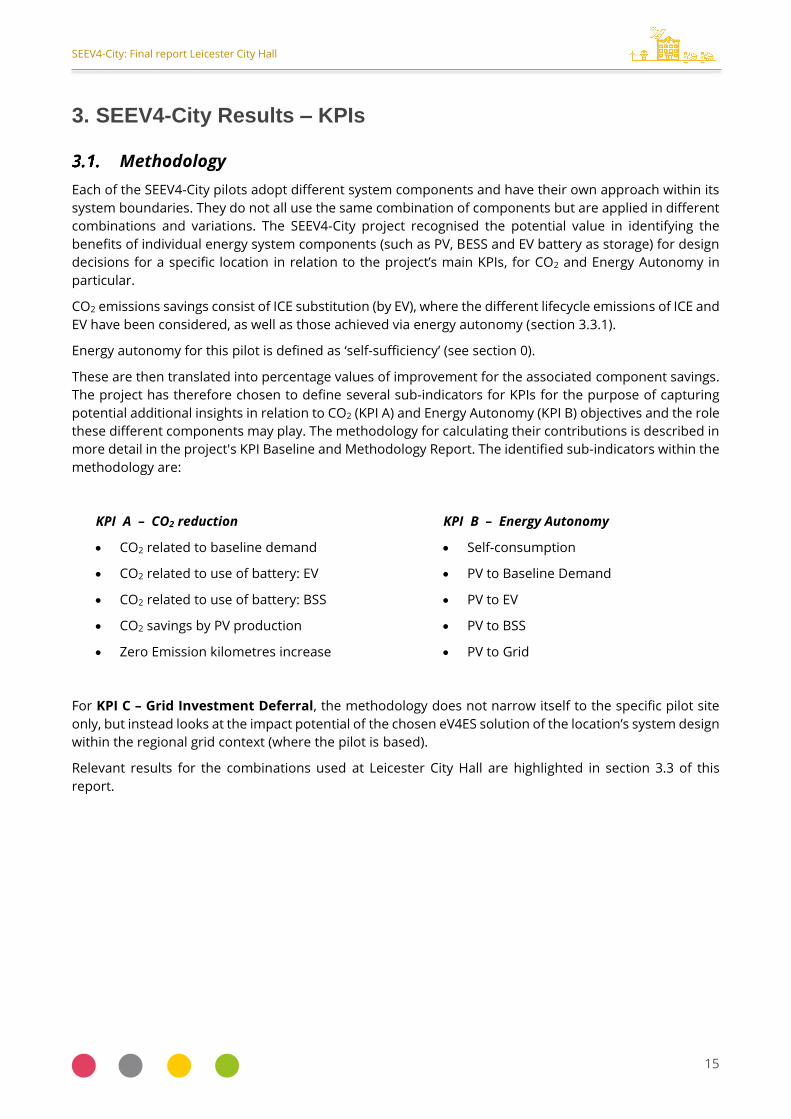
Methodology
Each of the SEEV4-City pilots adopt different system components and have their own approach within its
system boundaries. They do not all use the same combination of components but are applied in different
combinations and variations. The SEEV4-City project recognised the potential value in identifying the
benefits of individual energy system components (such as PV, BESS and EV battery as storage) for design
decisions for a specific location in relation to the project’s main KPIs, for CO2 and Energy Autonomy in
particular.
CO2 emissions savings consist of ICE substitution (by EV), where the different lifecycle emissions of ICE and
EV have been considered, as well as those achieved via energy autonomy (section 3.3.1).
Energy autonomy for this pilot is defined as ‘self-sufficiency’ (see section 0).
These are then translated into percentage values of improvement for the associated component savings.
The project has therefore chosen to define several sub-indicators for KPIs for the purpose of capturing
potential additional insights in relation to CO2 (KPI A) and Energy Autonomy (KPI B) objectives and the role
these different components may play. The methodology for calculating their contributions is described in
more detail in the project's KPI Baseline and Methodology Report. The identified sub-indicators within the
methodology are:
KPI A – CO2 reduction
CO2 related to baseline demand
CO2 related to use of battery: EV
CO2 related to use of battery: BSS
CO2 savings by PV production
Zero Emission kilometres increase
KPI B – Energy Autonomy
Self-consumption
PV to Baseline Demand
PV to EV
PV to BSS
PV to Grid
For KPI C – Grid Investment Deferral, the methodology does not narrow itself to the specific pilot site
only, but instead looks at the impact potential of the chosen eV4ES solution of the location’s system design
within the regional grid context (where the pilot is based).
Relevant results for the combinations used at Leicester City Hall are highlighted in section 3.3 of this
report.

SEEV4-City: Final report Leicester City Hall
16
Baseline and Final measurements
3.2.1. Component data requirements
Data requirements are specified in Table 4.
Table 4: Data Requirements
Leicester City Hall - Data
KPI A
Relevant components Data (sets) required
Grid to Building kWh Half hourly figures
PV Output kWh Half hourly figures
Charging start time and date Time and date
Charging end time and date Time and date
Charging duration Time in hours
RFID number Number of card used for charge
Energy Amount of charge in kWh
Vehicle number Vehicle ID code
Vehicle group Driver ID
Start drive Time and date
Start location Address
End drive Time and date
End location Address
Distance Miles
Drive time Journey time
KPI B
Relevant components Data (sets) required
Grid to Building kWh Half hourly figures
PV Output kWh Half hourly figures
Charging connector Socket type used
Charging start time and date Time and date
Charging end time and date Time and date
Charging duration Time in hours
RFID number Number of card used for charge
Energy Amount of charge in kWh
KPI C
Relevant components Data (sets) required
System Electrical Diagram

SEEV4-City: Final report Leicester City Hall
17
3.2.2. Baseline and Final measurements
Baseline and Final measurements are summarised in Table 5, Table 6 and Table 7.
Table 5: Baseline and Final measurements relating to annual CO2 reduction
Initial stage (a) End of Project (b)
Value Value Improvement
Compared to (a)
Pilot CO2 footprint 252.1 tonnes 249 tonnes 3.1 tonnes
CO2 related to baseline demand 257 tonnes 257 tonnes 0 tonnes
CO2 related to use of battery: EV 0 -4.09 tonnes 4.09 tonnes
CO2 related to use of battery: BESS N/A N/A N/A
CO2 savings by PV production 4.9 tonnes 4.9 tonnes 0 tonnes
ZE km increase 0 km 26793.66 km 26793.66 km
Battery as back-up services (replacement
of diesel generators)
N/A N/A N/A
Table 6: Baseline and Final measurements relating to Energy Autonomy
Initial stage (a) End of Project (b)
Value Value Improvement
Compared to
(a)
B. Energy Autonomy Increase
B.1 Self Sufficiency 2% 2% 0%
B.2 PV to Baseline Demand 2% 2% 0%
B.3 PV to EV 0 1310.5 kWh 1310.5 kWh
B.6 ‘Virtual Carport’ 0 41% EA 41% EA
Table 7: Baseline and Final measurements relating to Grid Investment Deferral
Initial stage (a) End of Project (b)
Value Value Compared to (a)
C. Grid Investment Deferral
C.1 Peak Demand Value 250 kW 254 kW 4 kW
From Table 7 it is clear to see that there is no Grid investment deferral. The only factors changed under
the OP were the addition of EV charging and EV use. The amount of charging was small in comparison
with the total City Hall load, and even if bi-directional chargers were used to enable V2B, the effect would
be small. In 2017 the City Hall maximum peak demand (250 kW) was experienced on 19th of June 2017
between 10 a.m. and noon. In 2018 the peak demand (254 kW) was experienced at 2 p.m. on the 27th of
June 2017. An additional point to note is that even when V2B operation is established, the times of peak
City Hall load occurred when the EVs are in use, so in the absence of a BESS system there is no available
improvement in this KPI.

SEEV4-City: Final report Leicester City Hall
18
KPI results
3.3.1. CO2 Reduction or Savings
The CO2 emission savings for the Leicester City Hall operational pilot were calculated from the following
two parts:
Savings due to ICE substitution;
Savings due to smart energy management.
The first part considers the difference between the CO2 emissions in the lifecycles of ICEs and EVs, covering
all stages of manufacturing, operation, maintenance and decommissioning. During each of these stages,
a certain amount of CO2 is emitted. To allow a fair comparison, the whole lifecycle for both types of vehicles
must be taken into account. It is worth noting that within the scope of SEEV4-City project, the operation of
the vehicle is the only controllable part; the other three parts are driven by technology advancement and
penetration level of the technology. Consequently, in this project, the savings in CO2 emission due to the
operation of the electric vehicle must at least compensate for the inherent CO2 emission penalty due to
manufacturing, maintenance and decommissioning, the sum of which for ICE vehicles are significantly less
than those for EVs, as shown in Figure 8 [2].
Based on 2010 data shown in Figure 8 [2], CO2 emissions due to the manufacturing, maintenance and
decommissioning phases for EVs (totalling 65.28 g/km) are almost double those for ICE vehicles (34.45
g/km). This is due to the considerable CO2 emission in the manufacturing of the EV battery. It is worth
pointing out that with the continuous advancement in both manufacturing processes, where some
Original Equipment Manufacturers and Electric Vehicle producers are focusing on reducing the CO2
footprint (including with some using renewable energy during the manufacturing process), as well as
battery technology and the utilization of automotive batteries in second life applications, these figures
have already and will significantly further improve in the future in favour of EVs [2]. In fact, predictions
suggest a CO2 emission value of 15.53 g/km for EVs in 2050, excluding the operation of the vehicles [2]. In
the case of second life battery usage, the overall CO2 emitted from the aforementioned three phases is
distributed over a longer period and therefore the emission per km (or kWh) can be reduced further.
Figure 8: 2010 CO2 emission for ICE and EV for manufacturing, maintenance and decommissioning [2]

SEEV4-City: Final report Leicester City Hall
19
A 2019 study [3] found that a diesel car will have 217 gCO2/km direct emissions (combustion of diesel) and
27 gCO2/km indirect emissions (manufacturing). By contrast, a battery electric vehicle (BEV) has a total of
95 gCO2/km emissions, of which 55 gCO2/km relate to the emissions typically associated with generating
the electricity used to propel the EV, 40 gCO2/km are associated with the manufacture of the BEV and 16
gCO2/km are recovered when the battery is recycled. For the purposes of the SEEV4-City project these
more recent Hoekstra figures are used. Figure 9 shows a comparison taken from [3]. In practice the actual
BEV CO2 emissions will depend upon the relevant generation mix and the efficiency of the actual BEV being
considered. In this study we are provided with the BEV distance travelled and the energy consumed, so
the BEV efficiency may be directly calculated.
Figure 9: 2019 CO2 emission due to the operation of ICE and BEV [3]
The energy mix used for EV charging changes during the day, week and the season, and hence the CO2
emissions will accordingly change. Therefore, there are periods of low marginal gCO2/kWh, which usually
occur during off-peak periods (when low-carbon power plants are operated), as opposed to periods with
high marginal gCO2/kWh, which usually happen during peak times (when CO2 intensive power plants are
deployed). An example of this is given in Figure 10 which shows the daily CO2 emissions per kWh based
on the UK’s national energy mix for 09/11/2017 (winter day) [4].
Figure 10: Energy mix based CO2 emission for the UK on 09/11/2017 [4]
The energy mix based on the CO2 emission figures are obtained considering the lifetime CO2 emissions
values for the various generation types which are listed in Table 8. This demonstrate that the equivalent
CO2 emission per kWh imported from the grid varies significantly, depending on the generation mix at any
specific time. Therefore, CO2 emissions caused by EV operation can in principle be reduced by
implementing smart energy management and smart charging of EVs. Scheduling EV charging to occur
during off-peak periods with low-carbon generation and local PV generation will reduce overall CO2
emissions, maximize the energy autonomy and at the same time smooth the overall grid demand profile.
However, since all of the locally generated PV energy was consumed within the City Hall at all relevant
0
50
100
150
200
250
300
350
400
450
00
:00
:33
00
:55
:37
01
:50
:33
02
:45
:33
03
:40
:35
04
:35
:32
05
:30
:33
06
:25
:33
07
:20
:33
08
:15
:33
09
:10
:35
10
:05
:51
11
:00
:38
11
:56
:10
13
:17
:26
14
:16
:27
15
:05
:58
16
:00
:37
16
:55
:56
17
:50
:35
18
:45
:40
19
:40
:40
20
:35
:33
21
:30
:33
22
:25
:32
23
:20
:34
CO
2em
issi
on
(g/
kWh
)

SEEV4-City: Final report Leicester City Hall
20
times, overall the EVs must be considered as being charged solely from Grid energy. Over a year it is found
that ICE substitution by the 4 Leaf EVs yields a net saving of 4.09 tonnes, as demonstrated in Table 9.
At the commencement of the OP, annual EV charging at City Hall totalled 2,995.89 kWh corresponding to
annual ZE km of 25,111.5 at the calculated efficiency of 8.382 km/kWh. Therefore, ZE km improvement
factor over the project is an increase by 1.07x.
Table 8: Lifetime CO2 emission for different generation types [4]
Generation type Lifetime CO2 emission [g/kWh]
Wind 11
Nuclear 16
Hydro 20
PV 40
CCGT 487
OCGT 487
Oil 650
Coal 870
Table 9: Calculation of CO2 savings per year from ICE substitution
ICE to BEV replacement Value Unit
Diesel Car Fuel emissions 217 g CO2/km
Diesel Manufacturing emissions 27 g CO2/km
Total Diesel emissions 244 g CO2/km
2019 measured kWh charged 3196.24 kWh
Km driven with charged kWh (est) 26793.66 km
Measured EV energy use (Nissan Leaf) 8.38 km/kWh
UK average generation emissions 0.281715 kgCO2/kWh
EV driving emissions 33.6 g CO2/km
EV manufacturing emissions 40 g CO2/km
Saving if EV batteries fully recycled 16 g CO2/km
Net EV manufacturing emissions 24 g CO2/km
Saving if EV batteries fully recycled 16 g CO2/km
Net EV manufacturing emissions 24 g CO2/km
Total EV emissions 57.6 g CO2/km
ICE to BEV savings 186.39396 g CO2/km
Annual CO2 savings from ICE substitution 5 tons/year
CO2 from generation 0.9 tons/year
Before the commencement of the OP, all of the generated PV energy was consumed within the City Hall.
This remained the case during the OP so the additional energy used to charge the EVs was effectively all
imported from the Grid.

SEEV4-City: Final report Leicester City Hall
21
3.3.2. Energy Autonomy increase
Within the scope of SEEV4-City project, the energy autonomy is defined (in line with established literature
[5]) as energy self-sufficiency as expressed by equation (1) [6] and is illustrated in Figure 11. In the case
where PV is the only local production source, the energy storage (stationary or electric vehicle) is used to
store excess generation from the PV and supply this during the peak demand later in the day (see ES+ and
ES- in Figure 11). The difference between an EV and a stationary battery (apart from the potential size
difference) lies mainly with the fact that an EV (essentially used as a transportation vehicle) presents
constraints of availability and the associated SoC requirement before journeys.
𝐸𝑛𝑒𝑟𝑔𝑦 𝐴𝑢𝑡𝑜𝑛𝑜𝑚𝑦 =𝐴𝑚𝑜𝑢𝑛𝑡 𝑜𝑓 𝑙𝑜𝑐𝑎𝑙 𝑃𝑉 𝑝𝑟𝑜𝑑𝑢𝑐𝑡𝑖𝑜𝑛 𝑐𝑜𝑛𝑠𝑢𝑚𝑒𝑑
𝑇𝑜𝑡𝑎𝑙 𝑒𝑛𝑒𝑟𝑔𝑦 𝑐𝑜𝑛𝑠𝑢𝑚𝑒𝑑=
𝐶 + 𝐸𝑆+
𝐴 + 𝐶
(1)
Figure 11: Illustration of energy autonomy
3.3.3. Grid Investment Deferral
Due to the small scale of the Leicester City Hall pilot in terms of PV generation, 23 kWp, its output is
insignificant when compared with the measured Grid loading of the entire City Hall, which tends to peak
at some 200 kW. Similarly, there are four EVs which may be charged at 7 kW, again small in comparison
with the City Hall’s baseload. Accordingly, the degree to which these affect Grid investment deferral is not
significant. The City Hall has insufficient roof area to install a significant additional amount of PV
generation, and thus the renewables output will remain small, preventing significant reductions in peak
Grid demand and hence the need for Grid reinforcement.
3.3.4. EV transportation and charging patters
Due to the inherent variability of the use patterns of EV for transportation and their EV charging, modelling
of EV utilization patterns has been investigated. Although this issue has been widely discussed in the
literature, but there is still a lack of studies on the impact of different transportation usage patterns on
the optimal operation of EVs for Vehicle for Energy Services. The transportation and EV charging patterns
recorded here have been modelled using advanced hierarchical clustering and K-means clustering
methods to provide insight into the hidden issues in EV operation. Extensive scenario analysis is
performed with a variety of penetration rates and varied EVs to provide advice on the present and future
optimal operation of EVs for both transportation functions (the primary use function that has to be
satisfied first here for council staff) and the remaining potential for Vehicle for Energy Services (such as
Vehicle-to-Building and Vehicle-to-Grid).
SEEV4-City: Final report Leicester City Hall
22
4. Cost-Benefit Analysis
Generic Business Model
A cost-benefit analysis is the core of any business model and, in the context of the SEEV4-City project, this
must be conducted for each eV4ES service to evaluate the profitability of the required investment. The
structure of a generic business model for eV4ES is presented in Figure 13. According to the business model
actually adopted (baseline or the proposed one), there will be different stakeholders involved as well as
different costs or benefits for each stakeholder.
The user (City Hall) entities consist of the base load, PV, EV charger and the EVs under consideration here.
All of these are linked to the power grid (distribution and transmission) and the direction of energy flow is
as indicated in Figure 13 (black coloured arrows). Currently, the contract is signed between the user and
electricity retailer, which then links with the energy market (marked in green colour). In the future, when
V2B or V2G is carried out, and possibly energy storage in a stationary battery also takes place, more
stakeholders will be involved in eV4ES and these are coloured in red in Figure 13, where the blocks indicate
a commercial entity and the red dashed arrows show the associated ICT connections.
The aggregator shown in Figure 13 is the contractor/coordinator of EV energy; this role is currently not
present in the actual Leicester City Hall operational pilot, as the V2G function is technically unavailable
until the necessary hardware is installed and commissioned. The energy retailer in this case is responsible
for settling the transactions for base load with the user. The mobility retailer (for leased vehicles, for
instance) and the infrastructure provider are included in the structure and the OEM of EV is also included
in the value chain. Finally, policies of energy, transportation and environment can have direct or indirect
impact on the EV energy scheduling scenarios; however, since V2G still lies in the future these were not
considered in the business model.
It should be noted that the services provided by different stakeholders could be fully or partially combined
to achieve certain objectives for the stakeholders. In the Leicester City context it would be advantageous
for a number of participants in the city to amalgamate their resources such as energy storage and PV to
produce a sufficient level of output to enable participation in services such as Firm Frequency Response
(FFR), which require a minimum power output as a pre-condition.
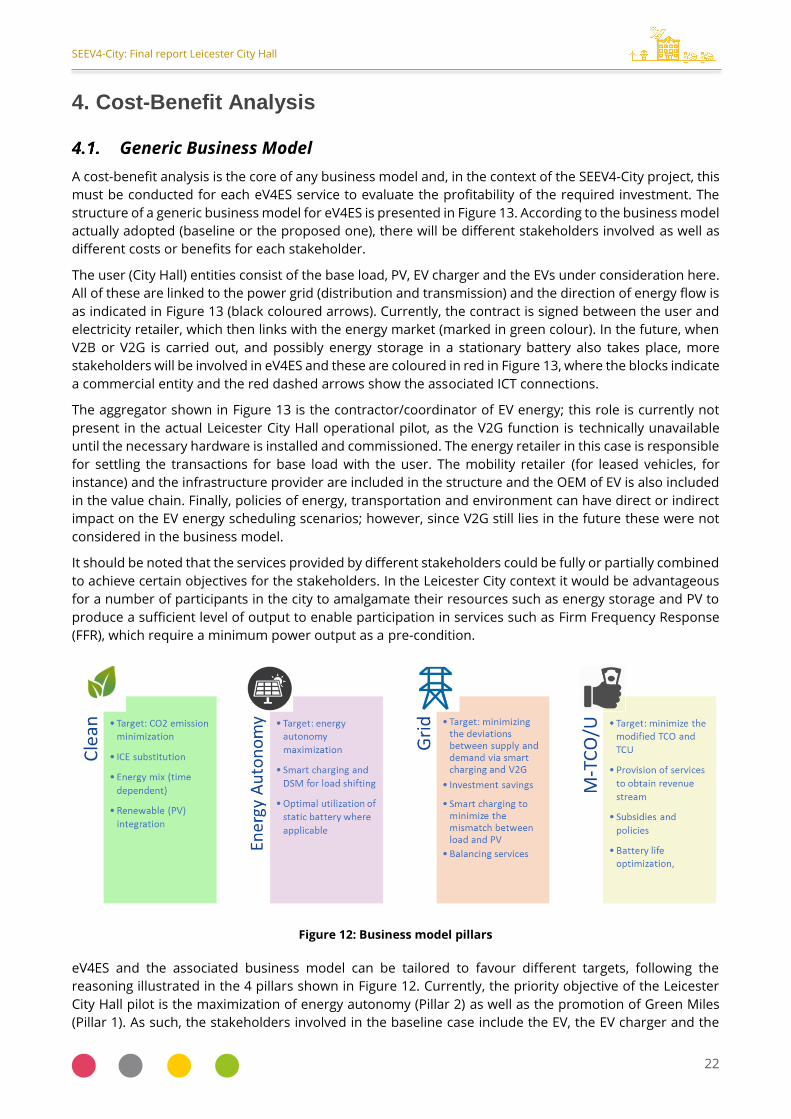
Figure 12: Business model pillars
eV4ES and the associated business model can be tailored to favour different targets, following the
reasoning illustrated in the 4 pillars shown in Figure 12. Currently, the priority objective of the Leicester
City Hall pilot is the maximization of energy autonomy (Pillar 2) as well as the promotion of Green Miles
(Pillar 1). As such, the stakeholders involved in the baseline case include the EV, the EV charger and the

SEEV4-City: Final report Leicester City Hall
23
retailer that is responsible for the billing of the energy consumption. V2G operation is not currently
implemented in this specific pilot. Leicester City Council pays for certified renewable energy as its mains
supply.
Figure 13: Generic business model structure for eV4ES
Specific Business Model
The Leicester operational pilot consists of a five-storey office (council headquarters) building with a roof-
top PV installation, four EVs and in the future associated V2G chargers, aiming to demonstrate controlled
and bi-directional charging at an office location, i.e. V2B/V2G, to increase energy autonomy and also the
share of clean km driven.
Table 10 lists the stakeholders that are involved in the pilot operation. The main stakeholder, Leicester
City Council, owns all the non-grid side assets - although some are still under procurement. The pilot
intends to maximise the use of PV energy to power the EVs, and so seeks to maximise the amount of ultra-
low km powered by local renewable generation, i.e. a virtual solar carport. To this end, the energy
management system (EMS, still under procurement) will need to be programmed to permit PV generation
to be prioritised in the following order:
1) EVs charging – when solar generation and EV demand coincide;
2) Charging of the stationary battery storage – to be confirmed if this will be procured;
3) Supply Leicester City Hall building demand;

SEEV4-City: Final report Leicester City Hall
24
4) Support the Grid – to gain revenue from Feed-in Tariff or firm frequency regulation (although this is
unlikely to happen due to the small scale of PV installation compared to the building consumption).
In addition, Western Power Distribution (WPD), the local distribution network operator, is another key
project stakeholder; they need to assess the grid impact due to EV charging requirement before tendering
for the associated equipment and integrating the energy generation/consumption.
Table 10: Stakeholders involved in the Leicester City Hall operational pilot
Roles Stakeholders
Building owner, EV owner, PV owner, smart/V2G owner,
stationary battery (TBC) owner
Leicester City Council
Smart/V2G charger provider Under procurement
Energy management system provider/operator Under procurement
Distribution network operator Western Power Distribution (WPD)
Current (derived) business model
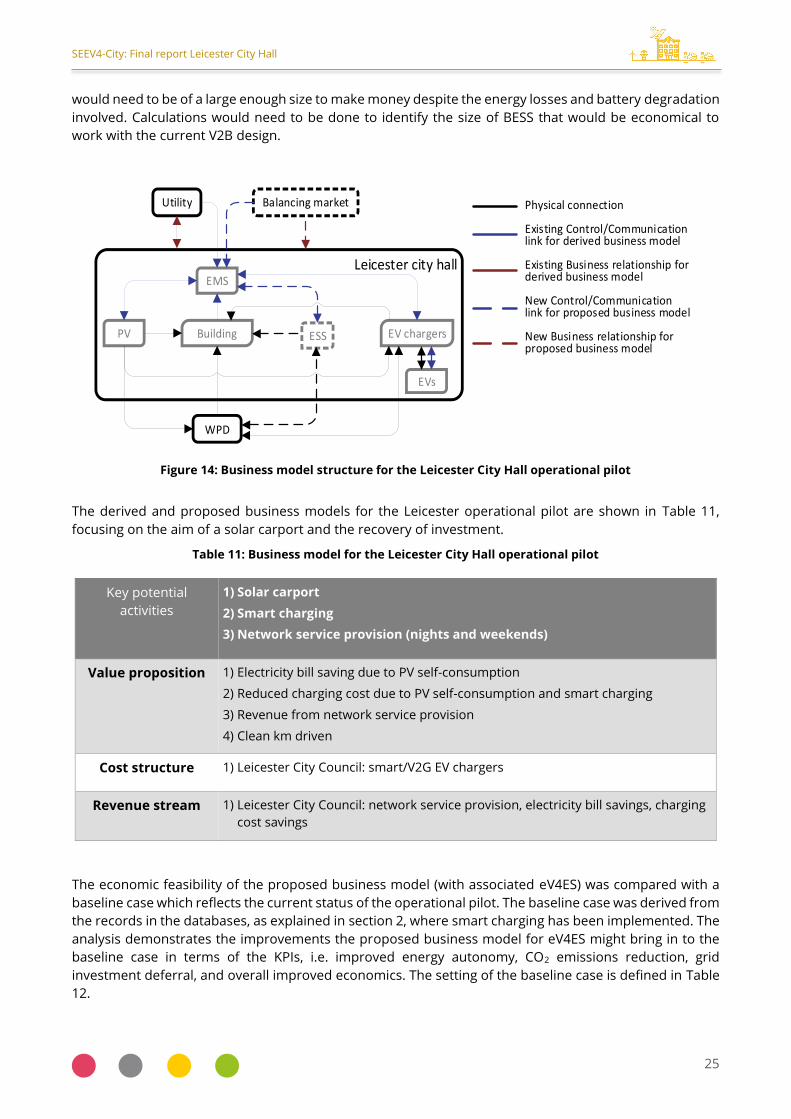
The business model structure that depicts the direction of flows of energy and communication signals, as
well as the associated commercial relationships between the abovementioned stakeholders, are derived
for the Leicester pilot and are illustrated in Figure 14.
It can be seen that the EMS is at the core for communication and control with different components in the
Leicester pilot, such as the power flow from the PV to the EVs and the building as part of the solar carport
as descripted above. Additionally, the EMS also controls the EV-charging profile by responding to the
dynamic price from the utility, in order to minimise the charging cost. There is a balance to be struck
between minimising charging costs and maximising the amount of charge, when an EV returns to City Hall
during a working day.
Proposed business model
As mentioned earlier, the V2G chargers have not yet been procured or installed, so no data is yet available.
When the V2G chargers will be in place with their function activated, the EVs could start to potentially bring
in extra revenue by network services provision (especially during nights and weekends when the EV are
mostly available), where the EMS plays the role of the aggregator to enter the balancing market. This is
the extra value proposition in the proposed business model, which is presented accordingly in Figure 14
by dashed lines. The Leicester City Hall V2B specification Includes the estimated annual generation from
the four project EVs discharging which is estimated to amount to some 15,000 kWh. Cenex UK think that
this estimate is valid. As per the current V2B design this amount represents a potential cost saving for City
Hall as it can replace peak period energy drawn from the mains. With a V2G system it might even prove
profitable to sell this amount for network services.
In addition, it is noted that a BESS is not considered in the derived business model since it has been
decided by Leicester that a BESS will not be part of the pilot installation. Another value proposition, in case
the additional BESS is installed later on – i.e. the proposed business model – would be the further savings
in electricity bill via energy arbitrage, which would in turn recover over time the return on the associated
investment. Stationary battery storage of c. 30 kWh size was originally considered for the Leicester OP;
fed from the PV to assist day time top-up charging & the principal overnight recharge. It was considered
that the installation would not provide value for money given the small size and the electrical losses with
the PV located on the 5th floor and the potential stationary battery storage location adjacent to the EVs,
although no calculations have been carried out to demonstrate this. Leicester City Council made their
decision entirely in the context of developing a V2B system, with no intended export to grid.
If ever the Council moved to V2G at City Hall or went for V2G at other locations, an added value proposition
could arise based on selling on BESS stored solar energy to the grid at peak energy times. Such a BESS
SEEV4-City: Final report Leicester City Hall
25
would need to be of a large enough size to make money despite the energy losses and battery degradation
involved. Calculations would need to be done to identify the size of BESS that would be economical to
work with the current V2B design.
Figure 14: Business model structure for the Leicester City Hall operational pilot
The derived and proposed business models for the Leicester operational pilot are shown in Table 11,
focusing on the aim of a solar carport and the recovery of investment.
Table 11: Business model for the Leicester City Hall operational pilot
Key potential
activities
1) Solar carport
2) Smart charging
3) Network service provision (nights and weekends)
Value proposition 1) Electricity bill saving due to PV self-consumption
2) Reduced charging cost due to PV self-consumption and smart charging
3) Revenue from network service provision
4) Clean km driven
Cost structure 1) Leicester City Council: smart/V2G EV chargers
Revenue stream 1) Leicester City Council: network service provision, electricity bill savings, charging
cost savings
The economic feasibility of the proposed business model (with associated eV4ES) was compared with a
baseline case which reflects the current status of the operational pilot. The baseline case was derived from
the records in the databases, as explained in section 2, where smart charging has been implemented. The
analysis demonstrates the improvements the proposed business model for eV4ES might bring in to the
baseline case in terms of the KPIs, i.e. improved energy autonomy, CO2 emissions reduction, grid
investment deferral, and overall improved economics. The setting of the baseline case is defined in Table
12.
EMS
WPD
PV EV chargers
EVs
Building
Utility Balancing market
Leicester city hall
Physical connection
Existing Control/Communication link for derived business model
Existing Business relationship for derived business model
New Control/Communication link for proposed business model
New Business relationship for proposed business model
ESS

SEEV4-City: Final report Leicester City Hall
26
Table 12: Baseline setting for the Leicester City Hall pilot
Variable Value Unit
PV system 23 kWp
Vehicle battery capacity 24/30 kWh
Original charging unit converter size 7.4 kW (fixed)
Proposed V2B charger size 7 (charge) 10 (discharge) kW (variable)
Electricity standing charge 173.064 p/day
Electricity tariff price (day) 14.5042 p/kWh
Electricity tariff price (night) 12.0202 p/kWh
Capacity Charge 1.05 £/kVA
Battery Degradation Cost 0.29C 5.9 p/kWh throughput
In terms of the renewable supporting scheme, the Leicester City Hall pilot does not benefit from the UK’s
Feed in Tariff (FiT) since it is not registered with it.
EV battery degradation cost
Both EV and stationary batteries are expensive assets (albeit decreasing in price over time over the past
decade at least and likely to do so further), and therefore need to be utilized in the most efficient way to
preserve their State of Health. Previous work suggested that extra degradation can be caused by providing
V2B/V2G [7]. As such, battery degradation is investigated in this section, and this is included in the eV4ES
business model.
Battery capacity reduction (fading) always occurs regardless whether the battery is exercised (cycle loss)
or not (calendar loss) [7]. Calendar degradation occurs even when a battery is not used, and it is a function
of the time of storage, the average SoC and the temperature during storage. Storage at a low temperature
in the absence of energy exchange is favourable, as is storage at a low SoC, since both these factors
represent stress factors (electrical and thermal), which promote degradation [8]. When the battery is used
to provide energy services, energy is stored (charging) in the battery or supplied (discharging) and the
battery is cycled at a certain charge/discharge rate. Performing a cycle at a high charge/discharge rate has
a more adverse impact than performing a cycle at a low charge rate [8]. Both calendar and cycle
degradation affect the available capacity of the battery.
The charge rate is usually normalised with respect to the battery's full capacity, which is known as the C-
rate. For example, a nC rate means that the battery can be fully charged or discharged in 1/n hours at this
current level. Thus, 1C represents the current to charge the battery from zero to full in 1 hour. This
normalisation helps to present the charging speed directly without considering the specific battery
capacity. The current V2B specification is for variable charging output of 7 kW maximum and variable
discharging output of 10 kW maximum. These rates represent less than C/2 for a 24 kWh Nissan Leaf
battery, and will count as relatively low C rates.
In the automotive industry standard practice, an EV battery reaches the end of its useful automotive life
when its maximum capacity falls below 80% of its nominal capacity when the battery was new. In this case,
the battery needs to be replaced, and may perhaps be used to provide stationary storage (as a second-
life application).
The research work carried out at Northumbria University has evaluated the effects of different factors that
contribute to battery degradation. Commercial battery cells are stored and cycled under different
conditions and their lifetime is measured in terms of number of cycles before reaching end of life (20% of
capacity degradation).

SEEV4-City: Final report Leicester City Hall
27
In the context of the SEEV4-City project, the C-rate, one of the factors which determines the energy
throughput, has been selected as the main stress factor along with temperature for the following analysis
of V2G. If the temperature and average SoC are kept reasonably constant, then the main determinant of
battery wear is the charge rate. The current V2B specification is for discharging down to minimum of 20%
SoC. This represents a realistic minimum to avoid excessive battery degradation.
The battery degradation model is:
C(Wh) = C0 - acWh (2)
Where ac = -2.54*10-8 x (4.98Tb -94.33) x (42.02*(mean SoC) +39.26) X (1.29*Cr +0.61)
Cr is the charge rate, and
Tb is the ambient temperature.
For SEEV4-City analysis, cells are tested using the experimental setting given in Table 13, where 2016
Nissan Leaf 32.5 Ah LiNiMnCoO2 EV pouch cells are cycled at 0.3C and 1C. It is known that, for Li-ion cells
of a given type, the degree of battery degradation per cycle is proportional to the C rate [9] [10]. The
experimental results enabled the production of a graph of cycling degradation vs charging rate. For these
tests, a full cycle means a discharge at a certain depth of discharge (DoD), followed by a charge at the
same DoD, so the average SoC remains constant.
Table 13: Experimental setting for battery testing
C-rate Temperature (°C) DoD(%) Battery type
0.3 C 25 80 EV pouch 33 Ah
chemistry LiNiMnCoO2 1 C
The test results are illustrated in Figure 15, where the capacity degradation is plotted against the number
of cycles under different C-rates.
Figure 15: Capacity degradation of Leaf cell due to cycling at 0.3C and 1C charging rates
The different slopes of the curves in Figure 15 indicate different degradation rates at the corresponding
C-rate, i.e. 0.3C and 1C. These two degradation rates are illustrated in Figure 15 against the C-rate they
were tested under, and a linear fitting, as expressed in Equation (3), is assumed [11] [9].
𝐷𝑒𝑔𝑟𝑎𝑑𝑎𝑡𝑖𝑜𝑛 𝑝𝑒𝑟 𝑐𝑦𝑐𝑙𝑒 (%) = 0.0067 × 𝐶 + 0.0122 (3)
0.0
20.0
40.0
60.0
80.0
100.0
120.0
0 200 400 600 800 1000 1200 1400 1600
%SO
H
Number of cycles
0.3 C
1 C

SEEV4-City: Final report Leicester City Hall
28
The EV battery degradation per cycle can be determined from Figure 16 given the C-rate, which could then
be used to calculate the number of cycles (as well as the lifetime energy throughput) before the end of
life.
As such, the cost of degradation can be achieved by dividing the cost of battery by the lifetime energy
throughput , Elife@C-rate, as expressed in Equation (4)
𝑐deg _𝐶 =𝑐𝑏
𝐸𝑙𝑖𝑓𝑒@𝐶−𝑟𝑎𝑡𝑒 [£/𝑘𝑊ℎ] (4)
Where cdeg_C is the degradation cost due to a specific charging rate and cb is the cost of the battery. The
specification for the V2B bidirectional chargers to be installed at Leicester City Hall is not yet available, but
the proposed rating of the EV charger will be 10 kW discharge and 7 kW charge. For the purposes of the
provision of grid services, only 7 kW is guaranteed to be available which translates to approximately 0.29
C for the Nissan Leaf battery (24 kWh capacity). This gives a degradation of 0.014% per cycle according to
Equation (3), which leads to a capability of 1429 cycles and an energy throughput of 49392 kWh before
the end of automotive life. The cost of commercial Lithium ion cells is currently (February 2020) in the
range of £121/kWh - $156/kWh and is expected to fall to $100/kWh (£78) by 2023 [12]. As such the current
battery degradation cost per kWh at 0.29 C for a Nissan Leaf battery can be estimated using Equation (3)
as 5.9 pence/kWh.
Figure 16: Extrapolation of the capacity loss against the charging rate from actual results
Smart charging methodology
eV4ES considered in this report cover smart charging and V2G. V2B is not provided in the proposed
business model due to the flat daytime/night-time tariffs (14.5042/12.0202 p/kWh) for the City Hall, which
prevents price arbitrage since the battery degradation cost, 5.9 p/kWh, exceeds the possible profit. In
contrast, V2G in the form of frequency regulation receives an extra payment for the service provision and
it is therefore provisionally evaluated in section 4.7.
The smart charging methodology presented in this section is designed to maximize energy autonomy,
which also reduces the CO2 emission by utilizing local renewable generation, and at the same time smooth
the demand profiles exchanged with the grid to a small degree. To this end, a smart charging methodology
was adopted, where the energy consumed due to driving is supposed to be recharged from PV upon
arrival at the City Hall.

SEEV4-City: Final report Leicester City Hall
29
Annual evaluation results
Following the discussion of the yearly data selection in Section 0 and the smart charging methodology
explained in the previous section, the improvement by smart charging compared to the baseline case is
presented here in terms of the SEEV4-City project KPIs and the operational cost of the pilot. As mentioned
in section 2.1, given the available data, City Hall charging was assumed to be the only charging method for
both weekdays and weekends.
Over the period 3/4/2018 to 29/03/2019 the energy used to charge EVs at City Hall totalled 3,196.24 kWh;
658.7 kWh for EV ‘7242’, 605.27 kWh for EV ‘7243’, 1,074.49 kWh for EV ‘7241’ and 857.78 kWh for EV ‘5132’.
In the similar period (1/4/2018 to 31/3/2019), PV generation was recorded as 8,406.91 kWh, but this figure
is possibly unreliable, given the annual PV generation figures for 2016 (18,123.00 kWh) and 2017
(16,622.00 kWh). The discrepancy is being investigated by Leicester City Council, and may well be due to a
faulty measuring device.
An example to illustrate the scheduling results from the smart charging methodology for EV ‘7242’, eight
consecutive days from the midnight of 18th February 2019 (Monday) to the midnight of 26th February 2019
(Tuesday) are considered, as shown in Figure 17. The EV’s availability, as illustrated by the green line in this
figure, presents 5 full arrival–departure cycles during the period of illustration, and the profiles for EV
smart charging is represented by the red curve. The PV generation is represented by the blue line. It is
evident that the charging for this period is not optimum in respect of using PV generation to power the
EV; the available PV from 21st to 24th February 2019 is not used, and due to the fixed charging rate of 7.4
kW, the power used to charge only one EV exceeds the solar output. A longer charge time at a lower charge
rate would allow greater absorption of the available solar energy. Variably rated (controlled) V2G chargers
are to be installed, which would allow charging at a lower rate for longer, and the use of the stored energy
for FFR via V2G thus improving the economics of the pilot, as well as improving the green miles and
reducing CO2 emissions.
In the context of the continuing roll out of EVs into their fleet, Leicester City Council are considering having
a 'bi-directional fleet' of Nissan Leaf EVs all with a battery size of 30 kWh or above. To meet operational
needs, longer charge times may not be available during the working day. However, starting the day with
a minimum of a 30 kWh battery should allow greater absorption of available solar energy by slower top-
up charging without range anxiety; particularly if average daily mileage does not increase much.
Figure 17: Charging scheduling of EV for energy autonomy maximization

SEEV4-City: Final report Leicester City Hall
30
Initial KPI evaluation results
1. City Hall
Leicester City Council provided figures for PV generation for the years 2016, 2017 and April 2018 to March
2019. The PV figures for 2018/19 were around half of those reported for the two calendar years, whilst the
annual mains consumption is nearly constant, as detailed in Table 14.
It has emerged that there is a problem with the new half hourly PV monitoring system at City Hall, whereby
the PV output is under recorded for 2018/9 onwards to address this problem, data for March, April and
May 2017 were used (1,396, 2,064 and 2,465 kWh respectively, totalling 5,955 kWh). The corresponding PV
output for a similar period in 2018/9 (5/3/2018 to 5/6/2018) was recorded as totalling only 2,684.5 kWh.
The ratio between these two amounts (2.22) was then used as a correction factor to adjust the actual
measured half hourly PV output figures.
For the City Hall, EA is taken to be self-sufficiency, defined as:
𝑆𝑒𝑙𝑓 − 𝑠𝑢𝑓𝑓𝑖𝑐𝑖𝑒𝑛𝑐𝑦 = 𝐴𝑚𝑜𝑢𝑛𝑡 𝑜𝑓 𝑙𝑜𝑐𝑎𝑙 𝑃𝑉 𝑝𝑟𝑜𝑑𝑢𝑐𝑡𝑖𝑜𝑛 𝑐𝑜𝑛𝑠𝑢𝑚𝑒𝑑 𝑜𝑛 𝑠𝑖𝑡𝑒
𝑇𝑜𝑡𝑎𝑙 𝑒𝑛𝑒𝑟𝑔𝑦 𝑢𝑠𝑒𝑑 𝑜𝑛 𝑠𝑖𝑡𝑒
Based on the corrected figures, EA can be established for the City Hall as shown in Table 14. A figure of
2% is obtained for 2016 and 2018/9; 1.9% being obtained for 2017.
Table 14: City Hall mains consumption, recorded PV output and EA, 2016, 2017 and 2018/9
Mains kWh Solar kWh Total Site Demand
kWh
EA %
2018/19 894,910.00 8,406.91(measured) 903,316.91 0.9
2018/19 894,910.00 18663.34 (corrected) 913573.34 2
2017 864,364.00 16,622.00 880,986.00 1.9
2016 871,730.20 18,123.00 889,853.20 2
The corrected values for 6/3/2018 to 21/5/2018 can then be taken to represent the unmeasured half
hourly 2017 values for PV output for the period from 6/3/2017 to 21/5/2017.
These corrected figures could then be compared to the known half hourly EV charging figures for the four
EVs over this particular period. This procedure permits identification of times when PV output coincides
with the charging of one or more EVs, see Figure 18, and hence determination of the amount of PV which
could actually be used to charge EVs in the virtual solar carport. During this period, 4,922.6 kWh of PV
energy was generated, of which 441.91 kWh was used to charge EVs in the solar carport. Total EV charging
in the period absorbed 1,527.44 kWh. The consumption of Leicester City Hall in this period was estimated
as 180,844 kWh excluding PV. Thus, self-consumption for Leicester City Hall for the period 6/3/2017 to
21/5/2017 was 2.65%; for the whole of 2017 the figure was 1.89%. A further example is given by the values
for the period 1st-29th March 2019, when total PV output after applying the above correction factor of 2.22
was 1245.5 kWh. In the same period only 521.6 kWh was used to charge the 4 EVs. Once again, PV output
was amply sufficient to provide for the charging of the EV fleet if the problem on non-synchronisation of
PV output with EV charging requirements could be overcome. A BESS could allow for a much greater
provision of EV charging energy than occurs at present.
2. Virtual Carport
For the virtual solar carport, self-sufficiency would be defined as:
𝑆𝑒𝑙𝑓 − 𝑠𝑢𝑓𝑓𝑖𝑐𝑖𝑒𝑛𝑐𝑦 = 𝐴𝑚𝑜𝑢𝑛𝑡 𝑜𝑓 𝑙𝑜𝑐𝑎𝑙 𝑃𝑉 𝑝𝑟𝑜𝑑𝑢𝑐𝑡𝑖𝑜𝑛 𝑢𝑠𝑒𝑑 𝑓𝑜𝑟 𝐸𝑉 𝑐ℎ𝑎𝑟𝑔𝑖𝑛𝑔
𝑇𝑜𝑡𝑎𝑙 𝑒𝑛𝑒𝑟𝑔𝑦 𝑢𝑠𝑒𝑑 𝑓𝑜𝑟 𝐸𝑉 𝑐ℎ𝑎𝑟𝑔𝑖𝑛𝑔

SEEV4-City: Final report Leicester City Hall
31
Resulting in a self-consumption value in the period 6/3/2017 to 21/5/2017 for the virtual carport of 28.9%,
increasing to 41% for the period of the 1st -29th March 2019 as EV use became established. KPI evaluation
results are given Table 15.
Figure 18: EV charging and PV output showing overlap
Table 15: Results for Leicester City Hall ‘Virtual Carport’ pilot
Variable Value Unit
Self - sufficiency of virtual carport 41 %
CO2 saved from ICE substitution 4.09 tonnes
CO2 emitted by grid charging 0.53 tonnes
CO2 emitted if fully charging from grid 0.9 tonnes
CO2 saved with the PV system 0.37 tonnes
The above figures relate to the current (derived) business model. With regards to grid impact analysis, the
PV generation and EV charging represent such a small proportion of the total Leceister City Hall baseload
that their effect on the grid is minimal even when optimised. However, a study was carried out on the
internal electrical system of Leceister City Hall to ascertain whether there are any bottlenecks which would
prevent more widespread adoption of EV charging and PV generation. For details please see Appendix (A).
The City Hall’s electrical distribution system experiences only a small degree of voltage variation, as the
system load varies from minimum to maximum. Given the statutory voltage limits of +10% to -6%, there
is scope for an increase in renewable generation and EV charging before a need for system reinforcement
would arise.
The current electricity system is strong enough to allocate PV generation, which is very small compared to
the building demand and also EV charging. An upscaling of PV (where possible with the roof-top spare size
capacity restrictions), EVs and installation of stationary storage would provide additional energy cost
savings. It will not be possible to increase the amount of PV generation at the Leicester City Hall due to
space constraints. Three more EVs are coming to Leceister City Hall although they will not be V2X capable.
However, Leceister City Council is considering phasing out the 24 kWh Leafs in the OP fleet and replacing
them with 30 kWh or larger battery vehicles. Adding BESS is a future possibility.
EV charging can be controlled with smart charging and/or V2B together with BESS, if this facility were to
be installed, to have a fully autonomous solar carport (100% self-sufficiency). As will be seen in section 4.9,
even without the provision of a BESS a considerable increase in the autonomy of the ‘Virtual Carport’ may
be achieved via Smart Charging, without adversely impacting the existing EV usage pattern. The (virtual)

SEEV4-City: Final report Leicester City Hall
32
solar carport at the baseline status (without smart charging or V2B), can achieve CO2 emissions savings
from ICE substitution and solar-charging.
V2G – Frequency Regulation provision
The SEEV4-City State-of-the-Art review identified frequency regulation as the currently most profitable
ancillary service in the UK, though the value and share of this market may shrink in the future; reasons for
this may be found in the State of the Art Report produced as part of this project. In addition, frequency
regulation requires shallower battery cycling compared to other V2G services such as peak shaving and
therefore is less harmful for the battery’s State of Health [9].
In addition to smart charging, as presented in the previous section, frequency regulation service provision
is investigated in this section as a V2G service, in terms of its associated technical requirements and
economic feasibility. 4 x 10 kW V2G chargers are planned to be installed at Leicester City Hall, so this
section deals with the economics of such operation once up and running. To carry out V2G it will be
necessary to have separate metering for the V2G chargers, because the City Hall baseload always exceeds
planned V2G output so without separate metering the V2G output would be ‘swamped’. Although the
Council is working on ways to reduce the baseload demand it will still exceed what can be discharged from
four EVs at City Hall - or even the discharge amount if all 12 spaces in this small car park had a bi-directional
charger. In future, as the cost of V2G bidirectional chargers falls, it may well become economic to attempt
to reduce the level of the City Hall peak demand via V2G; the peak demand level sets the Capacity Cost
which could be curtailed. In addition electrical power could be bought off peak at lower rates for use
during the peak period.
FFR was selected out of the three frequency response options in the UK, due to its tender based
procurement process and low entry capacity requirement, though again the value and share of this
market may change in the future. FFR in the UK exists in 2 main variants, Dynamic Firm Frequency
Response (DFFR) and Static Firm Frequency Response (SFFR) [13] SFFR is the simplest and most widely
used form of frequency balancing service in the UK. Participants agree to respond to a change in the
frequency from 50 Hz to 49.7 Hz or 50.3 Hz by exporting or importing energy for a period of up to 30
minutes [14] These events can be caused by power outages and tend to be irregular at between 7 and 12
times a year [13]. DFFR concentrates on managing the system frequency under normal operating
conditions and tracks precise grid frequency through high and low frequency periods.
Participants in DFFR are paid to both ramp up their load on the grid, i.e. increase their energy import as
well as ramping down, exporting energy, during times of frequency imbalance, to restore the grid to 50
Hz optimum operating frequency. They begin to deliver a response within 2 seconds and usually complete
their response within 10 seconds, although this can last for a few minutes.
Both types of FFR are procured via monthly tenders and the successful providers are rewarded with an
availability fee (a payment being made based on power committed and the period for which the
commitment is offered) and for DFFR a regulation energy fee (a payment based on the actual energy
consumed/provided). For SFFR the costs of energy interchange may be neglected, being infrequent. Table
16 summarises the tender details for the 2 types of FFR provision considered in this report, where the
primary dynamic frequency response with a response range of 0.2 Hz was selected, and compared to the
results of SFFR.
Firstly, for DFFR, the regulation asset for primary dynamic frequency response must respond within 2s
from the provision request and provide all of the power requested within 10s followed by continuous
provision for a further 30s. References [15] [16] have shown the technical feasibility of frequency
regulation provided by EV fleets. The FFR commitment period from 11 p.m. – 7 a.m. was an appropriate
time for the service to be contracted due to the compatibility with the user requirement for transportation
in the Leicester City Hall pilot. This was judged based on the historical data on EV GPS and driving data,
which showed that EV driving took place during office hours.

SEEV4-City: Final report Leicester City Hall
33
In addition, overnight primary FFR provision between 11 p.m. – 7 a.m. is currently deemed the most
valuable by the UK National Grid [17]. Under the current arrangements, the EVs are available for V2B
operations between 14 p.m. and 11 p.m. (The booking system shows no EVs booked out after 4 p.m.
although all four may not have returned & been connected until closer to 6.30 p.m.) Any V4ES duties must
allow all four to be fully charged by 7 a.m. the following morning. There would appear to be no reason
why the EVs could not be used after 11 p.m. provided that they were available with a full state of charge
at 7 a.m.
Table 16: FFR provision tender details
Value
Contracted period 11 p.m. – 7 a.m.
Annual contracted available hours @ 8h/day 2920
Annual available contracted amount (4 EVs) 4 x 7 x 2920 kWh = 81.76 0MWh
Contracted type Primary dynamic frequency response
Availability payment 23.03 £MW/h
Energy payment
(£/MWh)
Regulation up 𝑝𝑒 = 𝐸𝑟 ∗ 1.25 ∗ 𝑃𝑋𝑃 [18] [19]
Regulation down 𝑝𝑒 = 𝐸𝑟 ∗ 0.75 ∗ 𝑃𝑋𝑃
Contracted type Static Firm Frequency Response
Contracted period 11 p.m. – 7 a.m.
Availability payment £15.00 per MW/h
PV Cost and expected lifespan £42,000/25 years
Estimated unit cost of proposed V2B Unit £12,000
Estimated installation costs of V2B units £10,000
The contracted amount of power was set at the minimum of the EV discharging/charging rate of the V2G
units proposed to be installed in the City Hall (4 x 7/10 kW), and it was assumed that these EVs are part of
an aggregated balancing unit in order to meet the entry capacity requirement of 1.0 MW (but aggregation
costs were not considered here). The availability payment was obtained from a post-tender report in
November 2017 [18]. Energy payment symbolised by 𝑝𝑒 is calculated differently for regulation up and
regulation down as can be seen from Table 16, and 𝐸𝑟 is the energy absorbed from or injected into the
grid during FFR provision. PXP is the wholesale market index price.
The droop frequency control characteristic is illustrated in Figure 19, where the power requirement
responds linearly to the frequency deviation within 50±0.2 Hz, with a dead band of ±0.015 Hz. This would
require a variable rate EV charger, or variable numbers of EVs committed. The technical feasibility of the
former operation is supported by the current standard IEC 61851 in the form of 1 A-discrete modulation
[20].
As such, the annual economic evaluation for the period from March 2018 to March 2019 is shown in Table
17 with detailed cost and profit terms. FFR in this case is demonstrated to be profitable, ignoring capital
costs (as EV is already paid for the main use, which is transport), even when battery degradation cost is
considered as presented in section 4.3.

SEEV4-City: Final report Leicester City Hall
34
Figure 19: Droop frequency control characteristic
Table 17: Cost and benefit of DFFR provision
Annual Value
Availability annual payment (£) per EV 470.70
Energy annual payment (£) Regulation up per EV 95.70
Regulation down per EV 60.67
Battery annual degradation cost (£) per EV at 7 kW -219.00
Total annual cost benefit (£) per EV 286.06
Total annual cost benefit (£) 1144.24
Secondly for SFFR, as before, the FFR commitment period from 11 p.m. – 7 a.m. was an appropriate time
for the service to be contracted due to the compatibility with the user requirement for transportation in
the Leicester City Hall pilot. FFR providers can expect to be called upon some 7-12 times per year with an
estimated 6 hours of operation per year, with a maximum of 30 minutes per period of operation [13] [21]
. As each use involves only a small exchange of energy with the Grid (a maximum of 5 kWh with a 10-kW
charger over a period of 30 minutes), provision of FFR is only slightly harmful to the battery’s State of
Health. Accordingly, the aspect of battery degradation will be neglected. It appears that the UK current
average value of SFFR is £15/MW/h as of March 2020 [22]. Table 18 shows the cost benefit situation for
SFFR provision.
Table 18: Cost and benefit of SFFR provision
Annual Value
Availability annual payment (£) per EV 306.60
Battery degradation cost (£) per EV NIL
Total annual cost benefit (£) per EV 306.60
Total annual cost benefit (£) 4EVs 1226.40
It is found that the net financial benefits of SFFR and DFRR are virtually the same, SFFR having a very slight
advantage. However, in order to operate DFFR the hardware requirements are more stringent [14] and
thus more expensive, so for the purposes of this report SFRR is to be preferred.
Investment/ return analysis
The cost and benefit analysis is presented in this section in terms of the NPV, for the proposed business
model, which includes proposed V2G via FFR provision. The assumed lifetime of the V2G bi-directional

SEEV4-City: Final report Leicester City Hall
35
chargers is as per industry standards. In the Leicester City Hall operational pilot the cost of the PV
installation is not relevant, since it was present prior to the commencement of the SEEV-4 project.
The costs of the V2G chargers are not definitely known at present, but In September 2019 Cenex UK
estimated that the V2B units would cost approximately £12,000 each, including hardware and software.
Thus the intended four chargers would cost some £50,000, plus some £10,000 for associated civils, etc;
i.e. approximately £60,000/ (€67,000) in total. Precise numerical calculations cannot yet be carried out as
the costs are only estimates from several months ago, prior to actual tendering and procurement.
However, on the understanding that four 7/10 kW bi-directional chargers will be used, it is possible to
discuss the likely financial implications of this part of the project in terms of the NPV. If at the
commencement of a project the NPV is positive, the project is deemed financially viable.
FFR is thought to be the most profitable ancillary service in the UK for EVs, though the value and share of
this market may shrink in the future. FFR requires shallower battery cycling compared to other V2G
services such as peak shaving. The financial implications of FFR service provision are investigated here, in
terms of economic feasibility. To carry out V2G it will be necessary to have separate metering for the V2G
chargers, because the City Hall baseload always exceeds the proposed V2G output so without separate
metering the V2G output would be ‘swamped’.
On the basis that each FFR intervention will last for at most 30 minutes, the maximum energy to be
supplied per intervention is merely 5 kWh, with a 10 kW charger. It is felt that perhaps 10 such
interventions per year will have a negligible effect on EV battery life even with the smaller 24 kWh Leaf EV.
The limiting factor in attempting to obtain revenue from FFR is the V2G charger capacity, and not the size
of the EV battery. Newer models of the Nissan Leaf are now available with batteries of 40 and 62 kWh,
whose guarantee is not affected by carrying out V2G operations.
Replacement of the existing EVs with newer equivalents with a larger battery pack will not in itself increase
the revenue available from FFR. However, it is felt that FFR revenues are falling over time due to
competition [22] and it is impossible to guarantee that future income streams will be maintained.
Alternative V2G propositions may become economic, involving a larger amount of energy exchange, and
in these circumstances EVs with a larger capacity battery may be at an advantage.
NPV was used in this report to analyse the profitability of the Leicester City Hall pilot, being an international
industry standard method for conducting such an assessment. NPV provides the current monetary value
of a potential investment project by converting the yearly cash flow throughout its lifetime to the present
value using a discount rate. An investment with a positive NPV will be profitable, prior to the non-
accounted aggregation costs, whereas an investment with a negative NPV will result in a net loss [23] PV
is defined by Equation (5):
𝑁𝑃𝑉 = ∑𝑌𝑒𝑎𝑟𝑙𝑦 𝑐𝑎𝑠ℎ 𝑓𝑙𝑜𝑤
(1+𝑟)𝑖− 𝐼𝑛𝑣𝑒𝑠𝑡𝑚𝑒𝑛𝑡𝑁
𝑖=1 (5)
where the yearly cash flow during the investment lifetime of N (N=10 in this case) years is converted to the
present value using a discount rate, r, of 2% [24]. The investment and return terms are detailed in Table
10 for three cases, namely the baseline, smart charging and eV4ES which includes additional FFR provision
in addition to smart charging.
The precise cost of the 4 V2G chargers is not known at present, since tendering is continuing. What can
be done is to start from the annual revenue accruing from SFFR (see Figure 19) and calculate from this
figure the maximum present investment cost for the project to be economic.
Certain assumptions must be made:
For the purposes of the following calculation, based on observed usage patterns, it is assumed
that the 4 Nissan Leaf EVs based at Leicester City Hall can without inconvenience be each be
parked there connected to a bidirectional 7/10 kW EV charger between the hours of 11 p.m. and
7 a.m. daily;

SEEV4-City: Final report Leicester City Hall
36
The services of an aggregator are available. The costs of the provision of the aggregation service
are not included in this calculation;
The rate of interest applicable is 2% [24]. Given the present unstable economic position this is felt
to be reasonable;
The lifetime of the proposed bi-directional charging equipment is 10 years;
The most profitable form of V2G is FFR;
V2G induced battery degradation in the 4 Nissan Leaf EVs will be small, accordingly its financial
effects have been ignored.
Calculation
4 EVs connected via 7/10 Kw bi-directional chargers for 8 hours daily = 81760 kW/h yearly, given that the
charging rate and the discharging rates differ, the lower rate is used here.
At £15 per MW/h [22] annual revenue/cash flow = £ 1226.40
NPV of an investment is given by the formula (5):
𝑁𝑃𝑉 = ∑𝑌𝑒𝑎𝑟𝑙𝑦 𝑐𝑎𝑠ℎ 𝑓𝑙𝑜𝑤
(1 + 𝑟)𝑖− 𝐼𝑛𝑣𝑒𝑠𝑡𝑚𝑒𝑛𝑡
𝑁
𝑖=1
For an investment to be just profitable, one can rearrange this with NPV=0:
𝐼𝑛𝑣𝑒𝑠𝑡𝑚𝑒𝑛𝑡 = ∑𝑌𝑒𝑎𝑟𝑙𝑦 𝑐𝑎𝑠ℎ 𝑓𝑙𝑜𝑤
(1 + 𝑟)𝑖
𝑁
𝑖=1
We have assumed that N=10 annual revenue = £1226.40 and r=2%.
Therefore, required investment should not exceed £11015.90. Anything larger than this will result in
negative NPV.
Application of Smart Charging
As may be seen from Figure 5, the output of the PV system never approaches the minimum demand from
the City Hall. This has two results, firstly that no export of PV energy is realistic under present conditions
since any such export will serve to increase grid energy importation to compensate, and secondly that is
difficult to increase EA by means of energy storage, since there is never a time when grid importation may
be dispensed with.
It would be of interest to examine the possibility of using the PV energy to directly charge the EVs based
at City Hall. A ‘Virtual Carport’ is proposed, which could notionally exist even though the City Hall system
is not in fact connected to allow such a thing.
Given that figures for PV output and EV charging are available, one can determine the performance of the
system which would exist if the EV chargers were given first call on the output of the PV system, and the
degree of EA arising within the ‘Virtual Carport’ examined. It would also be interesting to examine the
degree to which the performance of the ‘Virtual Carport’ could be augmented by arranging the EV charging
pattern to best match the available PV output. For the purpose of this study the PV output figures were
corrected by a factor of 2.22 as discussed in section 4.6 to take into account of the error occurring in the
measurement system.
Improvement in the performance of the ‘Virtual Carport’ can be achieved by considering that when the
EVs are charging; they tend not to do so when PV output is at a maximum. The EVs are connected, typically,
for a much longer period than is required to achieve the amount of charging required. Advantage may be
taken of this fact to calculate the amount of PV energy which could be absorbed by the EVs if their charging
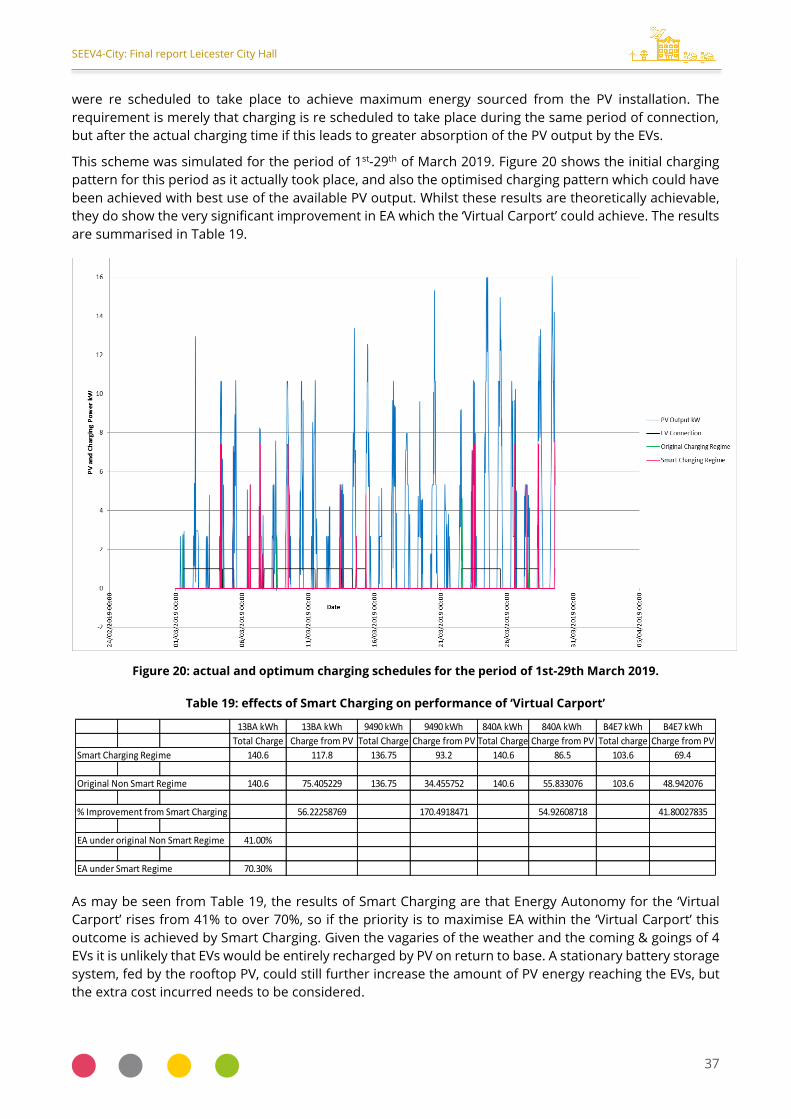
SEEV4-City: Final report Leicester City Hall
37
were re scheduled to take place to achieve maximum energy sourced from the PV installation. The
requirement is merely that charging is re scheduled to take place during the same period of connection,
but after the actual charging time if this leads to greater absorption of the PV output by the EVs.
This scheme was simulated for the period of 1st-29th of March 2019. Figure 20 shows the initial charging
pattern for this period as it actually took place, and also the optimised charging pattern which could have
been achieved with best use of the available PV output. Whilst these results are theoretically achievable,
they do show the very significant improvement in EA which the ‘Virtual Carport’ could achieve. The results
are summarised in Table 19.
Figure 20: actual and optimum charging schedules for the period of 1st-29th March 2019.
Table 19: effects of Smart Charging on performance of ‘Virtual Carport’
As may be seen from Table 19, the results of Smart Charging are that Energy Autonomy for the ‘Virtual
Carport’ rises from 41% to over 70%, so if the priority is to maximise EA within the ‘Virtual Carport’ this
outcome is achieved by Smart Charging. Given the vagaries of the weather and the coming & goings of 4
EVs it is unlikely that EVs would be entirely recharged by PV on return to base. A stationary battery storage
system, fed by the rooftop PV, could still further increase the amount of PV energy reaching the EVs, but
the extra cost incurred needs to be considered.
13BA kWh 13BA kWh 9490 kWh 9490 kWh 840A kWh 840A kWh B4E7 kWh B4E7 kWh
Total Charge Charge from PV Total Charge Charge from PV Total Charge Charge from PV Total charge Charge from PV
Smart Charging Regime 140.6 117.8 136.75 93.2 140.6 86.5 103.6 69.4
Original Non Smart Regime 140.6 75.405229 136.75 34.455752 140.6 55.833076 103.6 48.942076
% Improvement from Smart Charging 56.22258769 170.4918471 54.92608718 41.80027835
EA under original Non Smart Regime 41.00%
EA under Smart Regime 70.30%

SEEV4-City: Final report Leicester City Hall
38
5. Data mining to identify types of EV use behaviour
Data collected from the charging points for 2018/9 was analysed to determine the charging behaviour of
EVs users, the utilization of the chargers and level of charging energy. Five features for each charging
behaviour were defined, as listed in the first column in Table 20. Because the units of each feature are of
a different nature and in order to represent them together as a data series that reflects the charging
behaviour, all values are normalized. The maximum value that any normalized data can take is 1, and the
minimum value is 0, and this has a different meaning for each feature. For example, the third feature in
the database is the charging duration, which is displayed in the clustering profiles (Table 20) as "C”. A high
value of C means a longer connection time of the EV to the charging point. Processing of data representing
the charging behaviour of the EVs is illustrated in Figure 20.
As shown in Figure 21, analysis of the charging behaviour is performed in five steps. In the first step, the
data related to the charging events of EVs is normalized to form a coherent series of data sets. In the
second step, the series of data sets are clustered by the k-means method, then the self-distribution table
of EVs is determined in the third step. In sub-step 3, the percentage of EVs impact factor obtained by
performing a new clustering on the table of the main found in step 3. In step 4, the cross-distribution table
of EVs is calculated, using the results of the second step. In a sub-step of step 4, the percentage of vehicle
penetration is obtained by performing a new clustering on the table of the main found in step 4. In step
5, the decision tree is constructed based on the results found in step 2. Based on the balance coefficients
and error coefficients obtained from the decision tree, practical features in clustering the events of EVs
are determined.
Table 20: Charging information database
Name in the Database Symbol in Clustering
profiles
Interpretation of
High Value
Interpretation of
Low Value
Charging start time A End of the day Beginning of the day
Charging stop time B End of the day Beginning of the day
Charging duration C Connect to charging
point for longer
Connect to charging point in
a shorter time
Energy D High amount of charging Low amount of charging
Useful time ratio E Low idle time High idle time
With the reference to Figure 19, the following equation is used to normalize EV charging data:
-min
max -min
F FFN
F F (6)
Where F is the charging data of electric vehicles, which can be the charging start time, charging stop
time, charging duration, the transferred energy, and the useful time ratio.
FN is the normalized value of F,
MaxF is maximum value of F and
MinF is minimum value of F.
After calculating the normalized values of all data available, a data series for the charging behaviour is
created by putting all 5 features together. The existing 1,178 data series are separated into four groups
(clusters) by the K-mean method [25] as shown in Figure 22.

SEEV4-City: Final report Leicester City Hall
39
Figure 21: Charging behaviour detection structure
Each group represent a unique charging behaviour of a cluster of EV charging events. By calculating the
average of each cluster, the characteristics curve of that cluster is obtained which is shown in Figure 23.
Please note that there are 266, 490, 179 and 243 events in cluster 1, cluster 2, cluster 3 and cluster 4,
respectively.

SEEV4-City: Final report Leicester City Hall
40
Figure 22: K-Means Clustering of Profiles
The characteristics curve of cluster 1 (see Figure 23) show that feature A is less than 0.5, which means that
EVs are likely to be connected to the charger early in the day. Feature B is more than 0.5 (one in this case),
which indicates that EVs are disconnected from the charger at the end of the day. Feature C has the lowest
possible value, indicating a relatively short connection time of EV to the charging point. Feature D indicates
the amount of energy exchanged with the electrical network (upstream grid) and is below 0.5, which
means a relatively low energy exchange for charging. This feature (D) in the characteristics curves is about
the same for all clusters (within a narrow range). Feature E shows the ratio of useful time during the
connection of the EVs to the charging point. This has a high value in cluster 1, which indicates a low idle
time (i.e. the EV was charging most of the time when it was connected to the charger).
As a reality check, Leicester City Council advise that the EVs start a working day still connected to the
charging points, from the previous evening's recharge. EVs are not physically disconnected from the
chargers until first use in the day. Their recharging from the previous day will be complete by mid-late
evening latest on the previous day. Day time top-up charges between trips maybe relatively short,
exchange less energy than the principal recharge in the evening, and have the EV charging for most of the
time it is connected to the charger. This is by comparison with the evening recharge, where an EV could
be fully charged by 9 p.m. but not used until onwards from c. 8 a.m. the following morning,

SEEV4-City: Final report Leicester City Hall
41
Figure 23: Characteristics curve for K-Means Clustering of Profiles
The distribution weight of each EV charging event in each cluster is calculated, and results obtained are
given in Table 21 and shown in Figure 23. The profile of each EV may be considered as a new feature for
the relevance of each EV in the four clusters performed. These show that EV 5132 is most effective in
forming the characteristic curve behaviour for cluster 3 whilst EV 7241, EV 7242 and EV 7243 were more
effective than EV 5132 in forming the characteristic curve for clusters 4. That is, the former has a different
charging behaviour and the last three have more common charging behaviour.
It is clear that EV 5132 charging behaviour is different from the others, which is due to a small number of
charging events for EV 5132 at the City Hall (i.e., this EV is likely charging in other places too).
Table 21: Penetration rate of EVs in each cluster
RFID EV Cluster 1 Cluster 2 Cluster 3 Cluster 4 Sum
840ABFDA 7241 19.10 37.01 16.11 27.76 100
13BA876A 7242 22.04 38.65 15.01 24.28 100
B4E7BADA 7243 29.06 38.93 12.53 19.46 100
9490BCDA 5132 15.49 63.87 20 0.64 100
Figure 24 shows that a small number of EV 5132 charging events have been involved in cluster formation.
The difference between the two new clustering groups is related to cluster 4, where EV 5132 has less
penetration than the other 3 EVs.

SEEV4-City: Final report Leicester City Hall
42
Figure 24: K-Means clustering of self-distribution data
Then the new clustering is performed after calculating the cross-distribution shown in Figure 21. This
clustering is also a k-means method, and the results are shown in Table 22.
Table 22: Impact rate of EVs in each cluster
RFID EV Cluster 1 Cluster 2 Cluster 3 Cluster 4
840ABFDA 7241 24.06 25.31 30.16 38.27
13BA876A 7242 25.94 24.70 26.25 31.27
B4E7BADA 7243 40.97 29.80 26.25 30.04
9490BCDA 5132 15.49 63.87 20 0.64
Sum 100 100 100 100
Figure 25 shows that EV 7241 was most effective in forming the characteristic curve behaviour for cluster
1 and 2. Also, EV 7242 and EV 7243 were more effective than EV 5132 in forming the characteristic curve
for cluster 4. EV 7241 and 7242 are less effective in forming characteristic curve for cluster 1. In other
words, EV 7241 and EV 7242 treats like each other due to cluster 1 and cluster 4. Also EV 7243 and EV 5132
treats like each other due to cluster 2 and cluster 3.

SEEV4-City: Final report Leicester City Hall
43
Figure 25: K-Means clustering of cross-distribution data
EV use and charging behaviour prediction for V2G and G2V operation can be achieved using a decision
tree, such as shown in Figure 26. The relative importance of the various features is shown in Figure 27.
The weighted coefficients calculated from Figure 26 obtained from the decision tree method show which
feature has the most impact on the separation of clusters from others. The results are displayed in Figure
27.

SEEV4-City: Final report Leicester City Hall
44
Figure 26: binary decision tree for classifying
As shown in Figure 27, the C and E features have the most significant impact on the difference in EV
charging behaviour recorded in the Leicester City Hall pilot (baseline). Based on Figure 24 and Figure 25,
these characteristics (C and E) give rise to a charge behaviour difference for the EV5132 compared to the
other three. In other words, how to deal with EV 5132 for charging is different from the other three EVs.
Figure 27: feature importance of separating clusters
Practical Application
Data mining allows:
The critical identification of driver or ‘EV use’ behaviour (where there are multiple users in a pool
as in this case) in terms of transportation use and re-charging provides key features in cluster

SEEV4-City: Final report Leicester City Hall
45
formation such as the ideal time and duration required to connect the EV to electricity supply from
the electricity/energy dimension perspective, which is important for defining smart charging, V2B
or V2G operation.
The assessment of EV use during cluster formation gives information about the availability of the
EV for V4ES. Further, EV use together with the driver behaviour provides information that may be
used to demonstrate how many drivers or ‘EV use’ events share similar characteristics, in order to
categorize them appropriately and gain better understanding on profiling of EV drivers and use.
Such profiling may be used to the development of optimization criteria for the use of EVs, from
the driver’s perspective and their charging from an electricity/energy perspective. In this case, no
information is reasonably available about the EV drivers (there is a log-book, but it was not
accessible to the researchers).
The primary purpose of the four EVs in this operational pilot is to provide mobility for the staff members
using the pooled EVs for carrying out their work. The provision of eV4ES is a subsidiary factor, and it is not
considered feasible to limit the use of an EV for transportation merely to facilitate eV4ES. Accordingly, it
will be most useful to establish which EV(s) and which usage pattern (staff work routines) is (are) most
applicable for eV4ES. Considering Figure 22, the algorithm enables one to establish that there are four
differing patterns of use/ charging behaviour amongst the EVs. For eV4ES it is desirable to have as long a
connection period as possible, to enable smart charging using as much PV as possible, and to maximize
the potential to carry out V2G services. A favourable duration of connection during the day is
demonstrated by Cluster three; this is the only one which is associated with a long period of connection
between the EV and the charger. Clusters one and four display a low (i.e. poor) period of connection, and
cluster two only a short period of connection. Thus, from the point of view of eV4ES only, the behaviour
displayed by cluster three is really useful from the point of view of maximising PV energy use for charging
in the ‘Virtual Carport’.
The EVs remain somewhat underutilised, but as they are used for transport by daytime workers their
daytime connections will always be much shorter than the overnight connection time, which could last
from 4 p.m. to 8 a.m.+ the following day. During their working day it may be counter-productive to use the
EV discharging function, but using variable charging rates to maximise the amount of PV energy reaching
the EVs would be a useful option. Earlier in section 4.8, a V2G (FFR) commitment period from 11 p.m. to 7
a.m. was seen as an appropriate time for V4ES services to be contracted, as it was correctly identified that
the EVs are only away from base during office hours. It may be that EV ‘5132’ has longer day time layovers
than the others, but it has been confirmed that its principal charging location is City Hall, like the rest. For
the future, Leicester City Council are considering having a 'bi-directional fleet' comprised entirely of Nissan
Leaf EVs with batteries of 30 kWh or more.
The technique allows further analysis. Given that cluster three is the desirable form of connection
behaviour for eV4ES, Table 21 shows that only EV 5132 significantly conforms to the desirable behaviour.
Therefore, this EV (5132) is the one most likely to prove useful for smart charging, V2G and other forms of
eV4ES. Table 21 also demonstrates that the other three EVs (7241, 7242 and 7243) fail to conform to the
desirable charger connection behaviour during the day. Given that EV usage patterns are not to be
interfered with (as this is their primary use for work routines), these three EVs will prove of limited use to
provide eV4ES. Thus, attention should be concentrated on the behaviour displayed by EV 5132.
Given that EV 7241 is a 30 kWh vehicle, and the others are all of 24 kWh battery capacity, one finds from
use of the algorithm that the maximum benefit would be obtained by exchanging EV 5132 for EV 7241
with regard to charger connection (and thus likely routinised use), to allow the EV with the largest capacity
battery to be in the position to carry out the most eV4ES service. This will result in the best use of the EV
battery, the maximum storage available for PV energy and the least amount of battery degradation (if V2G
is done properly, by avoiding discharging the EV batteries to a low SoC, or by letting them remain for
protracted periods with a fully charged battery).

SEEV4-City: Final report Leicester City Hall
46
6. Lessons learnt from the different pilot phases
Preparation and initiation
Finding the right location
In comparison to initial expectations, significant delays were experienced in the preparation and initiation,
mainly due to two site relocations and resource constraints. For the first prospective building owned by
the municipality, conflicting plans had emerged for it to be potentially sold. Consequently, it was no longer
a good candidate site to install new equipment there. The pilot lost approximately a year of preparation
time allocating the eventual site location. The second site option was a multi-storey car park in the city
centre. Efforts were made in the building assessment including a baseline document. The carpark would
need a PV system that could have been added by installing solar portals on the roof of the carpark.
However, because of the novelty of this approach it was determined that the time needed to get planning
consent would cause significant further delays. Considering the loss of time on the first location, the pilot
manager did not want to take any risk and searched for another location. Which led them to the Leicester
City Hall as the definitive location of this operational pilot. The site already has 90 solar panels (23.4 kWp)
on its roof and provides 2,5% of the City Hall’s electricity consumption. Leicester City Council are now
developing a scheme for this car park to add a 85 kWp PV array. This will supply energy to conventional
charge points at the car park - but also has the potential for future development along the lines of the
derived or proposed business models of this report.
In preparation to the tender, the pilot manager attended workshops and visited other operational pilots
to gain knowledge concerning the V2X technology and the required components. This learning process
was deemed very valuable in the preparation phase.
Battery considerations
A 24 kWh battery storage system was considered to boost the pilot’s energy autonomy. However, the
evening discharge from EV batteries is expected to have a bigger impact on energy autonomy. It is
estimated that the average daily discharge available from the four EVs is some 60 kWh. When considering
the extra costs and complexity of adding storage as well as the energy losses from PV to storage to EV,
this element was not considered to be value for money.
Anticipating on a growing EV fleet
Due to the expected growth of EVs in the fleet, Leicester City Council decided not to replace its five
unidirectional charge point but to add four bi-directional units. Additionally, Leicester City Council are
considering a fleet of Leafs all having a battery capacity of 30 kWh or more, to work with the V2B chargers.
Procurement
Organisational engagement
Alignment with and engagement of relevant stakeholders within the internal organisation, such as with
the Facility Management team/department of Leicester City Council, was one of the biggest challenges in
the Leicester pilot, once choosing the City Hall as the OP location. There is a high dependency for the
project on this council team/department, because of the existing technical knowledge of the building, and
because of this, also need to provide the necessary permissions for changes. An additional factor, was
that during the timeframe of the SEEV4-City project, the Facilities Management team/department
underwent a major review and included the loss of some staff who were key to the project. The fact that
those responsible for managing the pilot were not positioned within the parts of the organisation that
have key information and decision-making power, added to the complexity to achieving the
comprehensive alignment for this relatively small, yet innovative project. For example, for a long time it

SEEV4-City: Final report Leicester City Hall
47
was expected that the V2X system could incorporate the building management system to provide mains
supply and solar generation data. Some steps were already taken towards this end before it became clear
that this would not be contractually possible with the building management system. With no time to
consider re-opening this contract, an alternative solution had to be found. Leicester City Council was well
supported by technical advice from Cenex UK to identify a way to operate V2X system independent of the
building management system. In the summer of 2019, an electrical engineer from Arcadis was procured
to help the pilot get started.
CE certification
In earlier days, only a limited number of manufacturers were producing or developing V2X units. At this
stage, not all the units were carrying a CE mark. Leicester City Council’s ICT procurement department
needed assurance from manufacturers that the units proposed will get a CE certification and would have
resulted in delays (had it not been for already existing delays). One possible advantage of the project’s
delays is the improved availability of V2X units that are carrying a CE mark.
Implementation and installation
The bi-directional charging installation is due to be installed. Tendering is under way but the authors
understand that no concrete information will be available within the timescale of the present SEEV4-City
project. Leicester City Council advise that they are currently expecting to go to market in the second half
of September 2020. This would mean a contract could be in the books around the end of October, but an
operational date looks to be taking as long as at the back end of 2020/21.
Operation
The bi-directional charging installation is set to be installed. It will be necessary to form a business
relationship with an aggregator in order to actually carry out V2G, and the type of V2G service to be
adopted is not yet decided upon. FFR is a likely candidate for adoption. In the meantime Vehicle to Building
(V2B) operations will be undertaken to increase the amount of PV energy utilised in EV charging and to
increase Energy Autonomy. The economics of V2B are not favourable. The installation cost must not
exceed £11,015.90 to avoid a negative NPV; we understand that the actual installation costs of the V2B
system will be in of the order of £60,000 so in financial terms a foreseeable (financial) Return on
Investment is considered as a loss.

SEEV4-City: Final report Leicester City Hall
48
7. Conclusions and Recommendations
Key messages
Based on the results achieved from the Leicester pilot, the following key messages can be drawn:
Smart charging demonstrates an improvement in the KPIs set in the SEEV4-City project, namely,
energy autonomy, CO2 emission reduction, and lower operational cost compared to the baseline.
The achievable energy autonomy and the associated CO2 emission savings depend on the season
and weather conditions, and therefore show variations accordingly.
DFFR is profitable even when the battery degradation was taken into account. However, the
technically simpler SFFR offers a virtually identical profit. The commitment for this service
provision, i.e. the EV being available for the contracted period of 11 p.m. – 7 a.m., is unlikely to
conflict with user’s requirements, there being no overnight journeys.
FFR provision, if applicable and enabled, would produce an estimated revenue of £286.06 per year
per EV. A combination of profitable services would make the most economically rewarding
solution to the eV4ES business model. Using NPV techniques it may be shown that for the
proposed V2G installation to be profitable, the investment cost should not exceed £11015.90.
Given that EV 7241 is a 30 kWh vehicle, and the others are all of 24 kWh battery capacity, one finds
from use of the algorithm that the maximum benefit would be obtained by exchanging EV 5132
for EV 7241 with regard to charger connection (and thus likely routinised use), to allow the EV with
the largest capacity battery to be in the position to carry out the most eV4ES service. This will result
in the best use of the EV battery, the maximum storage available for PV energy and the least
amount of battery degradation (if V2G is done properly).
Policy suggestions
The following policy suggestions are provided to enable a smoother transition into smart and clean
electrification of transportation.
Subsidies/incentives:
Given the high battery investment cost for BESS, additional subsidies on BESS could be beneficial to
encourage the utilization of BESS and to achieve higher energy autonomy, lower CO2 emission and better
grid stress alleviation.
Alternatively, a specific V2G Feed-in Tariff could be established, and progressively reduced as EV battery
costs decline as projected.
Data availability and transparency for better integration of electric transportation at all levels:
To enable and stimulate an uptake of electric vehicles beyond the early adopters (which are also often the
participants of experimental and organisational set-ups of pre-commercial trials), there will need to be a
greater need for making data recordings and readings more transparent. This will also lead to fewer
assumptions needing to be made for a cost-benefit analyses.
In this way, automatic recording and accurate processing (with clear data definition) of historic data on EV
transport energy are required, to calculate the charging energy requirement. This record data will then be
coupled with energy price data to construct a smart energy management model. This could be further
optimised by automated intelligent route planning for EVs.

SEEV4-City: Final report Leicester City Hall
49
Rewards for carbon savings to encourage EV uptake and usage:
There are increasingly advanced tools that allow the analysis of CO2 (carbon) intensity of electricity at
regional levels within the UK. The National Grid, for instance, have led the development of a Regional
Carbon Intensity forecast for the GB electricity system which can be accessed from
http://carbonintensity.org.uk/. This should be given greater prominence in framing the messages to
encourage motorists to use EVs for their transportation needs.
Dissemination of the benefits of smart charging and V2G to relevant stakeholders:
It is important to organise communication efforts to frame and explain the relative merits of smart
charging and V2G to a broad spectrum of stakeholders. This could be combined with the carbon savings
mentioned above and presented in a Dashboard similar to that of a smart meter or like the MyGridGB
smart home’s Dashboard (http://www.mygridgb.co.uk/dashboard/) which provides a quick overview of
the live electricity mix, carbon emissions and the amount of low carbon electricity generated in the UK.
The MyGridGB dashboard and site both display live electricity data for the UK (including with a Twitter
feed) by generation source of low-carbon electricity, as well as carbon intensity by generation type, trends
in electricity supply and demand over time (both annual and monthly: http://www.mygridgb.co.uk/last-
12-months/).
Standardization and communication protocols to allow interoperable smart charging and V2G:
International level agreements should be reached to allow more standards such as CCS to be compatible
with V2G in addition to the current standard CHAdeMO [26]. Open standards should be further
encouraged through the adoption of the Open Charge Point Protocol (OCPP) [27], and the Open Smart
Charging Protocol (OSCP) [28] in their updated versions.
Successful business model development to benefit relevant stakeholders:
As part of any stimulation of V2G uptake in the UK, it is essential to develop business models with built in
distributional dimensions, i.e. shared (including monetarised) benefits for stakeholders built in which
encourage and incentivise the respective stakeholders – including the EV owners – at domestic scale to
contribute to an aggregated eV4ES future.
Users’ acceptability towards V2G services:
Consumer behaviour and receptiveness should be measured to provide insights into EV owners' attitudes
and their response to V2G products and services.
Development of an energy market or a platform for V2G services:
Some of these dimensions are to be explored in the latest funded V2G projects by Innovate UK, with the
support of the Office of Low Emission Vehicles (OLEV) [29] Policy makers are advised to closely follow the
outcomes of these projects over the next 2 years. To understand the current UK V2G context, it is
recommended to refer to the findings from two Innovate UK funded V2G studies conducted by Cenex UK
[30] [31].
Relevant dimensions for Upscaling and Transnational transfer potential
In this paragraph, we provide a brief indication of which dimensions SEEV4-City identified for the eV4ES
used in this OP that play an instrumental role for both its Upscaling and Transnational transfer potential.
A more in-depth analysis of the potential of each individual eV4ES applied across the SEEV4-City
Operational Pilots can be found in a separate report.
7.3.1. Within the country of the OP (UK)
Upscaling potential in the United Kingdom:

SEEV4-City: Final report Leicester City Hall
50
The most common purpose of V2B is to reduce electricity bills by balancing differential tariffs or
costs within the building. Leicester City Hall daytime and night-time electricity costs are 14.5042
p/kWh and 12.0202 p/kWh respectively. These are also the energy costs of charging the EVs from
the Grid. There is also a capacity charge of 1.05 £/kVA. Accordingly, if PV or Grid energy were stored
in the EVs the overall electricity bill could be reduce, both directly and by reducing the measured
peak consumption level. In terms of the market size, there are some 1.8 million
office/commercial/industrial buildings in the UK, many of which have car parking spaces and can
accommodate rooftop PV.
Further possibilities are to utilise the energy stored in the EV batteries to increase EA, reduce CO2
emissions and reduce the need for grid reinforcement particularly as the number of EVs to be
charged rises over time.
For V2B, a CHAdeMO-compliant vehicle is needed, Leicester City Hall utilises four Nissan Leaf EVs.
Around 27,000 Leafs have been sold in the UK, meaning that with the right charging equipment,
many of these EVs could participate in V2B, which in the case of the recent types of Leaf does not
invalidate the EV battery warranty.
Possible barriers for upscaling are as follows:
V2B is governed under the UK’s Distribution Network Code, part G99, which requires a pre-
installation application and potential post-installation checks. As a minimum, the requisite bi-
directional charger must be G-99 type-tested, which restricts the range from which a customer
may choose.
The V2B technology must be compatible with an office building environment, it is likely to involve
a relatively small 7/10 kW charger. The local distribution network may place restrictions on the
power rating of the charger to ensure stability of the local grid. For V2B, there is no expectation of
export, although the exporting power will be evaluated in case some aspects of V2G such as FFR
or Frequency Containment Reserve (FCR) may become economic.
The customer will need to find a commercial offering which will allow this eV4ES service. V2B
services do not generate significant financial savings owing to the substantial capital cost of the
hardware, and without coupling to on-site generation, will not bring carbon savings either. In the
case of Leicester City Hall there is a certain amount of PV generation.
In the span of 5-10 years, the costs of the necessary bidirectional chargers may well fall to such a
degree as to render the proposition more economic. Coupled with an increase of localised PV /
renewable energy generation this would result in further reduction of electricity costs as well as
an increase in self-sufficiency and Energy Autonomy, reducing the dependence on external energy
supply.
7.3.2. Transfer to other countries
The Netherlands
An organisation in the Netherlands can make savings since there is a cheaper ‘night rate’ for electricity
supply:
One major supplier, MainEnergie, currently charges a supply tariff as follows:
Normal Off-peak Single
€ 0,0947 € 0,0796 € 0,0917
There is no peak capacity charge element in the Dutch electrical energy pricing system.

SEEV4-City: Final report Leicester City Hall
51
Barriers/ opportunities
The most common purpose of V2B is to reduce electricity bills by balancing differential tariffs or costs
within the building. If Leicester City Hall’s daytime and night-time electricity costs were located in the
Netherlands they would be €0,0947/kWh and €0,0796 /kWh, respectively. These would also be the energy
costs of charging the EVs from the Grid. Accordingly, if PV or Grid energy were stored in the EVs the overall
electricity bill could be directly reduced.
Further possibilities are to utilise the energy stored in the EV batteries to increase EA, reduce CO2
emissions and reduce the need for grid reinforcement particularly as the number of EVs to be charged
rises over time.
To conduct V2B services, a CHAdeMO-compliant vehicle is needed. There were 142,686 EVs in the
Netherlands in 2018, and many would be suitable for this service.
Possible barriers for transnational operation are as follows:
The V2B technology will need to be suited to use in an office building environment. This means
that it is likely to use e a 7/10 kW charger.
The local distribution network may place restrictions on the power rating of the charger(s) to
ensure stability of the local grid. If the grid is constrained, the customer may be requested to pay
for a connection upgrade to support the expected increase in incoming supply. For V2B, there is
no expectation of export, although the exporting power will be evaluated in case some aspects of
V2G such as FCR may be economic.
As in the UK, the customer will need to find a commercial offering which will allow this eV4ES
service. V2B services do not generate significant financial savings owing to the substantial capital
cost of the V2G/V2H hardware, and without coupling to on-site generation, will not bring carbon
savings either. In the case of Leicester City Hall there is of course a certain amount of PV
generation.
In the span of 5-10 years, the costs of the necessary bi directional chargers may well fall to such a
degree as to render the proposition much more economically attractive. Coupled with an increase
of localised PV renewable energy generation, this would result in further reduction of electricity
costs as well as having the benefit of an increased level self-sufficiency and increasing energy
autonomy by reducing the dependence on external energy supply.
Belgium
In Belgium, there are a number of different elements which go together to comprise a customer’s
electricity bill. Only the distribution costs provide a night time economy rate. Network Transmission and
distribution charges both have a capacity-based element.
In 2019 the relevant costs were, for businesses consuming 500-1999MWh/year such as Leicester City Hall:
Energy and supply cost €0.0464/kWh; Network costs €0.0340/kWh; VAT €0.0235/kWh; Renewable taxes
€0.0311/kWh; Environmental tax €0.0007/kWh; Nuclear tax €0.0005/kWh; Capacity tax; €0.0013/kW; Other
taxes €0.0011/kWh
Network costs may be split into distribution costs and transmission costs.
The distribution costs include an element reflecting peak power consumption. In 2020 a typical Belgian
tariff for an operation with a peak load such as that of Leicester City Hall (some 250 kW) was
€28.6967257/kW. In addition, the distribution costs include elements for daytime and night time
consumption in kWh. In 2020 typical figures were €0.0013729/kWh daytime and €0.0007787/kWh night
time. Transmission costs for an enterprise the size of Leicester City Hall would attract a capacity based
tariff of €34.4963097. There is no transmission based day/night tariff.

SEEV4-City: Final report Leicester City Hall
52
Barriers/ opportunities
In Belgium, the main opportunity for extending the V2B concept is that there is short-term variation
(day/night charges) in power distribution costs, which could in principle allow some form of cost reduction
by importing energy at tight when the distribution tariff is lower. Also, there is a ‘capacity charge’ related
to charges for both transmission and distribution, whose effect could be reduced by the V2B process,
which could reduce the peak level of demand via energy storage.
Possible barriers for transnational transfer are as follows:
Belgium had only 5,742 BEVs in 2018, suggesting that the scope for EV based projects may be
somewhat limited for now.
A V2B application will need to be suited to use in an office building environment. This means that
it is likely to be limited to a 7/10 kW charger.
The local distribution network may place restrictions on the power rating of the charger to ensure
stability of the local grid. For V2B, there is no expectation of export, although the exporting power
will be evaluated in case some aspects of V2G such as FCR may be economic.
The customer will need to find a commercial offer which will allow this eV4ES service. V2B services
do not generate significant financial savings owing to the substantial hardware costs, and without
coupling to on-site generation, will not bring carbon savings either. In the case of Leicester City
Hall there is of course a certain amount of PV generation.
Bi-directional chargers are often expensive and funded through suppliers’ revenues from grid
services, so a pure V2B offering is rare. In the span of 5-10 years, the costs of the necessary
chargers may well fall to make the proposition economic. Coupled with an increase of localised PV
/ renewable energy generation, this would result in a further reduction of electricity costs as well
as having the benefit of an increased level of self-sufficiency and increasing energy autonomy by
reducing the dependence on external energy supply.
Norway
In Norway, electricity prices now consist of 3 parts: the basic power cost, a contribution towards
maintenance and development of the transmission and distribution systems known as the Grid rent, and
an element of taxation. VAT is charged on the sum of the above. There is no day/night variation in power
costs. The Grid Rent charge includes a ‘power link’ charge calculated according to the highest energy
consumption during one hour per month, based on the hour of highest power consumption during the
invoice month.
Barriers/ opportunities
The only evident opportunity to carry the Leicester City Hall model to Norway would be to use the energy
stored in EVs to shave the amount of the peak demand, recharging when demand is lower, thus reducing
the amount paid for the power link charge as discussed above. This procedure is the rationale behind the
use of stationary battery storage within the Oslo OP. Another way of achieving a reduction in power link
charge would be to adjust the charging of EVs, so that the peak power demand was minimised – effectively
‘Smart Charging’.
Further possibilities are to utilise the energy stored in the EV batteries to increase EA, reduce CO2
emissions and decrease the need for grid reinforcement, particularly as the number of EVs to be charged
rises over time.
To conduct V2B, a CHAdeMO-compliant vehicle is needed. In 2018 Norway had 249,043 EVs, meaning that,
with the right charging equipment, many of these cars could participate in V2B.
Possible barriers for Trans-national transfer are as follows:

SEEV4-City: Final report Leicester City Hall
53
The V2B technology will need to be suited to use in the office building environment. This means
that it is likely to be a 7/10 kW charger.
The local distribution network may place restrictions on the power rating of the charger to ensure
stability of the local grid. If the grid is constrained, the customer may be requested to pay for a
connection upgrade to support the expected increase in incoming supply. For V2B, there is no
expectation of export, although the exporting power will be evaluated in case some aspects of V2G
such as FCR may be economic.
The customer will need to find a commercial offering which will allow this eV4ES service. V2B
services do not generate significant financial savings owing to the substantial cost of the hardware,
and without coupling to on-site generation, will not bring carbon savings either. In the case of
Leicester City Hall there is of course a certain amount of PV generation.
Bi-directional chargers are often expensive and funded through suppliers’ revenues from grid
services, so a pure Vehicle2Building offering is rare. In the span of 5-10 years, the costs of the
necessary chargers may well fall to such a degree as to render the proposition much more
economically attractive. Coupled with an increase of localised PV/ renewable generation, this
would result in further reduction of electricity costs as well as the benefit of an increased level self-
sufficiency and increased energy autonomy, reducing the dependence on external energy supply.
7.3.3. Policy suggestions
The following UK-based policy suggestions may well be appropriate in a Transnational contest.
Subsidies/incentives:
Given the high battery and hardware investment cost for BESS, additional subsidies could be beneficial to
encourage the utilization of BESS and to achieve higher energy autonomy, lower CO2 emission and better
grid stress alleviation. Alternatively, a specific V2B/V2G Feed-in Tariff could be established and
progressively reduced as EV battery and bidirectional charger costs decline as projected.
Data availability and transparency for better integration of electric transportation at all levels:
To enable and stimulate an uptake of electric vehicles beyond the early adopters (which are often also the
participants of experimental and organisational set-ups of pre-commercial trials), there will be a greater
need for more transparent data recordings and readings. This will also lead to fewer assumptions to be
made for a cost-benefit analysis. In this way, automatic recording and accurate processing (with clear data
definition) of historic data on EV transport energy will be needed to calculate the charging energy
requirement. Such record data will then be coupled with energy price data to construct a smart energy
management model. This could be further optimised by automated intelligent route planning for EVs.
Rewards for carbon savings to encourage EV uptake and usage:
There are increasingly advanced tools that allow the analysis of CO2 (carbon) intensity of electricity at
regional levels within the EU. These should be given greater prominence in framing the messages to
encourage motorists to use EVs for their transportation needs.
Dissemination of the benefits of smart charging andV2B/ V2G to relevant stakeholders:
It is important to organise communication efforts to frame and explain the relative merits of smart
charging and V2B/V2G to a broad spectrum of stakeholders. This could be combined with the carbon
savings mentioned above and presented in a Dashboard similar to that of a smart meter.

SEEV4-City: Final report Leicester City Hall
54
Standardization and communication protocols to allow interoperable smart charging and V2B/ V2G:
International level agreements should be reached to allow more standards such as CCS to be compatible
with V2G in addition to the current standard CHAdeMO. Open standards should be further encouraged
through the adoption of the OCPP, and the OSCP, in their updated versions.
Successful business model development to benefit relevant stakeholders:
As part of any stimulation of V2G uptake in the North Sea Region of Europe, policy should be to incentivise
the development of business models with built-in distributional dimensions – that is shared (including
monetarised) benefits for stakeholders built in which encourage and incentivise the respective
stakeholders – including the EV owners – at domestic scale to contribute to an aggregated eV4ES future.
Users’ acceptability towards V2G services:
Consumer behaviour and receptiveness should be measured to provide insights into EV owners' attitudes
and their response to V2G products and services.
Development of an energy market or a platform for V2B/ V2G services:
These dimensions should be explored. Policy makers are advised to provide encouragement for research
and market development.

SEEV4-City: Final report Leicester City Hall
55
8. References
[1] R. Gough, P. Speers and V. Lejona, “Evaluating the Benefits of Vehicle-to-Grid in a Domestic
Scenario,” EVS30 Symposium, Stuttgart, 2017.
[2] N. Odeh, N. Hill and D. Forster, “Current and Future Lifecycle Emissions of Key ‘Low Carbon’
Technology and Alternatives,” RICARDO-AEA, 2013.
[3] A. Hoekstra, “The Underestimated Potential of Battery Electric Vehicles to Reduce Emissions,” Joule,
vol. 3, p. 1404–1414, 2019.
[4] M. S. 202, “GB Electricity National Grid CO2e Output per Product Type,” [Online]. Available:
http://gridwatch.co.uk/co2-emissions.
[5] E. Bentley, R. Kotter, Y. Wang, R. Das, G. Putrus, J. V. D. Hoogt, E. V. Bergen, J. Warmerdam, R. Heller
and B. Jablonska, “Pathways to energy autonomy – challenges and opportunities,” International
Journal of Environmental Studies, vol. 76, no. 6, pp. 893-921, 2019.
[6] R. Luthander, J. Widén, D. Nilsson and J. Palm, “Photovoltaic self-consumption in buildings: A review,”
Applied Energy, vol. 142, pp. 80-94, 2015.
[7] M. Dubarry, A. Devie and K. McKenzie, “Durability and reliability of electric vehicle batteries under
electric utility grid operations: Bidirectional charging impact analysis,” Journal of Power Sources, vol.
358, pp. 39-49, 2017.
[8] F. Martel, Y. Dubé, S. Kelouwani, J. Jaguemont and K. Agbossou, “Long-term assessment of economic
plug-in hybrid electric vehicle battery lifetime degradation management through near optimal fuel
cell load sharing,” Journal of Power Sources, vol. 318, pp. 270-282, 2016.
[9] G. Lacey, G. Putrus and E. Bentley, “Smart EV charging schedules: supporting the grid and protecting
battery life,” IET Electr. Syst. Transp., vol. 7, no. 1, pp. 84-91, 2017.
[10] R. Peng and M. Pedram, “An analytical model for predicting the remaining battery capacity of
lithium-ion batteries,” Design, Automation and Test in Europe Conference and Exhibition, 2003.
[11] G. Ning, R. E. White and B. N. Popov, “A generalized cycle life model of rechargeable Li-ion batteries,”
Electrochimica Acta, vol. 51, no. 10, pp. 2012-2022, 2006.
[12] Bloomberg, “Battery Price Survey,” 2019. [Online]. Available: https://about.bnef.com/blog/battery-
pack-prices-fall-as-market-ramps-up-with-market-average-at-156-kwh-in-2019/?sf113554299=1.
[13] Nationwide Utilities Limited, “Firm Frequency Response,” 2020. [Online]. Available:
https://nationwideutilities.com/service/firm-frequency-response/.
[14] N. Grid, “Firm Frequency Response (FFR) – Interactive Guidance,” 2017. [Online]. Available:
https://www.nationalgrid.com/sites/default/files/documents/Firm%20Frequency%20Response%20
%28FFR%29%20Interactive%20Guidance%20v1%200_0.pdf.
[15] J. Tomić and W. Kempton, “Using fleets of electric-drive vehicles for grid support,” Journal of Power
Sources, vol. 168, pp. 459-468, 2007.
[16] M. M. P. A. C. T. ”. S. Martinenas, “Implementation and Demonstration of Grid Frequency Support
by V2G Enabled Electric Vehicle,” Proceedings of the 49th International Universities Power Engineering
Conference (UPEC), 2014.
[17] S. Martinenas, M. Marinelli, P. Andersen and C. Træholt, “Evaluation of Electric Vehicle Charging
Controllability for Provision of Time Critical Grid Services,” Proceedings of the 51st International
Universities Power Engineering Conference (UPEC), 2016.
[18] N. Grid, “Firm Frequency Response (FFR),” 2020. [Online]. Available:
https://www.nationalgrid.com/uk/electricity/balancing-services/frequency-response-services/firm-
frequency-response?market-information .

SEEV4-City: Final report Leicester City Hall
56
[19] N. Grid, “CUSC – Section 4. Balancing Services,” 02 2017. [Online]. Available:
https://www.nationalgrid.com/sites/default/files/documents/CUSC_section_4_v1.21_1%20Februar
y_17%20V%201.0.pdf.
[20] E. Limited, “Requirements Specification for Modification Proposal P212 ‘Main Imbalance Price Based
on Market Reference Price’,” 2007. [Online]. Available: https://www.elexon.co.uk/wp-
content/uploads/2012/02/p212as20.pdf.
[21] T. G. &. Power, “Why Firm Frequency Response?,” [Online]. Available: https://www.gas-
power.total.co.uk/sites/g/files/wompnd341/f/atoms/files/total_ukpr_firm_frequency_response.pdf
.
[22] A. Lowe, “Revenue opportunities for battery storage (VIDEO),” 2020. [Online]. Available:
https://www.flexitricity.com/more/blog/revenue-opportunities-battery-storage.
[23] J. M. W. Kenton, “Net Present Value (NPV),” 2020. [Online]. Available:
https://www.investopedia.com/terms/n/npv.asp .
[24] E. Vartiainen, G. Masson and C. Breyer, “PV LCOE in Europe 2014,” 2015.
[25] J. Han, M. Kamber and J. Pei, “Data Mining: Concepts and Techniques,” 2012. [Online]. Available:
https://www.elsevier.com/books/data-mining-concepts-and-techniques/han/978-0-12-381479-1.
[26] C. Association, “CHAdeMO protocol,” 2020. [Online]. Available: https://www.chademo.com/ .
[27] O. C. Alliance, “Open Charge point Protocol 2.0.1,” 2020. [Online]. Available:
https://www.openchargealliance.org/protocols/ocpp/ocpp-20/ .
[28] O. C. Alliance, “The importance of Open Protocols,” 2020. [Online]. Available:
https://www.openchargealliance.org/protocols/oscp/oscp-10/ .
[29] I. Uk, “Innovation in Vehicle-To-Grid Systems: Real World Demonstrators,” 2017. [Online]. Available:
https://assets.publishing.service.gov.uk/government/uploads/system/uploads/attachment_data/fil
e/681321/Innovation_in_Vehicle-To-Grid__V2G__Systems_-_Real-World_Demon.
[30] Cenex, “Vehicle to Grid,” [Online]. Available: http://www.cenex.co.uk/vehicle-to-grid/.
[31] Cenex, “Understanding the true value of V2G,” 2019. [Online]. Available:
https://www.cenex.co.uk/wp-content/uploads/2019/05/True-Value-of-V2G-Report.pdf.

SEEV4-City: Final report Leicester City Hall
57
Appendix (A)
A1. Study to ascertain limitations of the City Hall Power Distribution System
A diagram of the wiring installation was made available, as shown in Figure 28.
Figure 28 Leicester City Hall mains distribution schematic
A Simulink model was created based on the schematic, shown in Figure 29.
Figure 29 Leicester City Hall mains distribution Simulink model
The total system input power was known. No information was however available on the amount of power
flow in each line. Accordingly, each line was rated in terms of its fuse capacity, and the assumed
percentage of total input power allocated to each line, see Table 23.
The 800 kVA main transformer was found to be well specified, for instance on 22 June 2018 the
transformer loading never exceeded 25%. Given the considerable spare transformer capacity an
additional 80 times 7 kW EV chargers at main switchboard could be installed without transformer
overload, see Figure 30 Main Transformer Loading 22 June 2018.

SEEV4-City: Final report Leicester City Hall
58
Table 23 Derived percentage of total load power in each line
Power in Lines limited by fuse capacity
Line no. Fuse rating Line Type Fuse limited line power W Line % power
1 63A 1.phase 14490 0.817399496
2 63A 1.phase 14490 0.817399496
3 400A 3 phase 277130 15.63325896
4 63A 3 phase 43648 2.462239697
5 100A 3 phase 69280 3.908173713
6 100A 3 phase 69280 3.908173713
7 63A 1.phase 14490 0.817399496
8 63A 3 phase 43648 2.462239697
9 400A 3 phase 277130 15.63325896
10 160A 3 phase 110851 6.253247174
11 200A 3 phase 138564 7.816573071
12 400A 3 phase 277130 15.63325896
13 63A 1.phase 14490 0.817399496
14 400A 3 phase 277130 15.63325896
15 63A 3 phase 43648 2.462239697
16 63A 3 phase 43648 2.462239697
17 63A 3 phase 43648 2.462239697
TOTAL 1772695 100
Figure 30 Main Transformer Loading 22 June 2018
The ability of the City Hall’s electrical installation to accept additional PV generation was examined; the
supply cable was found to be able to support 20 times the existing output without current overload,
seeFigure 31.
0 5 10 15 20 250
0.1
0.2
0.3
0.4
0.5
0.6
0.7
0.8Transformer Loading
pu
Time h

SEEV4-City: Final report Leicester City Hall
59
Figure 31 Loading on cable supplying Sub Switchboard SSB-01 22 June 2018 (PV Connection)
The PV installation represented a small fraction of the City Hall baseload, the PV generation curve generally
follows pattern of the City Hall load profile. 20 times the existing PV output could be consumed within the
City Hall without energy storage becoming necessary. Peak PV occurred on 22 June 2018, see Figure 32.
Figure 32 PV generation on 22 June 2018 (800 kVA Base)
Only a very small voltage drop occurred at the main switchboard arising from EV charging.
60 times 7 kW chargers could be operated concurrently before the voltage drop caused the line voltage
to reach the statutory minimum of -6%, see Figure 33.
0 5 10 15 20 250
0.02
0.04
0.06
0.08
0.1
0.12
0.14Loading on cable supplying Sub Switchboard SSB-01
Line
cur
rent
pu
Time h
-0.002
0
0.002
0.004
0.006
0.008
0.01
0.012
0.014
-1 4 9 14 19 24
Po
we
r p
u
Time h
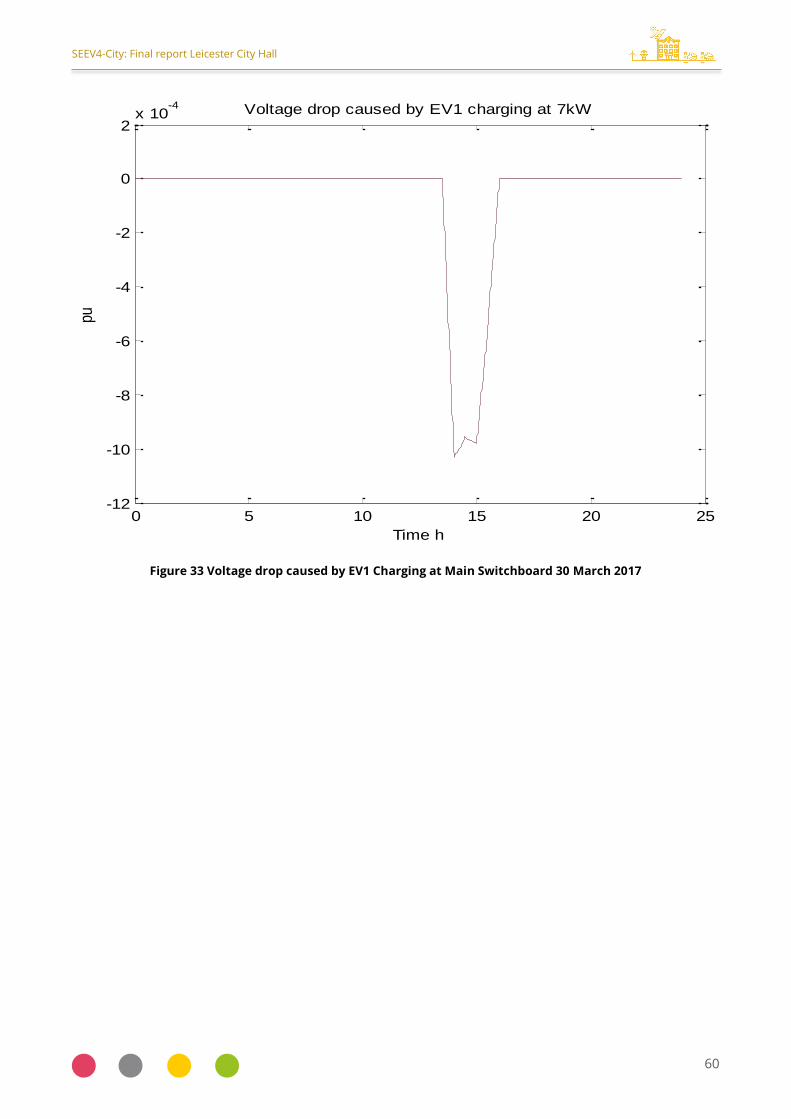
SEEV4-City: Final report Leicester City Hall
60
Figure 33 Voltage drop caused by EV1 Charging at Main Switchboard 30 March 2017
0 5 10 15 20 25-12
-10
-8
-6
-4
-2
0
2x 10
-4 Voltage drop caused by EV1 charging at 7kW
pu
Time h