legible london - a wayfinding study
DESCRIPTION
This study, published in 2006, has provided the basis for Legible London. It found that: Walking can lead to major benefits for the transport system, economy and public health Predictable, consistent and authoritative public information is the key to building pedestrians' confidence The report also found that the many pedestrian signage systems in central London are incoherent and often confusing. As a result, many people rely on the Tube map to find their way around above ground. Although the Tube map design is ideal for helping people complete their journey on the Underground, it isn't designed for walking and doesn't represent the exact locations of stations, or distances between destinations.TRANSCRIPT

aig london 2006
Legible London
A wayfinding study
Legible London
A wayfinding study March 2006
page 3
Whilst it is generally agreed that London is a wonderful city to explore on foot, there are numerous barriers to getting more people to build walking into their regular routine, whether for leisure, commuting, shopping, or fitness. A principal barrier is attitudinal. Many people avoid walking if it requires them to navigate through an unfamiliar territory. The sense of the unknown - how long will it take, where a street leads to - creates ‘risk’, especially of getting lost or increased journey times.
Since its earliest days, Central London Partnership (CLP) has promoted the need to make London a more walking friendly city, borne from the belief that a city that provides an infrastructure that is pleasant for walking, and lingering, is putting people at the heart of its priorities. In doing so, it creates the climate for success: enhanced quality of life is integral to a city’s continued economic vibrancy and competitiveness.
For several years a plank of CLP’s walking strategy has been to ‘give people the confidence to get lost’ – safe in the knowledge that it is possible to get back on the beaten track. One of the most fundamental aspects in building this confidence is providing an integrated, consistent and user-friendly wayfinding system. More recently, the GLA-chaired Walking Advisory Panel has highlighted the importance of such a system to achieving the Mayor’s aims of making London the most walking friendly city by 2015. The Olympic deadline has also focused minds, and the need to implement a system in key areas ahead of 2012 is providing a further impetus.
It is for this reason that we at CLP are delighted to have had the chance to work with the central London local authorities and Transport for London (TfL) on this important initiative, Legible London: A Wayfinding Study, which recommends a way forward in creating a cross boundary, integrated wayfinding system. It has been conducted on our behalf by AIG, and I would like to thank them, and the staff in the local authorities and TfL for their hard work and co-operation in producing this study.
Whilst the study’s recommendations have been agreed in principle by the main implementation partners, there are many things that have to be considered and planned to take this initiative forward. These range from agreeing the components and detailed design of a final system, the ‘place marketing’ and branding implications, to removing current street clutter to make way for this new piece of infrastructure. Crucially, it has to start with consultation with a wide range of partners with either an interest or role in implementing the final product.
The end game is to create a unified system that provides pedestrians with a set of measures that helps them to do so with ease and confidence. Providing this kind of support signals that London cares about the people who choose this city as a place to live, work or visit. As such, translating this study into a tangible product is much more far reaching than signage and movement, but is an important milestone for London’s continued success as a world class place for people and business.
ForewordPatricia Brown Chief Executive Central London Partnership
Contents
Executive Summary 6
Background Scope 8 Objectives 8 Research and consultations 9
The case for walking The walking environment 10 Benefits of walking 10 Importance of information 11
The present situation London 12 Jurisdictions 12 Current policy 12 Profusion of signs 14 How do pedestrians find their way about? 18
Changing the culture London is changing 20 Walkable journeys 20 What can be achieved? 20 Providing a better service 21 Customer-led method 22 A multifaceted approach 23 Encouraging the walking option 23 Building better knowledge 24 Information you can trust 24 London-wide or Borough by Borough? 28
Towards a solution A coherent wayfinding system 30 The Living Map 32 The advantages of map based signage 34 Naming policy 35 Sign types 36 Jane’s walk scenario 38 Placement 40 Progressive disclosure 40 Frequency 41 Design 42 Cost-effectiveness 44 Conclusion 45
Appendices A – AIG/LSE Cities User Research Study 46 B – Preliminary sign audit 47 C – Notes on design and maintenance 53 D – Draft project plan and cost estimate 58 References 60 Acknowledgements 62
PDFs (including a large type version) of this study, the Jane's Walk movie and additional updates may be obtained by registering atwww.legiblelondon.info
page 6 legible london, a wayfinding study page 7aig london 2006
How to develop effective wayfinding across what is arguably the most organic and complex city in the world is looked at in the light of scientific research, particularly into the process of ‘mental mapping’. Legible London recommends a methodology designed to support this process, drawing on examples of best practice as well as systems that have stood the test of time – including the UK Road Sign system (Informatory Signs for use on all-purpose Roads, Ministry of Transport, 1964) introduced in 1964.
Legible London proposes creating a ‘Living Map’ as a central, constantly updated database. This would be capable of servicing not just maps, signage, GPRS and other technologies for use by the public, but also forms a master tool to enable London’s bodies to implement a reliable and consistent wayfinding system in a coordinated manner. Legible London looks at a range of other issues, including quality methods, a consistent naming policy, a range of sign types, placement of signs and the considerations involved in designing for maximum inclusivity and effectiveness.
The conclusion is that aside from the other benefits, we propose a coherent wayfinding system as the most cost-effective means of introducing extra capacity into the public transport system. Therefore, the development and introduction of a signage system is recommended as being in the interests of all stakeholders. A draft project plan for significant roll-out by 2010-11 is appended to the report.
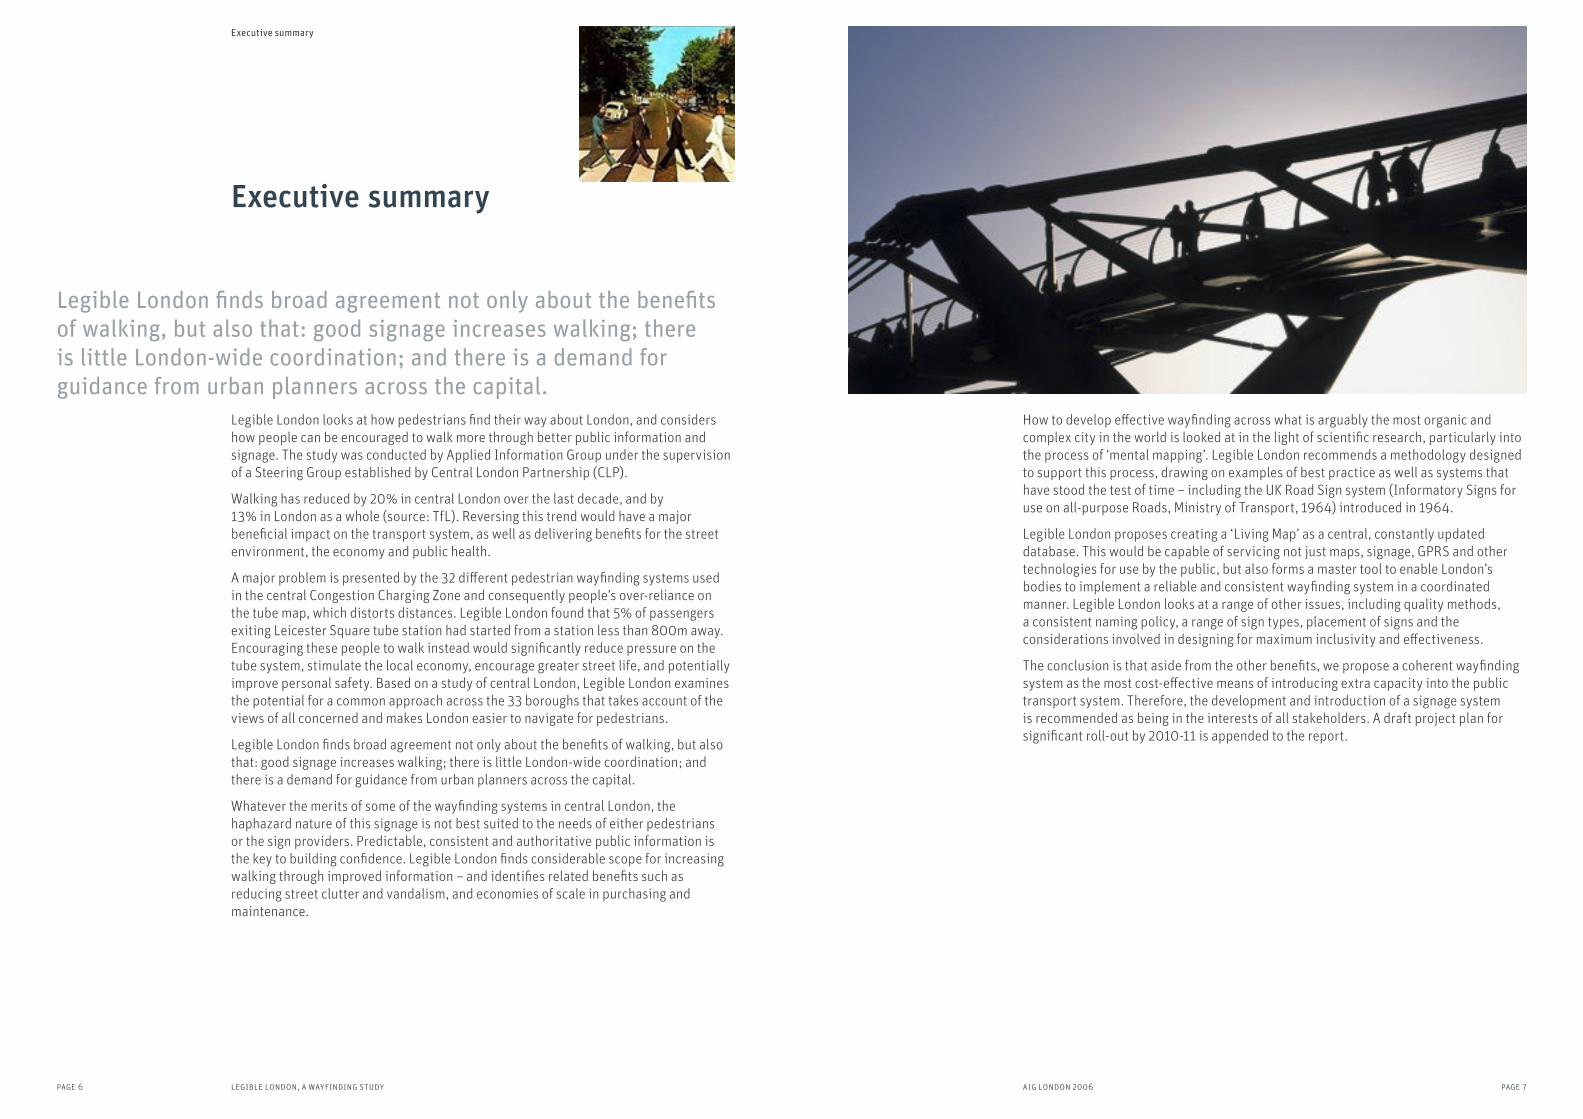
Legible London looks at how pedestrians find their way about London, and considers how people can be encouraged to walk more through better public information and signage. The study was conducted by Applied Information Group under the supervision of a Steering Group established by Central London Partnership (CLP).
Walking has reduced by 20% in central London over the last decade, and by 13% in London as a whole (source: TfL). Reversing this trend would have a major beneficial impact on the transport system, as well as delivering benefits for the street environment, the economy and public health.
A major problem is presented by the 32 different pedestrian wayfinding systems used in the central Congestion Charging Zone and consequently people’s over-reliance on the tube map, which distorts distances. Legible London found that 5% of passengers exiting Leicester Square tube station had started from a station less than 800m away. Encouraging these people to walk instead would significantly reduce pressure on the tube system, stimulate the local economy, encourage greater street life, and potentially improve personal safety. Based on a study of central London, Legible London examines the potential for a common approach across the 33 boroughs that takes account of the views of all concerned and makes London easier to navigate for pedestrians.
Legible London finds broad agreement not only about the benefits of walking, but also that: good signage increases walking; there is little London-wide coordination; and there is a demand for guidance from urban planners across the capital.
Whatever the merits of some of the wayfinding systems in central London, the haphazard nature of this signage is not best suited to the needs of either pedestrians or the sign providers. Predictable, consistent and authoritative public information is the key to building confidence. Legible London finds considerable scope for increasing walking through improved information – and identifies related benefits such as reducing street clutter and vandalism, and economies of scale in purchasing and maintenance.
Executive summary
Legible London finds broad agreement not only about the benefits of walking, but also that: good signage increases walking; there is little London-wide coordination; and there is a demand for guidance from urban planners across the capital.
Executive summary
page 8 legible london, a wayfinding study page 9aig london 2006
We must also take into account the needs of the boroughs and other stakeholders, from residents and property developers through to transport organisations. All of these have legitimate concerns that must be reconciled to make a system work.
Before we develop new ideas we must take full account of what is there at the moment – both physically and in terms of policies, regulations and responsibilities – to decide what needs to stay, go, or be improved.
Research and consultations We have studied the numerous existing sign systems, reviewed existing literature and policy to identify the major issues. The results of this research are summarised in the report and greater detail is given in the Appendices.
In the course of our research we have met with officers from a wide range of organisations to build up a balanced overview. These include:
• Transport for London• Greater London Authority• London Development Agency• City of Westminster• London Borough of Camden• London Borough of Southwark• Corporation of London
• A Walking Strategy for Westminster – Westminster City Council
• Action Plan for Central London – Central London Partnership, 2003
• The TfL Business Plan 2005 – Transport for London
• Camden Borough Spending Plan 2005/06
• Information for Pedestrians – Guidance for London Boroughs, TfL
• Making London a Walkable City
– The walking plan for London – Transport for London/Mayor of London, 2004
• Multi-Modal interchange signs standard for London – Transport for London
• On the Move: by foot – A Discussion Paper, 2003
• Promoting Walking in London - A Draft Business Case – Gehl Architects/CLP/TfL
• Quality Streets CLP, 2003• Realising the potential
Walking and Cycling in London
– Transport 2000 Trust, 2004 • Streets for All – A guide to
the management of London’s streets – English Heritage, 2000
• The National Walking Strategy – Living Streets, 2003
• The Westminster Way – Public Realm manual for the City – City of Westminster, 2003
• Towards a fine City for People – Public Space and Public Life, Gehl Architects/CLP/TfL, 2004
• Urban Design – Autumn 2004
Issue 92• Walking and Cycling: An
Action Plan– Department for Transport, 2004
• Encouraging Walking: Advice to Local Authorities – Department of Environment, Transport and the Regions, 2000
• Plus all documents summarised on pp 60-61
Primary documents reviewed
• London Borough of Islington• London Borough of Lambeth• Living Streets• Waterloo Quarter Business Alliance• Covent Garden Business Forum• South Bank Employers Group
Background
ScopeAIG was asked by Central London Partnership to report on how pedestrians find their way about London, and on how this can be improved through the way in which information is provided.
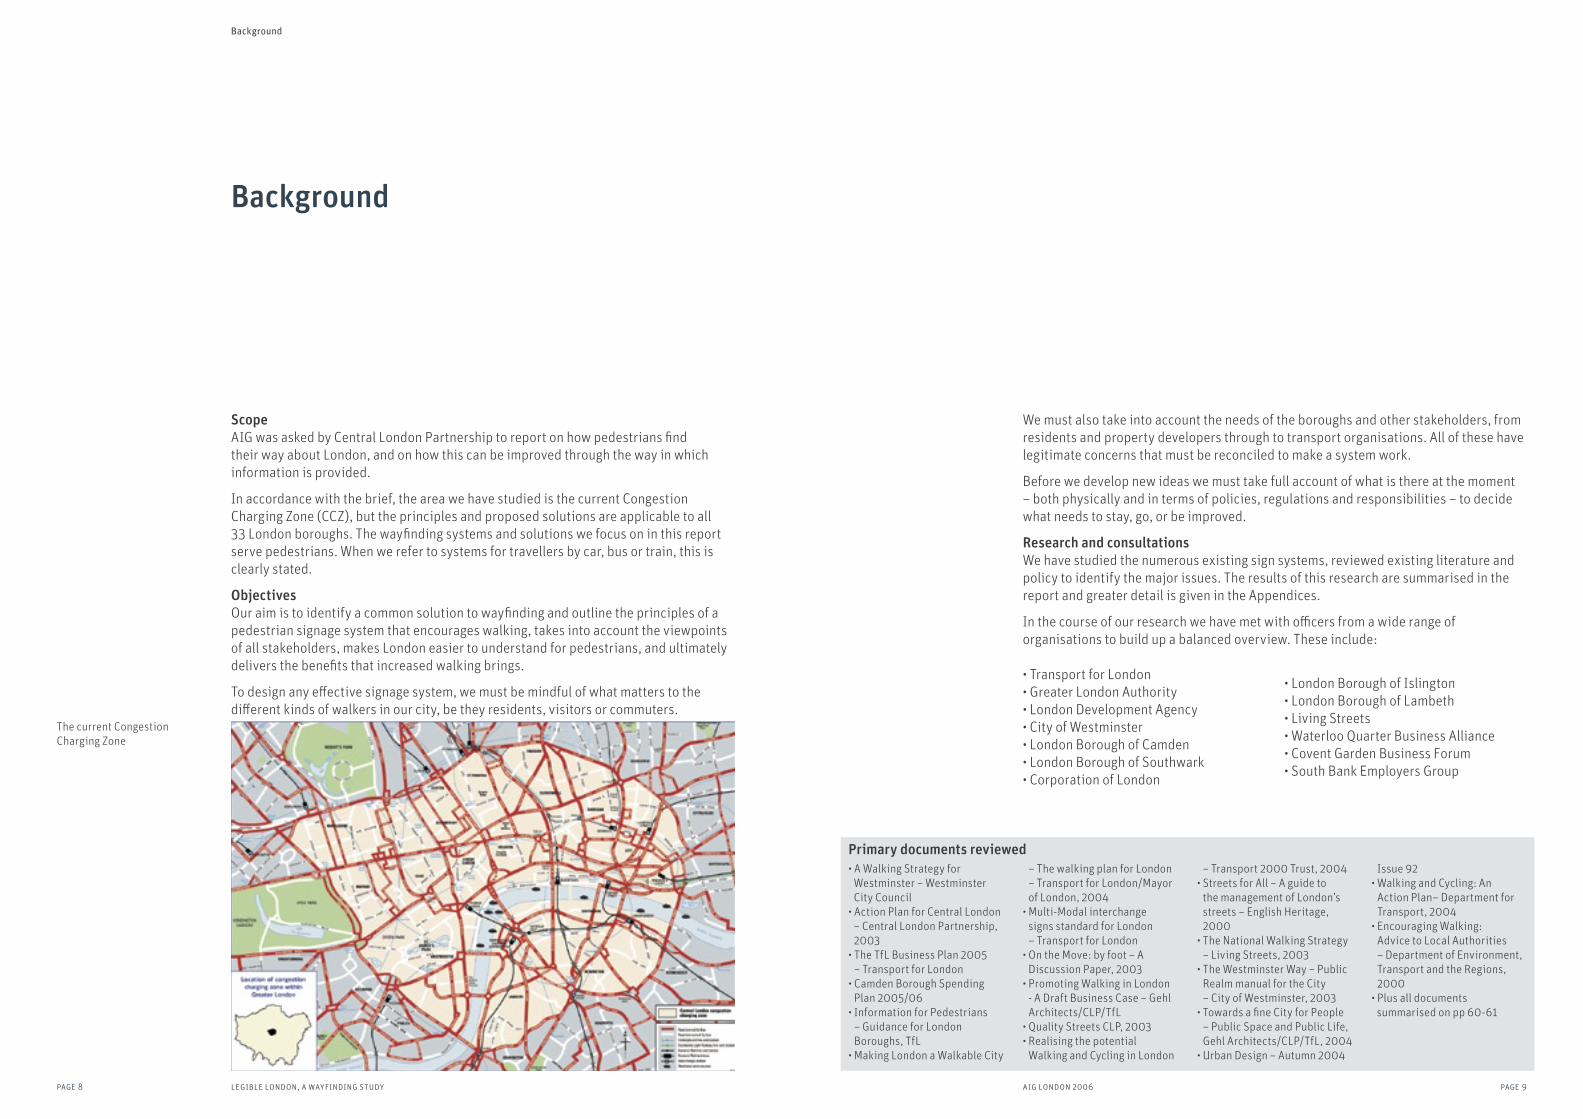
In accordance with the brief, the area we have studied is the current Congestion Charging Zone (CCZ), but the principles and proposed solutions are applicable to all 33 London boroughs. The wayfinding systems and solutions we focus on in this report serve pedestrians. When we refer to systems for travellers by car, bus or train, this is clearly stated.
ObjectivesOur aim is to identify a common solution to wayfinding and outline the principles of a pedestrian signage system that encourages walking, takes into account the viewpoints of all stakeholders, makes London easier to understand for pedestrians, and ultimately delivers the benefits that increased walking brings.
To design any effective signage system, we must be mindful of what matters to the different kinds of walkers in our city, be they residents, visitors or commuters.
Background
The current Congestion Charging Zone

page 11aig london 2006
The Walking Plan published in 2004 by the Mayor of London states that: ‘Walking as an activity is accessible to all social groups, ages, religions and cultures. Encouraging people to walk is the central element of this Plan. It aims to provide benefits including:• greater use of public transport • a better environment • social inclusion • healthier lifestyles • an improved economy Everyone should be able to choose to walk as part of a journey, or in preference to any other form of transport.’
Importance of informationThere is broad agreement that: walking is good; that effective information increases walking; and that there is currently little London-wide coordination of pedestrian information systems.
We agree on the benefits of walking and the importance of public information. What is lacking is a clear idea of how we can best use public information to achieve these goals.
London has a varied mix of pedestrians from daily commuters to once-in-a-lifetime visitors.
Case study: Perth, Australia‘Information can be effective’A city congested with motor vehicle traffic – 80% of all trips by car. The main barrier to, in this case, other transport usage proved to be an uninformed public. Utilising ‘individualised marketing’ ie distributing information to residents about their transport options resulted in a 35% increase in walking, 61% in cycling and 17% in public transport; and a reduction in car usage of 10%. In addition, these changes have been sustained. The inference here is that people changed behaviour when they learnt alternatives.
The walking environmentWalking accounts for 80% of trips under a mile and is the main way in which public transport is accessed in London. However, although there are increases in some localities, walking overall has reduced by 20% in inner London over the last decade, and by 13% in London as a whole (source: 2001 LATS Survey, TfL).
Reversing this trend would have a major impact on relieving congestion on the public transport and road system, as well as delivering other benefits identified in this report.
Benefits of walkingWho benefits if we walk more? Examination of existing plans, strategies and research, including The Walking Plan for London, the Gehl report ‘Towards a Fine City for People’ and the Borough strategies, shows a broad consensus about the five principal benefits of walking:• Walking is healthy and is a free form of exercise. The improvement in public health also benefits health services. “Thirty minutes a day of moderate walking will only be achieved by helping people to build activity into their daily lives” Annual Report of the Chief Medical Officer, 2002.
• Walking is good for business and the local economy. “Footfall” benefits local business. Much of central London is devoted to retail and leisure use for Londoners and visitors alike. Better wayfinding offers a more inviting experience for all.
• Walking is good for the environment. It is a sustainable form of transport. Walking has little or no environmental impact, causing no air pollution or accidents. A co-ordinated sign system would also allow much street clutter to be reduced or removed.
• Public transport systems benefit. More walking can noticeably reduce pressure on the tube and bus systems. No-one likes congestion. A proactive walking strategy can play a positive and significant part in achieving a modal shift away from congested public transport to walking.
• More people on the streets creates a safer community: more eyes means less risk of theft and assault.
The case for walking
Walking is healthy, free and good for the environment. Business and the public transport system benefit. More people on the streets means a safer environment.
The case for walking
page 10 legible london, a wayfinding study
page 13aig london 2006
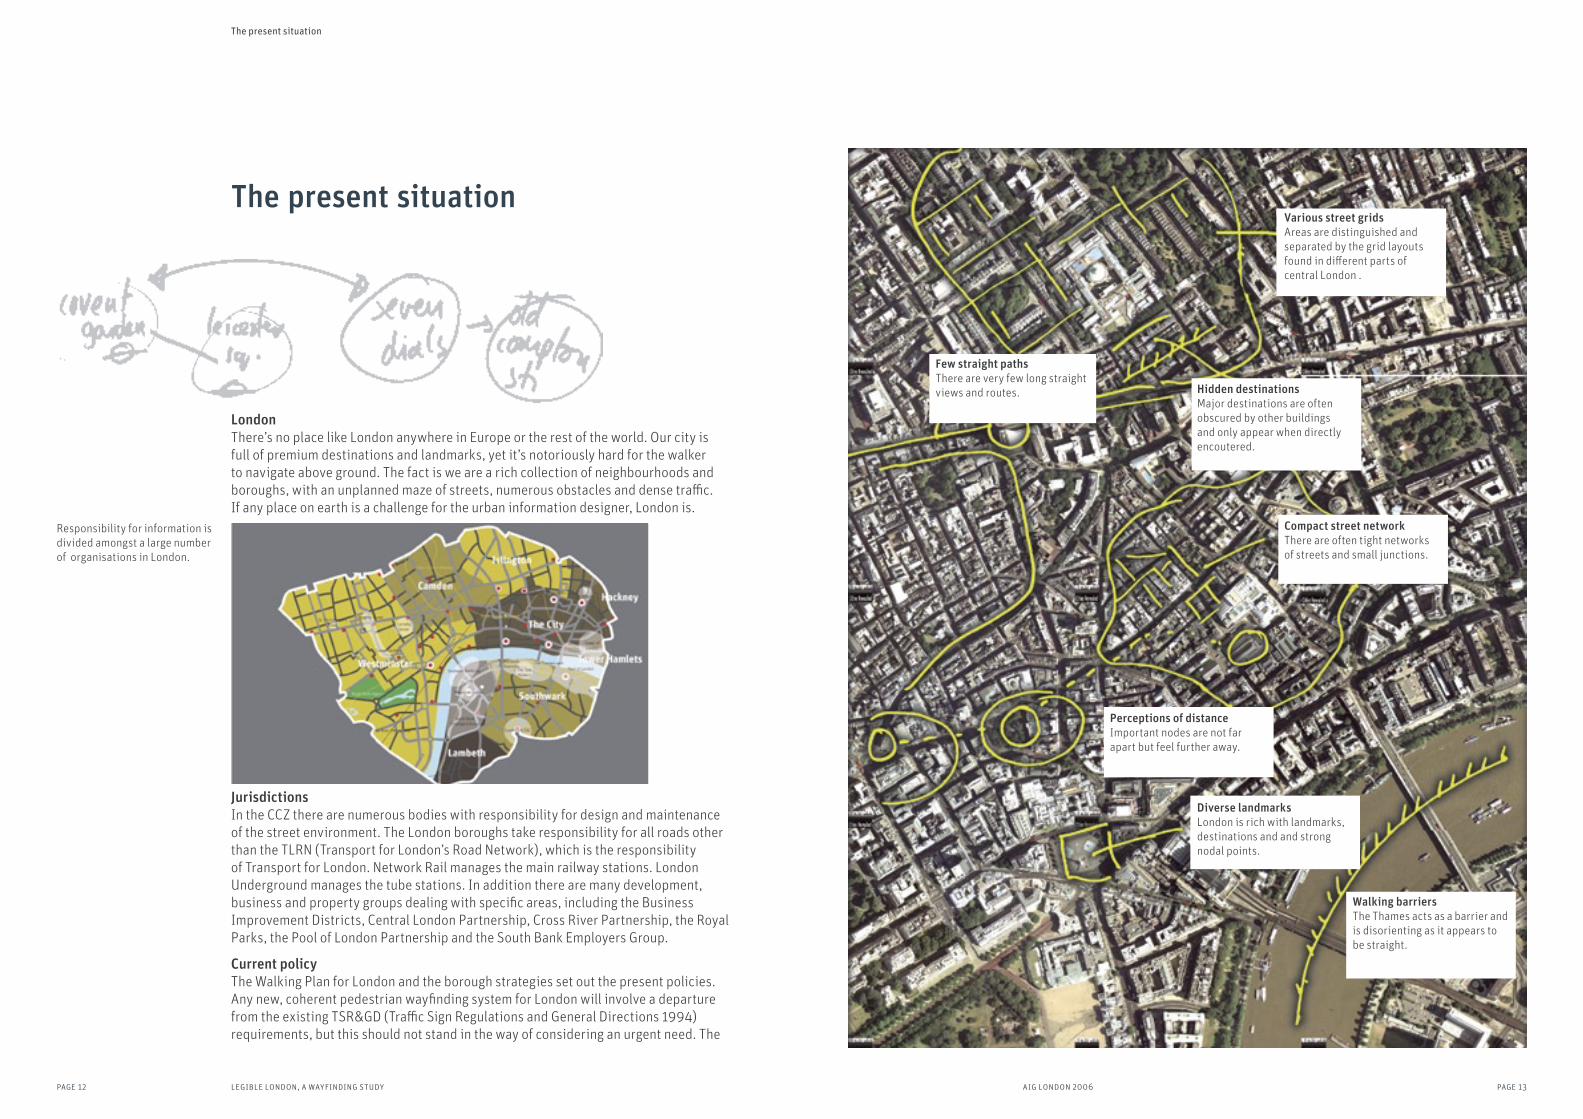
Hidden destinationsMajor destinations are often obscured by other buildings and only appear when directly encoutered.
Compact street networkThere are often tight networks of streets and small junctions.
Perceptions of distanceImportant nodes are not far apart but feel further away.
Diverse landmarksLondon is rich with landmarks, destinations and and strong nodal points.
Walking barriersThe Thames acts as a barrier and is disorienting as it appears to be straight.
Various street gridsAreas are distinguished and separated by the grid layouts found in different parts of central London .
Few straight pathsThere are very few long straight views and routes.
LondonThere’s no place like London anywhere in Europe or the rest of the world. Our city is full of premium destinations and landmarks, yet it’s notoriously hard for the walker to navigate above ground. The fact is we are a rich collection of neighbourhoods and boroughs, with an unplanned maze of streets, numerous obstacles and dense traffic. If any place on earth is a challenge for the urban information designer, London is.
JurisdictionsIn the CCZ there are numerous bodies with responsibility for design and maintenance of the street environment. The London boroughs take responsibility for all roads other than the TLRN (Transport for London’s Road Network), which is the responsibility of Transport for London. Network Rail manages the main railway stations. London Underground manages the tube stations. In addition there are many development, business and property groups dealing with specific areas, including the Business Improvement Districts, Central London Partnership, Cross River Partnership, the Royal Parks, the Pool of London Partnership and the South Bank Employers Group.
Current policyThe Walking Plan for London and the borough strategies set out the present policies. Any new, coherent pedestrian wayfinding system for London will involve a departure from the existing TSR&GD (Traffic Sign Regulations and General Directions 1994) requirements, but this should not stand in the way of considering an urgent need. The
The present situation
Responsibility for information is divided amongst a large number of organisations in London.
The present situation
page 12 legible london, a wayfinding study
page 15aig london 2006
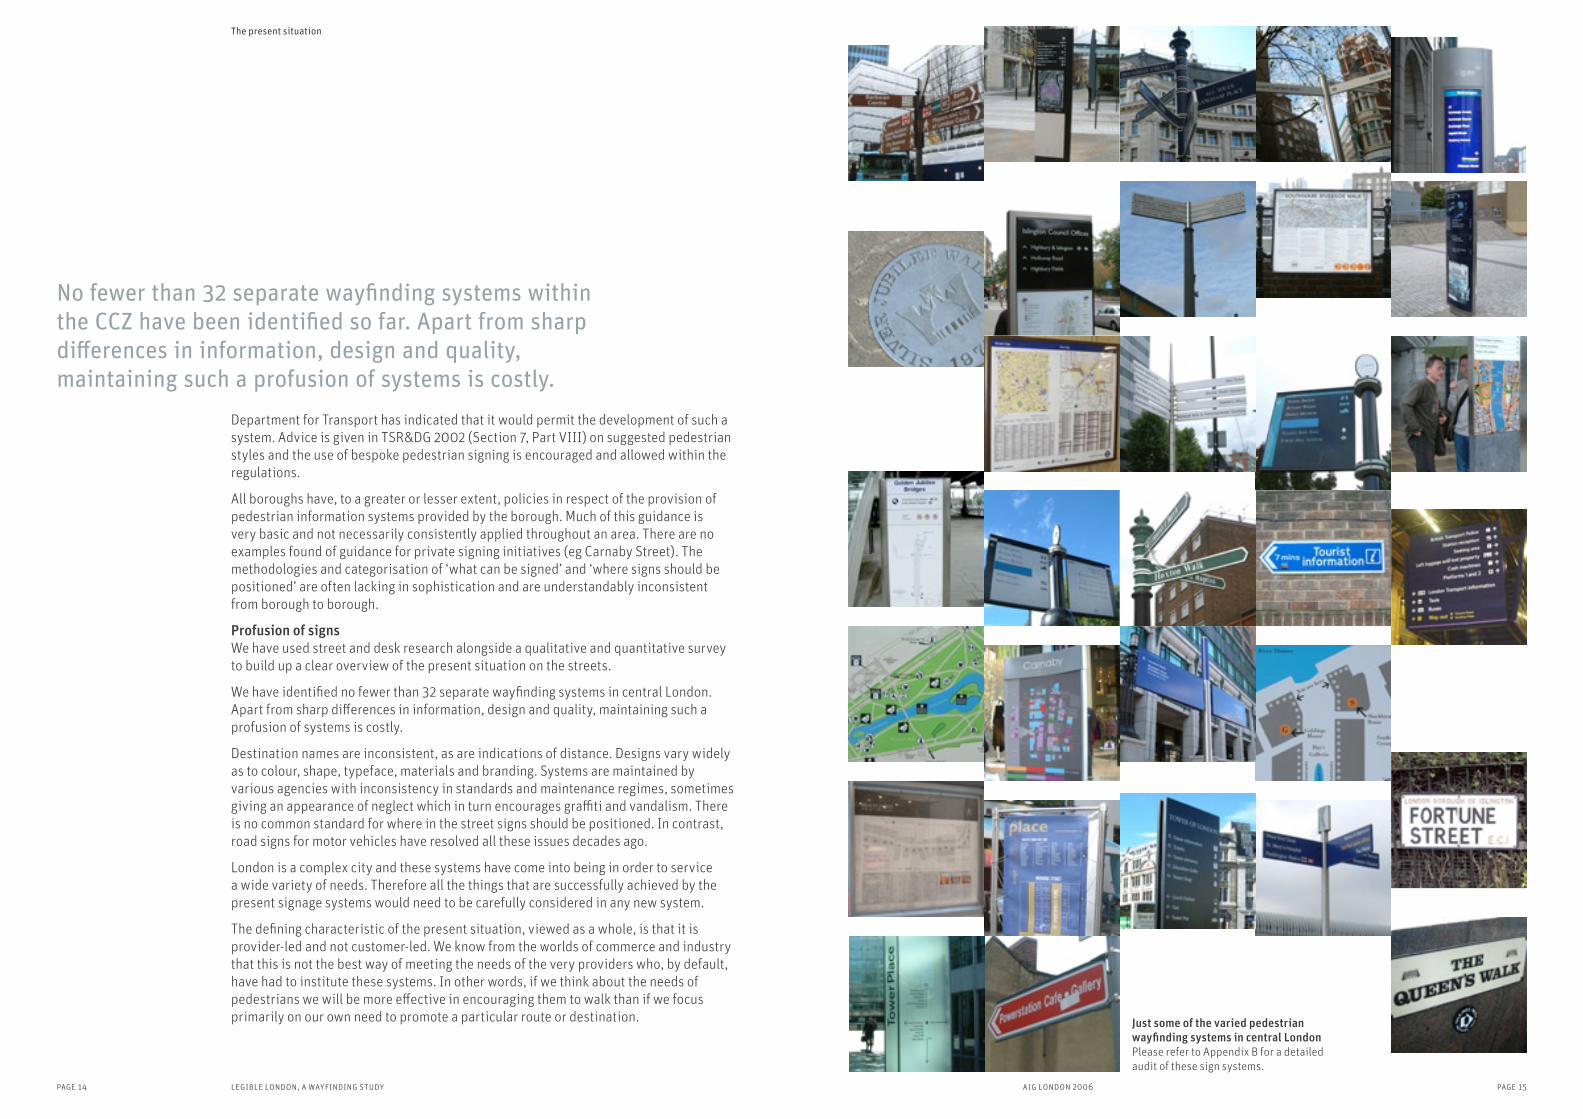
Just some of the varied pedestrian wayfinding systems in central LondonPlease refer to Appendix B for a detailed audit of these sign systems.
No fewer than 32 separate wayfinding systems within the CCZ have been identified so far. Apart from sharp differences in information, design and quality, maintaining such a profusion of systems is costly.
Department for Transport has indicated that it would permit the development of such a system. Advice is given in TSR&DG 2002 (Section 7, Part VIII) on suggested pedestrian styles and the use of bespoke pedestrian signing is encouraged and allowed within the regulations.
All boroughs have, to a greater or lesser extent, policies in respect of the provision of pedestrian information systems provided by the borough. Much of this guidance is very basic and not necessarily consistently applied throughout an area. There are no examples found of guidance for private signing initiatives (eg Carnaby Street). The methodologies and categorisation of ‘what can be signed’ and ‘where signs should be positioned’ are often lacking in sophistication and are understandably inconsistent from borough to borough.
Profusion of signsWe have used street and desk research alongside a qualitative and quantitative survey to build up a clear overview of the present situation on the streets.
We have identified no fewer than 32 separate wayfinding systems in central London. Apart from sharp differences in information, design and quality, maintaining such a profusion of systems is costly.
Destination names are inconsistent, as are indications of distance. Designs vary widely as to colour, shape, typeface, materials and branding. Systems are maintained by various agencies with inconsistency in standards and maintenance regimes, sometimes giving an appearance of neglect which in turn encourages graffiti and vandalism. There is no common standard for where in the street signs should be positioned. In contrast, road signs for motor vehicles have resolved all these issues decades ago.
London is a complex city and these systems have come into being in order to service a wide variety of needs. Therefore all the things that are successfully achieved by the present signage systems would need to be carefully considered in any new system.
The defining characteristic of the present situation, viewed as a whole, is that it is provider-led and not customer-led. We know from the worlds of commerce and industry that this is not the best way of meeting the needs of the very providers who, by default, have had to institute these systems. In other words, if we think about the needs of pedestrians we will be more effective in encouraging them to walk than if we focus primarily on our own need to promote a particular route or destination.
The present situation
page 14 legible london, a wayfinding study
page 17aig london 2006
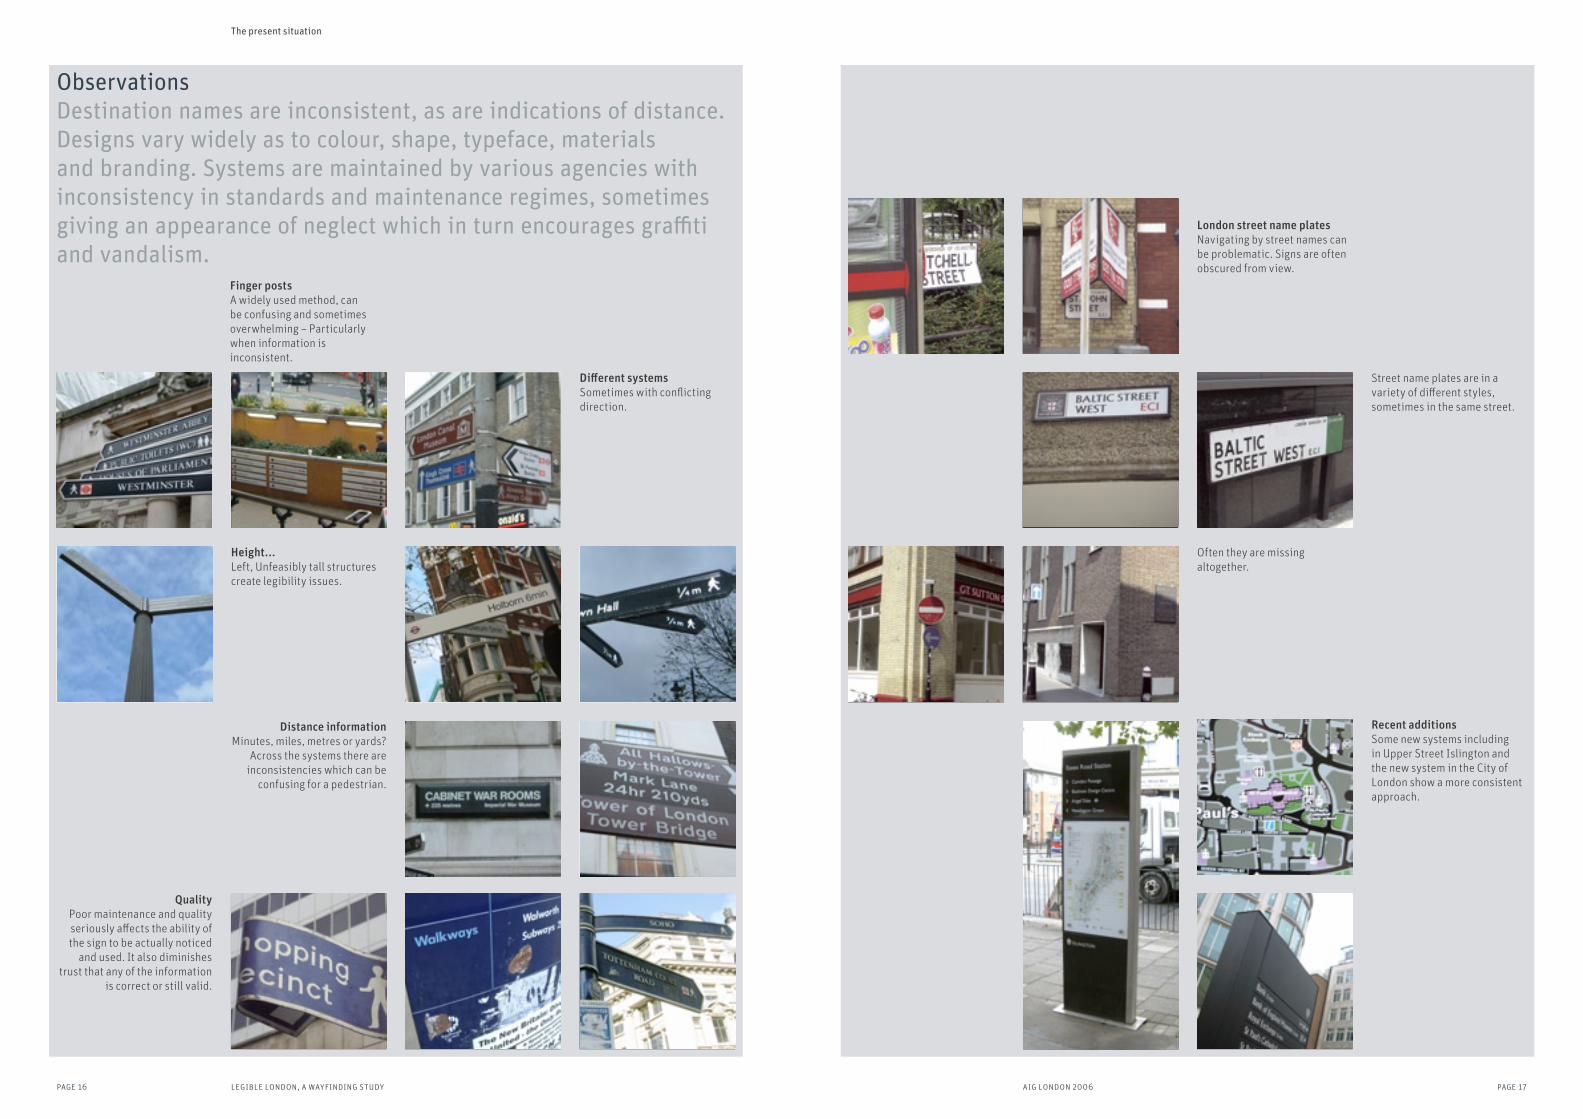
London street name platesNavigating by street names can be problematic. Signs are often obscured from view.
Street name plates are in a variety of different styles, sometimes in the same street.
Recent additionsSome new systems including in Upper Street Islington and the new system in the City of London show a more consistent approach.
Often they are missing altogether.
QualityPoor maintenance and quality seriously affects the ability of the sign to be actually noticed
and used. It also diminishes trust that any of the information
is correct or still valid.
The present situation
Destination names are inconsistent, as are indications of distance. Designs vary widely as to colour, shape, typeface, materials and branding. Systems are maintained by various agencies with inconsistency in standards and maintenance regimes, sometimes giving an appearance of neglect which in turn encourages graffiti and vandalism.
Different systems Sometimes with conflicting direction.
Distance informationMinutes, miles, metres or yards?
Across the systems there are inconsistencies which can be
confusing for a pedestrian.
Height...Left, Unfeasibly tall structures create legibility issues.
Observations
Finger postsA widely used method, can be confusing and sometimes overwhelming – Particularly when information is inconsistent.
page 16 legible london, a wayfinding study
page 18 legible london, a wayfinding study page 19aig london 2006
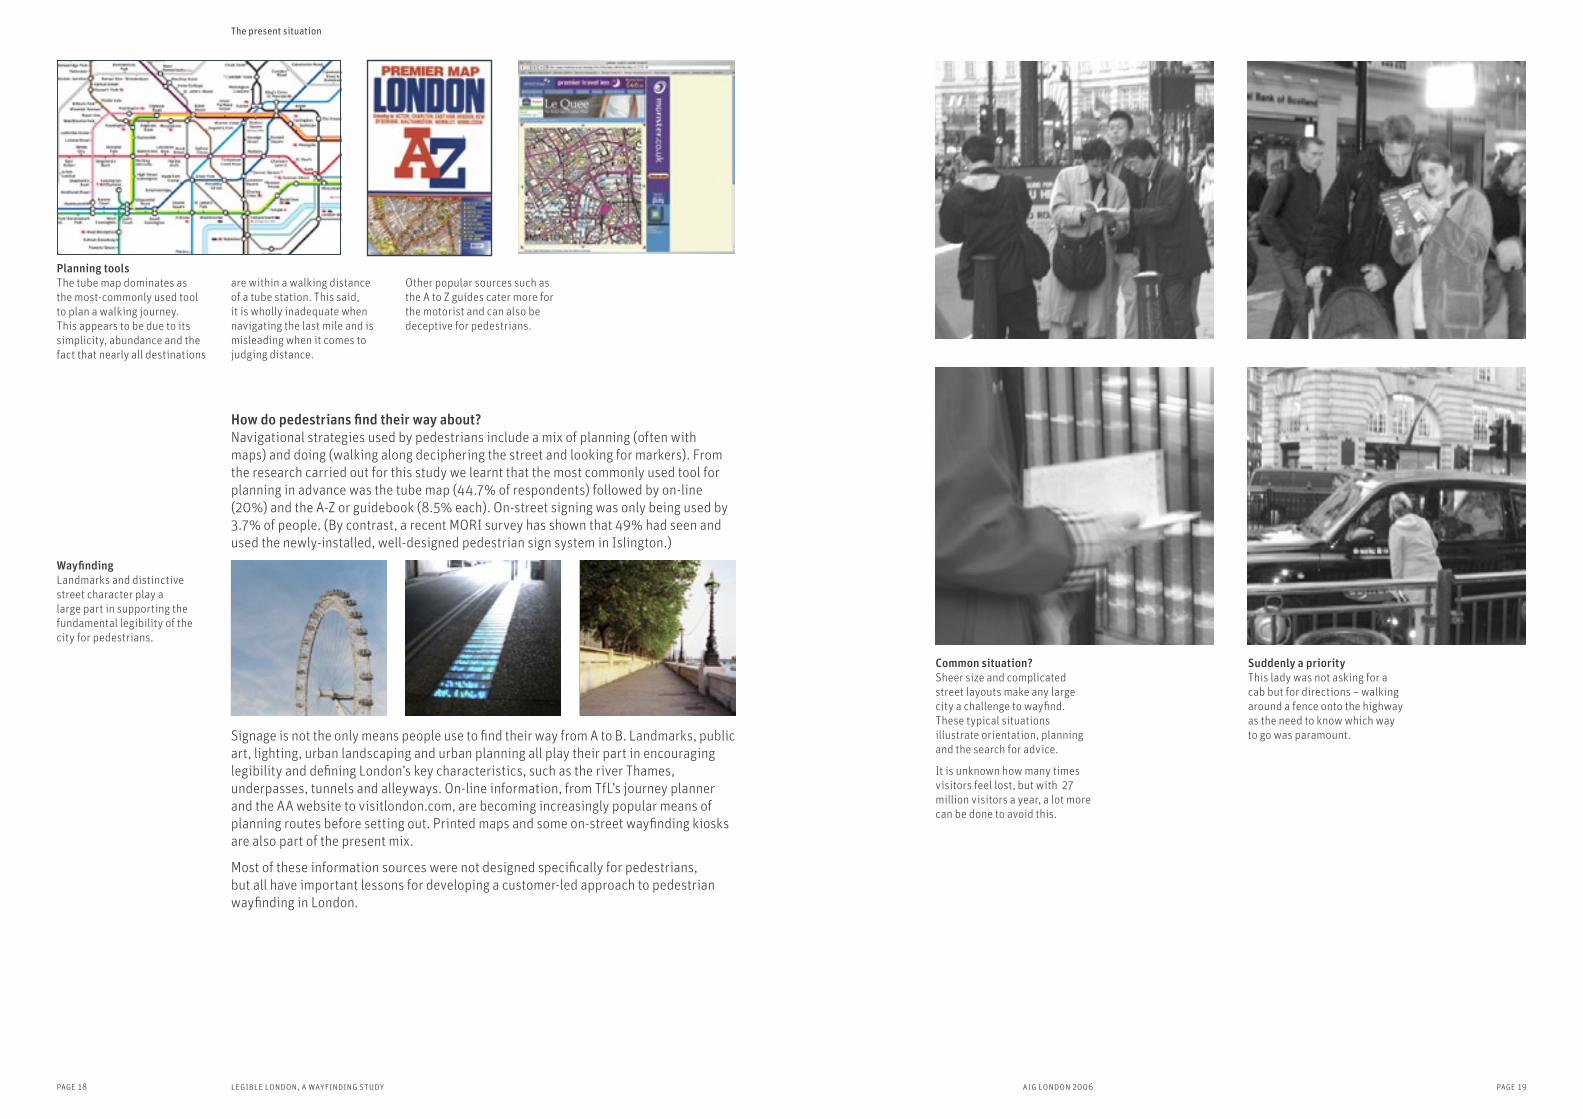
Common situation?Sheer size and complicated street layouts make any large city a challenge to wayfind. These typical situations illustrate orientation, planning and the search for advice.
It is unknown how many times visitors feel lost, but with 27 million visitors a year, a lot more can be done to avoid this.
Suddenly a priorityThis lady was not asking for a cab but for directions – walking around a fence onto the highway as the need to know which way to go was paramount.
How do pedestrians find their way about?Navigational strategies used by pedestrians include a mix of planning (often with maps) and doing (walking along deciphering the street and looking for markers). From the research carried out for this study we learnt that the most commonly used tool for planning in advance was the tube map (44.7% of respondents) followed by on-line (20%) and the A-Z or guidebook (8.5% each). On-street signing was only being used by 3.7% of people. (By contrast, a recent MORI survey has shown that 49% had seen and used the newly-installed, well-designed pedestrian sign system in Islington.)
Signage is not the only means people use to find their way from A to B. Landmarks, public art, lighting, urban landscaping and urban planning all play their part in encouraging legibility and defining London’s key characteristics, such as the river Thames, underpasses, tunnels and alleyways. On-line information, from TfL’s journey planner and the AA website to visitlondon.com, are becoming increasingly popular means of planning routes before setting out. Printed maps and some on-street wayfinding kiosks are also part of the present mix.
Most of these information sources were not designed specifically for pedestrians, but all have important lessons for developing a customer-led approach to pedestrian wayfinding in London.
The present situation
WayfindingLandmarks and distinctive street character play a large part in supporting the fundamental legibility of the city for pedestrians.
Planning toolsThe tube map dominates as the most-commonly used tool to plan a walking journey. This appears to be due to its simplicity, abundance and the fact that nearly all destinations
are within a walking distance of a tube station. This said, it is wholly inadequate when navigating the last mile and is misleading when it comes to judging distance.
Other popular sources such as the A to Z guides cater more for the motorist and can also be deceptive for pedestrians.

page 20 legible london, a wayfinding study page 21aig london 2006
way. Maps had assisted 66% with their journey, with 47% saying that the maps had ‘encouraged’ them to walk. Only 5% said that they did not find them useful.
What this suggests is that an integrated signage and information strategy to support the needs of walkers can be expected to deliver substantial dividends.
Journey time is a more important factor than distance when it comes to deciding whether to walk, with 75% of respondents describing a journey in minutes, rather than metres or miles. Maps and signs can play an important part in forming these judgments (and indeed most had looked at the local area wallmap before leaving the tube station). But neither the A to Z maps designed for drivers, nor even less the diagrammatic tube map, are reliable references for assessing the walk involved. We must therefore look at what is required first from the walker’s point of view.
Walking is a popular way of getting about, but the available information tends to discourage it. As a result, public health suffers, local business loses out, and the strain on our public transport system is far greater than necessary.
London walking distanceA 12–15 minute walk is considered a walkable journey in London. This effective distance when measured from tube stations connects villages, adjacent tube stations and major destinations.
Walkable tube mapWith better information it would be easier to judge when a walk is closer and easier than going by tube. Above –tube stations that are quicker to walk between than go by underground.
Walking, is a popular way of getting about, but the available information tends to discourage it. As a result, public health suffers, local business loses out, and the strain on our public transport system is far greater than necessary.
Changing the culture
London is changingThe capital is going through a period of change and renewal, with landmarks like 30 St Mary Axe (‘The Gherkin’) and Tate Modern – changing the cityscape or breathing new life into our heritage – among the brightest examples of many thriving developments. Business Improvement Districts and other stakeholder organisations play an important part in making sure the changes are beneficial.
The most significant change is just around the corner: the 2012 London Olympics require us to make sure London is welcoming, easy to understand and navigate for an unprecedented number of people from within London and from all over the world. Given the investment Londoners will be making in the Olympics, the London stakeholders share a responsibility to ensure that they deliver lasting benefits for the capital.
Walkable journeysThe study we carried out for this report in central London (The AIG/LSE Cities Study, 2005) showed that two out of every five tube journeys taken from Moorgate are less than two kilometres in length. Even across the tube network as a whole, one in ten journeys are that short – and so are almost half of all bus trips.
5% of tube trips between some central London stations is a distance of less than 800 metres from some central London stations, which means they would take less than ten minutes to walk. TfL figures show that a reduction in passengers of just 3% would significantly reduce tube crowding.
It’s clear many journeys are ‘walkable’ – but how many people could be persuaded to walk, merely through better information? A study by Research Business International (2002) found that 66% of travellers said they would consider walking instead, after being shown a walking map. (Among tourists it’s as high as 80%, and even among city-wise commuters the figure was 60%.)
What can be achieved?Our study also found that 9 out of 10 people exiting from Leicester Square tube station said they “enjoyed” walking in London; and most agreed that – after better weather and less traffic – improved signage would be the best way of encouraging people to walk more. These findings are supported by a MORI study for the London Borough of Islington, which reported in 2005 that 49% of respondents had seen and used map-based signs, and of these 83% were satisfied that the signs had helped them find their
Changing the culture
page 22 legible london, a wayfinding study page 23aig london 2006
A Multi-faceted approachA multi-faceted approach is required to achieve a substantial increase in walking in London.
Encouraging the walking option As we have seen, people are open to the idea of walking if they feel the trip is manageable, and they judge this by the amount of time a journey is likely to take.
This means we can achieve a considerable benefit from providing information about the alternative walking option at the point at which public transport journeys commence. Showing at Charing Cross that Leicester Square is a five-minute walk, the Embankment two minutes, and the South Bank Centre and Covent Garden six minutes each, is likely to have a significant impact on the travel choices particularly of visitors, but also of Londoners – encouraging people to walk instead of making short tube journeys.
This approach can be maximised and supported with a mix of information, including walking maps, local area maps and en route signage.
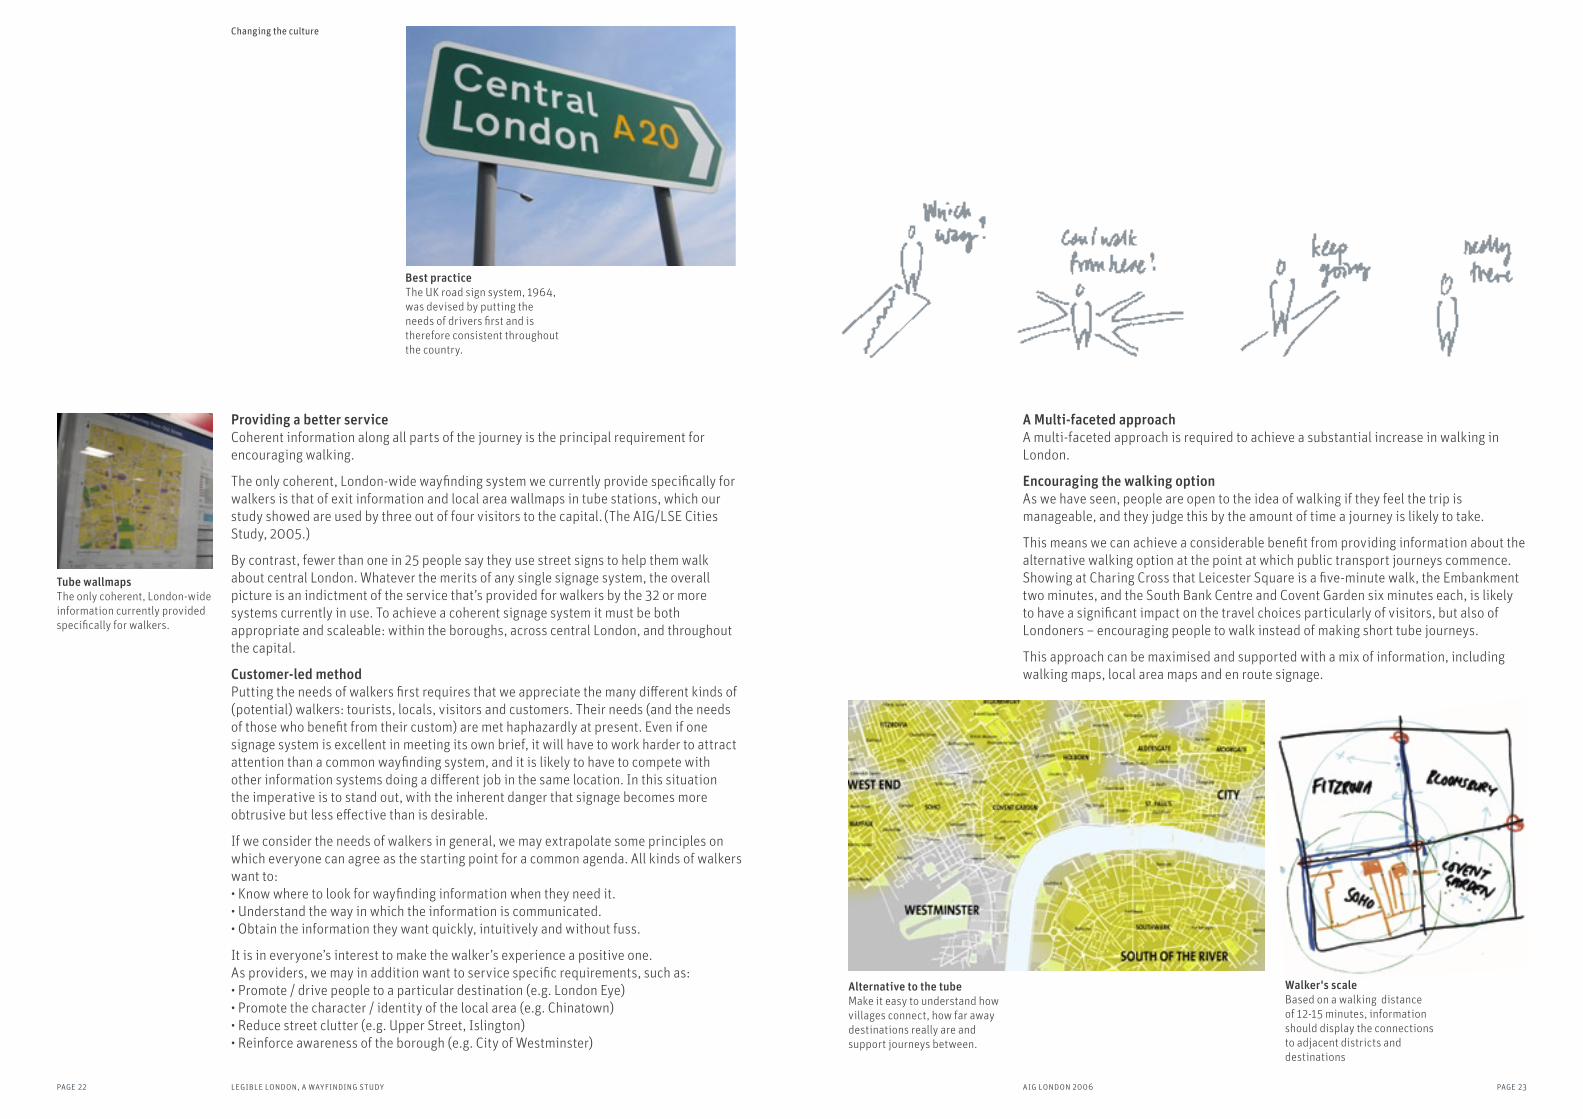
Walker's scaleBased on a walking distance of 12-15 minutes, information should display the connections to adjacent districts and destinations
Alternative to the tube Make it easy to understand how villages connect, how far away destinations really are and support journeys between.
Changing the culture
Providing a better service Coherent information along all parts of the journey is the principal requirement for encouraging walking.
The only coherent, London-wide wayfinding system we currently provide specifically for walkers is that of exit information and local area wallmaps in tube stations, which our study showed are used by three out of four visitors to the capital. (The AIG/LSE Cities Study, 2005.)
By contrast, fewer than one in 25 people say they use street signs to help them walk about central London. Whatever the merits of any single signage system, the overall picture is an indictment of the service that’s provided for walkers by the 32 or more systems currently in use. To achieve a coherent signage system it must be both appropriate and scaleable: within the boroughs, across central London, and throughout the capital.
Customer-led methodPutting the needs of walkers first requires that we appreciate the many different kinds of (potential) walkers: tourists, locals, visitors and customers. Their needs (and the needs of those who benefit from their custom) are met haphazardly at present. Even if one signage system is excellent in meeting its own brief, it will have to work harder to attract attention than a common wayfinding system, and it is likely to have to compete with other information systems doing a different job in the same location. In this situation the imperative is to stand out, with the inherent danger that signage becomes more obtrusive but less effective than is desirable.
If we consider the needs of walkers in general, we may extrapolate some principles on which everyone can agree as the starting point for a common agenda. All kinds of walkers want to:• Know where to look for wayfinding information when they need it.• Understand the way in which the information is communicated.• Obtain the information they want quickly, intuitively and without fuss.
It is in everyone’s interest to make the walker’s experience a positive one. As providers, we may in addition want to service specific requirements, such as: • Promote / drive people to a particular destination (e.g. London Eye) • Promote the character / identity of the local area (e.g. Chinatown) • Reduce street clutter (e.g. Upper Street, Islington) • Reinforce awareness of the borough (e.g. City of Westminster)
Best practiceThe UK road sign system, 1964, was devised by putting the needs of drivers first and is therefore consistent throughout the country.
Tube wallmapsThe only coherent, London-wide information currently provided specifically for walkers.
page 25aig london 2006
The best way of supporting people in building up their mental maps (whether for a tourist visit or for regular travel throughout London) is to rely on the stages that occur naturally in developing a ‘Walker’s Knowledge’ of the capital.
There are generally three factors involved in our mental mapping:• the place we’re in,• the place we’re going to, and• the route to get from one area
to the other.
This process of using routes “connecting areas” is one of the key building blocks in helping people to build their mental maps. We start with specific arrival and destination points, which form our entry into the wayfinding system (“nodes”), and from there we
find out routes between such points. We build up knowledge of the area surrounding the nodes (“locality”) and, gradually, clusters of localities (“neighbourhoods”). Step by step we build up our knowledge and increase our mental maps until we have as much information as we need.
In a city like London this mental map has a hierarchy of around six distinct levels of information. These levels of information could be organised into five regions. A sketch of this approach can be found on page 37.
There’s a good deal of recent research about how we build up our mental maps. We develop ‘place cells’ in the brain corresponding to points in the physical environment
and gradually build them up into a mental map of places, routes and, eventually, areas. The mental map we build is not strictly geographic, but it revolves around the relationship between memorable locations and routes insofar as they are relevant to our needs.
It’s this truth that makes the London tube map so universally admired, even though it was created before much of the research confirmed just why it’s so effective. Physical routes and distances, twists and turns, are of no consequence to the tube traveller. How to get from A to C via B is what counts.
Similar albeit less extreme considerations apply to maps created for drivers the (A to Z) and bus travellers (the spider maps).
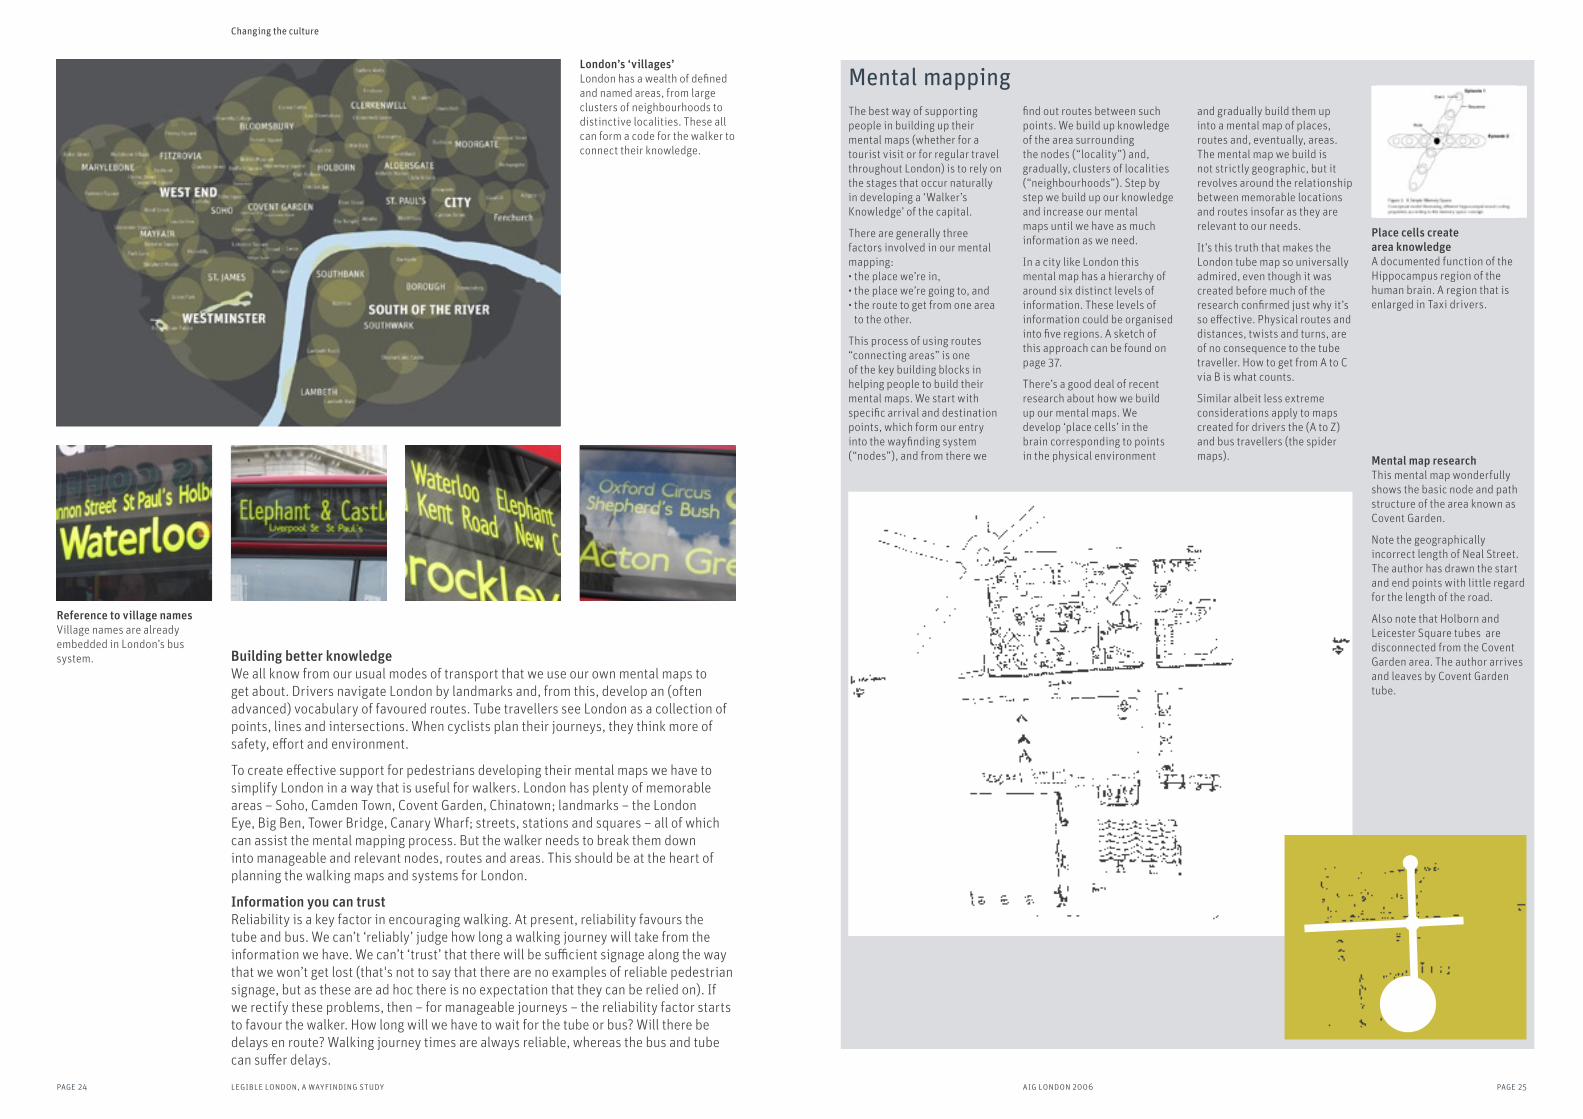
Place cells create area knowledgeA documented function of the Hippocampus region of the human brain. A region that is enlarged in Taxi drivers.
Mental map researchThis mental map wonderfully shows the basic node and path structure of the area known as Covent Garden.
Note the geographically incorrect length of Neal Street. The author has drawn the start and end points with little regard for the length of the road.
Also note that Holborn and Leicester Square tubes are disconnected from the Covent Garden area. The author arrives and leaves by Covent Garden tube.
Mental mapping
Building better knowledge We all know from our usual modes of transport that we use our own mental maps to get about. Drivers navigate London by landmarks and, from this, develop an (often advanced) vocabulary of favoured routes. Tube travellers see London as a collection of points, lines and intersections. When cyclists plan their journeys, they think more of safety, effort and environment.
To create effective support for pedestrians developing their mental maps we have to simplify London in a way that is useful for walkers. London has plenty of memorable areas – Soho, Camden Town, Covent Garden, Chinatown; landmarks – the London Eye, Big Ben, Tower Bridge, Canary Wharf; streets, stations and squares – all of which can assist the mental mapping process. But the walker needs to break them down into manageable and relevant nodes, routes and areas. This should be at the heart of planning the walking maps and systems for London.
Information you can trustReliability is a key factor in encouraging walking. At present, reliability favours the tube and bus. We can’t ‘reliably’ judge how long a walking journey will take from the information we have. We can’t ‘trust’ that there will be sufficient signage along the way that we won’t get lost (that's not to say that there are no examples of reliable pedestrian signage, but as these are ad hoc there is no expectation that they can be relied on). If we rectify these problems, then – for manageable journeys – the reliability factor starts to favour the walker. How long will we have to wait for the tube or bus? Will there be delays en route? Walking journey times are always reliable, whereas the bus and tube can suffer delays.
London’s ‘villages’London has a wealth of defined and named areas, from large clusters of neighbourhoods to distinctive localities. These all can form a code for the walker to connect their knowledge.
Reference to village namesVillage names are already embedded in London’s bus system.
Changing the culture
page 24 legible london, a wayfinding study
page 27aig london 2006
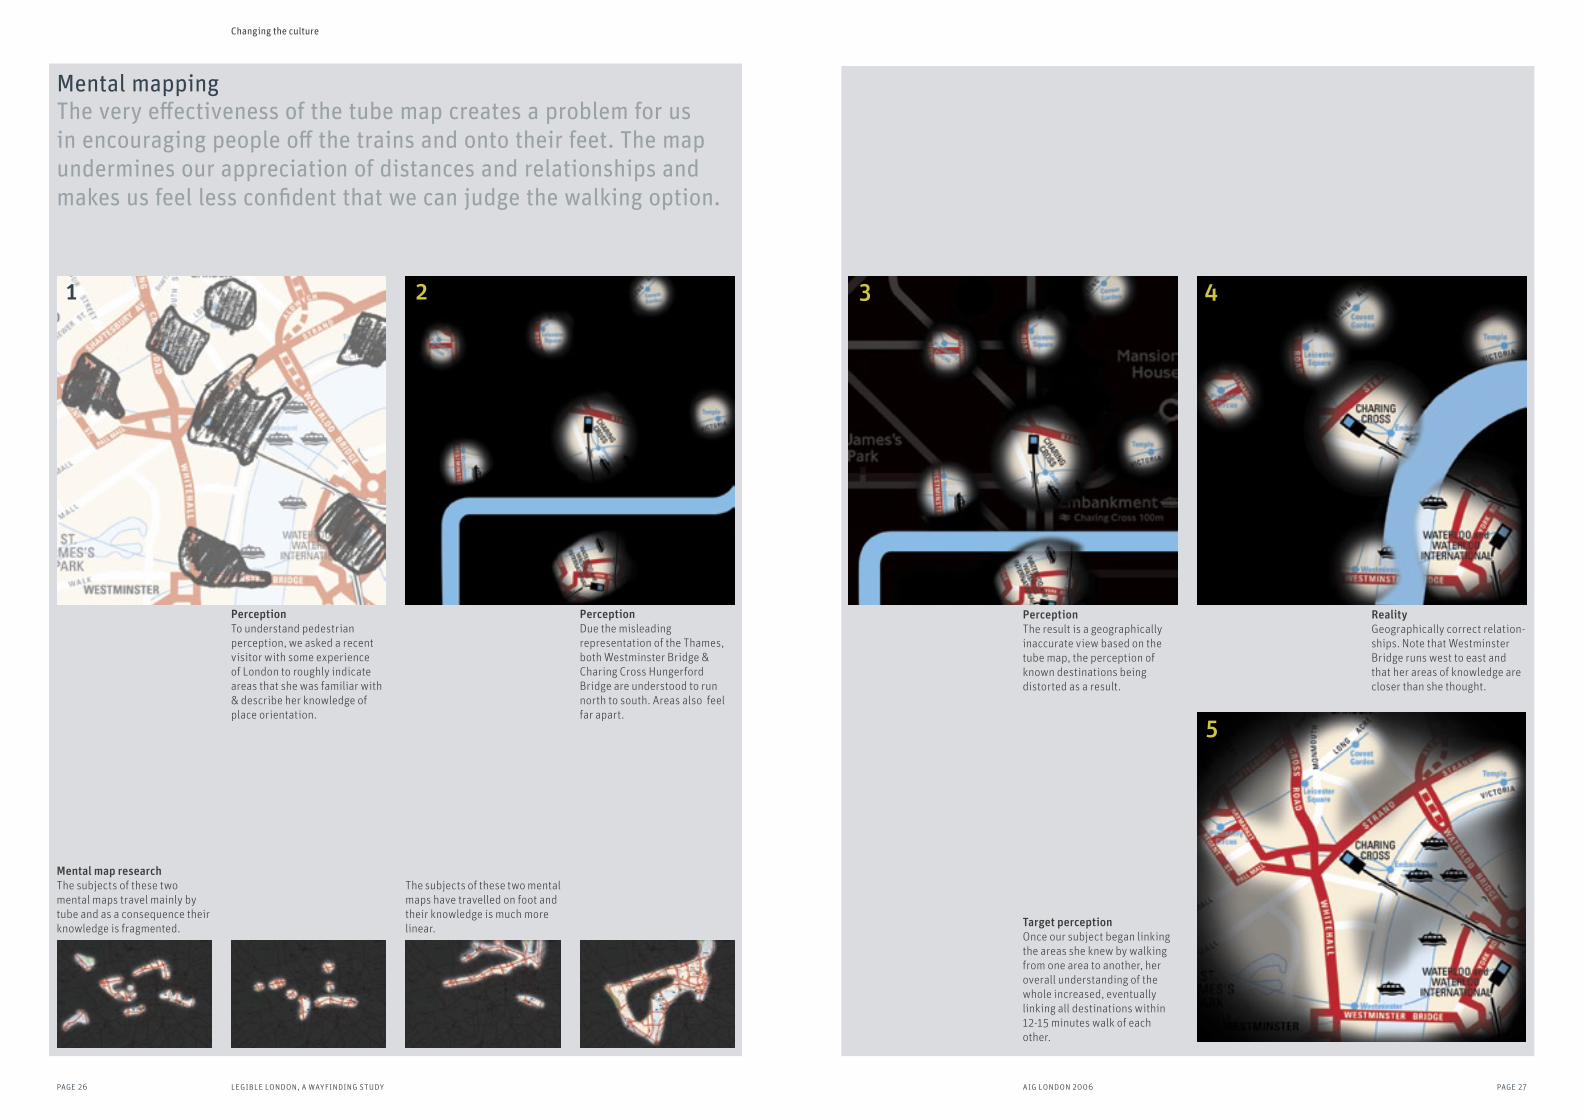
RealityGeographically correct relation-ships. Note that Westminster Bridge runs west to east and that her areas of knowledge are closer than she thought.
3 4
Target perceptionOnce our subject began linking the areas she knew by walking from one area to another, her overall understanding of the whole increased, eventually linking all destinations within 12-15 minutes walk of each other.
5
PerceptionThe result is a geographically inaccurate view based on the tube map, the perception of known destinations being distorted as a result.
The very effectiveness of the tube map creates a problem for us in encouraging people off the trains and onto their feet. The map undermines our appreciation of distances and relationships and makes us feel less confident that we can judge the walking option.
PerceptionTo understand pedestrian perception, we asked a recent visitor with some experience of London to roughly indicate areas that she was familiar with & describe her knowledge of place orientation.
PerceptionDue the misleading representation of the Thames, both Westminster Bridge & Charing Cross Hungerford Bridge are understood to run north to south. Areas also feel far apart.
21
Mental mapping
Mental map researchThe subjects of these two mental maps travel mainly by tube and as a consequence their knowledge is fragmented.
Changing the culture
page 26 legible london, a wayfinding study
The subjects of these two mental maps have travelled on foot and their knowledge is much more linear.
page 29aig london 2006
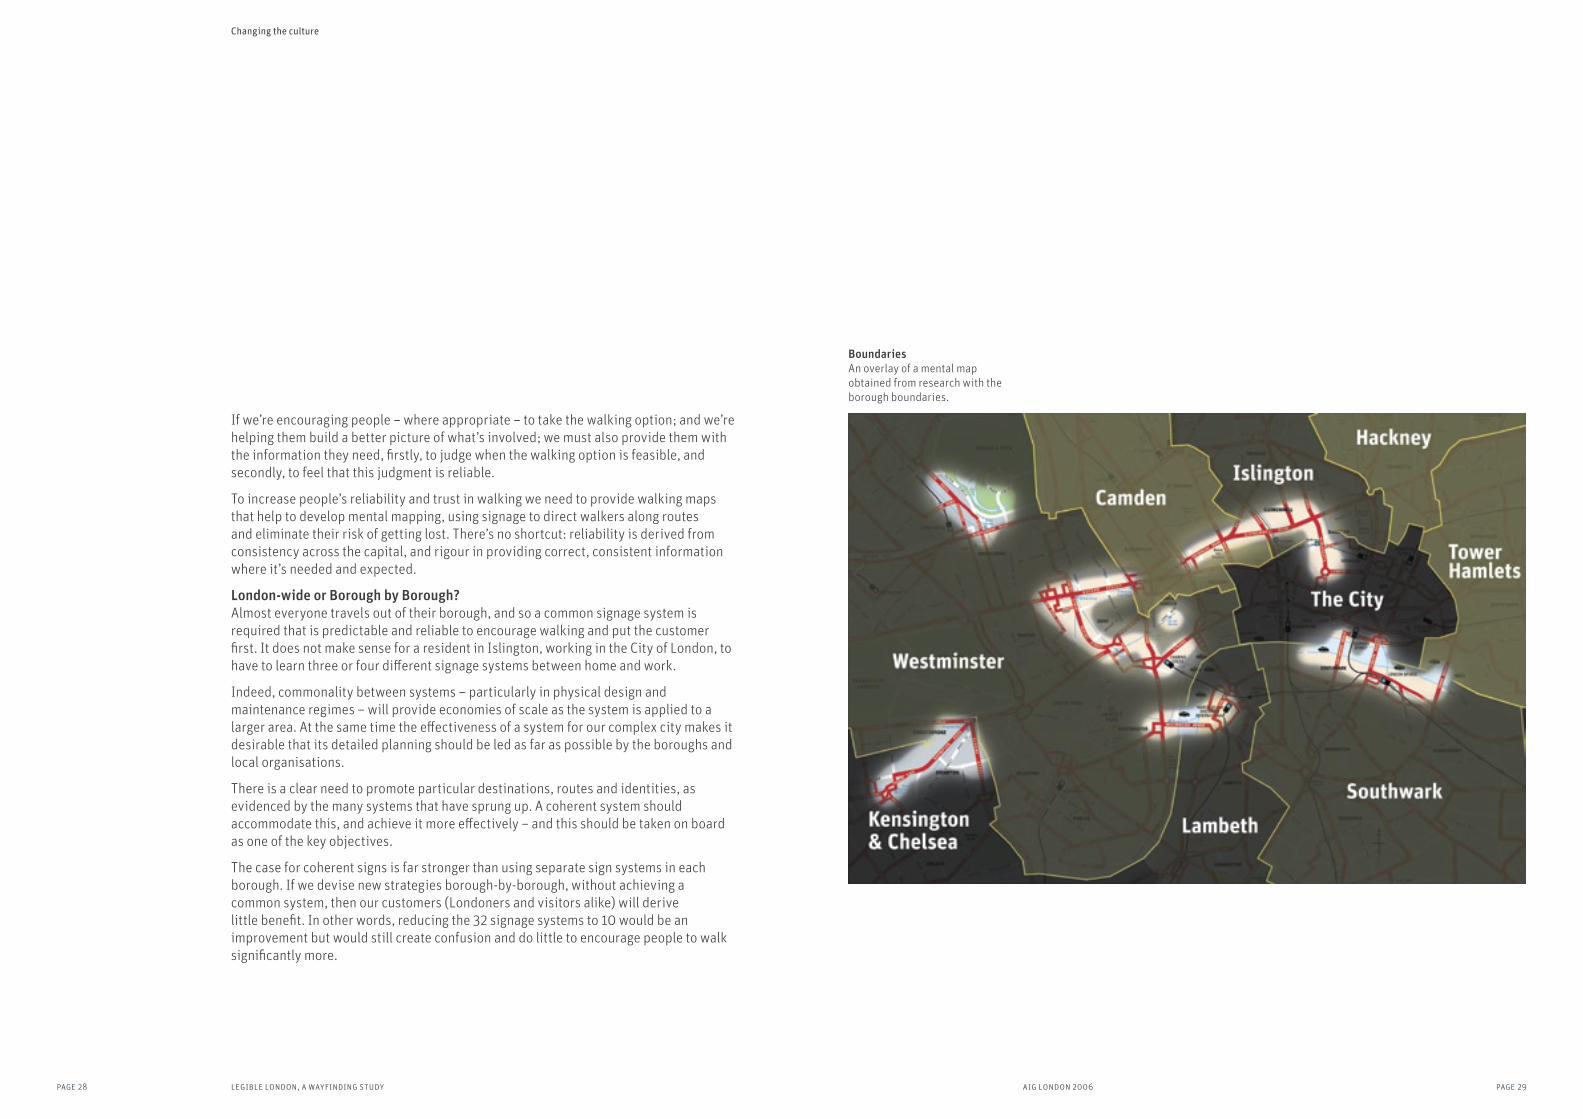
BoundariesAn overlay of a mental map obtained from research with the borough boundaries.
If we’re encouraging people – where appropriate – to take the walking option; and we’re helping them build a better picture of what’s involved; we must also provide them with the information they need, firstly, to judge when the walking option is feasible, and secondly, to feel that this judgment is reliable.
To increase people’s reliability and trust in walking we need to provide walking maps that help to develop mental mapping, using signage to direct walkers along routes and eliminate their risk of getting lost. There’s no shortcut: reliability is derived from consistency across the capital, and rigour in providing correct, consistent information where it’s needed and expected.
London-wide or Borough by Borough?Almost everyone travels out of their borough, and so a common signage system is required that is predictable and reliable to encourage walking and put the customer first. It does not make sense for a resident in Islington, working in the City of London, to have to learn three or four different signage systems between home and work.
Indeed, commonality between systems – particularly in physical design and maintenance regimes – will provide economies of scale as the system is applied to a larger area. At the same time the effectiveness of a system for our complex city makes it desirable that its detailed planning should be led as far as possible by the boroughs and local organisations.
There is a clear need to promote particular destinations, routes and identities, as evidenced by the many systems that have sprung up. A coherent system should accommodate this, and achieve it more effectively – and this should be taken on board as one of the key objectives.
The case for coherent signs is far stronger than using separate sign systems in each borough. If we devise new strategies borough-by-borough, without achieving a common system, then our customers (Londoners and visitors alike) will derive little benefit. In other words, reducing the 32 signage systems to 10 would be an improvement but would still create confusion and do little to encourage people to walk significantly more.
Changing the culture
page 28 legible london, a wayfinding study
page 31aig london 2006
Measures
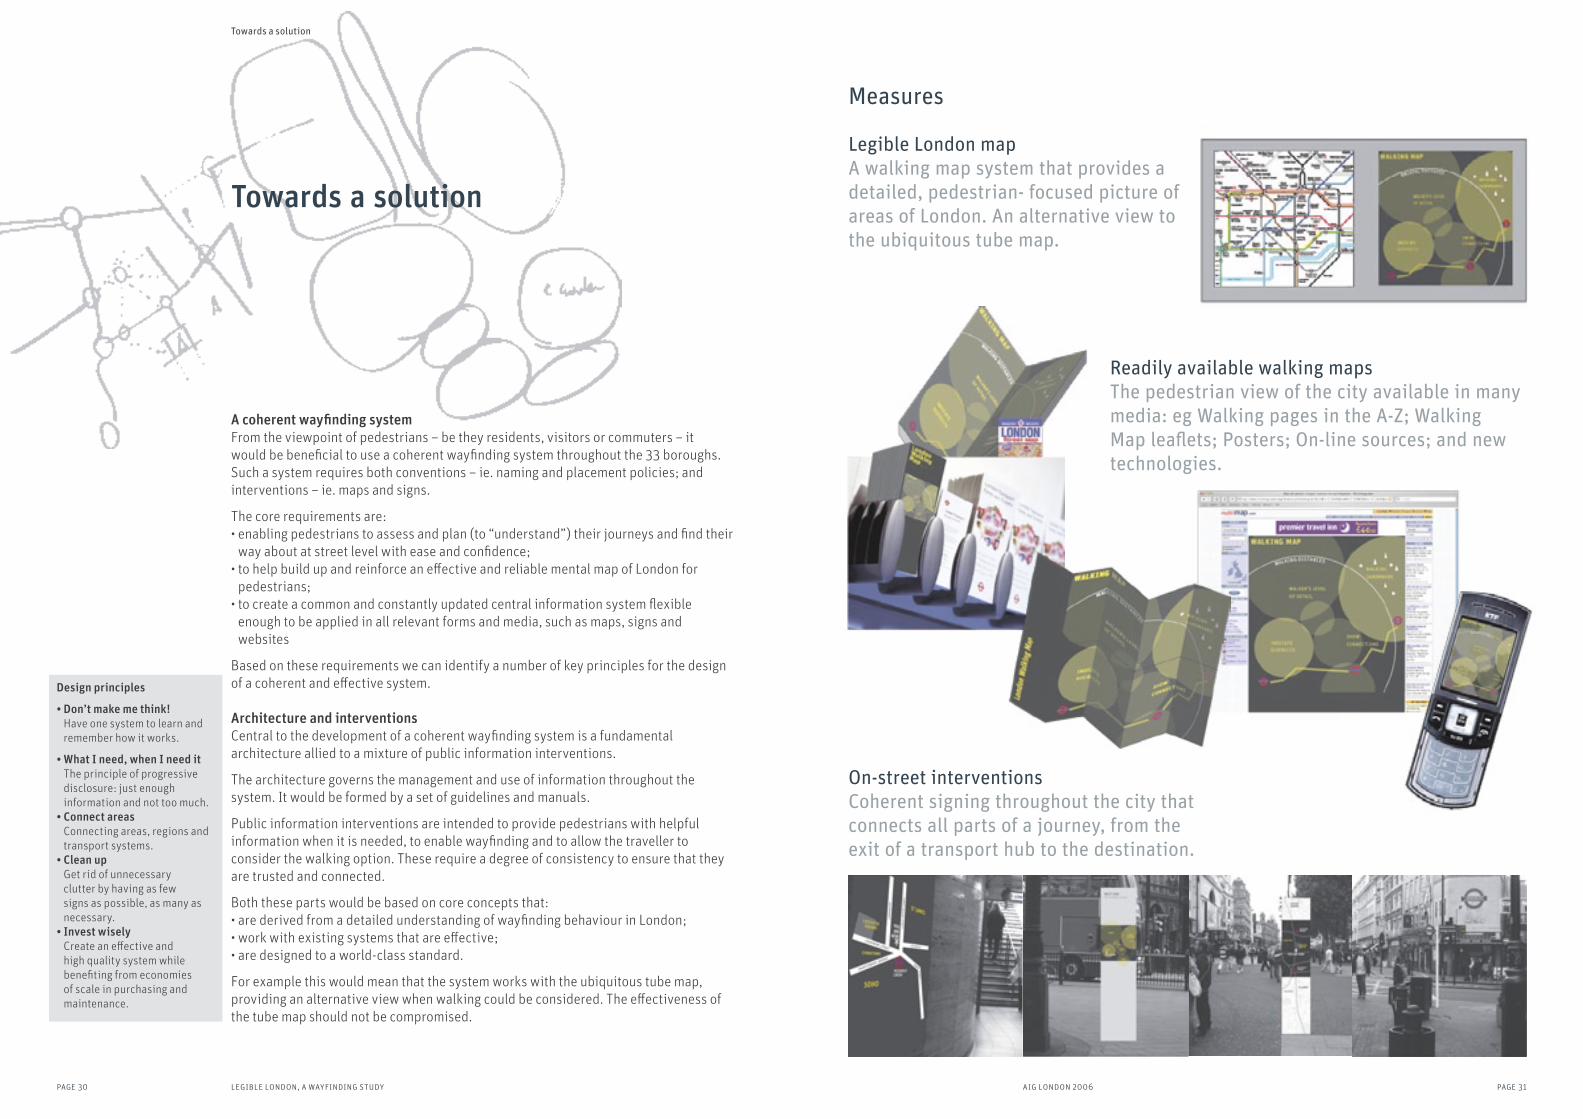
Legible London map A walking map system that provides a detailed, pedestrian- focused picture of areas of London. An alternative view to the ubiquitous tube map.
Readily available walking maps The pedestrian view of the city available in many media: eg Walking pages in the A-Z; Walking Map leaflets; Posters; On-line sources; and new technologies.
On-street interventions Coherent signing throughout the city that connects all parts of a journey, from the exit of a transport hub to the destination.
A coherent wayfinding system From the viewpoint of pedestrians – be they residents, visitors or commuters – it would be beneficial to use a coherent wayfinding system throughout the 33 boroughs. Such a system requires both conventions – ie. naming and placement policies; and interventions – ie. maps and signs.
The core requirements are:• enabling pedestrians to assess and plan (to “understand”) their journeys and find their
way about at street level with ease and confidence;• to help build up and reinforce an effective and reliable mental map of London for
pedestrians;• to create a common and constantly updated central information system flexible
enough to be applied in all relevant forms and media, such as maps, signs and websites
Based on these requirements we can identify a number of key principles for the design of a coherent and effective system.
Architecture and interventionsCentral to the development of a coherent wayfinding system is a fundamental architecture allied to a mixture of public information interventions.
The architecture governs the management and use of information throughout the system. It would be formed by a set of guidelines and manuals.
Public information interventions are intended to provide pedestrians with helpful information when it is needed, to enable wayfinding and to allow the traveller to consider the walking option. These require a degree of consistency to ensure that they are trusted and connected.
Both these parts would be based on core concepts that: • are derived from a detailed understanding of wayfinding behaviour in London; • work with existing systems that are effective; • are designed to a world-class standard.
For example this would mean that the system works with the ubiquitous tube map, providing an alternative view when walking could be considered. The effectiveness of the tube map should not be compromised.
Towards a solution
Design principles
• Don’t make me think! Have one system to learn and remember how it works.
• What I need, when I need it The principle of progressive disclosure: just enough information and not too much.
• Connect areas Connecting areas, regions and transport systems.
• Clean up Get rid of unnecessary clutter by having as few signs as possible, as many as necessary.
• Invest wisely Create an effective and high quality system while benefiting from economies of scale in purchasing and maintenance.
Towards a solution
page 30 legible london, a wayfinding study

page 33aig london 2006
The system would deliver maps for media and city-wide signs. It would also deliver a digital management tool for use by bodies responsible for information in the street.
Planning toolUtilising placement
methodologies, signage planning would be
coherent and effective.
Living Map Architecture
Core dataDigital mapping software would store names, locations and destinations according to a London-wide agreement of criteria. The software would be updateable and managed.
City overview scale
Detailed area scale
The map would be available in a variety of scales.
Map outputsMaster artwork provided for different media and street sign measures, including all information on signs.
Towards a solution
page 32 legible london, a wayfinding study
Map requirements This is an abstract sketch of the requirements of an effective walking map for London.
Ideally it would provide a walker’s level of detail, showing street features that pedestrians notice such as zebra crossings.
In a similar way, landmark buildings, open areas, pedestrianisation, and street character should be included to define points and act as markers.
It should indicate neighbourhood districts and show the connecting routes between them.
Walking distances can be indicated and the map can be provided in heads-up form for signs where it is effective to do so.
The Living MapMaps are one of the keys to learning the street layout of the capital. They are consulted at numerous stages to plan and navigate along a journey. We recommend a single, coordinated mapping system is established.
From the master map we can extract maps of varying scales and formats for different purposes. The information and appearance is always consistent, albeit adjusted for scale and usage. Centrally authored, continually updated and digitally distributed, the system constitutes a ‘living map’ for pedestrians.
The conventions, policies, tools and methods that together comprise the system need to be captured in a Walkers’ Wayfinding Manual for London that provides clear guidance to all agencies and stakeholders, yet sufficient flexibility to meet their wide-ranging needs.
Walking maps
On-streetA-Z maps Transport
interchangesDigital devices Online &
Journey planners
Pedestrian & tourist maps
page 35aig london 2006
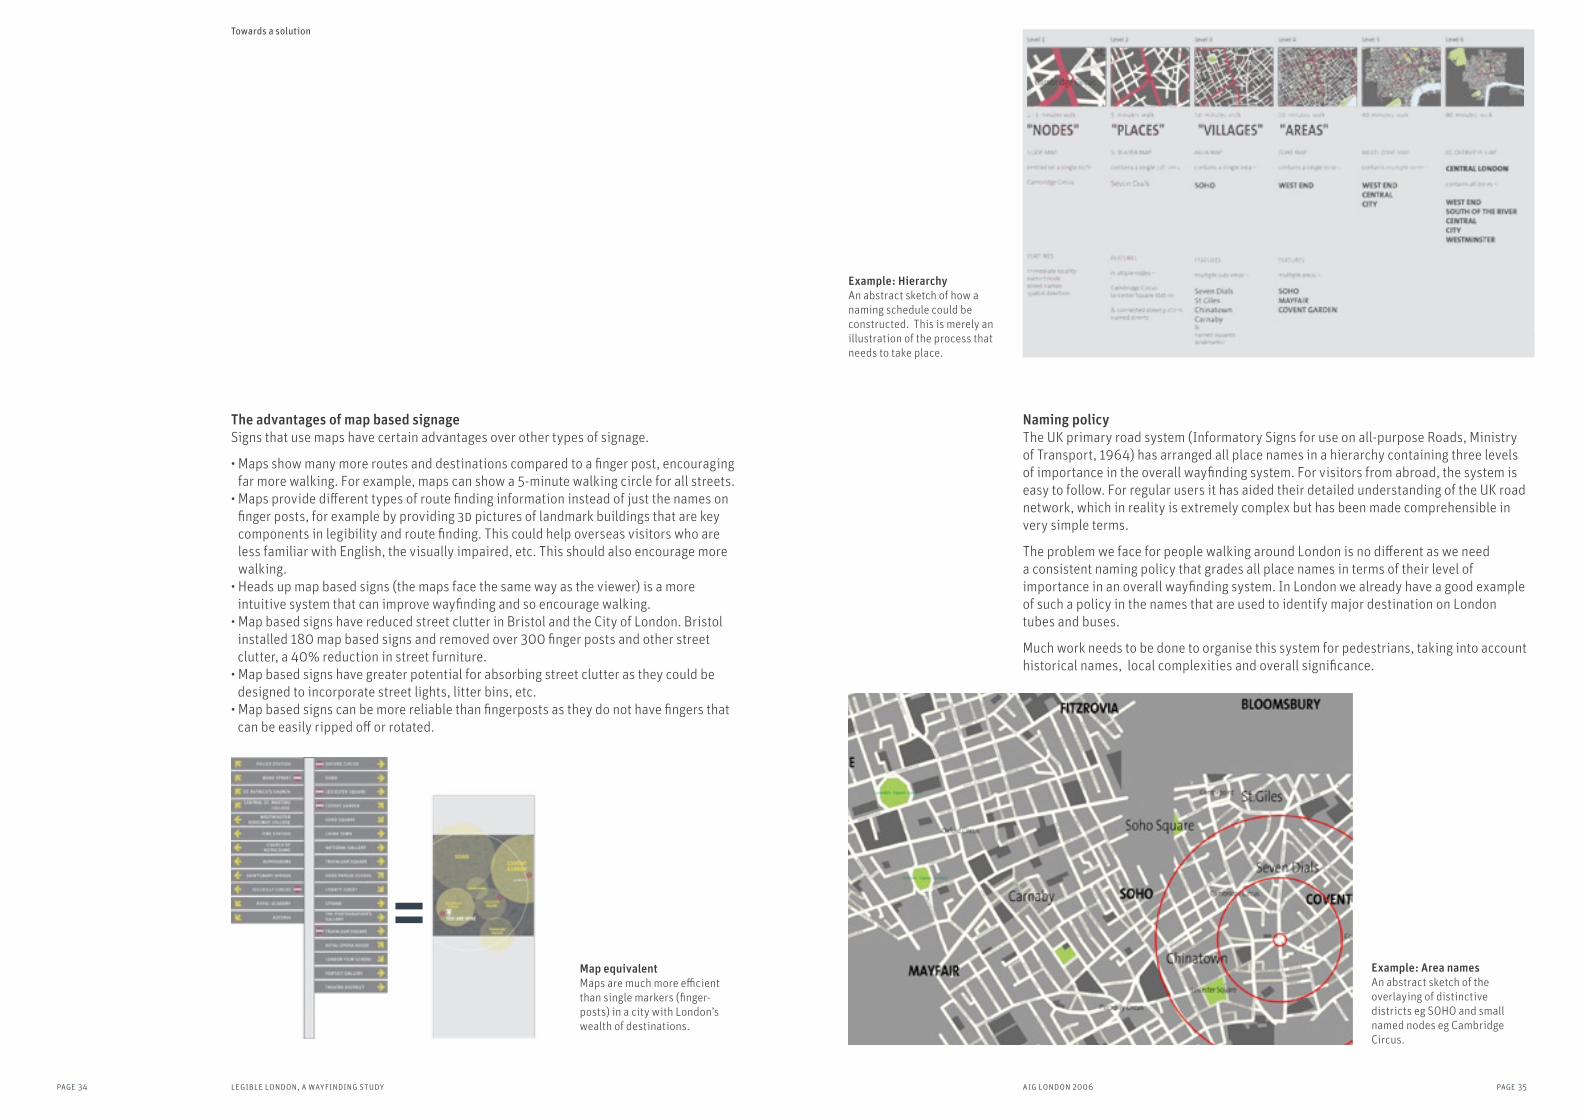
Naming policyThe UK primary road system (Informatory Signs for use on all-purpose Roads, Ministry of Transport, 1964) has arranged all place names in a hierarchy containing three levels of importance in the overall wayfinding system. For visitors from abroad, the system is easy to follow. For regular users it has aided their detailed understanding of the UK road network, which in reality is extremely complex but has been made comprehensible in very simple terms.
The problem we face for people walking around London is no different as we need a consistent naming policy that grades all place names in terms of their level of importance in an overall wayfinding system. In London we already have a good example of such a policy in the names that are used to identify major destination on London tubes and buses.
Much work needs to be done to organise this system for pedestrians, taking into account historical names, local complexities and overall significance.
Example: HierarchyAn abstract sketch of how a naming schedule could be constructed. This is merely an illustration of the process that needs to take place.
Example: Area namesAn abstract sketch of the overlaying of distinctive districts eg SOHO and small named nodes eg Cambridge Circus.
Towards a solution
page 34 legible london, a wayfinding study
The advantages of map based signageSigns that use maps have certain advantages over other types of signage.
• Maps show many more routes and destinations compared to a finger post, encouraging far more walking. For example, maps can show a 5-minute walking circle for all streets.
• Maps provide different types of route finding information instead of just the names on finger posts, for example by providing 3d pictures of landmark buildings that are key components in legibility and route finding. This could help overseas visitors who are less familiar with English, the visually impaired, etc. This should also encourage more walking.
• Heads up map based signs (the maps face the same way as the viewer) is a more intuitive system that can improve wayfinding and so encourage walking.
• Map based signs have reduced street clutter in Bristol and the City of London. Bristol installed 180 map based signs and removed over 300 finger posts and other street clutter, a 40% reduction in street furniture.
• Map based signs have greater potential for absorbing street clutter as they could be designed to incorporate street lights, litter bins, etc.
• Map based signs can be more reliable than fingerposts as they do not have fingers that can be easily ripped off or rotated.
=Map equivalentMaps are much more efficient than single markers (finger-posts) in a city with London’s wealth of destinations.
page 37aig london 2006
WEST ENDPiccadilly Circus
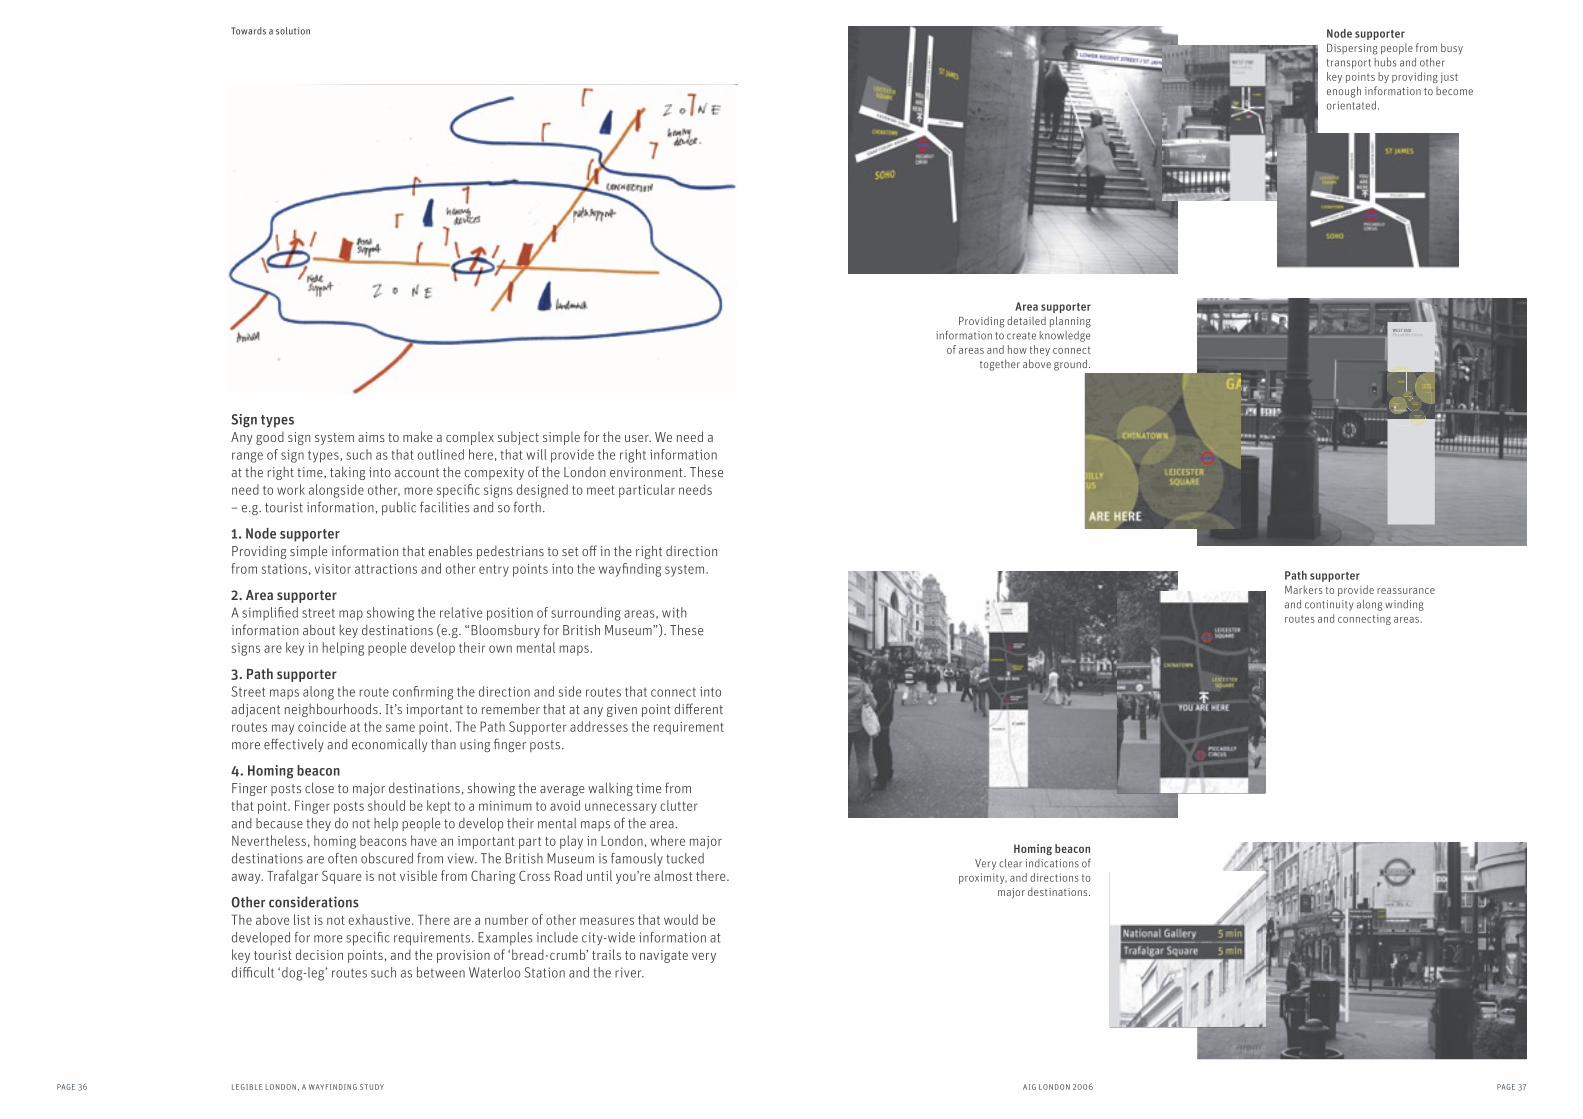
Node supporterDispersing people from busy transport hubs and other key points by providing just enough information to become orientated.
Area supporterProviding detailed planning
information to create knowledge of areas and how they connect
together above ground.
Path supporterMarkers to provide reassurance and continuity along winding routes and connecting areas.
Homing beaconVery clear indications of
proximity, and directions to major destinations.
Sign types Any good sign system aims to make a complex subject simple for the user. We need a range of sign types, such as that outlined here, that will provide the right information at the right time, taking into account the compexity of the London environment. These need to work alongside other, more specific signs designed to meet particular needs – e.g. tourist information, public facilities and so forth.
1. Node supporterProviding simple information that enables pedestrians to set off in the right direction from stations, visitor attractions and other entry points into the wayfinding system.
2. Area supporterA simplified street map showing the relative position of surrounding areas, with information about key destinations (e.g. “Bloomsbury for British Museum”). These signs are key in helping people develop their own mental maps.
3. Path supporterStreet maps along the route confirming the direction and side routes that connect into adjacent neighbourhoods. It’s important to remember that at any given point different routes may coincide at the same point. The Path Supporter addresses the requirement more effectively and economically than using finger posts.
4. Homing beaconFinger posts close to major destinations, showing the average walking time from that point. Finger posts should be kept to a minimum to avoid unnecessary clutter and because they do not help people to develop their mental maps of the area. Nevertheless, homing beacons have an important part to play in London, where major destinations are often obscured from view. The British Museum is famously tucked away. Trafalgar Square is not visible from Charing Cross Road until you’re almost there.
Other considerationsThe above list is not exhaustive. There are a number of other measures that would be developed for more specific requirements. Examples include city-wide information at key tourist decision points, and the provision of ‘bread-crumb’ trails to navigate very difficult ‘dog-leg’ routes such as between Waterloo Station and the river.
Towards a solution
page 36 legible london, a wayfinding study
page 39aig london 2006
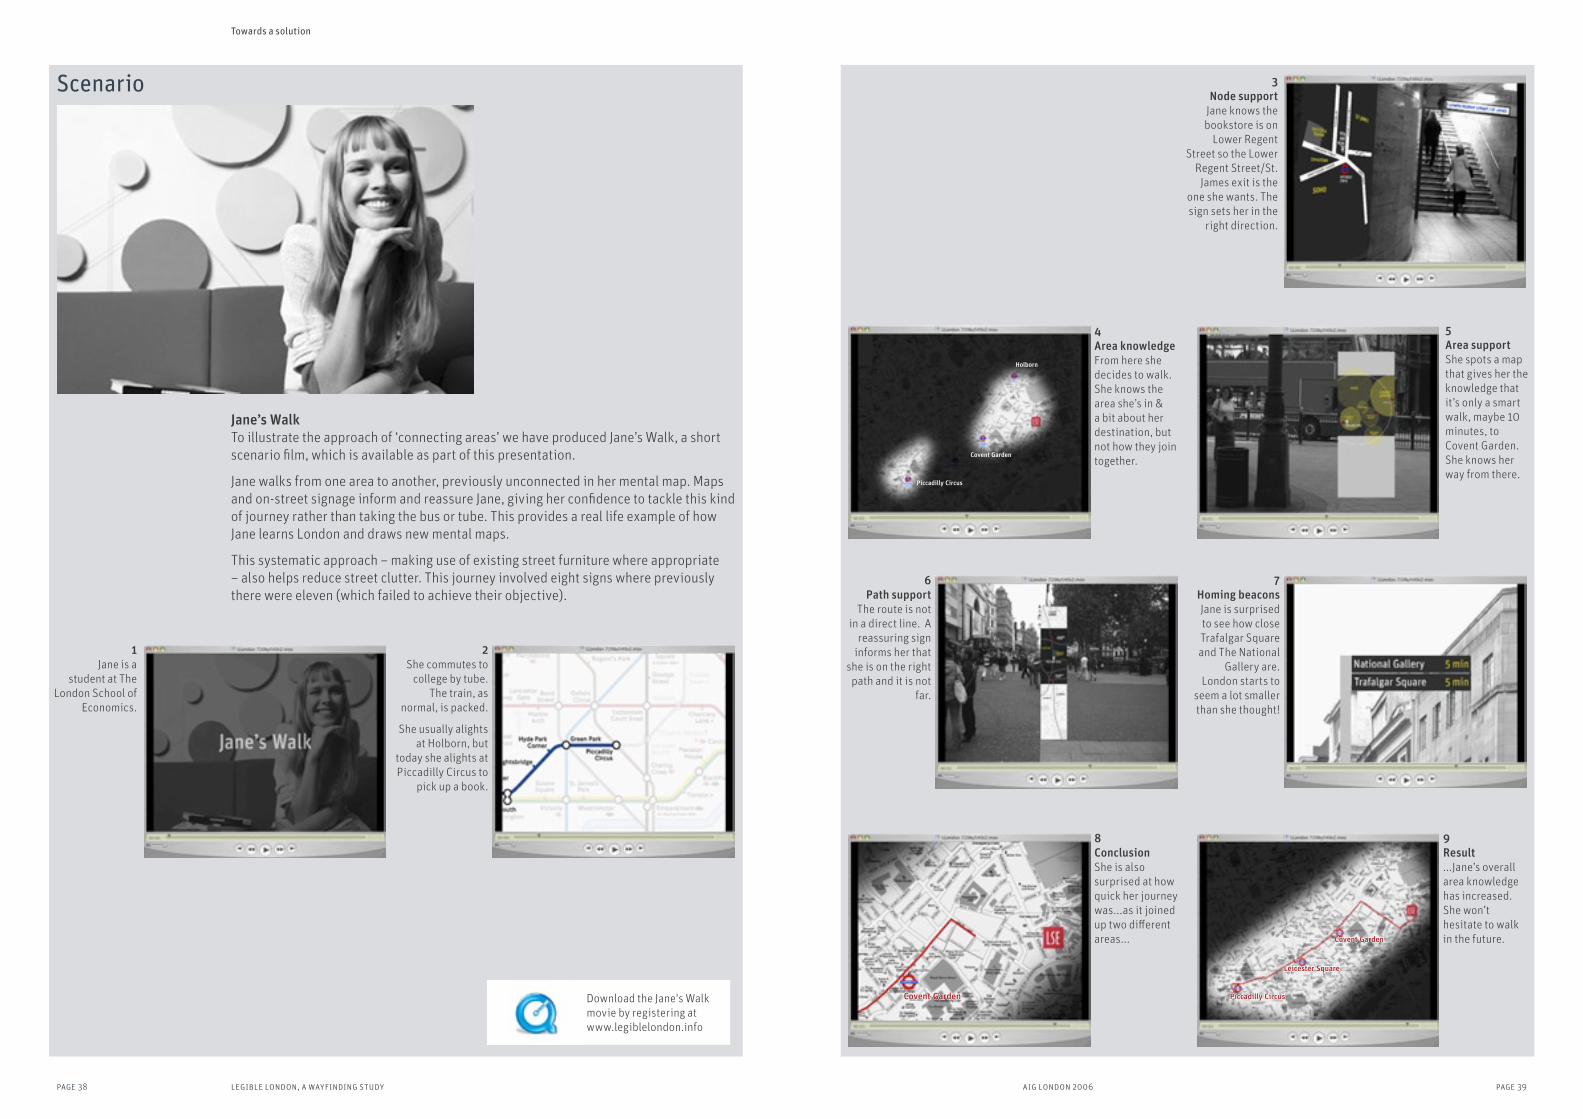
3Node support
Jane knows the bookstore is on
Lower Regent Street so the Lower
Regent Street/St. James exit is the
one she wants. The sign sets her in the
right direction.
4Area knowledgeFrom here she decides to walk. She knows the area she’s in & a bit about her destination, but not how they join together.
5Area supportShe spots a map that gives her the knowledge that it’s only a smart walk, maybe 10 minutes, to Covent Garden. She knows her way from there.
6Path support
The route is not in a direct line. A
reassuring sign informs her that
she is on the right path and it is not
far.
7Homing beaconsJane is surprised to see how close Trafalgar Square and The National
Gallery are. London starts to
seem a lot smaller than she thought!
8ConclusionShe is also surprised at how quick her journey was...as it joined up two different areas...
9Result...Jane’s overall area knowledge has increased. She won’t hesitate to walk in the future.
Piccadilly Circus
Covent Garden
Holborn
Piccadilly Circus
Leicester Square
Covent Garden
Covent Garden
Towards a solution
page 38 legible london, a wayfinding study
Jane’s WalkTo illustrate the approach of ‘connecting areas’ we have produced Jane’s Walk, a short scenario film, which is available as part of this presentation.
Jane walks from one area to another, previously unconnected in her mental map. Maps and on-street signage inform and reassure Jane, giving her confidence to tackle this kind of journey rather than taking the bus or tube. This provides a real life example of how Jane learns London and draws new mental maps.
This systematic approach – making use of existing street furniture where appropriate – also helps reduce street clutter. This journey involved eight signs where previously there were eleven (which failed to achieve their objective).
1Jane is a
student at The London School of
Economics.
2She commutes to
college by tube. The train, as
normal, is packed.
She usually alights at Holborn, but
today she alights at Piccadilly Circus to
pick up a book.
Scenario
Download the Jane's Walk movie by registering at www.legiblelondon.info

page 41aig london 2006
Bearing this in mind, the information that’s appropriate varies from point to point. Each sign needs to be classified according to its function (or multiple functions).• Arrival points, for example, require information to aid dispersal and orientation.• Decision points call for local area knowledge. • En-route signs require us to support wayfinding from that point to the indicated
destination. • Primary destinations need to be found from all appropriate arrival or entry points.
FrequencyA certain frequency of signs is required for the system to work. Signs need to be placed where they are expected: missing sections undermine the overall usefulness of the whole system. It is important to get the right balance between effective placement of walking signs and cluttering up the streets.
Reducing clutter is one of the major benefits that can be achieved by introducing a coherent pedestrian sign system, especially using map-based signs, across the 33 boroughs.
The idea is to replace inconsistent and untidy elements with a useful, coherent, managed and respected system. The street environment will benefit in various ways:• Consistent look and placement creates a tidier streetscape.• Our studies suggest the overall number of signs can be reduced.• A managed signage system reduces vandalism and makes it easier to combat.
Sign type quantity estimate for area shown24 Node supporters27 Area supporters20 Path supporters45 Homing beacons
Clutter reductionAn opportunity for street clutter reduction is available as a component of a London-wide sign system.
PlacementThe introduction of a coherent system will tidy up the street environment by replacing inconsistent interventions with a coordinated range of useful street furniture. At present there is little consistency in the placement of signs in any given location. Clear guidelines need to be developed for the height, pavement location, fixing and so forth, and it is also critical that the signs are located where we need them, using the principle: ‘as few as possible, as many as necessary’.
We have already identified the points at which tube and bus journeys commence as good locations to encourage the walking option. Taking this a step further, information needs to be provided at the points at which walking commences about manageable destinations and routes. Taking both together, we are looking at tube, bus and railway stations, landmarks, major public facilities and tourist attractions as key information points. Getting this selection of starting locations right requires consultation with stakeholders and an awareness of work done by others, such as the London Functional Walking Network (CLP, Intelligent Space, 2004).
Planning tools at the ‘hubs’ need to be supplemented by signs en route using the same principle. There’s nothing worse than following a sign and then being abandoned at a key junction halfway through your walk. Therefore consistent and predictable positioning of signs is essential, with sufficient flexibility to fit in with local circumstances. Procedures are required to ensure that this is correctly and intelligently achieved.
Progressive disclosureThe 1963 methodology for the placement of UK road signs, which uses the principle of “progressive disclosure” of information (telling people what they need to know when they need to know it), is still effective forty years later. Information design and usability have been the guiding principles in the development of this system.
Towards a solution
page 40 legible london, a wayfinding study
Best practiceThe original document detailing the placement methodology for the UK Road Sign System, 1964. Robust methodologies like this should be developed to determine where and what should be signed.

page 43aig london 2006
September 2005
Save timeSave moneyGet fitSee more
The LondonWalking MapThe London
Walking Map
Legibility and special needs must be taken into account, following the relevant statutory requirements and current best practice.
Elements involved in the information design include:• Typeface• Colour palette• Icons• Layout• Diagram styles
Some or all of these elements may be used in all kinds of (official or licensed) maps, signs, on-line and mobile displays.
Level of information Where the London walking map fits in:
Technical Pedestrian Vehicular Transport systems
Geographic >
A Walking Map should feature: geographic information, London’s landmarks, London’s known area villages and the main walking routes between areas and villages.
PromotionImprovement in information can be supported by awareness campaigns.
Towards a solution
page 42 legible london, a wayfinding study
DesignThere are many factors to take into account in designing an effective and coherent information system. These include:1. A distinct and limited product range.2. Durability and ease of maintenance of the materials.3. Health & Safety considerations.4. Use of colour.5. Lighting possibilities.6. Predictable and coherent positioning.7. Information design: clarity, appealing, consistent naming, indication of distance.8. Branding: permanent (eg Camden) and temporary (eg Olympics).9. Inclusivity, accessibility and compliance with the Disability Discrimination Act.10. Use of technology – e.g. SMS, GPS/GPRS, Web, Kiosks.11. Relationship with residual and new ‘external’ information, clear boundaries and
interface between this and other necessary public information systems.12. Keeping and updating a central database of information will further enhance the
reliability of the information on our street signs, and help ensure that the system is fully scaleable within the boroughs and throughout London.
13. Need to minimise vandalism.14. Absorb or remove street furniture to reduce street clutter wherever possible.
Some of these issues are addressed in more detail in Appendix C – Notes on design and maintenance. We are also building on a great deal of existing work that has been done by the London boroughs and others.
Creating a clear visual identity for London’s pedestrian wayfinding system will help people to recognise and use it. While it can be designed to reflect the diversity of areas and venues, it needs to be both distinctive as the “walking information” and complementary to other coordinated wayfinding systems such as bus, roads and tube.
Best practiceExample of a specifically designed walking map built to indicate local area knowledge in Bristol. Highlighting landmarks can help make the links between maps and the reality on the ground.
Diagrammatic <
page 45aig london 2006
ConclusionThe research, consultation and considerations set out in this report have led us to conclude that the introduction of a coherent pedestrian sign system can deliver significant environmental and economic benefits not only for central London but for all the 33 boroughs. Accordingly we recommend that such a pedestrian signage system be fully developed and installed for London.
It is essential that any scheme is implemented properly. There are considerable dangers in taking a piecemeal approach, dictated by short-term considerations and ad hoc resources. Taking local circumstances into account, it may well be that existing systems will continue to be used where possible and replaced over time. Even if implemented in stages, the “information design architecture” must be fully resolved at the outset to ensure the system is robust and sufficiently tested. In order to achieve these requirements we have set out a draft project plan and initial estimated costing for central London in Appendix D.
The 2012 Olympics will bring an unprecedented number of visitors to London, and with it a clear opportunity to implement this project and bring lasting benefit not only to the areas directly involved but to the entire capital. A great deal of wayfinding work already has to be undertaken as part of the planned transport infrastructure improvements for the Olympics and it would be foolish not to try and coordinate this with the walking requirements identified in this report. The project plan (Appendix D) therefore proposes that a coherent pedestrian wayfinding system for London be developed in time for a significant rollout by 2010-11, an objective that requires work to commence as a matter of urgency.
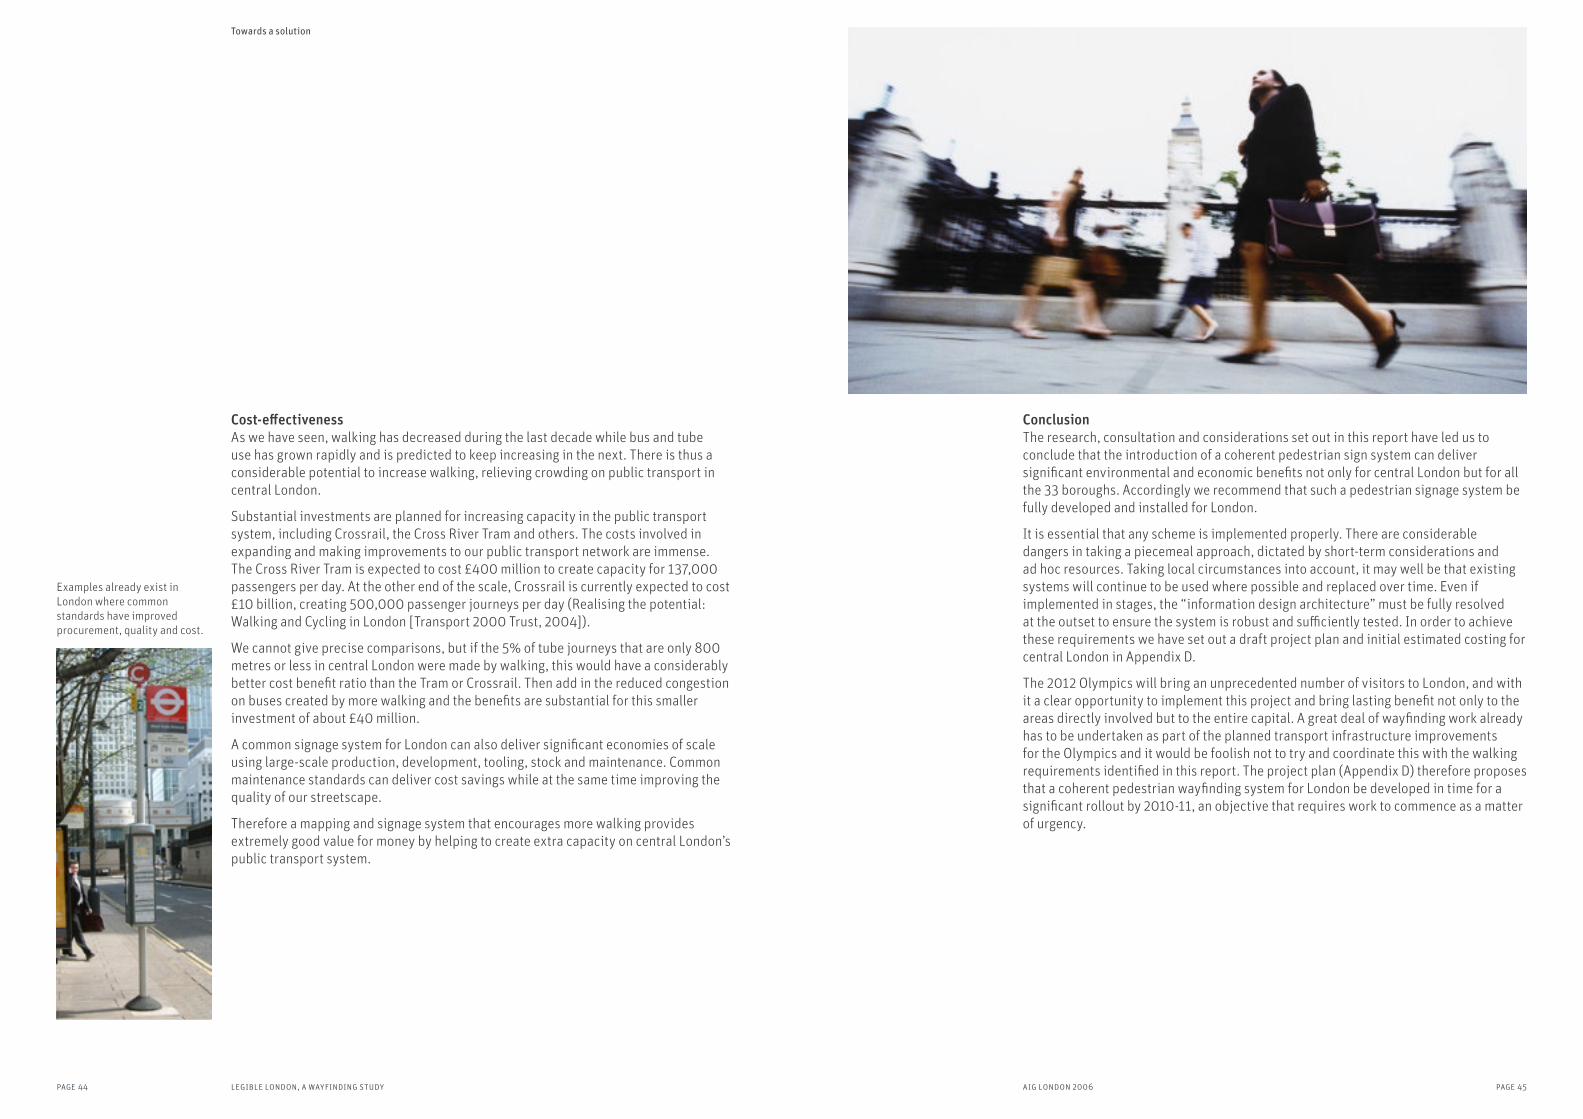
Cost-effectivenessAs we have seen, walking has decreased during the last decade while bus and tube use has grown rapidly and is predicted to keep increasing in the next. There is thus a considerable potential to increase walking, relieving crowding on public transport in central London.
Substantial investments are planned for increasing capacity in the public transport system, including Crossrail, the Cross River Tram and others. The costs involved in expanding and making improvements to our public transport network are immense. The Cross River Tram is expected to cost £400 million to create capacity for 137,000 passengers per day. At the other end of the scale, Crossrail is currently expected to cost £10 billion, creating 500,000 passenger journeys per day (Realising the potential: Walking and Cycling in London [Transport 2000 Trust, 2004]).
We cannot give precise comparisons, but if the 5% of tube journeys that are only 800 metres or less in central London were made by walking, this would have a considerably better cost benefit ratio than the Tram or Crossrail. Then add in the reduced congestion on buses created by more walking and the benefits are substantial for this smaller investment of about £40 million.
A common signage system for London can also deliver significant economies of scale using large-scale production, development, tooling, stock and maintenance. Common maintenance standards can deliver cost savings while at the same time improving the quality of our streetscape.
Therefore a mapping and signage system that encourages more walking provides extremely good value for money by helping to create extra capacity on central London’s public transport system.
Towards a solution
page 44 legible london, a wayfinding study
Examples already exist in London where common standards have improved procurement, quality and cost.
page 46 legible london, a wayfinding study page 47aig london 2006
Appendix A – User research survey
In collaboration with the Cities team of Enterprise LSE (the consultancy arm of the London School of Economics), we conducted field research questioning pedestrians as they left Leicester Square tube station in March 2005. The findings are summarised below. A full report is available from CLP on request.
Respondent profile• 284 people were surveyed.• 63% were London residents, the remainder visitors.
Key findings• 36% had boarded at another Zone 1 station.• 5% had boarded at a station less than 800m away.• 93% intended to continue their journey on foot.• 88% enjoyed walking in London.• 98% were comfortable with signs in English.• 77% referred to relative distance by minutes rather than miles. The understanding
of actual distance was 73% incorrect. Fewer than 60% could correctly identify the direction to another tube station.
• The tool most commonly used for journey planning in advance was the tube map (44.7%), followed by on-line (20%), and A-Z or guidebook (8.5% each).
• 36% overall and 65% of visitors were carrying a map.• When asked, 3.7% said they would use on-street signs to navigate.• More than half overall, and 73% of visitors, had looked at signs or maps inside the tube
station before exiting.
Possible inferences• Walking is not an unpopular way of getting about.• Lack of guidance makes journeys on foot harder and less enjoyable than they could be.• People need different interventions at different moments on their trip, i.e. orientation
tools followed by directional tools.• Mental maps should be reinforced and supported.• Reliance on the tube map could and should be replaced by more useful information for
pedestrians.• Understanding journey time is a key driver in encouraging walking.
Appendix A User research study
Appendix B Preliminary sign audit
Appendix B – Preliminary sign audit
Summary of Sign System AuditOver thirty separate signing systems have been observed in and around the study area of the central London Congestion Charging zone. Details of ownership and pictorial references are given within this Appendix.
The audit demonstrates current provision of wayfinding and pedestrian signage by the boroughs and major stakeholders together with sampling of interventions made by private land owners, contained areas, and on formal routes such as Broadgate, Carnaby Street and the Thames Path respectively.
The audit is not intended as a comprehensive record of all signs in the study area but illustrates all the major systems and the variety of provision currently encountered whilst walking around central London.
ObservationsHaving recorded the various sign systems in the study area the following observations have been made.
• Inconsistency in what interventions constitute a system – Some systems only use fingerposts, others use maps and fingerposts. Route markers and directories also appear within some systems.
• Where maps are used there is inconsistency in the types and style – Scaled geographic, photographic, illustrative and 3D representational maps, as well as diagrams, are all used.
• Some systems focus mainly on attractions as destinations – Systems that only use finger posts give information on how to get to specific destinations (mostly attractions, public buildings, major transport nodes and public facilities). Most systems that include maps give street names and a broader set of destinations.
• Inconsistency in how elements of information are communicated – An example of this is the representation of the Transport for London 'roundel', where there are a number of inconsistencies between and within systems.
• Variations in the degree of legibility within graphic application – Some systems do not appear to meet with DfT (Department for Transport) guidance as set out in ‘Inclusive Mobility – A guide to Best Practice on Access to Pedestrian and Transport Infrastructure’ and may contravene the DDA (Disability Discrimination Act).
• Inconsistency in whether and how distance is communicated – Only some systems give distances on directional signs (fingerposts) and of those that do there is a varied approach of using either minutes, fractions of miles, metres or yards.
• Administrative boundaries cause an inconsistency of communication to the user – Someone walking from the London Eye to Tower Bridge along the south bank of the Thames encounters at least ten different systems of pedestrian signage. At times three are visible at the same time.
page 48 legible london, a wayfinding study page 49aig london 2006
• Lack of continuity of information between systems – Content of signs at the borders of boroughs (or administrative areas) do not always reflect the hierarchy of the nearest major attractions. They are sometimes biased to those within the borough that has erected the sign.
• Inconsistency in how content of system is decided – There is not a set standard for what appears as a destination on the various systems. Some systems rely on applications from attractions (destinations) others apply criteria to define content but sometimes this involves a large element of subjectivity.
• The physical design of some systems present issues – This includes the ability for finger signs to be ‘swivelled’ to point in the wrong direction, the inability to update information in a cost effective way and the non compliance with ‘Inclusive Mobility’ guidance.
• Maintenance is a big issue – Quality of materials, design and construction play a large part in the longevity and updateability of the current systems. However where a robust regime of maintenance is not employed even the best quality systems still fail.
• A consistent style for fingerposts is starting to appear – A number of providers are using signs with a white background with black text for directional signage. This has some relation in look and feel with both TfL signage and street name signs, which in turn relates in some ways to a London identity. However there are some practical issues with this and still large inconsistency in application.
• Other interventions which are not navigational signage are used in some areas to assist with wayfinding – Architectural features within new developments, landmarks, lighting and public art are all currently being used to assist in wayfinding, especially where the built environment presents physical or psychological barriers. However, this is not being universally adopted.
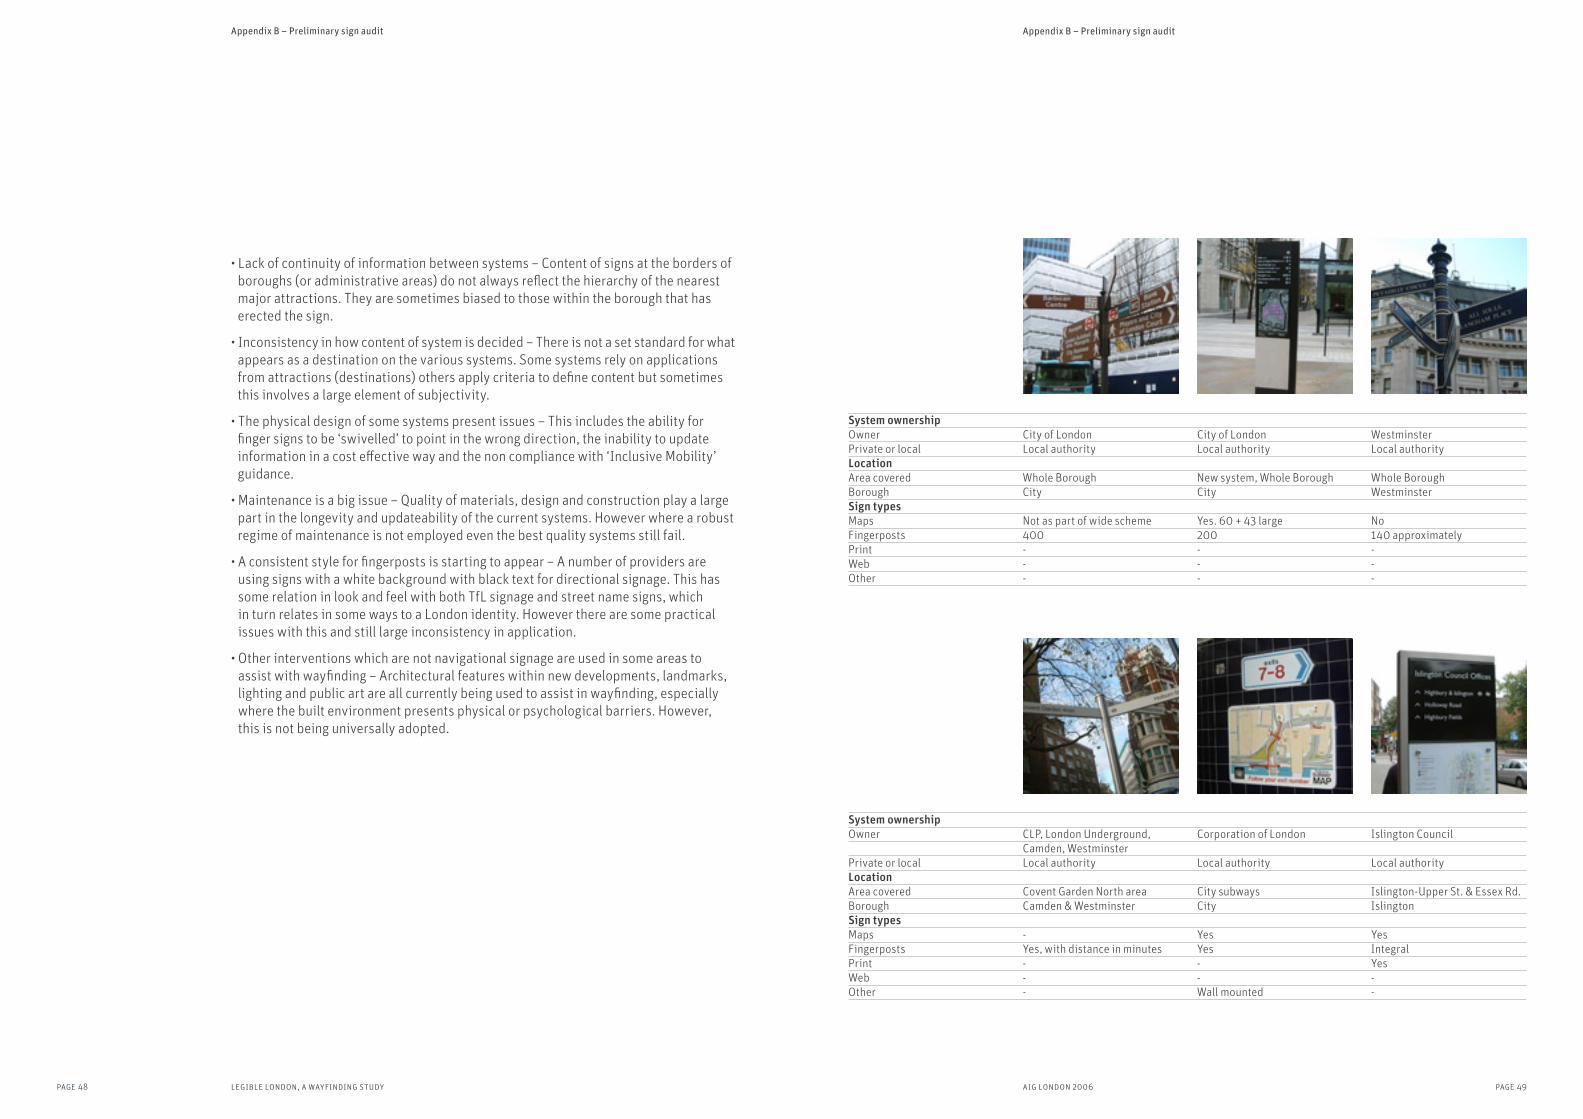
System ownershipOwner City of London City of London Westminster Private or local Local authority Local authority Local authorityLocationArea covered Whole Borough New system, Whole Borough Whole BoroughBorough City City Westminster Sign typesMaps Not as part of wide scheme Yes. 60 + 43 large NoFingerposts 400 200 140 approximatelyPrint - - -Web - - -Other - - -
System ownershipOwner CLP, London Underground, Corporation of London Islington Council Camden, Westminster Private or local Local authority Local authority Local authorityLocationArea covered Covent Garden North area City subways Islington-Upper St. & Essex Rd.Borough Camden & Westminster City IslingtonSign typesMaps - Yes YesFingerposts Yes, with distance in minutes Yes Integral Print - - YesWeb - - -Other - Wall mounted -
Appendix B – Preliminary sign auditAppendix B – Preliminary sign audit

page 50 legible london, a wayfinding study page 51aig london 2006
System ownershipOwner Southwark Southwark Southwark Private or local Local authority Local authority Local authorityLocationArea covered Bankside Riverside Elephant & CastleBorough Southwark Southwark Southwark Sign typesMaps - Yes YesFingerposts Yes Yes IntegralPrint - - - Web - - -Other Also alongside Street names Wall mounted Directories
System ownershipOwner TFL London Underground, Buses South Bank Employers Group Pool of London Private or local TFL, GLA Private -LocationArea covered Greater London South Bank Pool of London (Thames)Borough London wide Lambeth & Southwark Southwark & Tower HamletsSign typesMaps Yes 24 Yes Fingerposts Integral 50 + wall mounted Yes Print Yes - -Web Yes (Different base map) - YesOther Directories Wall mounted -
System ownershipOwner More London Cross River Partnership Tower HamletsPrivate or local Private - Local authorityLocationArea covered More London & London Bridge Bank of Thames (not confirmed) SE City (Tower of London)Borough Southwark Lambeth, Southwark, Westminster Tower HamletsSign typesMaps 1 Yes -Fingerposts Yes - Yes Print - - -Web - - -Other - - -
System ownershipOwner Hackney TSRGD Traffic sign regulations Mainline stationsPrivate or local Local authority Local authority Network RailLocationArea covered NE City (Hoxton) UK wide London wide Borough Hackney UK wide London wide Sign typesMaps - - Yes Fingerposts Yes Yes Panels Print - -Web - -Other - Wall mounted External (TFL)
Appendix B – Preliminary sign audit
System ownership Owner Royal Parks Agency Carnaby Street Trading Assoc. Broadgate Estates Private or local - Private PrivateLocationArea covered St. James & Green Park NW of Soho/East off Regent St. Broadgate Borough Westminster Westminster CitySign typesMaps Yes Yes YesFingerposts Yes Yes YesPrint - Yes -Web - Yes -Other - - Directories
System ownershipOwner Hayes Galleria Crown Estate -Private or local Private Private PrivateLocationArea covered Hayes Galleria Regent Street St Christophers PlaceBorough Southwark Westminster Westminster Sign typesMaps Maps Maps Maps Fingerposts - - -Print - - -Web - - -Other - - -
Appendix B – Preliminary sign audit
page 52 legible london, a wayfinding study page 53aig london 2006
System ownershipOwner Tower Place Tower of London Paddington BasinPrivate or local Private Private PrivateLocationArea covered Tower Place Tower of London Paddington BasinBorough City City WestminsterSign typesMaps Slab/destinations Slab/destinations 1 large hoardingFingerposts - - 10Print - - -Web - - -Other - - -
System ownershipOwner The Thames Path - Silver Jubilee WayPrivate or local - Local authority -LocationArea covered Southbank-Southwark Riverside Tate Modern Accross BoroughsBorough Length of Thames Southwark Lambeth, Southwark, City?Sign typesMaps - - Yes (Plinth)Fingerposts Integrated 7 separate Yes (TSRGD standard + Red) -Print - - -Web - - -Other Route markers Route markers Floor markers
System ownershipOwner Street namesPrivate or local Local authoritiesLocationArea covered London wideBorough AllSign typesMaps -Fingerposts -Print -Web -Other Wall mounted
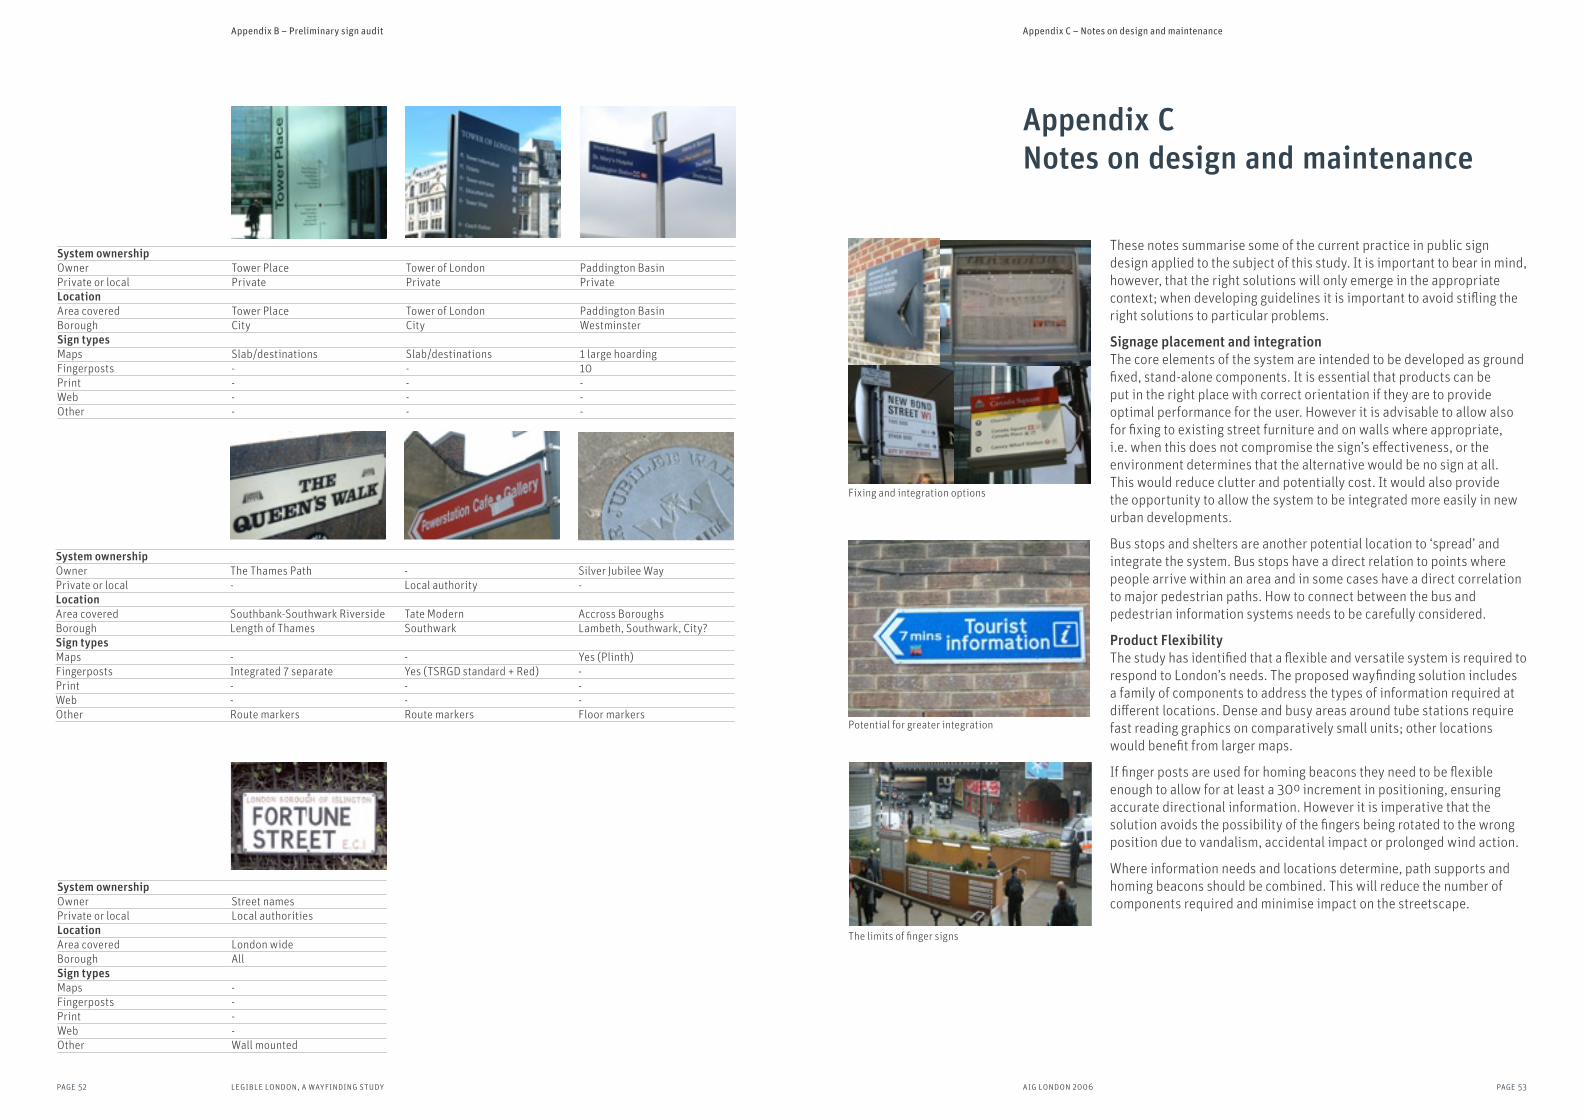
These notes summarise some of the current practice in public sign design applied to the subject of this study. It is important to bear in mind, however, that the right solutions will only emerge in the appropriate context; when developing guidelines it is important to avoid stifling the right solutions to particular problems.
Signage placement and integrationThe core elements of the system are intended to be developed as ground fixed, stand-alone components. It is essential that products can be put in the right place with correct orientation if they are to provide optimal performance for the user. However it is advisable to allow also for fixing to existing street furniture and on walls where appropriate, i.e. when this does not compromise the sign’s effectiveness, or the environment determines that the alternative would be no sign at all. This would reduce clutter and potentially cost. It would also provide the opportunity to allow the system to be integrated more easily in new urban developments.
Bus stops and shelters are another potential location to ‘spread’ and integrate the system. Bus stops have a direct relation to points where people arrive within an area and in some cases have a direct correlation to major pedestrian paths. How to connect between the bus and pedestrian information systems needs to be carefully considered.
Product FlexibilityThe study has identified that a flexible and versatile system is required to respond to London’s needs. The proposed wayfinding solution includes a family of components to address the types of information required at different locations. Dense and busy areas around tube stations require fast reading graphics on comparatively small units; other locations would benefit from larger maps.
If finger posts are used for homing beacons they need to be flexible enough to allow for at least a 30º increment in positioning, ensuring accurate directional information. However it is imperative that the solution avoids the possibility of the fingers being rotated to the wrong position due to vandalism, accidental impact or prolonged wind action.
Where information needs and locations determine, path supports and homing beacons should be combined. This will reduce the number of components required and minimise impact on the streetscape.
Appendix C Notes on design and maintenance
The limits of finger signs
Fixing and integration options
Potential for greater integration
Appendix C – Notes on design and maintenanceAppendix B – Preliminary sign audit
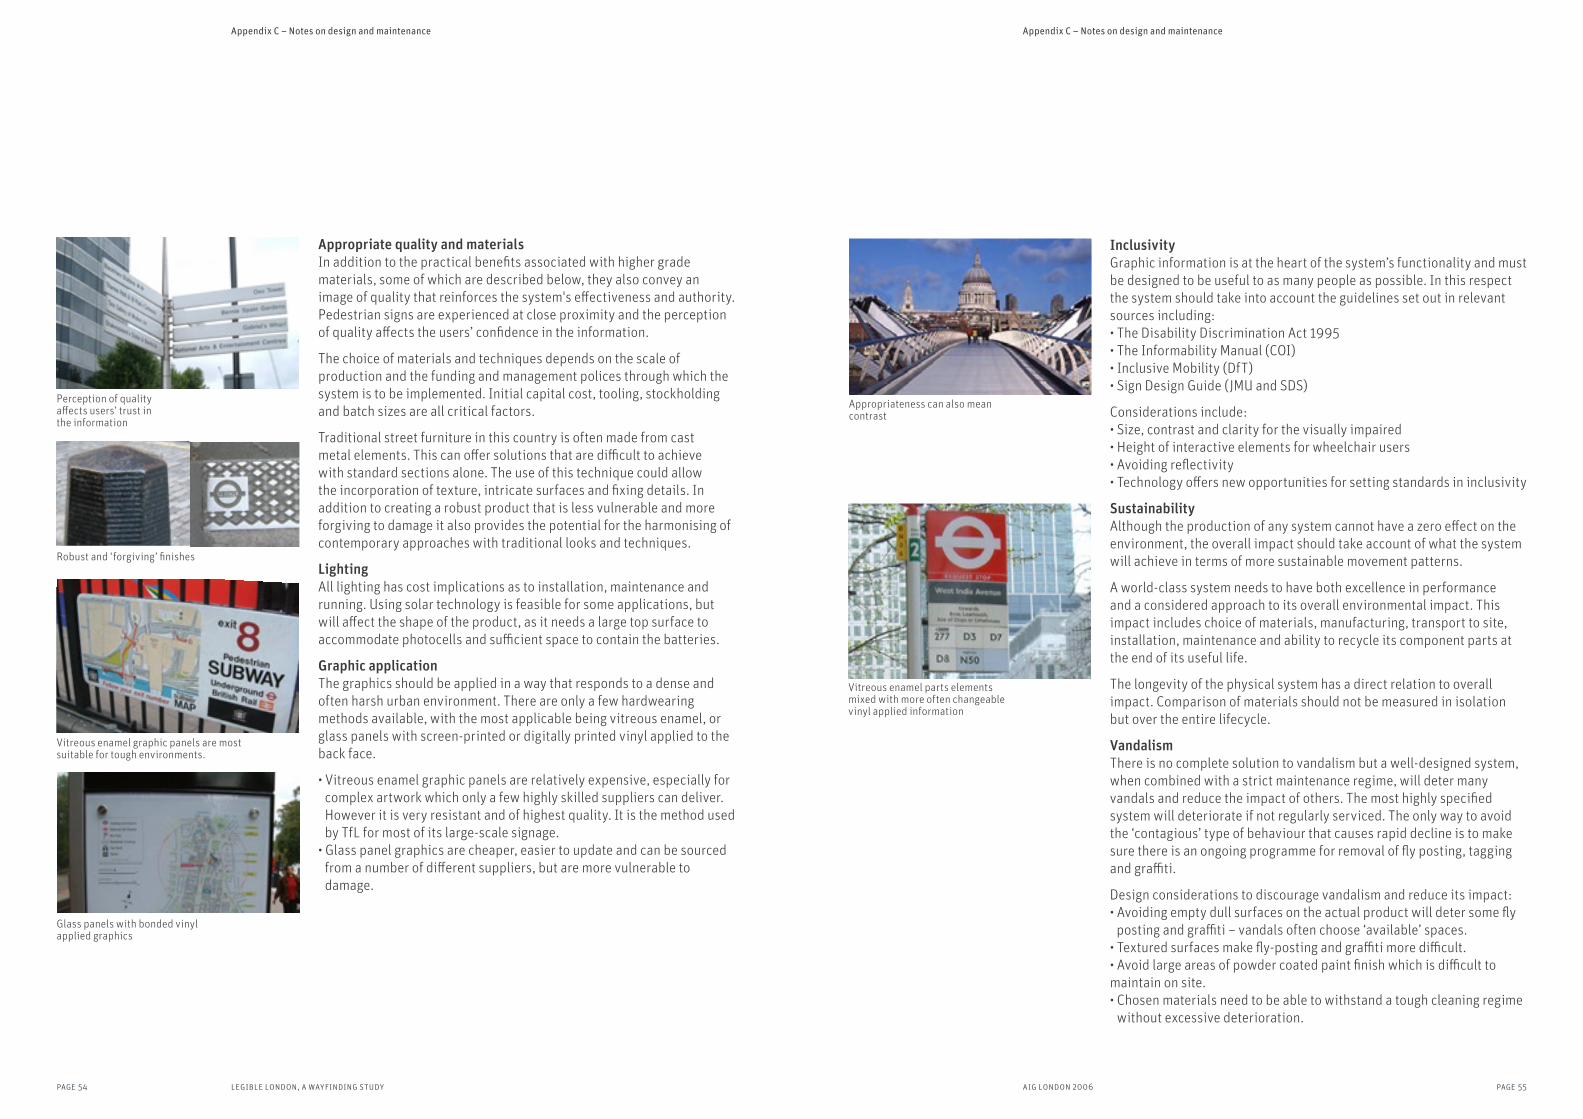
page 54 legible london, a wayfinding study page 55aig london 2006
Appropriate quality and materialsIn addition to the practical benefits associated with higher grade materials, some of which are described below, they also convey an image of quality that reinforces the system's effectiveness and authority. Pedestrian signs are experienced at close proximity and the perception of quality affects the users’ confidence in the information.
The choice of materials and techniques depends on the scale of production and the funding and management polices through which the system is to be implemented. Initial capital cost, tooling, stockholding and batch sizes are all critical factors.
Traditional street furniture in this country is often made from cast metal elements. This can offer solutions that are difficult to achieve with standard sections alone. The use of this technique could allow the incorporation of texture, intricate surfaces and fixing details. In addition to creating a robust product that is less vulnerable and more forgiving to damage it also provides the potential for the harmonising of contemporary approaches with traditional looks and techniques.
LightingAll lighting has cost implications as to installation, maintenance and running. Using solar technology is feasible for some applications, but will affect the shape of the product, as it needs a large top surface to accommodate photocells and sufficient space to contain the batteries.
Graphic applicationThe graphics should be applied in a way that responds to a dense and often harsh urban environment. There are only a few hardwearing methods available, with the most applicable being vitreous enamel, or glass panels with screen-printed or digitally printed vinyl applied to the back face.
• Vitreous enamel graphic panels are relatively expensive, especially for complex artwork which only a few highly skilled suppliers can deliver. However it is very resistant and of highest quality. It is the method used by TfL for most of its large-scale signage.
• Glass panel graphics are cheaper, easier to update and can be sourced from a number of different suppliers, but are more vulnerable to damage.
Robust and ‘forgiving’ finishes
Perception of quality affects users’ trust in the information
Glass panels with bonded vinyl applied graphics
Vitreous enamel graphic panels are most suitable for tough environments.
InclusivityGraphic information is at the heart of the system’s functionality and must be designed to be useful to as many people as possible. In this respect the system should take into account the guidelines set out in relevant sources including:• The Disability Discrimination Act 1995• The Informability Manual (COI)• Inclusive Mobility (DfT)• Sign Design Guide (JMU and SDS)
Considerations include: • Size, contrast and clarity for the visually impaired • Height of interactive elements for wheelchair users • Avoiding reflectivity • Technology offers new opportunities for setting standards in inclusivity
SustainabilityAlthough the production of any system cannot have a zero effect on the environment, the overall impact should take account of what the system will achieve in terms of more sustainable movement patterns.
A world-class system needs to have both excellence in performance and a considered approach to its overall environmental impact. This impact includes choice of materials, manufacturing, transport to site, installation, maintenance and ability to recycle its component parts at the end of its useful life.
The longevity of the physical system has a direct relation to overall impact. Comparison of materials should not be measured in isolation but over the entire lifecycle.
Vandalism There is no complete solution to vandalism but a well-designed system, when combined with a strict maintenance regime, will deter many vandals and reduce the impact of others. The most highly specified system will deteriorate if not regularly serviced. The only way to avoid the ‘contagious’ type of behaviour that causes rapid decline is to make sure there is an ongoing programme for removal of fly posting, tagging and graffiti.
Design considerations to discourage vandalism and reduce its impact:• Avoiding empty dull surfaces on the actual product will deter some fly posting and graffiti – vandals often choose ‘available’ spaces.
• Textured surfaces make fly-posting and graffiti more difficult. • Avoid large areas of powder coated paint finish which is difficult to maintain on site.• Chosen materials need to be able to withstand a tough cleaning regime
without excessive deterioration.
Vitreous enamel parts elements mixed with more often changeable vinyl applied information
Appropriateness can also mean contrast
Appendix C – Notes on design and maintenanceAppendix C – Notes on design and maintenance
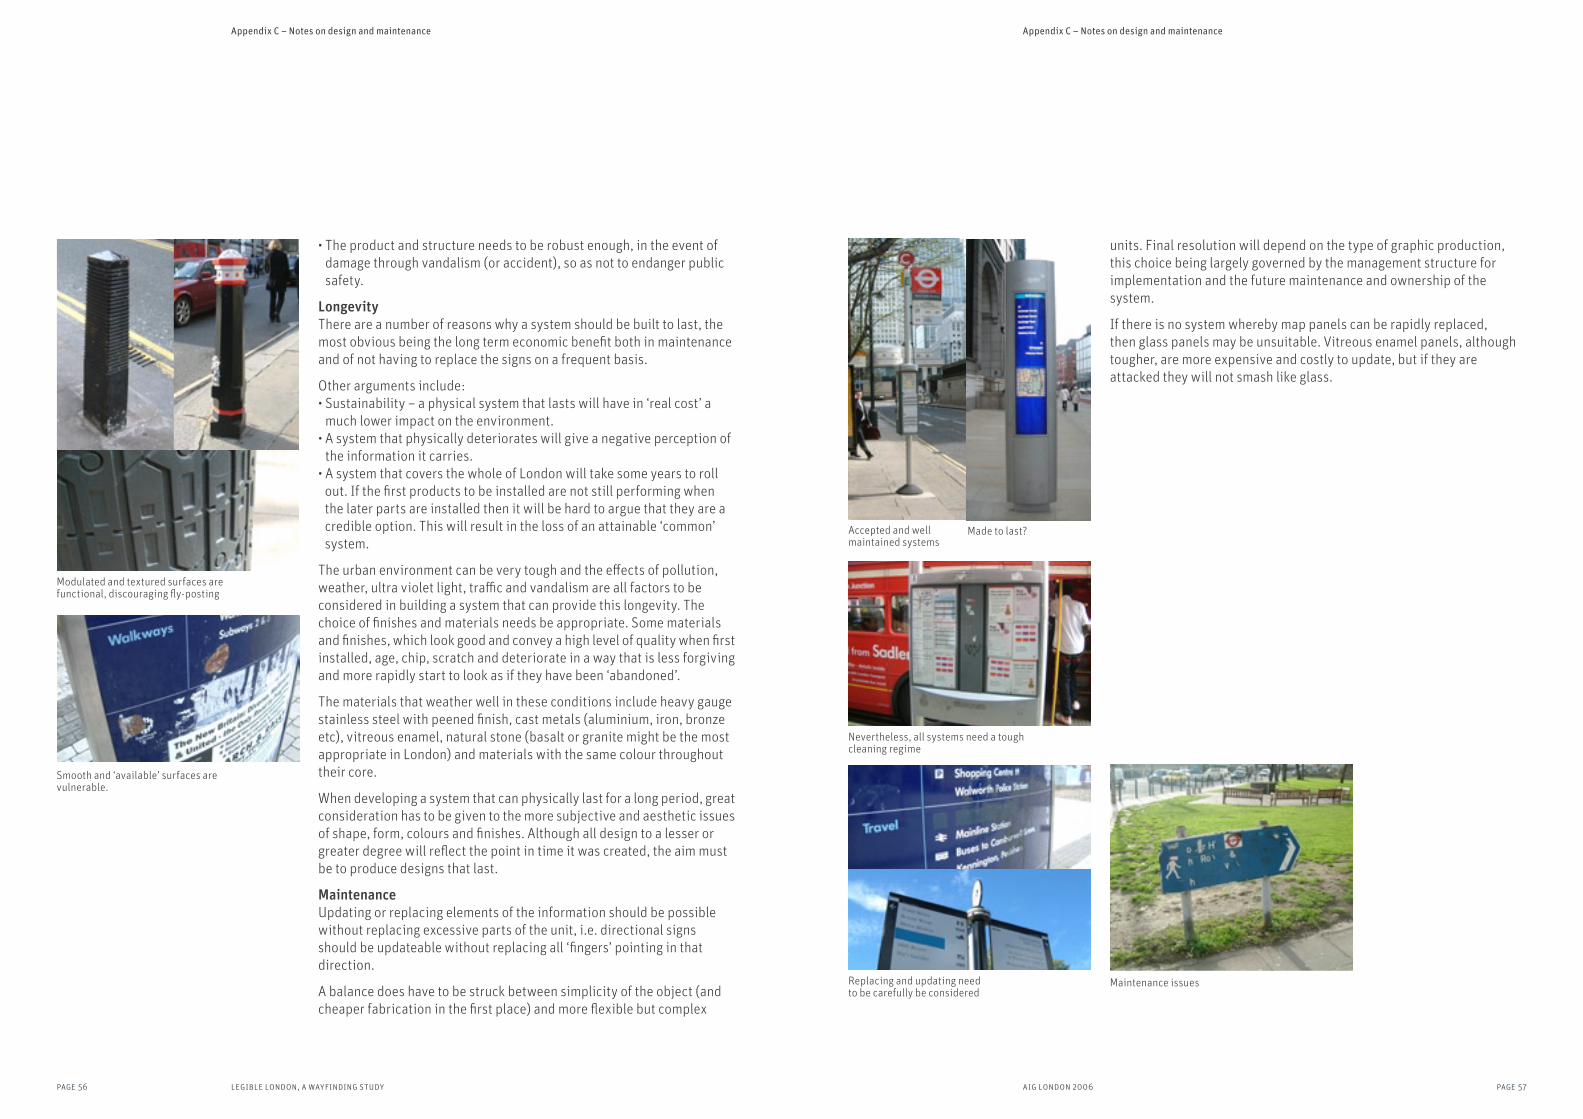
page 56 legible london, a wayfinding study page 57aig london 2006
• The product and structure needs to be robust enough, in the event of damage through vandalism (or accident), so as not to endanger public safety.
LongevityThere are a number of reasons why a system should be built to last, the most obvious being the long term economic benefit both in maintenance and of not having to replace the signs on a frequent basis.
Other arguments include:• Sustainability – a physical system that lasts will have in ‘real cost’ a
much lower impact on the environment.• A system that physically deteriorates will give a negative perception of
the information it carries.• A system that covers the whole of London will take some years to roll out. If the first products to be installed are not still performing when the later parts are installed then it will be hard to argue that they are a credible option. This will result in the loss of an attainable ‘common’ system.
The urban environment can be very tough and the effects of pollution, weather, ultra violet light, traffic and vandalism are all factors to be considered in building a system that can provide this longevity. The choice of finishes and materials needs be appropriate. Some materials and finishes, which look good and convey a high level of quality when first installed, age, chip, scratch and deteriorate in a way that is less forgiving and more rapidly start to look as if they have been ‘abandoned’.
The materials that weather well in these conditions include heavy gauge stainless steel with peened finish, cast metals (aluminium, iron, bronze etc), vitreous enamel, natural stone (basalt or granite might be the most appropriate in London) and materials with the same colour throughout their core.
When developing a system that can physically last for a long period, great consideration has to be given to the more subjective and aesthetic issues of shape, form, colours and finishes. Although all design to a lesser or greater degree will reflect the point in time it was created, the aim must be to produce designs that last.
MaintenanceUpdating or replacing elements of the information should be possible without replacing excessive parts of the unit, i.e. directional signs should be updateable without replacing all ‘fingers’ pointing in that direction.
A balance does have to be struck between simplicity of the object (and cheaper fabrication in the first place) and more flexible but complex
Modulated and textured surfaces are functional, discouraging fly-posting
Smooth and ‘available’ surfaces are vulnerable.
units. Final resolution will depend on the type of graphic production, this choice being largely governed by the management structure for implementation and the future maintenance and ownership of the system.
If there is no system whereby map panels can be rapidly replaced, then glass panels may be unsuitable. Vitreous enamel panels, although tougher, are more expensive and costly to update, but if they are attacked they will not smash like glass.
Replacing and updating need to be carefully be considered
Accepted and well maintained systems
Made to last?
Nevertheless, all systems need a tough cleaning regime
Maintenance issues
Appendix C – Notes on design and maintenanceAppendix C – Notes on design and maintenance

page 58 legible london, a wayfinding study page 59aig london 2006
Project planThe elements below set out some of the thinking about what needs to be done to turn this scheme into a reality, as a starting point for formulating a detailed project plan.
1. Establish CLP working group for detailed consultation
2. Establish joint committee of boroughs, TfL, LDA and GLA for decision-making
3. Establish consultative groups to provide stakeholder input
4. Produce overview map of regions and jurisdictions
5. Produce detailed audit for one area and overview audits of two other representative areas
6. Produce mental mapping for one region and area
7. Produce indicative designs for maps and signs at multiple levels
8. Evaluate financial and environmental impact
9. Produce draft Sign System Manual for implementation in two representative pilot schemes
10. Produce draft roll-out programme
11. Tendering process for fabrication and installation of pilot schemes
12. Establish unit to coordinate and maintain the Living Map
13. Decide standards and mechanism for maintenance
14. Put in place maintenance for pilot schemes
15. Design and implement pilot schemes (including clutter removal)
16. Evaluate pilot schemes – before and after methodology
17. Exhibition and public consultation
18. Produce detailed audits and mental mapping for all areas
19. Produce final Sign System Manual
20. Confirm staged roll-out programme
21. Tendering process for fabrication and installation of roll-out
22. Produce Living Map System
23. Put in place maintenance for roll-out
24. Implement staged roll-out (including clutter removal)
25. Continuing management of information database
26. Continuing maintenance of sign system
Items 1-10 in this project plan could be completed within six months.
Appendix D Draft project plan and cost estimate
Appendix D – Draft project plan and cost estimate
Cost estimateIt is too soon to estimate the overall cost of implementing a coherent pedestrian wayfinding system for the capital. However, based on the thinking contained in the draft project plan and the area that has been studied, we have assessed the likely cost of completing the project in the CCZ area. It should be noted that some of this work, including the pilot schemes, is necessary to create a robust architecture for the whole system and will therefore benefit other areas that are rolled out later.
It may be desirable for one of the pilot schemes to be implemented outside the central London area to ensure a more representative evaluation for the system as a whole.
The cost of an exhibition and public consultation, which is recommended, has not been included. While the Olympic Games in 2012 are appropriately a spur to achieve significant roll-out by the year 2010-11, implementation across the 33 boroughs will necessarily be influenced by many factors and would be expected to take place in stages.
A detailed study of an area approximately one thirtieth the size of the CCZ indicates a requirement of 100 sign components at an indicative fabrication and installation cost of just under half a million pounds, suggesting a hardware cost in the region of £15m for this area. A major infrastructure cost is the creation of the Living Map as a continually updating central database capable of being applied to all known physical and technological requirements.
For the CCZ area this work is estimated at £5m. Clutter removal has been costed at £2m and the additional cost of pilot schemes and evaluation is expected to be £3m. Design and development is 15% of the overall project cost. Our overall estimate for the CCZ area at 2005 prices therefore comes to £28.75m. Allowing for slippage, scope creep and contingencies it is prudent to allocate resource of £40m.
This would be broken down in stages as follows:Items 1–10: £750,000Items 11–15: £2mItems 16–20: £3mItems 21–22 (part): £3mItems 22 (completion) and 23, commence roll-out: £3mCosted roll-out in CCZ: £17m
Implementation in other regions would also be expected to commence during this time on a schedule to be determined.
Appendix D – Draft project plan and cost estimate

page 60 legible london, a wayfinding study page 61aig london 2006
ReferencesBibliography of books and reports:
A Pattern Language – Christopher Alexander, Sarah Ishikawa, Murray Silverstein with Max Jacobson, Ingrid Fiksdahl-King and Shlomo Angel. Oxford University Press, 1977 A Walking Strategy for Westminster – Westminster City Council Action Plan for Central London – Central London Partnership, 2003 Angel Report – Central London Partnership 2003/04. 2003 The Tfl Business Plan 2005 – Transport for London Camden Borough Spending Plan 2005/06 Camden Walking Plan: Fourth Annual Review, 2004 City Walks in London – A Report for the Government Office for London, Land Use Consultants, 2005 Courts and Lanes Design Strategy – Corporation of London, 2004 Covent Garden Report – Central London Partnership, 2003/04 Encouraging Walking: Advice to Local Authorities – Department of Environment, Transport and the Regions, 2000 Going to Town: Improving Town centre Access – Department of Environment, Transport and the Regions, Llewelyn-Davies, 2002 Inclusive Mobility – A Guide to Best Practice on Access to Pedestrian and Transport Infrastructure – Philip R Oxley, Department for Transport, 2002 Individualised Marketing – Changing Travel Behaviour for a better Environment - Werner Brög, Erhard Erl, Nicola Mense Information for Pedestrians – Guidance for London Boroughs, TfL Informatory Signs for use on all-purpose Roads – Ministry of Transport, 1964 Knowledge Point – Five Star Blue Book (Taxi Knowledge) Local Direction Signs – City of Westminster – Department of Planning and Transportation, 2003 LATS 2001 Household Survey – Transport for London London’s Functional Walking Network – A Study of the Key streets for utility Walking, Intelligent Space, 2004 London Travel Report 2005 – TfL / Mayor of London Making London a Walkable City – The walking plan for London – Transport for London/Mayor of London, 2004 Maps and journeys: an ethnomethodological investigation – Barry Brown & Eric Laurier Margaret Calvert – Edited interview for Frieze, 2003 Metro Maps – Mark Ovenden – Capital Transport Publishing, 2003 Multi-Modal interchange signs standard for London – Transport for London On the Move: by foot – A Discussion Paper, 2003 Promoting Walking in London – A Draft Business Case – Jan Gehl, Gehl Architects Quality Streets: A Summary study by CLP for TfL , 2003 Realising the potential: Walking and Cycling in London – Transport 2000 Trust, 2004 South Bank Public Art – A report on the first three years of the South Bank Public Art Programme – South Bank Employers Group, 1997 Streets for All – A guide to the management of London’s streets – English Heritage, 2000 Streetscape – Putting Policies into Practice – Royal Borough of Kensington & Chelsea Streetscape Guidance – Consultation Draft July 2004 – TfL /Mayor of London The National Walking Strategy – Living Streets, 2003 The Hippocampus, Memory and Place Cells: Is it Spatial Memory or a Memory Space? – Howard Eichenbaum, Paul Dudchecnko, Emma Wood, Matthew Shappiro and Heikki Tanila. 1999
References
The Image of the city – Kevin Lynch, The MIT Press, 1960 The Westminster Way – Public Realm manual for the City – City of Westminster, 2003 Towards a fine City for People – Public Space and public Life, Gehl Architects/CLP/TfL, 2004 Tracking Pedestrian Volumes – A Scoping study of available monitoring data for benchmarking purposes – Intelligent Space, 2004 Traffic Signs Manual – The Design of Traffic Signs – London: The Stationery Office, 1997 Transport for London 5 year Investment programme – The Tfl Business plan 2005/6 – 2009/10, 2004 Urban Design – Autumn 2004 Issue 92 Urban Design Compendium – English Partnerships, 2000 Urban Design Source Book 2004/5 – Urban Design Group, 2004 Walk this Way – A young persons guide to Above the Thames – South Bank Employers Group, 2004 Walking and Cycling: An Action Plan– Department for Transport, 2004 Wayfinding Behaviour – Cognitive Mapping and other spatial processes – Ed Reginald, G Golledge, The John Hopkins University Press, 1999 Where am I? – Street name signs in London – London Transport Users Committee, 2003 Your Way at Angel – Enhancing Pedestrian environment – Islington Council
MapsCongestion Charging Zone map – TFL website Tube map – TFL website London A-Z map Wandsworth’s active Living Map – Wandsworth Borough Alternative tube map – Paul Mijksenaar, Delft University Walking Waterloo – AIG for Waterloo Quarter Business Alliance
References

page 62 legible london, a wayfinding study page 63aig london 2006
AcknowledgementsThe team at AIG would like to thank a large number of people and organisations who have contributed time, help and information in the creation of this report, including:
Isobel Stoddart, Patricia Brown and Mem Baybars of Central London Partnership
David Rowe, Adrian Bell and Innes Ferguson of Transport for London
John Fannon (formerly Greater London Authority)
Anthony Bailey of London Borough of Islington
Antonia Simpson of London Borough of Southwark
Melanie Charalambous of Corporation of London
Louise Bond of Westminster City Council
Katie Dickson, Tim Long and Liz Halstead at London Borough of Camden
Stuart Croucher (formerly London Borough of Camden)
Adrian Couch of South Bank Employers Group
Chris Smith and Bridget Snaith of Waterloo Quarter Business Alliance
Kim Church of Covent Garden Business Forum
Jim Walker of The Access Company
David Martin of Living Streets
Paul Mijksenaar and Martijn Geerdes of Studio Mijksenaar
Spencer de Grey and David Rosenberg of Foster and Partners
Erik Spiekermann of United Designers Network
Julia Thrift of CABE Space
Alain Chiaradia of Space Syntax
Jake Desyllas of Intelligent Space
Sarah Ichioka, Dominic Church and students from LSE Cities Programme
Phil Baines of Central/St Martins, University of the Arts, London
Sam Gullam of Lacock Gullam
Nick Durrant of Plot
Richard Simon and Jeremy Caulton of iCube
Numerous Mental Mapping subjects
Stanford Maps of Covent Garden
Oxford Cartographers
Ordnance Survey
Acknowledgements
Thank you
Report produced and published by AIG for Central London PartnershipCopyright © 2006 AIG London Ltd
The AIG project team are: Tim Fendley, Kasper de Graaf, Sam Gullam, Nick Durrant, Richard Taylor, Mark Muller, Matt Cooper, Simon Hillier, Luke Mitchell, Hatty Chambers, Joo Hyun Yoon, Sofie Eliasson, Oliver Moss, Cesar Sesio.
Contacts:
Kasper de GraafAIG26–27 Great Sutton StreetLondon ec1v 0dsTel: 020 7017 8488Email: [email protected]
Patricia BrownCentral London Partnership29 Heddon StreetLondon w1b 4blTel. 020 7478 8460Email: [email protected]