legacy phosphorus in calcareous soils effects of long term poultry litter application on phosphorus...
TRANSCRIPT

Legacy Phosphorus in Calcareous Soils: Effects of Long-Term
Poultry Litter Application
Heidi Waldrip, Paulo Pagliari, Zhongqi He,
Daren Harmel, Andy Cole, and Mingchu Zhang
USDA-ARS, University of Minnesota,
University of Alaska-Fairbanks

Background
Livestock production in concentrated animal feeding operations (CAFO) = Accumulation of excreted phosphorus (P) near animal housing
In United States, ~ 1.03 x 10⁷ Mg of poultry litter produced in 2007
Expensive to transport manure/litter from CAFO to croplands

Therefore…Manure is often repeatedly applied to a limited land base
Increases both total and soluble P in soil and may influence P cycling and availability: worldwide rate of annual STP accumulation = 8 to 40 kg P/ha (Parham et al., 2002)
Concern over phytate-loading of soils and issues with accumulated legacy P
Creates environmental risk of eutrophication following runoff or leaching

Surface Water
Livestock Manure Or Other Organic Residues
Organic PMicrobial biomass
Organic matterSoluble organic P
Sorbed PClays
Al, Fe Oxides
Primary P Minerals
Apatites
Secondary P Minerals
Ca, Fe, Al Phosphates
Erosion and Runoff(Particulate-associated
and Soluble P)
Soluble Inorganic P (H2PO4
-, HPO42-)
Immobilization
Mineralization
Sorption-
Desorption
Dissolution
Precipitation-Dissolution
Plant Uptake and Crop Removal
Leaching Tile Flow toSurface Water
Inorganic Fertilizers
PlantResidues
InputsOutputsInternal cycling

Organic P in Soil
Organic P (Po) content can vary widely3 to 90% of total PUsually 10 to 40%Most common forms: % organic P
inositol phosphates 10 to 80phospholipids 0.5 to 7.0nucleic acids 0.2 to 2.5unidentified ~50
Require breakdown to inorganic P (Pi) by plant- or microbe-produced phosphohydrolases to be plant-available
Associated with solid phase materials similar to Pi

General Project Overview“Riesel Watersheds”: Established as “Blacklands Experimental Watershed” near Riesel, Texas in 1930s by USDA to evaluate land management effects on soil erosion and floods.
2001: First litter application (turkey or broiler litter annually since then) (Harmel et al., 2004).
Management: Native tallgrass prairie, improved pasture, various crops in rotation, grazing cow-calf herd.
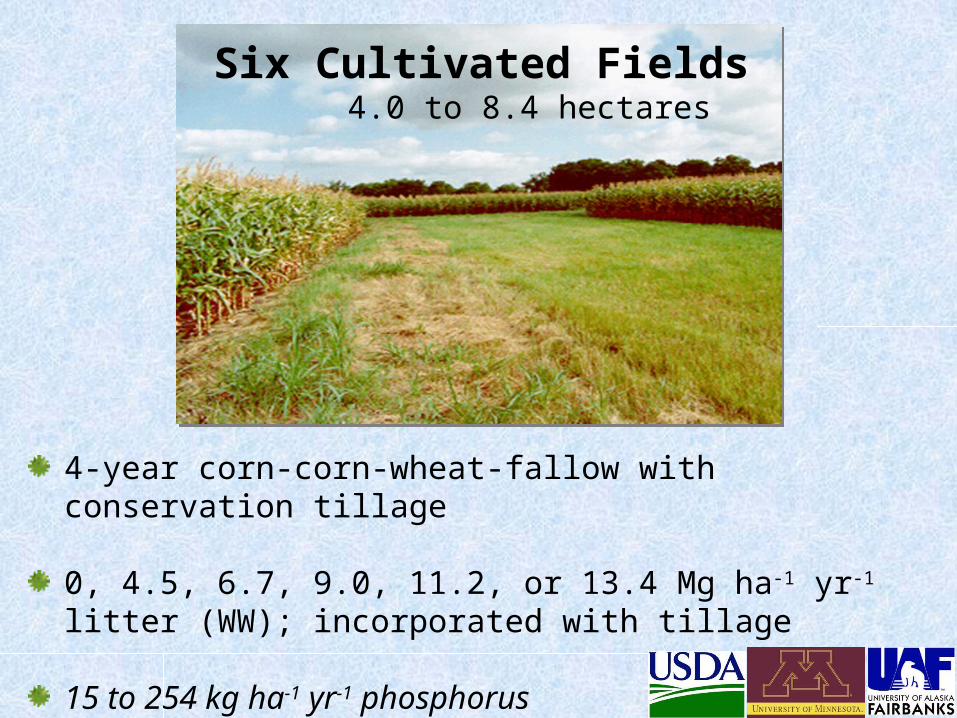
4-year corn-corn-wheat-fallow with conservation tillage
0, 4.5, 6.7, 9.0, 11.2, or 13.4 Mg ha-1 yr-1 litter (WW); incorporated with tillage
15 to 254 kg ha-1 yr-1 phosphorus
Six Cultivated Fields 4.0 to 8.4 hectares

Native rangeland and improved pasture (grazed or hayed)
0, 6.7, or 13.4 Mg ha-1 yr-1 litter; surface applied
0 to 257 kg ha-1 year-1 phosphorus
Four Pasture Fields 1.2 to 8.0 hectares

Soil Characteristics
Houston Black Soil (fine, smectitic, thermic, Udic Haplusterts)…classic Vertisol
State soil of Texas: ~ 12.6 million acres
Typically 55% clay, 28% silt, 17% sand
Highly expansive
~17% CaCO3
pH ~ 7.8

What we did……Soil samples from 2002 to 2012 (15 cm, one core/0.4 ha).
Sequential fractionation with H2O, NaHCO3, NaOH, and HCl. Extracts diluted and adjusted to pH 5.0 (Waldrip-Dail et
al., 2009).
Total extracted P (Pt) by ICP-OES, Pi by molybdenum blue method (Dick and Tabatabai, 1977; He and Honeycutt, 2005).
Po=Pt – Pi
Incubation with acid phosphomonoesterases type IV-S (potato) and type I (wheat germ) and nuclease P1 from Penicillium citrinum to identify forms of Po (He and Honeycutt,
2001). • Monoester-like, Phytate-like, DNA-like• Non-hydrolyzable Po

ObjectiveEvaluate effects of long-term (10 years) poultry litter application on total extractable soil P, Pi, and Po in watershed-scale cultivated and pasture lands on calcareous, high-clay soil.
Do phytate and metal-P complexes accumulate in soils fertilized with poultry litter?
What is the effect of litter application rate?
How do effects of litter application differ between cropland and pasture?

Sequential Fractionation Procedure
H2O
0.5 M NaHCO3
0.1 M NaOH
1.0 M HCl
soluble or sorbed on crystalline surfaces
associated with Al/Fe oxides or carbonates
associated with Ca/Mg
Soil
Residue
Residue
Residue
Residue
NaHCO3-P
H2O-P
NaOH-P
HCl-P
Labile-P
Incubation with acid phosphatases and nuclease-P1

H2OOrganic
C Total
NTotal
PNO3
--N NH4+-N
----%---- -------------% DM------------- ----------mg kg-1-----------
10-year Average (SD) 26 (12) 43 (8) 3.5 (0.7) 2.4 (1.0) 483 (368) 3772 (1424)
Selected Properties of Poultry Litter
Litter (manure + bedding) and/or inorganic fertilizer applied to reach a target N rate of 170 kg ha-1 for corn
Applied using “real world” practices: desired rate met according to truck speed, gear, and rear gate settings

0
500
1000
1500
To
tal e
xtra
cta
ble
P
(m
g k
g-1
)
Control, cultivated
0
500
1000
15006.7 Mg ha-1 litter, cultivated
2002 2004 2006 2008 2010 20120
500
1000
150013.4 Mg ha-1 litter, cultivated
0
500
1000
1500 Control, ungrazed rangeland
0
500
1000
1500 6.7 Mg ha-1 litter, pasture
2002 2004 2006 2008 2010 20120
500
1000
150013.4 Mg ha-1 litter, pasture
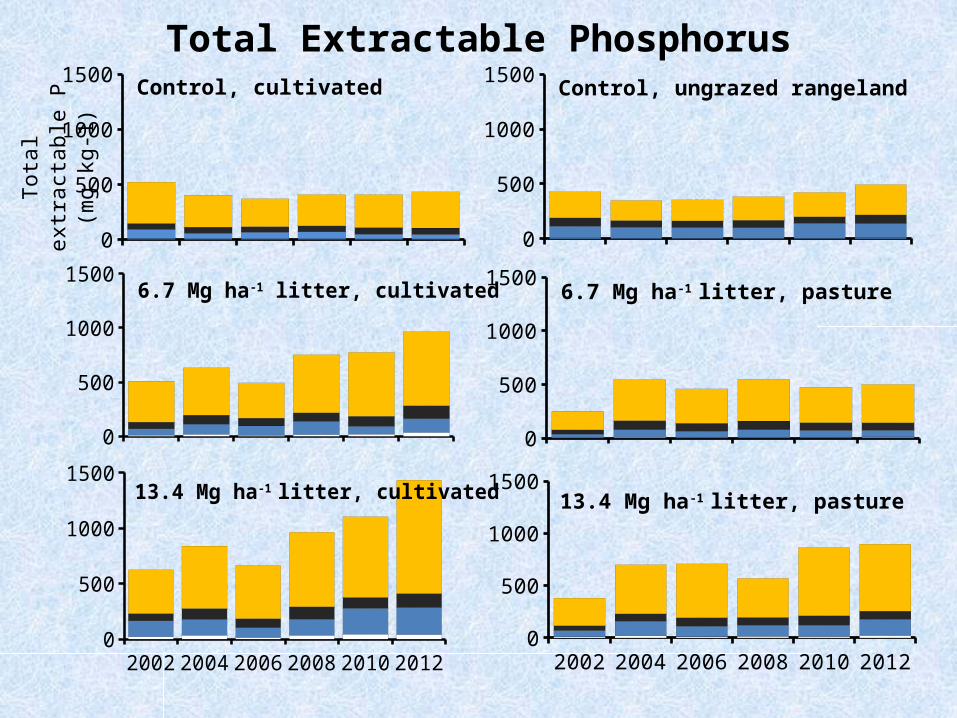
Total Extractable Phosphorus
233%262 mg/kg
640 mg/kg
0
500
1000
1500
To
tal e
xtra
cta
ble
P
(m
g k
g-1
)
Control, cultivated
0
500
1000
15006.7 Mg ha-1 litter, cultivated
2002 2004 2006 2008 2010 20120
500
1000
150013.4 Mg ha-1 litter, cultivated
0
500
1000
1500 Control, ungrazed rangeland
0
500
1000
1500 6.7 Mg ha-1 litter, pasture
2002 2004 2006 2008 2010 20120
500
1000
150013.4 Mg ha-1 litter, pasture
Total Extractable Phosphorus

Changes in Soil Test Phosphorus (2000 to 2012)
0
50
100
150
200
20002012
Land use type and litter application rate
Meh
lich-
3 P
(m
g/kg
)
-1.01.3
4.7
10.9
PastureCultivated
0.3
5.6
11.59.9
12.713.2
Average annual change (mg kg-1)
Mehlich-3 data provided by Daren Harmel, USDA-ARS, Temple, TX.
East Texas P threshold

Organic PMicrobial biomass
Organic matterSoluble organic P
Sorbed PClays
Al, Fe Oxides
Primary P Minerals
Apatites
Secondary P Minerals
Ca, Fe, Al Phosphates
Soluble Inorganic P (H2PO4
-, HPO42-)
Phosphorus Forms Extracted with Mehlich-3
Source: Mabry et al., 2012, SSAJ, 177:31

Extracted P vs. Mehlich-3 STP in 2012
Contro
l
4.5
Mg/
ha
6.7
Mg/
ha
9.0
Mg/
ha
11.2
Mg/
ha
13.4
Mg/
ha
Native
rang
eland
0, g
raze
d
6.7
Mg/
ha
13.4
Mg/
ha0
600
1200
1800
H2O-Pt NaHCO3-Pt NaOH-PtHCl-Pt M3P
Pho
spho
rus
(mg
kg-1
)

0.0
4.5
6.7
9.0
11.2
13.4 0.
0
0.0,
gra
zed
6.7
13.4
0
50
100H
2O
-P (
mg
kg
-1) Cultivated Pasture
0.0
4.5
6.7
9.0
11.2
13.4 0.
0
0.0,
gra
zed
6.7
13.4
0
250
500
Inorganic Monoester-like DNA-like Phytate-like Non-hydrolyzable organic
Litter rate (Mg ha-1)
Na
HC
O3
-P (
mg
kg
-1) Cultivated Pasture
Composition of Labile Phosphorus in 2012

0.0
4.5
6.7
9.0
11.2
13.4 0.
0
0.0,
gra
zed
6.7
13.4
0
100
200N
aO
H-P
(m
g k
g-1
) Cultivated Pasture
0.0
4.5
6.7
9.0
11.2
13.4 0.
0
0.0,
gra
zed
6.7
13.4
0
400
800
1200
Inorganic Monoester-like DNA-like Phytate-like Non-hydrolyzable organic
Litter rate (Mg ha-1)
HC
l-P
(m
g k
g-1
)
Cultivated Pasture
Composition of More Stable Phosphorus in 2012
217% increase

Control 6.7 Mg ha-1
litter13.4 Mg ha-1
litter Labile-P ---------------------------P (mg kg-1)-----------------------------
Inorganic 42c 152b 272a
Monoester 28c 94b 182a
DNA 21c 53bc 90ab
Phytate 18c 43bc 80ab
Non-hydrolyzable 16 ns ns HCl-P
Inorganic 16c 28b 33ab
Non-hydrolyzable 312c 655b 989a
Changes in P Distribution in Cultivated Fields

Pasture Watersheds
Native
rangelandGrazed pasture
6.7 Mg ha-1 litter
13.4 Mg ha-1 litter
Labile-P ------------------------------P (mg kg-1)------------------------------Inorganic 124ab 56c 63c 165a
Monoester 51b 38c 55b 128a
DNA 100a 20c 25c 55bc
Phytate 89a 19c 16c 41bc
Non-hydrolyzable 3b ns ns 15a
HCl-P Inorganic 22cd 19d 18d 39ab
Phytate - 0.4b - 14a
Non-hydrolyzable 253bc 173c 339b 588a
Changes in P Distribution in Pasture

ConclusionsLong-term litter application to calcareous Texas Black Soil increased labile inorganic P concentrations by 9 to 34% (cultivated) and 7 to 30% (pasture)
Litter also increased labile organic P: more pronounced in cultivated fields than pasture
Mehlich-3 poor indicator of legacy P in calcareous soils
Labile organic P was monoester > nucleic acid > phytate > non-hydrolyzable Po
~68% of total extractable P was Ca-associated
Most HCl-Po was non-hydrolyzable: increased 217% with litter at 13.4 Mg ha-1
