left on the table - ca csd · 2015-04-08 · left on the table unclaimed earned ... major cities....
TRANSCRIPT

Left on the table Unclaimed Earned Income Tax Credits cost California's economy and low-income residents $1 billion annually
Antonio Avalos and Sean Alley
March 2010
Executive Summary
The Earned Income Tax Credit (EITC) is one of the federal government’s largest resources for working low-
income Americans. It is widely regarded as the nation’s most effective and efficient anti-poverty program and
has been expanded by a series of Democratic and Republican presidents.1 Hundreds of thousands of
Californians, however, fail to claim EITC refunds, which range from a few hundred to several thousand dollars.
The families and individuals who miss out are not the only losers when these refunds go unclaimed. Local
economies never benefit from this money. These dollars are never spent at local businesses so fewer jobs are
created, fewer wages are paid, and eventually less tax revenue goes to state and local governments. These
refunds are a foregone economic stimulus for California.
This report examines the economic impact of the EITC program in California, each of its 58 counties, and select
major cities. First, the authors examine the amounts of claimed and unclaimed EITC refunds. They then
estimate the economic impact of EITC dollars that are injected into the state’s revenue stream. Third, they
estimate the foregone economic impact of unclaimed EITC refunds.
Primary Findings
The Earned Income Tax Credit has a substantial
impact on the California economy
• In 2009, the authors estimate that 2.4 million California
residents will claim $4.95 billion in EITC refunds, more
than the combined total wages of all home health care
workers and electricians in California.
• As these refunds are spent, they will spur $5.5 billion in
sales for California businesses, who in turn will create
33,000 jobs, pay $1.32 billion in new wages, and bring
$390.5 million in tax revenue to state and local
governments.
• EITC refunds vary significantly by county. Nearly one
third of the total EITC funds in the state (almost $1.5
billion) went to Los Angeles County. Smaller counties
such as Alpine, Sierra, and Trinity claimed less than $2
million altogether.
• The ten California counties with the largest dollar
amounts of EITC refunds in 2006 (the last year for which
zip code level data is available) were Los Angeles ($1.48
New America Foundation

new america foundation page 2
billion), San Bernardino ($339.7 million), San Diego
($310.7 million), Riverside ($306.4 million), Orange
($253.5 million), Fresno ($182.3 million), Sacramento
($165.3 million), Kern ($151.6 million), Tulare ($124.9
million), and Alameda ($116.4 million).
• Not surprisingly, residents of the poorest counties in the
state (such as Fresno, Merced and Tulare) show the
largest number of EITC returns as a percentage of the
total returns filed. These counties also have the largest
average EITC payments; well above the state average in
both categories.
Too many Californians fail to claim these refunds
• In 2009, an estimated 800,000 Californians, about one in
five who are eligible, will fail to claim $1.2 billion in
EITC refunds.
• On average, families not claiming the credit would have
received a refund amounting to $1,400.
• The following counties missed out on the largest amounts
of EITC refunds: Los Angeles ($370 million), San
Bernardino ($84.9 million), San Diego ($77.7 million),
Riverside ($76.7 million), Orange ($63.4 million), Fresno
($45.6 million), Sacramento ($41.3 million), Kern ($37.9
million), Tulare ($31.2 million), and Alameda ($29.1
million).
• The following counties are likely to have more than twenty
percent of EITC eligible filers fail to claim their refunds:
Los Angeles, San Bernardino, Sacramento, Fresno, Kern,
Merced, Stanislaus and Tulare.
When EITC refunds go unclaimed, businesses and the
economy suffer
• Because $1.2 billion in EITC refunds will go unclaimed in
2009, California businesses will lose out on $1.4 billion in
sales and 8,200 jobs will not be created.
• Most of the foregone economic impact is concentrated in
Los Angeles, Riverside and San Bernardino counties.
Because of unclaimed EITC refunds, these counties lose out
on $600 million in business sales, and a combined foregone
employment impact of over 3,700 jobs.
• Due to low participation in the credit program, the San
Joaquin Valley (Fresno, Madera, Merced, Kern, Kings, San
Joaquin, Stanislaus and Tulare) suffers a foregone business
sales impact of more than $180 million and a foregone
employment impact of over 1,100 jobs.
• The foregone economic impact of the EITC program is not
spread uniformly across counties, but is felt more acutely in
counties where the presence of likely non-filers is higher.
These are counties with: (1) high concentrations of
Hispanics; (2) significant numbers of low-income
individuals; (3) high participation in the food stamp
assistance programs; (4) significant numbers of families
with no qualifying children.
new america foundation page 3
Contents
Executive Summary ................................................................................................................................................................................... 1
Primary Findings ........................................................................................................................................................................................ 1
I. Overview of the Earned Income Tax Credit ........................................................................................................................................... 4
II. The EITC: A boost to California families and the economy ................................................................................................................. 5
III. Claimed and unclaimed EITC refunds, county by county ................................................................................................................... 6
IV. The Economic Impact of the Federal EITC Program ........................................................................................................................ 10
V. The Cost of Leaving Money on the Table ........................................................................................................................................... 15
VI. Bringing it up to date: California's overall foregone economic impact in 2009 ................................................................................ 20
Concluding Remarks ................................................................................................................................................................................ 25
Appendix I ............................................................................................................................................................................................... 26
Methodology and Data Requirements used to calculate the economic impact: The Multiplier Analysis
Appendix II .............................................................................................................................................................................................. 26
Additional assumptions about the economic multiplier analysis used to calculate the economic impact of the EITC
List of Tables and Figures
Chart 1: EITC Structure for a single, head of household, or qualified widow, 2009 ................................................................................. 4
Table 1: EITC Payments to California Residents, and Estimated Unclaimed EITC Payments, by County and Selected Cities, 2006 ..... 6
Figure 1: Conceptual Framework– How EITC Dollars Flow Through the Economy ............................................................................. 10
Table 2: Estimated Economic Impact of the EITC in California, by County and Select Cities, 2006 ..................................................... 12
Table 3: Impact of the EITC on California State and Local Taxes, 2006 ................................................................................................ 14
Table 4: Estimated Foregone Economic Impact of the EITC in California, by County and Selected Cities, 2006 ................................. 15
Table 5: Characteristics Associated with High Rates of Unclaimed EITC Funds ................................................................................... 18
Table 6: Foregone Impact of the EITC on California State and Local Taxes, 2006 ................................................................................ 20
Table 7: Historical EITC Data and Unemployment Rates in California .................................................................................................. 21
Table 8: Unclaimed EITC Payments under the Conservative Scenario, 2009 ........................................................................................ 21
Table 9: Unclaimed EITC Payments under the Less Conservative Scenario, 2009 ................................................................................. 22
Table 10: Estimated Foregone Economic Impact of the EITC, by County and Selected Cities, 2009 .................................................... 22
Table 11: Statewide Estimated Foregone Economic Impact of the EITC, 2009 ...................................................................................... 24
new america foundation page 4
I. Overview of the Earned Income Tax Credit
The Earned Income Tax Credit (EITC) is a refundable federal
income tax credit for low to moderate income working
households. Congress originally approved the tax credit
legislation in 1975 in part to offset the burden of Social
Security taxes and provide an incentive to work. When the
EITC exceeds the amount of taxes owed, it results in a tax
refund to those who claim and qualify for the credit. As a
refundable credit, the EITC provides assistance to families
even if they do not face any tax liability. EITC payments have
no effect on welfare benefits and are not used to determine
eligibility for Medicaid, Supplemental Security Income (SSI),
food stamps, low-income housing or nearly all Temporary
Assistance for Needy Families (TANF) payments.
Who's eligible?
To receive the federal EITC, an individual must have earned
income, be a U.S. citizen or legal resident and have a valid
social security number. For tax year 2009, a qualified claimant
may have investment income of less than $3,100 and a
maximum annual earned income of varying levels based on
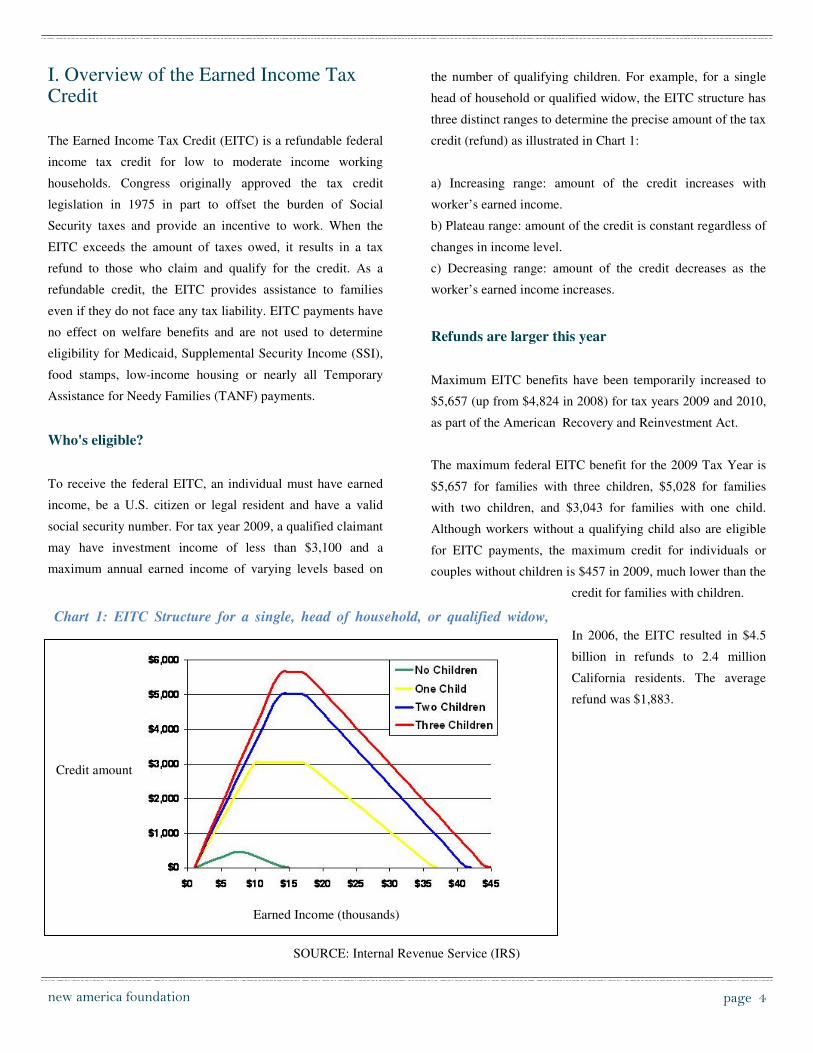
the number of qualifying children. For example, for a single
head of household or qualified widow, the EITC structure has
three distinct ranges to determine the precise amount of the tax
credit (refund) as illustrated in Chart 1:
a) Increasing range: amount of the credit increases with
worker’s earned income.
b) Plateau range: amount of the credit is constant regardless of
changes in income level.
c) Decreasing range: amount of the credit decreases as the
worker’s earned income increases.
Refunds are larger this year
Maximum EITC benefits have been temporarily increased to
$5,657 (up from $4,824 in 2008) for tax years 2009 and 2010,
as part of the AmericanRecovery and Reinvestment Act.
The maximum federal EITC benefit for the 2009 Tax Year is
$5,657 for families with three children, $5,028 for families
with two children, and $3,043 for families with one child.
Although workers without a qualifying child also are eligible
for EITC payments, the maximum credit for individuals or
couples without children is $457 in 2009, much lower than the
credit for families with children.
In 2006, the EITC resulted in $4.5
billion in refunds to 2.4 million
California residents. The average
refund was $1,883.
SOURCE: Internal Revenue Service (IRS)
Chart 1: EITC Structure for a single, head of household, or qualified widow,
Credit amount
Earned Income (thousands)

new america foundation page 5
II. The EITC: A boost to California families and the economy
Help for California's residents who work hard but
struggle to get ahead
Research shows that the federal EITC is an effective tool for
supporting work and alleviating poverty, contributing to
significant increases in labor force participation among single
mothers, and allowing EITC recipients to make investments
that enhance economic security and promote economic
opportunity.2 One way the EITC reduces poverty for example,
is by supplementing the earnings of minimum-wage workers.3
Further, the beneficial impact of the EITC program mainly
occurs by inducing labor market entry in families that initially
do not have an adult in the workforce.4
The EITC program is widely considered to be cheaper and
even more efficient than other programs designed to alleviate
poverty, without producing many of the negative incentives
that other traditional welfare programs can produce (such as
discouraging employment).5
The EITC is a potent economic stimulus for
California
The large sums of EITC dollars claimed by California
residents provide a substantial amount of resources that are
injected into the State’s revenue stream. The State greatly
benefits from this annual infusion of money. As recipients
spend the refunds, their spending fuels business sales and is a
significant stimulus to the State’s economy. The stimulus is
magnified beyond the original EITC payments because the
spending of EITC refunds creates ripple effects as more
dollars move among consumers, businesses and even among
state and local governments, which capture higher tax
revenue. Economists use standard techniques to estimate
impacts of economic changes in their states, counties, or
communities.
For example, imagine Linda is a single mother of three who
lives in Los Angeles County. Linda makes $16,000 a year
working in a restaurant and has no significant investment
income. Linda is eligible for an EITC payment of around
$5,600. Suppose Linda saves 10%, $560, and spends the rest,
$5,040, on school clothes and supplies at Max’s store in San
Bernardino. This $5,040 is income for Max. After Max
withholds his income tax, he is left with $4,000, which he uses
for a down payment on a new car at Nell’s Autos. This $4,000
is income for Nell. After taxes, Nell spends $3,000 on a new
stereo at Ophelia’s, who spends $2,000 (her after-tax income)
on tuition and books at Paula’s Cosmetology school. Paula
spends her after-tax income of $1,000 on a vacation to
Canada.
In this simple illustrative exercise, the initial EITC payment of
$5,600 generated $14,040 ($5,040 + $4,000 + $3,000 +
$2,000) in new labor income in the State. The initial $5,600
also generated new economic output and tax revenue each
time it was re-spent, so the economic impact of the EITC
revenue was much larger over time than the initial payment.
This phenomenon is known as the multiplier effect of the
EITC payment. The magnitude of the multiplier effect
depends on the savings rate of the economic participants and
the amount of resources that leave the State during each round
of spending. The $560 that Linda saved and the $1,000 that
Paula spent on her vacation represent "leakages" from the
State economic stream. For a more thorough description of the
economic impact and multiplier analysis, see Appendix I.
How to claim the EITC
Qualifying workers must file a federal income tax return.
This is the only way to receive the credit, even for those
who don't make enough to be required to file. The IRS offers
an EITC Assistant in English and Spanish here:
http://www.irs.gov/individuals/article/0,,id=150557,00.html
Filing for the credit can be complicated, but free, specialized
community resources exist just to help people claim their
refunds. To locate the nearest Volunteer Income Tax
Assistance (VITA) site, call 1-800-829-1040.
new america foundation page 6
Furthermore, recent studies by Moody’s Economy indicate
that the most effective ways to stimulate the economy, those
that "get the largest bang for the buck," are those that put
resources in the hands of low income people, who are likely to
spend a large part of them immediately.6
Unclaimed EITC refunds are a lost opportunity for
families and communities
Unfortunately, the positive economic impact of the EITC
could be even larger than it is.7 Not all taxpayers who are
eligible claim the credit, so some EITC resources never make
it into California’s revenue stream. Sometimes taxpayers are
not aware that the credit exists, face language or cultural
barriers, or are afraid that by claiming the credit they will
sacrifice their eligibility for other important income-support
programs. In other words, the actual EITC participation rate is
known to be lower than what it could be.
Researchers agree that a large amount of EITC refunds go
unclaimed, although there is some disagreement on the exact
amount. A Government Accountability Office (GAO) study
estimated that 25 percent of EITC refunds go unclaimed.8 A
more recent IRS study found that 17.8% of refunds nationally
go unclaimed.9 The IRS study also estimated that California
has the highest EITC non-filer rate (24.9%).
This under-participation in the EITC program not only results
in lost resources for California, but also entails social costs
that are more difficult to measure. For instance, many EITC
recipients file their tax returns through a paid tax preparer and
often pay large sums for this service.10 While this practice
does not necessarily limit the amount of EITC resources that
are injected into California’s revenue stream, it does represent
an unintended use of public funds. In these situations, EITC
resources that are intended to help the working poor are
diverted to financial professionals. This is a true social cost,
although difficult to quantify, because these public funds are
not being used as intended. This report understates the true
social cost of current EITC payments because it ignores the
social impact of these diverted funds and estimates only the
amount and impact of funds that go entirely unclaimed.
III. Claimed and unclaimed EITC refunds, county by county
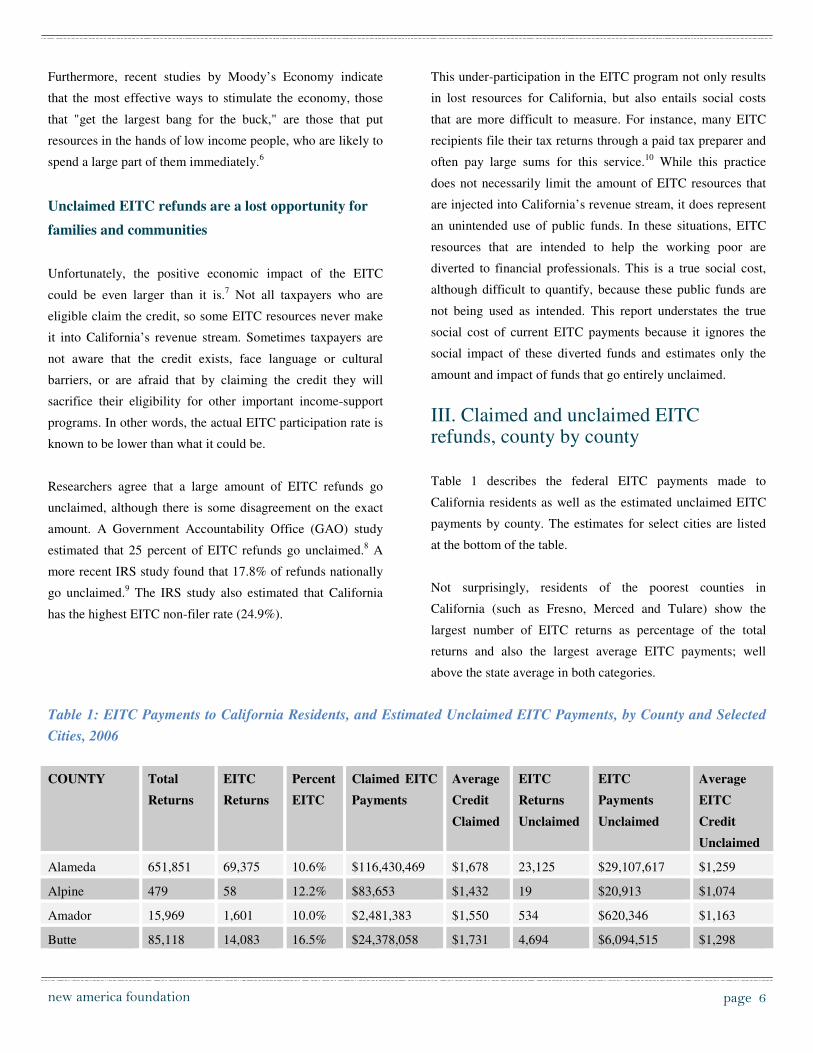
Table 1 describes the federal EITC payments made to
California residents as well as the estimated unclaimed EITC
payments by county. The estimates for select cities are listed
at the bottom of the table.
Not surprisingly, residents of the poorest counties in
California (such as Fresno, Merced and Tulare) show the
largest number of EITC returns as percentage of the total
returns and also the largest average EITC payments; well
above the state average in both categories.
Table 1: EITC Payments to California Residents, and Estimated Unclaimed EITC Payments, by County and Selected
Cities, 2006
COUNTY Total
Returns
EITC
Returns
Percent
EITC
Claimed EITC
Payments
Average
Credit
Claimed
EITC
Returns
Unclaimed
EITC
Payments
Unclaimed
Average
EITC
Credit
Unclaimed
Alameda 651,851 69,375 10.6% $116,430,469 $1,678 23,125 $29,107,617 $1,259
Alpine 479 58 12.2% $83,653 $1,432 19 $20,913 $1,074
Amador 15,969 1,601 10.0% $2,481,383 $1,550 534 $620,346 $1,163
Butte 85,118 14,083 16.5% $24,378,058 $1,731 4,694 $6,094,515 $1,298

new america foundation page 7
COUNTY Total
Returns
EITC
Returns
Percent
EITC
Claimed EITC
Payments
Average
Credit
Claimed
EITC
Returns
Unclaimed
EITC
Payments
Unclaimed
Average
EITC
Credit
Unclaimed
Calaveras 21,740 2,439 11.2% $4,031,883 $1,653 813 $1,007,971 $1,240
Colusa 8,865 1,569 17.7% $2,857,822 $1,822 523 $714,455 $1,366
Contra Costa 474,582 40,047 8.4% $67,357,249 $1,682 13,349 $16,839,312 $1,261
Del Norte 9,202 1,818 19.8% $3,353,904 $1,845 606 $838,476 $1,384
El Dorado 79,019 7,204 9.1% $11,285,381 $1,567 2,401 $2,821,345 $1,175
Fresno 330,517 85,970 26.0% $182,253,755 $2,120 28,657 $45,563,439 $1,590
Glenn 11,076 2,298 20.7% $4,245,879 $1,848 766 $1,061,470 $1,386
Humboldt 53,397 9,294 17.4% $14,411,671 $1,551 3,098 $3,602,918 $1,163
Imperial 70,279 25,374 36.1% $52,494,241 $2,069 8,458 $13,123,560 $1,552
Inyo 9,506 1,088 11.4% $1,772,278 $1,630 363 $443,069 $1,222
Kern 290,522 71,296 24.5% $151,589,072 $2,126 23,765 $37,897,268 $1,595
Kings 55,482 13,744 24.8% $27,617,182 $2,009 4,581 $6,904,296 $1,507
Lake 24,578 4,499 18.3% $7,794,325 $1,732 1,500 $1,948,581 $1,299
Lassen 11,145 1,502 13.5% $2,627,290 $1,749 501 $656,822 $1,312
Los Angeles 4,018,309 769,347 19.1% $1,480,043,437 $1,924 256,449 $370,010,859 $1,443
Madera 51,438 12,340 24.0% $25,788,488 $2,090 4,113 $6,447,122 $1,567
Marin 125,019 6,574 5.3% $8,066,684 $1,227 2,191 $2,016,671 $920
Mariposa 10,272 1,307 12.7% $2,114,672 $1,618 436 $528,668 $1,214
Mendocino 36,705 6,238 17.0% $10,458,578 $1,677 2,079 $2,614,644 $1,257
Merced 91,046 22,931 25.2% $46,837,932 $2,043 7,644 $11,709,483 $1,532
Modoc 4,720 850 18.0% $1,463,929 $1,722 283 $365,982 $1,292
Mono 10,843 1,148 10.6% $1,714,888 $1,494 383 $428,722 $1,120
Monterey 188,717 32,429 17.2% $64,629,771 $1,993 10,810 $16,157,443 $1,495
Napa 59,170 4,883 8.3% $7,737,908 $1,585 1,628 $1,934,477 $1,189
Nevada 51,180 5,194 10.1% $7,734,017 $1,489 1,731 $1,933,504 $1,117
Orange 1,280,238 144,964 11.3% $253,495,035 $1,749 48,321 $63,373,759 $1,312
Placer 155,553 12,372 8.0% $19,305,375 $1,560 4,124 $4,826,344 $1,170
Plumas 10,163 1,290 12.7% $2,021,291 $1,567 430 $505,323 $1,175
Riverside 811,045 150,548 18.6% $306,425,050 $2,035 50,183 $76,606,262 $1,527
Sacramento 582,724 88,283 15.2% $165,278,992 $1,872 29,428 $41,319,748 $1,404
San Benito 22,956 3,143 13.7% $5,721,480 $1,820 1,048 $1,430,370 $1,365
San Bernardino 771,063 164,217 21.3% $339,692,704 $2,069 54,739 $84,923,176 $1,551
San Diego 1,316,627 175,693 13.3% $310,665,093 $1,768 58,564 $77,666,273 $1,326

new america foundation page 8
COUNTY Total
Returns
EITC
Returns
Percent
EITC
Claimed EITC
Payments
Average
Credit
Claimed
EITC
Returns
Unclaimed
EITC
Payments
Unclaimed
Average
EITC
Credit
Unclaimed
San Francisco 406,313 38,739 9.5% $52,739,363 $1,361 12,913 $13,184,841 $1,021
San Joaquin 261,778 48,350 18.5% $94,383,024 $1,952 16,117 $23,595,756 $1,464
San Luis
Obispo
113,801 11,607 10.2% $18,360,874 $1,582 3,869 $4,590,218 $1,186
San Mateo 337,503 22,814 6.8% $33,950,497 $1,488 7,605 $8,487,624 $1,116
Santa Barbara 170,096 20,950 12.3% $37,518,397 $1,791 6,983 $9,379,599 $1,343
Santa Clara 772,003 64,420 8.3% $104,608,152 $1,624 21,473 $26,152,038 $1,218
Santa Cruz 118,678 14,772 12.4% $25,340,068 $1,715 4,924 $6,335,017 $1,287
Shasta 76,567 12,538 16.4% $21,849,985 $1,743 4,179 $5,462,496 $1,307
Sierra 2,266 335 14.8% $488,300 $1,458 112 $122,075 $1,093
Siskiyou 19,100 3,385 17.7% $5,570,710 $1,646 1,128 $1,392,678 $1,234
Solano 176,936 20,985 11.9% $37,185,731 $1,772 6,995 $9,296,433 $1,329
Sonoma 216,781 18,984 8.8% $28,164,818 $1,484 6,328 $7,041,205 $1,113
Stanislaus 194,970 36,579 18.8% $70,466,031 $1,926 12,193 $17,616,508 $1,445
Sutter 38,920 6,949 17.9% $12,927,316 $1,860 2,316 $3,231,829 $1,395
Tehama 26,222 5,081 19.4% $9,262,145 $1,823 1,694 $2,315,536 $1,367
Trinity 5,092 874 17.2% $1,404,593 $1,606 291 $351,148 $1,205
Tulare 182,161 56,865 31.2% $124,947,518 $2,197 18,955 $31,236,879 $1,648
Tuolumne 24,928 3,113 12.5% $4,957,903 $1,593 1,038 $1,239,476 $1,195
Ventura 370,370 42,507 11.5% $75,267,327 $1,771 14,169 $18,816,832 $1,328
Yolo 76,613 9,285 12.1% $16,094,460 $1,733 3,095 $4,023,615 $1,300
Yuba 27,242 5,812 21.3% $11,028,586 $1,898 1,937 $2,757,146 $1,423
CALIFORNIA 15,419,437 2,401,947 15.6% $4,522,770,000 $1,883 800,649 $1,130,692,500 $1,412
CITY
Los Angeles 1,018,339 249,726 24.5% $497,091,000 $1,991 83,242 $124,272,750 $1,493
Fresno 203,538 53,723 26.4% $114,101,000 $2,124 17,908 $28,525,250 $1,593
Modesto 99,232 18,838 19.0% $36,126,000 $1,918 6,279 $9,031,500 $1,438
Oakland 178,068 28,479 16.0% $50,536,000 $1,775 9,493 $12,634,000 $1,331
San Bernardino 81,487 27,510 33.8% $62,489,000 $2,272 9,170 $15,622,250 $1,704
San Diego 583,966 78,015 13.4% $135,675,000 $1,739 26,005 $33,918,750 $1,304
SOURCE: Internal Revenue Service (IRS) and authors’ calculations
new america foundation page 9
In terms of sheer EITC refund claims, California shows
significant variation among counties. For example, Los
Angeles, the most populous county in California, accounts for
close to a third of the total EITC funds claimed in California
(almost $1.5 billion). Smaller counties such as Alpine, Sierra
and Trinity, claim less than $2 million added together.
EITC refunds left on the table
Approximately 800,000 California residents failed to claim
$1.1 billion in EITC refunds in 2006. Furthermore, the
following counties missed out on the largest amounts of EITC
refunds: Los Angeles ($370 million), San Bernardino ($84.9
million), San Diego ($77.7 million), Riverside ($76.7 million),
Orange ($63.4 million), Fresno ($45.6 million), Sacramento
($41.3 million), Kern ($37.9 million), Tulare ($31.2 million),
and Alameda ($29.1 million).
A number of EITC researchers have noted that counties with
high numbers of non-claimants tend to be those with: (1) high
concentrations of Hispanics; (2) significant numbers of low-
income individuals; (3) high participation in the food stamp
assistance programs; (4) significant numbers of families with
no qualifying children.11
Comments on the methodology used to estimate the
amount of unclaimed refunds
While it is simple to calculate the exact amount of EITC funds
claimed by California residents, the same is not true for
estimating the amount of unclaimed refunds. Because some
residents who claim the EITC refund are not technically
eligible for it, and because the number of eligible families at
the city or county level is unknown, it is impossible to
calculate with precision how many eligible families fail to
claim the EITC. This report provides estimates based on the
latest available data from the IRS and is informed by an
extensive body of similar research.
In 2001, the US General Accounting Office (GAO) estimated
that the average participation rate for the whole country is
approximately 75% (25% of the eligible population does not
claim the EITC).12 However, some researchers argued that this
estimate for the EITC participation rate was too low and
contested the GAO’s methodology on the grounds that the
study was based on information from two mismatched
databases.13 Alternatively, in 2002 the Internal Revenue
Service (IRS) released a report estimating the national EITC
non-filer rate to be 17.8% using the Census Bureau’s Survey
of Income and Program Participation (SIPP).14 In general,
scholars have more confidence in the IRS estimate due to the
methodology employed.
The same report lists
California as having the
highest EITC non-filer
rate (24.9%) in the
nation. In order to avoid
overstating the
economic impact of
foregone EITC claims,
this study assumes an
EITC non-filer rate of
20% and uses this
number to estimate the
amount of unclaimed
EITC payments in California and its counties.
Also, the average credit owed to eligible EITC recipients who
failed to claim the credit is likely lower than for the average
actual claimant because these two groups of individuals have
different characteristics. Following what other researchers
have done to account for these differences, the average
received credit is multiplied by 75% to obtain a more accurate
picture of the average credit owed to eligible EITC recipients
who failed to claim the credit.15 This calculation is shown in
the last column of Table 1 and is then used to estimate the
number of unclaimed EITC returns (an estimate of the number
of individuals that fail to claim the credit). The estimate of
unclaimed EITC returns is obtained by dividing the total
amount of unclaimed EITC payments by the estimated
average credit owed to eligible EITC recipients who failed to
claim the credit.
California’s EITC non-
filer rate –the percentage
of those qualified who
don’t file for the EITC—is
24.9%, as estimated by the
IRS. This is well over the
national rate of 17.8%

new america foundation page 10
IV. The Economic Impact of the Federal EITC Program
EITC refunds ripple throughout the economy as they are spent
at businesses, create jobs, pay for wages, and ultimately
generate tax revenue for state and local governments.
EITC payments to California residents are injected into
California’s economy when they are spent. Due to the
interactions between firms, industries, and social institutions
that naturally occur within the economy, the expenditures of
EITC payments now circulating within California’s revenue
stream initiate a series of iterative rounds of income creation,
spending and re-spending that result in multiplicative effects.
Thus, EITC payments spent in the state’s economy become
income for residents, business and local government.
The economic impact (or lack of) of the EITC attributable to
the tax credit payments is linked to the ways recipients spend
this income in California, in the counties and in the cities. This
analysis will measure the impact of the EITC in four different
areas:
1) Additional output (business sales);
2) Number of jobs that these benefits payments support
directly and indirectly;
3) Additional labor income (wages); and
4) Additional state tax revenue.
Figure 1 illustrates the conceptual framework of this economic
impact analysis.
The impact of EITC dollars in the state is smaller when there
are leakages, mainly savings withheld and dollars spent
outside the state’s economy. Determining exactly which
fraction of the EITC payments is spent within California
would probably require expensive primary data collection,
such as a survey. Following what other researchers have done
in similar studies to account for initial expenditure leakages, it
is assumed that 80% of the EITC payments made to California
residents are directly spent within the state’s economy.16 This
assumption is a conservative one considering (1) the low
mobility of low-income families, (2) empirical evidence
showing the low savings rate (and negative in some cases) for
low-income families, and (3) the geography of California,
which is bounded on three sides by mountains, deserts and an
ocean. This study also assumes that EITC dollars will be spent
following a typical pattern for households with incomes
between $15,000 and $25,000. In other words, it is assumed
that the spending profile of EITC recipients resembles one of
typical families earning this income level.
The report calculates the economic impact of the federal EITC
for 2006, the most recent tax year for which zip code level
data is available. Since EITC eligibility is based on income,
potential EITC payments and their associated economic
Figure 1: Conceptual Framework – How EITC Dollars Flow Through the Economy
Filers receive
refund
Filers spend a
portion of their
refund
Jobs created
Larger tax revenue
Increased wages
Increased sales
Dollars enter
State economy
new america foundation page 11
impact in California are likely to be much higher in
2009 when unemployment was higher and income
was lower due to the recession. So the estimates for
2006 likely understate the current economic impact
of the EITC. In the next section, extrapolation
techniques are employed to estimate the economic
impact of the federal EITC for the most recent tax
year, 2009. Some further explanations on the
assumptions and methodology are included in the
Appendix.
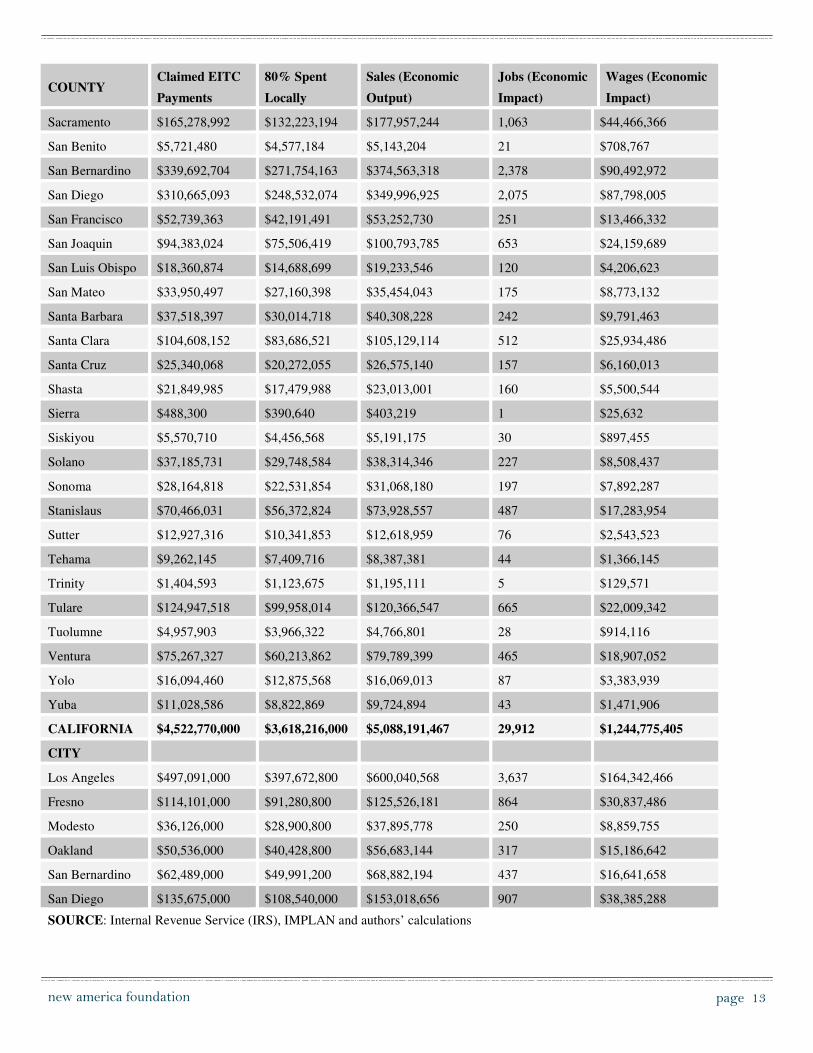
County by county economic impacts
Table 2 shows the economic impact of EITC
payments by county and selected cities. State
residents’ spending of their federal EITC refunds
spurs a total of over $5 billion in business sales in
California (output), supports almost 30,000 jobs and
creates more than $1.2 billion in wages or labor
income. Employment numbers here include total
wage and salary employees as well as self-employed
jobs, including both full-time and part-time jobs.
Many counties reap significant economic
benefits from the EITC
Among the counties that experience the largest
impact, Los Angeles, Riverside and San Bernardino
stand out with a combined business sales impact of
almost $2.5 billion and a combined employment
impact of over 15,000 jobs. In regions that exhibit
the highest poverty rates, for example San Joaquin
Valley counties (Fresno, Madera, Merced, Kern,
Kings, San Joaquin, Stanislaus and Tulare), the data
show a combined business sales impact of more than
$700 million and a combined employment impact of
over 4,600 jobs. If the EITC program did not exist
(or if no state resident claimed it), none of these
impacts would occur.
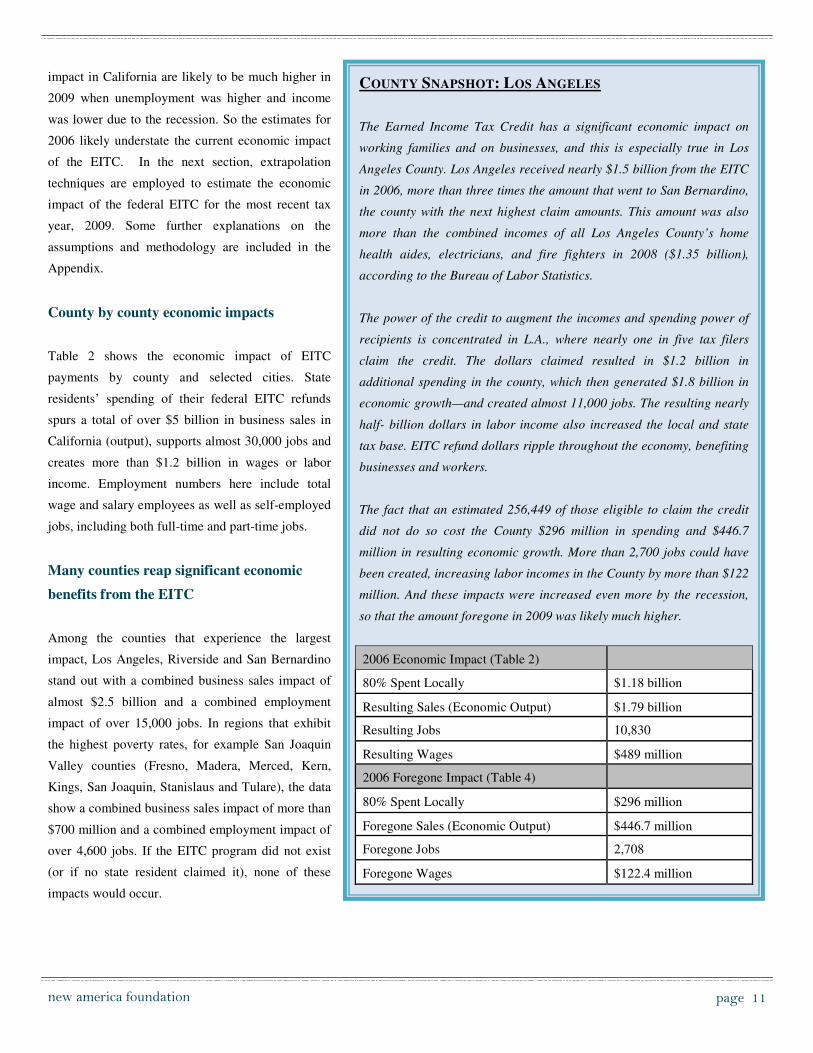
COUNTY SNAPSHOT: LOS ANGELES
The Earned Income Tax Credit has a significant economic impact on
working families and on businesses, and this is especially true in Los
Angeles County. Los Angeles received nearly $1.5 billion from the EITC
in 2006, more than three times the amount that went to San Bernardino,
the county with the next highest claim amounts. This amount was also
more than the combined incomes of all Los Angeles County’s home
health aides, electricians, and fire fighters in 2008 ($1.35 billion),
according to the Bureau of Labor Statistics.
The power of the credit to augment the incomes and spending power of
recipients is concentrated in L.A., where nearly one in five tax filers
claim the credit. The dollars claimed resulted in $1.2 billion in
additional spending in the county, which then generated $1.8 billion in
economic growth—and created almost 11,000 jobs. The resulting nearly
half- billion dollars in labor income also increased the local and state
tax base. EITC refund dollars ripple throughout the economy, benefiting
businesses and workers.
The fact that an estimated 256,449 of those eligible to claim the credit
did not do so cost the County $296 million in spending and $446.7
million in resulting economic growth. More than 2,700 jobs could have
been created, increasing labor incomes in the County by more than $122
million. And these impacts were increased even more by the recession,
so that the amount foregone in 2009 was likely much higher.
2006 Economic Impact (Table 2)
80% Spent Locally $1.18 billion
Resulting Sales (Economic Output) $1.79 billion
Resulting Jobs 10,830
Resulting Wages $489 million
2006 Foregone Impact (Table 4)
80% Spent Locally $296 million
Foregone Sales (Economic Output) $446.7 million
Foregone Jobs 2,708
Foregone Wages $122.4 million

new america foundation page 12
Table 2: Estimated Economic Impact of the EITC in California, by County and Select Cities, 2006
COUNTY Claimed EITC
Payments
80% Spent
Locally
Sales (Economic
Output)
Jobs (Economic
Impact)
Wages (Economic
Impact)
Alameda $116,430,469 $93,144,375 $130,606,323 730 $34,992,263
Alpine $83,653 $66,922 $68,207 0 $3,435
Amador $2,481,383 $1,985,107 $2,293,251 12 $402,314
Butte $24,378,058 $19,502,446 $25,147,726 172 $5,718,639
Calaveras $4,031,883 $3,225,506 $4,506,360 19 $593,021
Colusa $2,857,822 $2,286,258 $2,442,152 13 $319,041
Contra Costa $67,357,249 $53,885,799 $71,523,934 377 $17,533,527
Del Norte $3,353,904 $2,683,123 $3,017,344 16 $489,612
El Dorado $11,285,381 $9,028,305 $10,852,219 59 $2,026,600
Fresno $182,253,755 $145,803,004 $200,521,056 1,380 $49,261,160
Glenn $4,245,879 $3,396,703 $3,718,869 18 $475,905
Humboldt $14,411,671 $11,529,337 $14,525,409 97 $3,020,547
Imperial $52,494,241 $41,995,392 $48,281,810 250 $7,535,181
Inyo $1,772,278 $1,417,822 $1,604,015 8 $248,291
Kern $151,589,072 $121,271,257 $155,020,708 914 $32,648,383
Kings $27,617,182 $22,093,746 $25,233,288 132 $4,069,874
Lake $7,794,325 $6,235,460 $7,190,405 35 $1,200,656
Lassen $2,627,290 $2,101,832 $2,397,268 14 $388,974
Los Angeles $1,480,043,437 $1,184,034,749 $1,786,898,654 10,830 $489,405,794
Madera $25,788,488 $20,630,790 $23,757,822 126 $4,140,401
Marin $8,066,684 $6,453,347 $8,288,711 42 $2,003,752
Mariposa $2,114,672 $1,691,737 $1,820,637 8 $191,292
Mendocino $10,458,578 $8,366,862 $10,185,556 62 $2,040,939
Merced $46,837,932 $37,470,346 $45,116,957 270 $8,100,264
Modoc $1,463,929 $1,171,143 $1,243,007 5 $126,847
Mono $1,714,888 $1,371,910 $1,477,249 6 $162,547
Monterey $64,629,771 $51,703,816 $65,516,349 368 $14,925,917
Napa $7,737,908 $6,190,326 $7,861,226 43 $1,823,130
Nevada $7,734,017 $6,187,214 $75,487,120 44 $1,523,151
Orange $253,495,035 $202,796,028 $293,589,861 1,670 $76,206,754
Placer $19,305,375 $15,444,300 $19,686,597 117 $4,509,412
Plumas $2,021,291 $1,617,033 $1,780,897 8 $221,710
Riverside $306,425,050 $245,140,040 $323,286,620 1,910 $71,674,321
new america foundation page 13
COUNTY Claimed EITC
Payments
80% Spent
Locally
Sales (Economic
Output)
Jobs (Economic
Impact)
Wages (Economic
Impact)
Sacramento $165,278,992 $132,223,194 $177,957,244 1,063 $44,466,366
San Benito $5,721,480 $4,577,184 $5,143,204 21 $708,767
San Bernardino $339,692,704 $271,754,163 $374,563,318 2,378 $90,492,972
San Diego $310,665,093 $248,532,074 $349,996,925 2,075 $87,798,005
San Francisco $52,739,363 $42,191,491 $53,252,730 251 $13,466,332
San Joaquin $94,383,024 $75,506,419 $100,793,785 653 $24,159,689
San Luis Obispo $18,360,874 $14,688,699 $19,233,546 120 $4,206,623
San Mateo $33,950,497 $27,160,398 $35,454,043 175 $8,773,132
Santa Barbara $37,518,397 $30,014,718 $40,308,228 242 $9,791,463
Santa Clara $104,608,152 $83,686,521 $105,129,114 512 $25,934,486
Santa Cruz $25,340,068 $20,272,055 $26,575,140 157 $6,160,013
Shasta $21,849,985 $17,479,988 $23,013,001 160 $5,500,544
Sierra $488,300 $390,640 $403,219 1 $25,632
Siskiyou $5,570,710 $4,456,568 $5,191,175 30 $897,455
Solano $37,185,731 $29,748,584 $38,314,346 227 $8,508,437
Sonoma $28,164,818 $22,531,854 $31,068,180 197 $7,892,287
Stanislaus $70,466,031 $56,372,824 $73,928,557 487 $17,283,954
Sutter $12,927,316 $10,341,853 $12,618,959 76 $2,543,523
Tehama $9,262,145 $7,409,716 $8,387,381 44 $1,366,145
Trinity $1,404,593 $1,123,675 $1,195,111 5 $129,571
Tulare $124,947,518 $99,958,014 $120,366,547 665 $22,009,342
Tuolumne $4,957,903 $3,966,322 $4,766,801 28 $914,116
Ventura $75,267,327 $60,213,862 $79,789,399 465 $18,907,052
Yolo $16,094,460 $12,875,568 $16,069,013 87 $3,383,939
Yuba $11,028,586 $8,822,869 $9,724,894 43 $1,471,906
CALIFORNIA $4,522,770,000 $3,618,216,000 $5,088,191,467 29,912 $1,244,775,405
CITY
Los Angeles $497,091,000 $397,672,800 $600,040,568 3,637 $164,342,466
Fresno $114,101,000 $91,280,800 $125,526,181 864 $30,837,486
Modesto $36,126,000 $28,900,800 $37,895,778 250 $8,859,755
Oakland $50,536,000 $40,428,800 $56,683,144 317 $15,186,642
San Bernardino $62,489,000 $49,991,200 $68,882,194 437 $16,641,658
San Diego $135,675,000 $108,540,000 $153,018,656 907 $38,385,288
SOURCE: Internal Revenue Service (IRS), IMPLAN and authors’ calculations
new america foundation
page 14
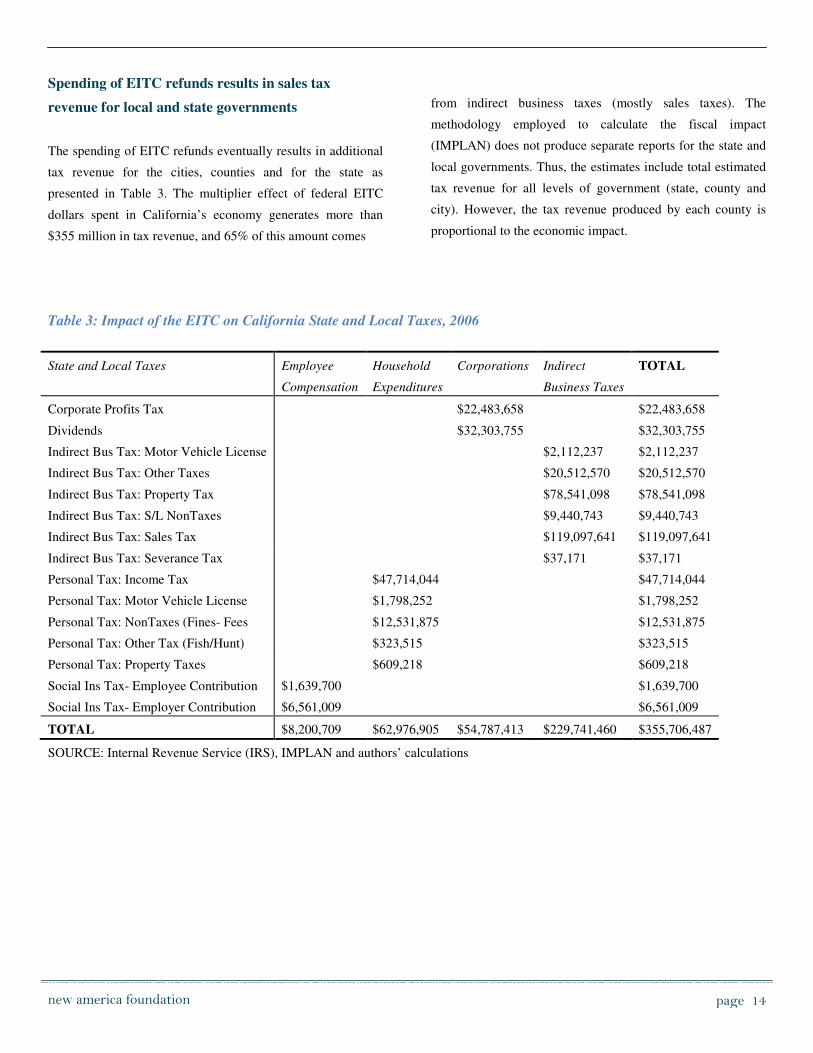
Spending of EITC refunds results in sales tax
revenue for local and state governments
The spending of EITC refunds eventually results in additional
tax revenue for the cities, counties and for the state as
presented in Table 3. The multiplier effect of federal EITC
dollars spent in California’s economy generates more than
$355 million in tax revenue, and 65% of this amount comes
from indirect business taxes (mostly sales taxes). The
methodology employed to calculate the fiscal impact
(IMPLAN) does not produce separate reports for the state and
local governments. Thus, the estimates include total estimated
tax revenue for all levels of government (state, county and
city). However, the tax revenue produced by each county is
proportional to the economic impact.
Table 3: Impact of the EITC on California State and Local Taxes, 2006
State and Local Taxes Employee
Compensation
Household
Expenditures
Corporations Indirect
Business Taxes
TOTAL
Corporate Profits Tax $22,483,658 $22,483,658
Dividends $32,303,755 $32,303,755
Indirect Bus Tax: Motor Vehicle License $2,112,237 $2,112,237
Indirect Bus Tax: Other Taxes $20,512,570 $20,512,570
Indirect Bus Tax: Property Tax $78,541,098 $78,541,098
Indirect Bus Tax: S/L NonTaxes $9,440,743 $9,440,743
Indirect Bus Tax: Sales Tax $119,097,641 $119,097,641
Indirect Bus Tax: Severance Tax $37,171 $37,171
Personal Tax: Income Tax $47,714,044 $47,714,044
Personal Tax: Motor Vehicle License $1,798,252 $1,798,252
Personal Tax: NonTaxes (Fines- Fees $12,531,875 $12,531,875
Personal Tax: Other Tax (Fish/Hunt) $323,515 $323,515
Personal Tax: Property Taxes $609,218 $609,218
Social Ins Tax- Employee Contribution $1,639,700 $1,639,700
Social Ins Tax- Employer Contribution $6,561,009 $6,561,009
TOTAL $8,200,709 $62,976,905 $54,787,413 $229,741,460 $355,706,487
SOURCE: Internal Revenue Service (IRS), IMPLAN and authors’ calculations
new america foundation page 15
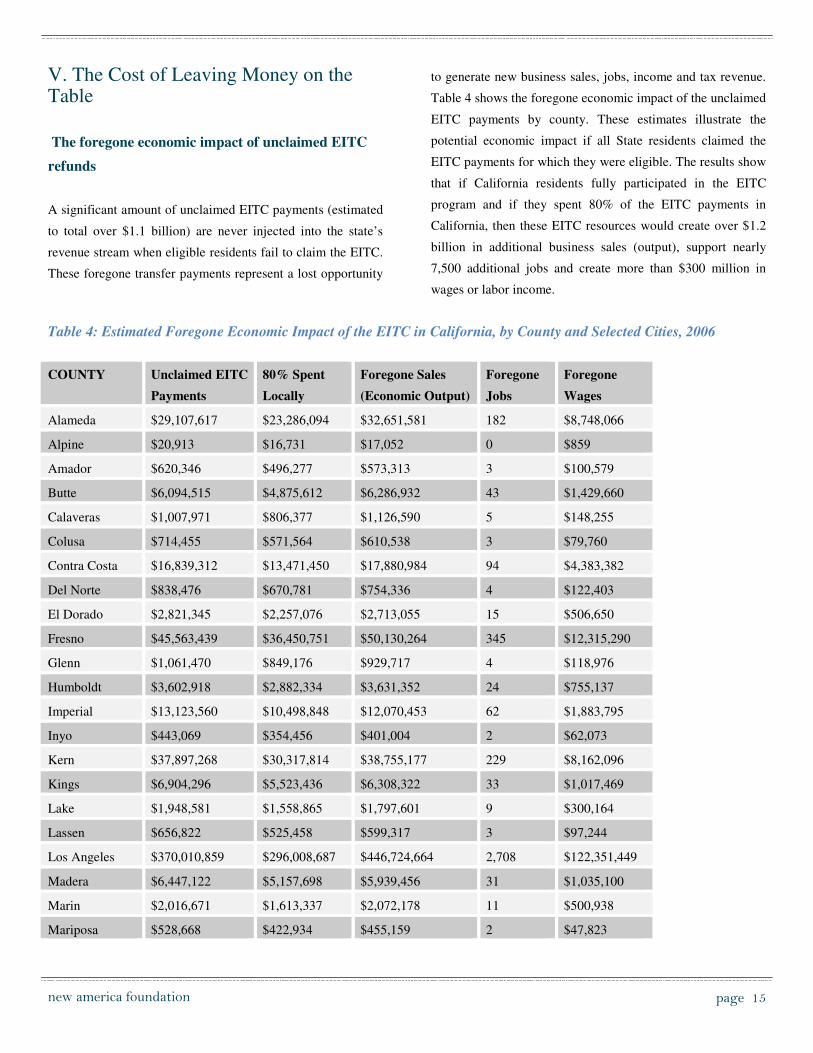
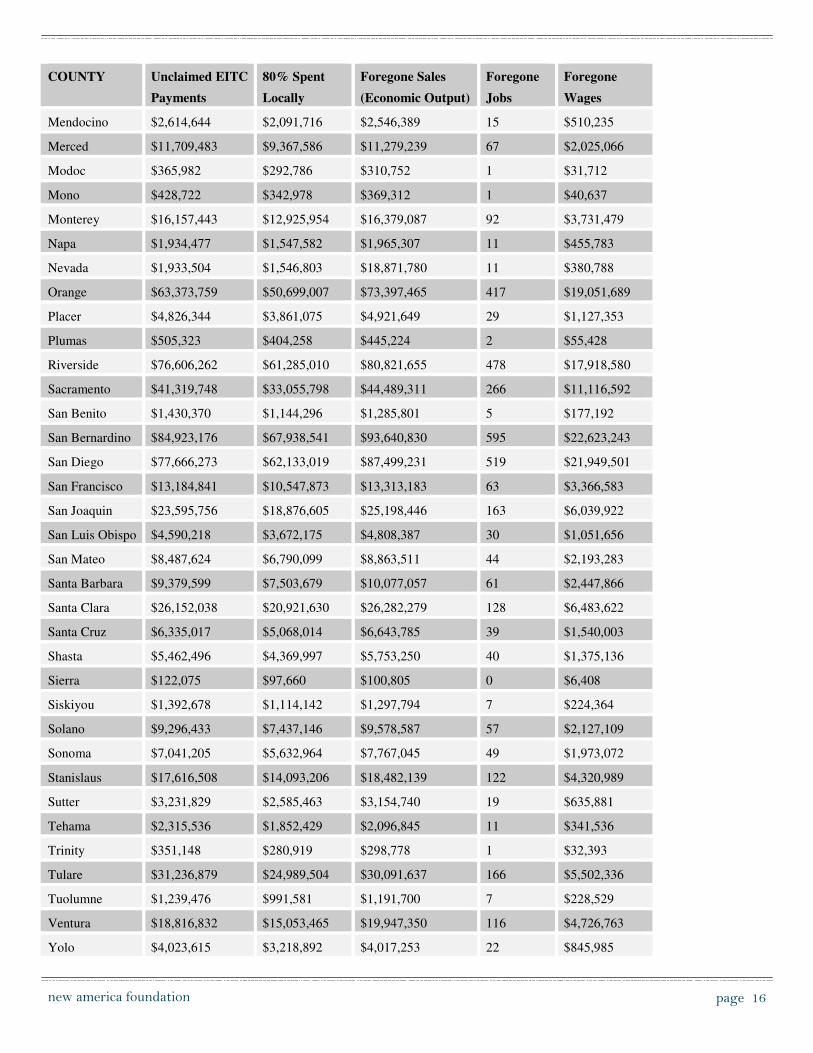
V. The Cost of Leaving Money on the Table
The foregone economic impact of unclaimed EITC
refunds
A significant amount of unclaimed EITC payments (estimated
to total over $1.1 billion) are never injected into the state’s
revenue stream when eligible residents fail to claim the EITC.
These foregone transfer payments represent a lost opportunity
to generate new business sales, jobs, income and tax revenue.
Table 4 shows the foregone economic impact of the unclaimed
EITC payments by county. These estimates illustrate the
potential economic impact if all State residents claimed the
EITC payments for which they were eligible. The results show
that if California residents fully participated in the EITC
program and if they spent 80% of the EITC payments in
California, then these EITC resources would create over $1.2
billion in additional business sales (output), support nearly
7,500 additional jobs and create more than $300 million in
wages or labor income.
Table 4: Estimated Foregone Economic Impact of the EITC in California, by County and Selected Cities, 2006
COUNTY Unclaimed EITC
Payments
80% Spent
Locally
Foregone Sales
(Economic Output)
Foregone
Jobs
Foregone
Wages
Alameda $29,107,617 $23,286,094 $32,651,581 182 $8,748,066
Alpine $20,913 $16,731 $17,052 0 $859
Amador $620,346 $496,277 $573,313 3 $100,579
Butte $6,094,515 $4,875,612 $6,286,932 43 $1,429,660
Calaveras $1,007,971 $806,377 $1,126,590 5 $148,255
Colusa $714,455 $571,564 $610,538 3 $79,760
Contra Costa $16,839,312 $13,471,450 $17,880,984 94 $4,383,382
Del Norte $838,476 $670,781 $754,336 4 $122,403
El Dorado $2,821,345 $2,257,076 $2,713,055 15 $506,650
Fresno $45,563,439 $36,450,751 $50,130,264 345 $12,315,290
Glenn $1,061,470 $849,176 $929,717 4 $118,976
Humboldt $3,602,918 $2,882,334 $3,631,352 24 $755,137
Imperial $13,123,560 $10,498,848 $12,070,453 62 $1,883,795
Inyo $443,069 $354,456 $401,004 2 $62,073
Kern $37,897,268 $30,317,814 $38,755,177 229 $8,162,096
Kings $6,904,296 $5,523,436 $6,308,322 33 $1,017,469
Lake $1,948,581 $1,558,865 $1,797,601 9 $300,164
Lassen $656,822 $525,458 $599,317 3 $97,244
Los Angeles $370,010,859 $296,008,687 $446,724,664 2,708 $122,351,449
Madera $6,447,122 $5,157,698 $5,939,456 31 $1,035,100
Marin $2,016,671 $1,613,337 $2,072,178 11 $500,938
Mariposa $528,668 $422,934 $455,159 2 $47,823
new america foundation page 16
COUNTY Unclaimed EITC
Payments
80% Spent
Locally
Foregone Sales
(Economic Output)
Foregone
Jobs
Foregone
Wages
Mendocino $2,614,644 $2,091,716 $2,546,389 15 $510,235
Merced $11,709,483 $9,367,586 $11,279,239 67 $2,025,066
Modoc $365,982 $292,786 $310,752 1 $31,712
Mono $428,722 $342,978 $369,312 1 $40,637
Monterey $16,157,443 $12,925,954 $16,379,087 92 $3,731,479
Napa $1,934,477 $1,547,582 $1,965,307 11 $455,783
Nevada $1,933,504 $1,546,803 $18,871,780 11 $380,788
Orange $63,373,759 $50,699,007 $73,397,465 417 $19,051,689
Placer $4,826,344 $3,861,075 $4,921,649 29 $1,127,353
Plumas $505,323 $404,258 $445,224 2 $55,428
Riverside $76,606,262 $61,285,010 $80,821,655 478 $17,918,580
Sacramento $41,319,748 $33,055,798 $44,489,311 266 $11,116,592
San Benito $1,430,370 $1,144,296 $1,285,801 5 $177,192
San Bernardino $84,923,176 $67,938,541 $93,640,830 595 $22,623,243
San Diego $77,666,273 $62,133,019 $87,499,231 519 $21,949,501
San Francisco $13,184,841 $10,547,873 $13,313,183 63 $3,366,583
San Joaquin $23,595,756 $18,876,605 $25,198,446 163 $6,039,922
San Luis Obispo $4,590,218 $3,672,175 $4,808,387 30 $1,051,656
San Mateo $8,487,624 $6,790,099 $8,863,511 44 $2,193,283
Santa Barbara $9,379,599 $7,503,679 $10,077,057 61 $2,447,866
Santa Clara $26,152,038 $20,921,630 $26,282,279 128 $6,483,622
Santa Cruz $6,335,017 $5,068,014 $6,643,785 39 $1,540,003
Shasta $5,462,496 $4,369,997 $5,753,250 40 $1,375,136
Sierra $122,075 $97,660 $100,805 0 $6,408
Siskiyou $1,392,678 $1,114,142 $1,297,794 7 $224,364
Solano $9,296,433 $7,437,146 $9,578,587 57 $2,127,109
Sonoma $7,041,205 $5,632,964 $7,767,045 49 $1,973,072
Stanislaus $17,616,508 $14,093,206 $18,482,139 122 $4,320,989
Sutter $3,231,829 $2,585,463 $3,154,740 19 $635,881
Tehama $2,315,536 $1,852,429 $2,096,845 11 $341,536
Trinity $351,148 $280,919 $298,778 1 $32,393
Tulare $31,236,879 $24,989,504 $30,091,637 166 $5,502,336
Tuolumne $1,239,476 $991,581 $1,191,700 7 $228,529
Ventura $18,816,832 $15,053,465 $19,947,350 116 $4,726,763
Yolo $4,023,615 $3,218,892 $4,017,253 22 $845,985
new america foundation page 17
COUNTY Unclaimed EITC
Payments
80% Spent
Locally
Foregone Sales
(Economic Output)
Foregone
Jobs
Foregone
Wages
Yuba $2,757,146 $2,205,717 $2,431,224 11 $367,977
CALIFORNIA $1,130,692,500 $904,554,000 $1,272,047,867 7,478 $311,193,851
CITY
Los Angeles $124,272,750 $99,418,200 $150,010,142 909 $41,085,616
Fresno $28,525,250 $22,820,200 $31,381,545 216 $7,709,372
Modesto $9,031,500 $7,225,200 $9,473,945 62 $2,214,939
Oakland $12,634,000 $10,107,200 $14,170,786 79 $3,796,661
San Bernardino $15,622,250 $12,497,800 $17,220,549 109 $4,160,414
San Diego $33,918,750 $27,135,000 $38,254,664 227 $9,596,322
SOURCE: Internal Revenue Service (IRS), IMPLAN and authors’ calculations
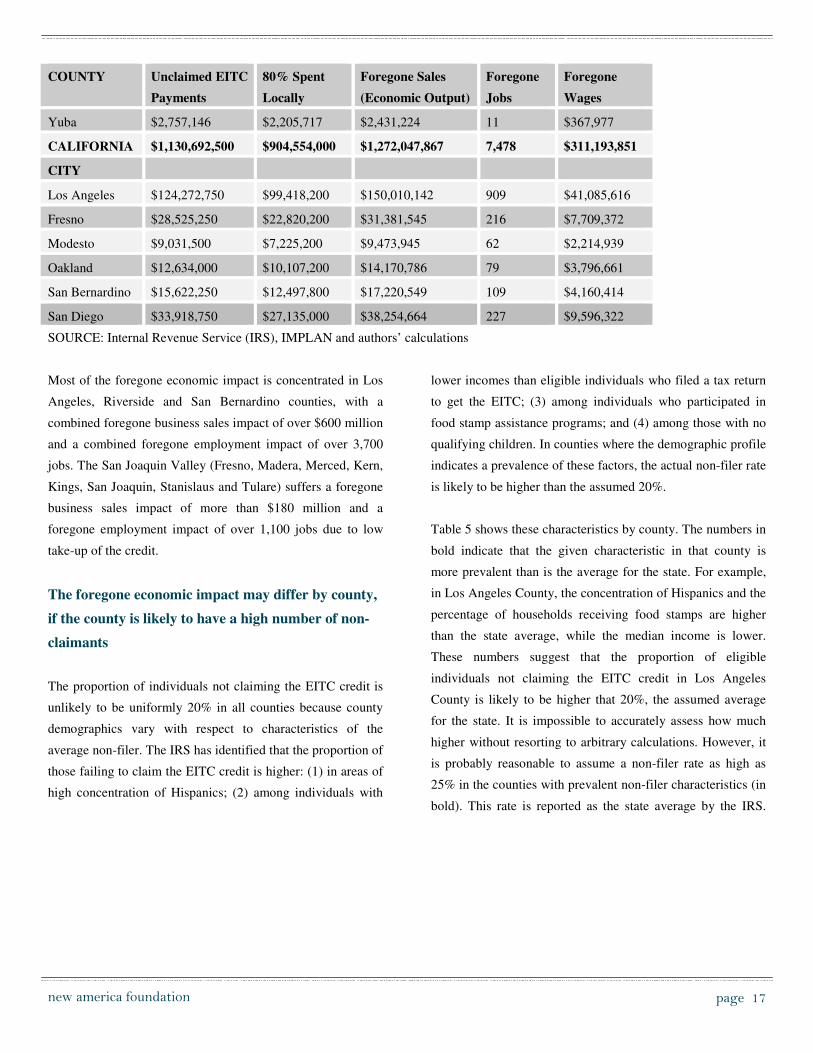
Most of the foregone economic impact is concentrated in Los
Angeles, Riverside and San Bernardino counties, with a
combined foregone business sales impact of over $600 million
and a combined foregone employment impact of over 3,700
jobs. The San Joaquin Valley (Fresno, Madera, Merced, Kern,
Kings, San Joaquin, Stanislaus and Tulare) suffers a foregone
business sales impact of more than $180 million and a
foregone employment impact of over 1,100 jobs due to low
take-up of the credit.
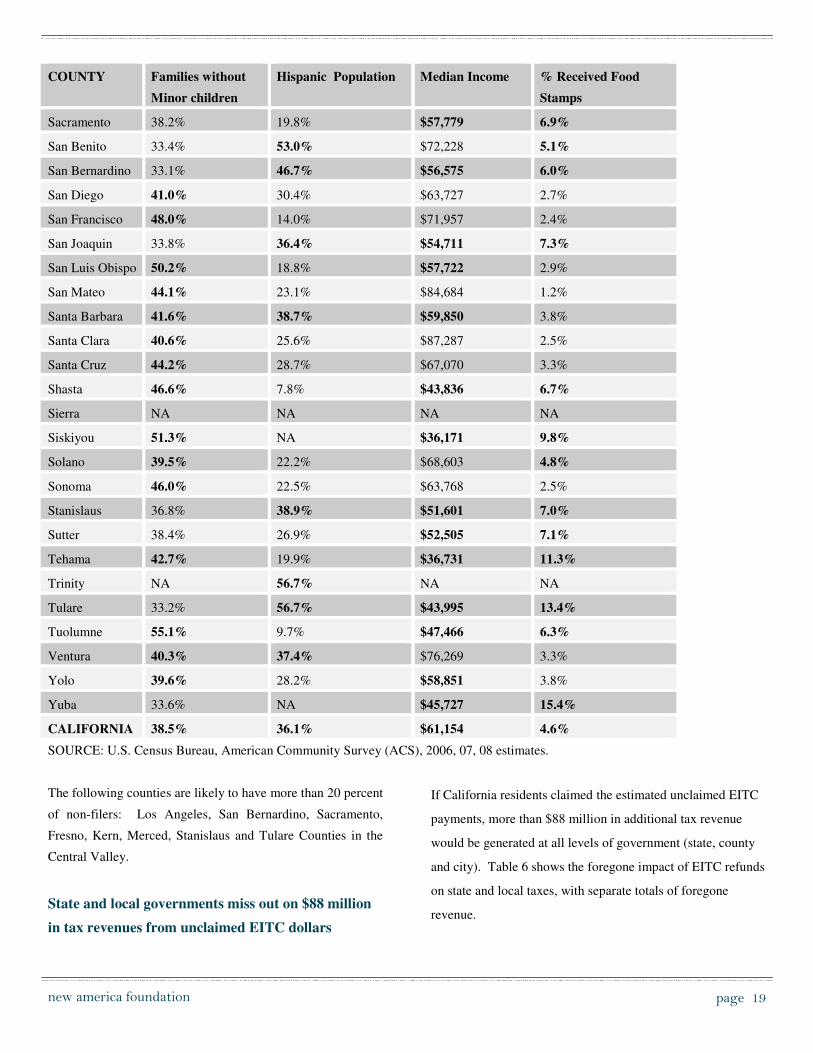
The foregone economic impact may differ by county,
if the county is likely to have a high number of non-
claimants
The proportion of individuals not claiming the EITC credit is
unlikely to be uniformly 20% in all counties because county
demographics vary with respect to characteristics of the
average non-filer. The IRS has identified that the proportion of
those failing to claim the EITC credit is higher: (1) in areas of
high concentration of Hispanics; (2) among individuals with
lower incomes than eligible individuals who filed a tax return
to get the EITC; (3) among individuals who participated in
food stamp assistance programs; and (4) among those with no
qualifying children. In counties where the demographic profile
indicates a prevalence of these factors, the actual non-filer rate
is likely to be higher than the assumed 20%.
Table 5 shows these characteristics by county. The numbers in
bold indicate that the given characteristic in that county is
more prevalent than is the average for the state. For example,
in Los Angeles County, the concentration of Hispanics and the
percentage of households receiving food stamps are higher
than the state average, while the median income is lower.
These numbers suggest that the proportion of eligible
individuals not claiming the EITC credit in Los Angeles
County is likely to be higher that 20%, the assumed average
for the state. It is impossible to accurately assess how much
higher without resorting to arbitrary calculations. However, it
is probably reasonable to assume a non-filer rate as high as
25% in the counties with prevalent non-filer characteristics (in
bold). This rate is reported as the state average by the IRS.

new america foundation page 18
Table 5: Characteristics Associated with High Rates of Unclaimed EITC funds
COUNTY Families without
Minor children
Hispanic Population Median Income % Received Food
Stamps
Alameda 39.2% 21.4% $70,079 3.4%
Alpine 54.7% NA NA NA
Amador 54.7% 10.6% $56,258 3.8%
Butte 46.1% 12.6% $41,569 8.1%
Calaveras 55.7% NA $57,703 3.6%
Colusa 41.6% NA $50,288 6.7%
Contra Costa 42.2% 22.4% $78,619 2.9%
Del Norte 46.3% NA $35,861 15.3%
El Dorado 47.5% 11.3% $70,022 3.1%
Fresno 33.9% 48.2% $45,805 11.5%
Glenn 39.6% NA $40,284 7.1%
Humboldt 44.2% 8.2% $40,515 7.2%
Imperial 30.5% 76.0% $37,492 13.1%
Inyo NA NA NA NA
Kern 32.8% 46.2% $46,442 9.8%
Kings 31.4% 48.5% $49,419 10.6%
Lake 43.2% 15.4% $41,619 10.0%
Lassen 43.7% 15.3% $50,077 8.2%
Los Angeles 35.4% 47.3% $55,192 4.8%
Madera 38.4% 50.0% $45,646 10.8%
Marin 48.4% 13.6% $88,101 1.9%
Mariposa 48.6% NA NA NA
Mendocino 48.6% 20.1% $43,307 6.2%
Merced 31.4% 52.4% $44,338 12.2%
Modoc NA NA NA NA
Mono NA NA NA NA
Monterey 38.3% 52.2% $59,140 4.5%
Napa 45.5% 29.3% $67,484 2.0%
Nevada 55.2% 7.4% $56,890 3.3%
Orange 40.6% 33.2% $75,176 2.3%
Placer 45.1% 11.7% $73,260 2.1%
Plumas 61.5% NA $50,817 1.3%
Riverside 36.3% 43.1% $58,168 3.5%
new america foundation page 19
COUNTY Families without
Minor children
Hispanic Population Median Income % Received Food
Stamps
Sacramento 38.2% 19.8% $57,779 6.9%
San Benito 33.4% 53.0% $72,228 5.1%
San Bernardino 33.1% 46.7% $56,575 6.0%
San Diego 41.0% 30.4% $63,727 2.7%
San Francisco 48.0% 14.0% $71,957 2.4%
San Joaquin 33.8% 36.4% $54,711 7.3%
San Luis Obispo 50.2% 18.8% $57,722 2.9%
San Mateo 44.1% 23.1% $84,684 1.2%
Santa Barbara 41.6% 38.7% $59,850 3.8%
Santa Clara 40.6% 25.6% $87,287 2.5%
Santa Cruz 44.2% 28.7% $67,070 3.3%
Shasta 46.6% 7.8% $43,836 6.7%
Sierra NA NA NA NA
Siskiyou 51.3% NA $36,171 9.8%
Solano 39.5% 22.2% $68,603 4.8%
Sonoma 46.0% 22.5% $63,768 2.5%
Stanislaus 36.8% 38.9% $51,601 7.0%
Sutter 38.4% 26.9% $52,505 7.1%
Tehama 42.7% 19.9% $36,731 11.3%
Trinity NA 56.7% NA NA
Tulare 33.2% 56.7% $43,995 13.4%
Tuolumne 55.1% 9.7% $47,466 6.3%
Ventura 40.3% 37.4% $76,269 3.3%
Yolo 39.6% 28.2% $58,851 3.8%
Yuba 33.6% NA $45,727 15.4%
CALIFORNIA 38.5% 36.1% $61,154 4.6%
SOURCE: U.S. Census Bureau, American Community Survey (ACS), 2006, 07, 08 estimates.
The following counties are likely to have more than 20 percent
of non-filers: Los Angeles, San Bernardino, Sacramento,
Fresno, Kern, Merced, Stanislaus and Tulare Counties in the
Central Valley.
State and local governments miss out on $88 million
in tax revenues from unclaimed EITC dollars
If California residents claimed the estimated unclaimed EITC
payments, more than $88 million in additional tax revenue
would be generated at all levels of government (state, county
and city). Table 6 shows the foregone impact of EITC refunds
on state and local taxes, with separate totals of foregone
revenue.

new america foundation
page 20
From 1997 to 2006,
Californians failed to
claim almost $10 billion
in EITC refunds
Table 6: Foregone Impact of the EITC on California State and Local Taxes, 2006
State and Local Taxes Employee
Compensation
Household
Expenditures
Corporations Indirect
Business Taxes
TOTAL
Corporate Profits Tax $5,620,915 $5,620,915
Dividends $8,075,939 $8,075,939
Indirect Bus Tax: Motor Vehicle License $528,059 $528,059
Indirect Bus Tax: Other Taxes $5,128,143 $5,128,143
Indirect Bus Tax: Property Tax $19,635,275 $19,635,275
Indirect Bus Tax: S/L NonTaxes $2,360,186 $2,360,186
Indirect Bus Tax: Sales Tax $29,774,410 $29,774,410
Indirect Bus Tax: Severance Tax $9,293 $9,293
Personal Tax: Income Tax $11,928,511 $11,928,511
Personal Tax: Motor Vehicle License $449,563 $449,563
Personal Tax: NonTaxes (Fines- Fees $3,132,969 $3,132,969
Personal Tax: Other Tax (Fish/Hunt) $80,879 $80,879
Personal Tax: Property Taxes $152,305 $152,305
Social Ins Tax- Employee Contribution $409,925 $409,925
Social Ins Tax- Employer Contribution $1,640,252 $1,640,252
TOTAL $2,050,177 $15,744,226 $13,696,853 $57,435,365 $88,926,622
SOURCE: Internal Revenue Service (IRS), IMPLAN and authors’ calculations
VI. Bringing it up to date: California's overall foregone economic impact in 2009
Sections one through six of this report calculate the foregone
economic impact of the federal EITC for 2006, the most recent
year for which data is available at the zip code level, which is
required to produce the county level estimates. The IRS will
release zip code level data for 2007 later in spring 2010. Since
EITC eligibility is based on income, potential EITC payments
and their associated
economic impact in
California were likely
to be much higher in
2009 when
unemployment was
higher and income was
lower due to the economic recession. Therefore, the 2006
estimates likely understate the current foregone economic
impact of the EITC program.
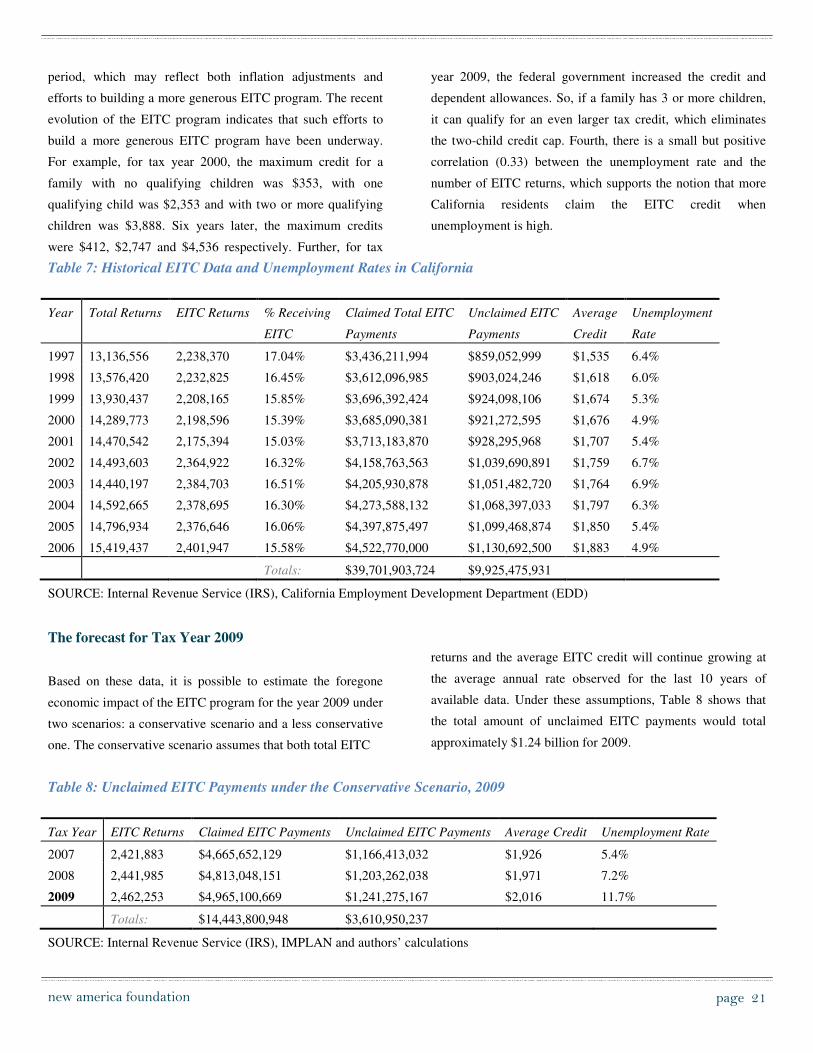
EITC claims rise as unemployment rises
One way to estimate the current foregone impact is to look at
the historical relationship between EITC claims and
unemployment rates in California, and then extrapolate the
data for 2009. Table 7 shows this relationship over the last 10
years. At least four things stand out. First, the accumulated
amount of estimated unclaimed EITC dollars between 1997
and 2006 is large, adding up to almost $10 billion. Second, the
number of total tax returns has grown more rapidly (1.8%
annually) than the number of EITC returns (0.8% annually).
Consequently, EITC returns as a percentage of the total
returns have declined. Third, the average EITC return has
steadily increased by close to 23% during the 1997-2006
new america foundation page 21
period, which may reflect both inflation adjustments and
efforts to building a more generous EITC program. The recent
evolution of the EITC program indicates that such efforts to
build a more generous EITC program have been underway.
For example, for tax year 2000, the maximum credit for a
family with no qualifying children was $353, with one
qualifying child was $2,353 and with two or more qualifying
children was $3,888. Six years later, the maximum credits
were $412, $2,747 and $4,536 respectively. Further, for tax
year 2009, the federal government increased the credit and
dependent allowances. So, if a family has 3 or more children,
it can qualify for an even larger tax credit, which eliminates
the two-child credit cap. Fourth, there is a small but positive
correlation (0.33) between the unemployment rate and the
number of EITC returns, which supports the notion that more
California residents claim the EITC credit when
unemployment is high.
Table 7: Historical EITC Data and Unemployment Rates in California
Year Total Returns EITC Returns % Receiving
EITC
Claimed Total EITC
Payments
Unclaimed EITC
Payments
Average
Credit
Unemployment
Rate
1997 13,136,556 2,238,370 17.04% $3,436,211,994 $859,052,999 $1,535 6.4%
1998 13,576,420 2,232,825 16.45% $3,612,096,985 $903,024,246 $1,618 6.0%
1999 13,930,437 2,208,165 15.85% $3,696,392,424 $924,098,106 $1,674 5.3%
2000 14,289,773 2,198,596 15.39% $3,685,090,381 $921,272,595 $1,676 4.9%
2001 14,470,542 2,175,394 15.03% $3,713,183,870 $928,295,968 $1,707 5.4%
2002 14,493,603 2,364,922 16.32% $4,158,763,563 $1,039,690,891 $1,759 6.7%
2003 14,440,197 2,384,703 16.51% $4,205,930,878 $1,051,482,720 $1,764 6.9%
2004 14,592,665 2,378,695 16.30% $4,273,588,132 $1,068,397,033 $1,797 6.3%
2005 14,796,934 2,376,646 16.06% $4,397,875,497 $1,099,468,874 $1,850 5.4%
2006 15,419,437 2,401,947 15.58% $4,522,770,000 $1,130,692,500 $1,883 4.9%
Totals: $39,701,903,724 $9,925,475,931
SOURCE: Internal Revenue Service (IRS), California Employment Development Department (EDD)
The forecast for Tax Year 2009
Based on these data, it is possible to estimate the foregone
economic impact of the EITC program for the year 2009 under
two scenarios: a conservative scenario and a less conservative
one. The conservative scenario assumes that both total EITC
returns and the average EITC credit will continue growing at
the average annual rate observed for the last 10 years of
available data. Under these assumptions, Table 8 shows that
the total amount of unclaimed EITC payments would total
approximately $1.24 billion for 2009.
Table 8: Unclaimed EITC Payments under the Conservative Scenario, 2009
Tax Year EITC Returns Claimed EITC Payments Unclaimed EITC Payments Average Credit Unemployment Rate
2007 2,421,883 $4,665,652,129 $1,166,413,032 $1,926 5.4%
2008 2,441,985 $4,813,048,151 $1,203,262,038 $1,971 7.2%
2009 2,462,253 $4,965,100,669 $1,241,275,167 $2,016 11.7%
Totals: $14,443,800,948 $3,610,950,237
SOURCE: Internal Revenue Service (IRS), IMPLAN and authors’ calculations
new america foundation
page 22
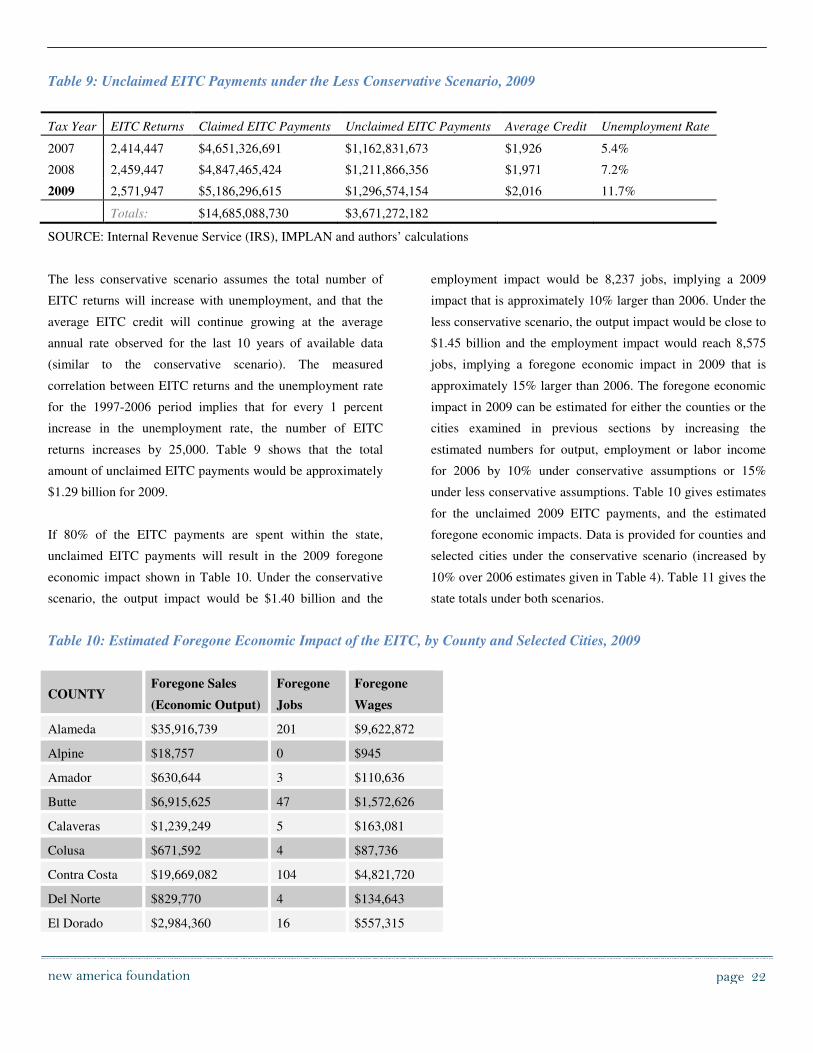
Table 9: Unclaimed EITC Payments under the Less Conservative Scenario, 2009
Tax Year EITC Returns Claimed EITC Payments Unclaimed EITC Payments Average Credit Unemployment Rate
2007 2,414,447 $4,651,326,691 $1,162,831,673 $1,926 5.4%
2008 2,459,447 $4,847,465,424 $1,211,866,356 $1,971 7.2%
2009 2,571,947 $5,186,296,615 $1,296,574,154 $2,016 11.7%
Totals: $14,685,088,730 $3,671,272,182
SOURCE: Internal Revenue Service (IRS), IMPLAN and authors’ calculations
The less conservative scenario assumes the total number of
EITC returns will increase with unemployment, and that the
average EITC credit will continue growing at the average
annual rate observed for the last 10 years of available data
(similar to the conservative scenario). The measured
correlation between EITC returns and the unemployment rate
for the 1997-2006 period implies that for every 1 percent
increase in the unemployment rate, the number of EITC
returns increases by 25,000. Table 9 shows that the total
amount of unclaimed EITC payments would be approximately
$1.29 billion for 2009.
If 80% of the EITC payments are spent within the state,
unclaimed EITC payments will result in the 2009 foregone
economic impact shown in Table 10. Under the conservative
scenario, the output impact would be $1.40 billion and the
employment impact would be 8,237 jobs, implying a 2009
impact that is approximately 10% larger than 2006. Under the
less conservative scenario, the output impact would be close to
$1.45 billion and the employment impact would reach 8,575
jobs, implying a foregone economic impact in 2009 that is
approximately 15% larger than 2006. The foregone economic
impact in 2009 can be estimated for either the counties or the
cities examined in previous sections by increasing the
estimated numbers for output, employment or labor income
for 2006 by 10% under conservative assumptions or 15%
under less conservative assumptions. Table 10 gives estimates
for the unclaimed 2009 EITC payments, and the estimated
foregone economic impacts. Data is provided for counties and
selected cities under the conservative scenario (increased by
10% over 2006 estimates given in Table 4). Table 11 gives the
state totals under both scenarios.
Table 10: Estimated Foregone Economic Impact of the EITC, by County and Selected Cities, 2009
COUNTY Foregone Sales
(Economic Output)
Foregone
Jobs
Foregone
Wages
Alameda $35,916,739 201 $9,622,872
Alpine $18,757 0 $945
Amador $630,644 3 $110,636
Butte $6,915,625 47 $1,572,626
Calaveras $1,239,249 5 $163,081
Colusa $671,592 4 $87,736
Contra Costa $19,669,082 104 $4,821,720
Del Norte $829,770 4 $134,643
El Dorado $2,984,360 16 $557,315
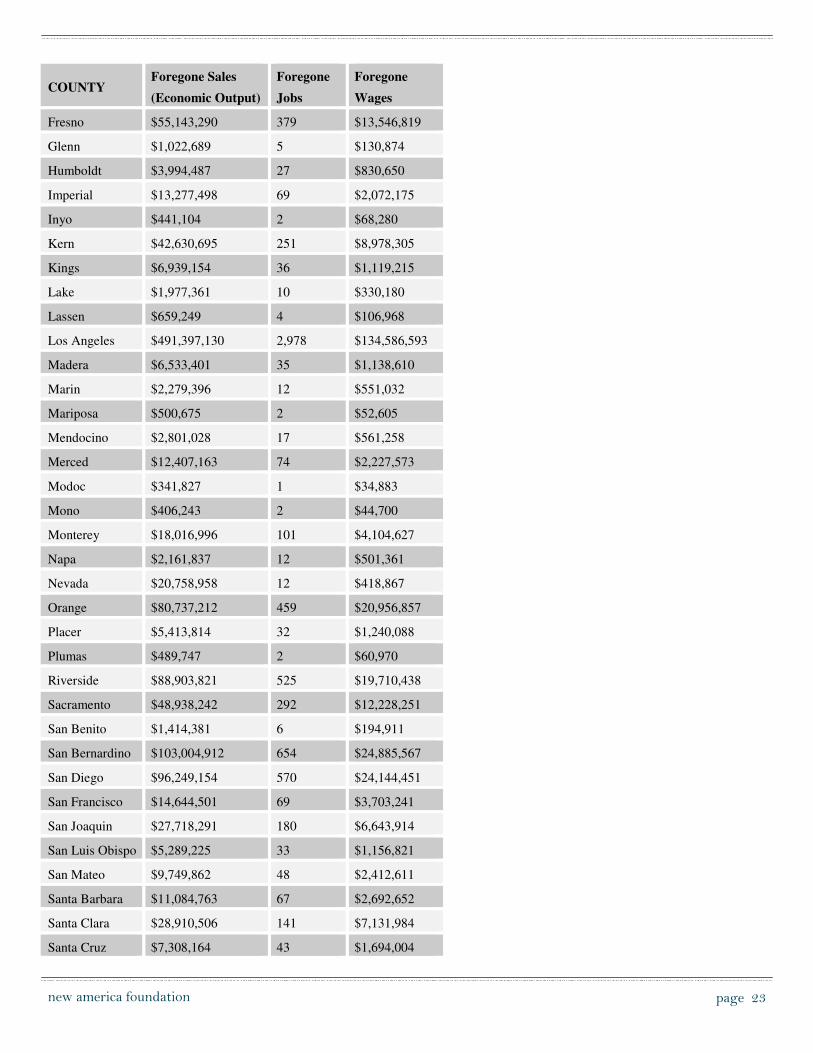
new america foundation page 23
COUNTY Foregone Sales
(Economic Output)
Foregone
Jobs
Foregone
Wages
Fresno $55,143,290 379 $13,546,819
Glenn $1,022,689 5 $130,874
Humboldt $3,994,487 27 $830,650
Imperial $13,277,498 69 $2,072,175
Inyo $441,104 2 $68,280
Kern $42,630,695 251 $8,978,305
Kings $6,939,154 36 $1,119,215
Lake $1,977,361 10 $330,180
Lassen $659,249 4 $106,968
Los Angeles $491,397,130 2,978 $134,586,593
Madera $6,533,401 35 $1,138,610
Marin $2,279,396 12 $551,032
Mariposa $500,675 2 $52,605
Mendocino $2,801,028 17 $561,258
Merced $12,407,163 74 $2,227,573
Modoc $341,827 1 $34,883
Mono $406,243 2 $44,700
Monterey $18,016,996 101 $4,104,627
Napa $2,161,837 12 $501,361
Nevada $20,758,958 12 $418,867
Orange $80,737,212 459 $20,956,857
Placer $5,413,814 32 $1,240,088
Plumas $489,747 2 $60,970
Riverside $88,903,821 525 $19,710,438
Sacramento $48,938,242 292 $12,228,251
San Benito $1,414,381 6 $194,911
San Bernardino $103,004,912 654 $24,885,567
San Diego $96,249,154 570 $24,144,451
San Francisco $14,644,501 69 $3,703,241
San Joaquin $27,718,291 180 $6,643,914
San Luis Obispo $5,289,225 33 $1,156,821
San Mateo $9,749,862 48 $2,412,611
Santa Barbara $11,084,763 67 $2,692,652
Santa Clara $28,910,506 141 $7,131,984
Santa Cruz $7,308,164 43 $1,694,004

new america foundation page 24
COUNTY Foregone Sales
(Economic Output)
Foregone
Jobs
Foregone
Wages
Shasta $6,328,575 44 $1,512,650
Sierra $110,885 0 $7,049
Siskiyou $1,427,573 8 $246,800
Solano $10,536,445 63 $2,339,820
Sonoma $8,543,750 54 $2,170,379
Stanislaus $20,330,353 134 $4,753,087
Sutter $3,470,214 21 $699,469
Tehama $2,306,530 12 $375,690
Trinity $328,656 1 $35,632
Tulare $33,100,800 183 $6,052,569
Tuolumne $1,310,870 8 $251,382
Ventura $21,942,085 128 $5,199,439
Yolo $4,418,979 24 $930,583
Yuba $2,674,346 12 $404,774
CALIFORNIA $1,399,252,653 8,226 $342,313,236
CITY
Los Angeles $165,011,156 1,000 $45,194,178
Fresno $34,519,700 238 $8,480,309
Modesto $10,421,339 69 $2,436,433
Oakland $15,587,865 87 $4,176,327
San Bernardino $18,942,603 120 $4,576,456
San Diego $42,080,130 249 $10,555,954
SOURCE: Internal Revenue Service (IRS), IMPLAN and authors’ calculations
Table 11: Statewide Estimated Foregone Economic Impact of the EITC, 2009
Scenario Unclaimed EITC
Payments
80% Spent
Locally
Foregone
Economic Output
Foregone
Employment
Foregone
Labor Income
CONSERVATIVE $1,241,275,167 $993,020,134 $1,399,252,653 8,226 $342,313,236
LESS CONSERVATIVE $1,296,574,154 $1,037,259,323 $1,458,657,289 8,575 $356,845,989
SOURCE: Internal Revenue Service (IRS), IMPLAN and authors’ calculations
new america foundation page 25
Concluding Remarks
The federal EITC program represents an important source of
revenue for state and local governments and economies, as
well as for the working families who receive EITC payments.
For a variety of reasons, many eligible families within
California fail to claim these credits.
Efforts that successfully close the gap between potential EITC
payments and actual EITC payments would help reduce
poverty, increase labor force participation rates and provide a
substantial injection of resources into the California’s revenue
stream.
Using conservative data and assumptions, this report estimates
that state residents fail to claim over $1.1 billion annually in
EITC payments for which they are eligible. If these payments
were claimed, economic activity resulting from the payments
would support an additional 7,500 jobs and create more than
$300 million in new labor income each year. These foregone
payments, if claimed, would also generate more than $88
million in additional tax revenue for state and local
governments.
There are reasons to believe that these numbers understate the
current impact of these foregone payments. Using simple
assumptions based on the historical relationship between EITC
participation and unemployment, it is likely that the current
impact of state under-participation in the EITC is 10-15%
higher than the 2006 estimates featured in this report.
California and its residents lose out on a great deal of
resources by not fully taking advantage of the federal EITC
program.
The eligible residents lose out on money to which they are
entitled by the Internal Revenue Code. Also, other state
beneficiaries lose when that money is not spent and re-
circulated throughout the California economy. Using
conservative estimates, the California economy would have
created $1.4 billion in new output and almost more than 8,000
new jobs in 2009 alone if the EITC were fully utilized.
new america foundation page 26
Appendix I
Methodology and Data Requirements used to
calculate the economic impact: The Multiplier
Analysis
The analysis mainly relies on the use of input-output models
and associated databases, which are techniques for quantifying
interactions among firms, industries, and social institutions
within a regional economy. IO models are the standard
techniques that regional economists use to conduct economic
impact analysis. In particular, the study makes extensive use
of IMPLAN, a computer software package produced by the
Minnesota IMPLAN Group, Inc. and used widely around the
world.17 IMPLAN allows users to build economic models to
estimate the impacts of economic changes in their states,
counties or communities.
The total economic impact (also known as the multiplier
effect) of the EITC is equal to the sum of three components:
the direct effect, the indirect effect and the induced effect. The
direct effect is the immediate upshot caused by residents when
they spend their EITC payments. Due to the interactions
between firms, industries, and social institutions that naturally
occur within the regional and state economy, the direct effect
initiates a series of iterative rounds of income creation,
spending and re-spending that result in indirect and induced
effects. The indirect effects are changes in production,
employment and income that result from the inter-industry
purchases triggered by the direct effect. Finally, induced
effects arise due to changes in household income and spending
patterns caused by direct and indirect effects. Since the total
impact of the EITC payments that are spent within the
regional economy is a multiple of the initial expenditures, the
total effect is expressed as a multiplier effect. Therefore, the
total impact of the EITC payments spent within the regional
and state economy as estimated by IMPLAN is larger than the
initial expenditures.
The increases in economic activity resulting from the
multiplier process become smaller with each round due to
leakages from the spending stream. Furthermore, spending on
goods and services that are not produced within the regional
economy do not generate additional regional spending.
Therefore, the multiplier process traces the flows of spending
and re-spending until the initial expenditures have completely
leaked out to other regions. To properly estimate the effects at
the regional level, an adjustment known as the regional
purchase coefficient is implemented within the IMPLAN
system.
Successfully assessing the economic impact of the EITC in a
region depends on two basic sets of data. First, the IMPLAN
data comprises the input-output table of the regional economy
of the impact region, in this case California, its 58 counties
and selected cities. This data was purchased from IMPLAN
Group, Inc. and was used to trace the impact of EITC
payments. Second, individual income tax data by zip code is
produced by the Internal Revenue Service (IRS) for the state.
This data was purchased and was used to calculate the EITC
payments received as well as unclaimed EITC payments by
state residents.
Appendix II
Additional assumptions about the economic
multiplier analysis used to calculate the economic
impact of the EITC
The calculation of the economic impact understates the
potential impact of the EITC on low-income families in
California for two reasons: (1) not all eligible taxpayers claim
the credit; and (2) not all taxpayers claiming the EITC credit
get the entire amount for which they are eligible (mainly
because they use the services of a professional tax preparer,
sometimes for a very high fee). Nevertheless, for reasons
outlined in the introduction, this report focuses on the loss of
EITC payments to the state economy resulting from eligible
families’ failure to claim the credit.
An additional issue when calculating the economic impact of
the EITC program is that not all taxpayers who claim the
EITC are technically eligible to receive the credit. In other
words, there are a number of individuals that claim and
new america foundation page 27
receive the credit but do not meet all of the eligibility
requirements. The “error rate” of ineligible EITC claimants is,
according to IRS calculations for the tax year 1999, between
27% and 32% of EITC claims nationwide.18 Some researchers
have argued that the IRS study has significant methodological
shortcomings that likely result in an overstatement of the error
rate.19 Even if the error rate of the program was accurately
known, it would probably be inaccurate to assume that such
error rate applied to every county in California.20
Importantly, this study employs IRS data reporting the actual
dollars received as EITC credits in California. Although some
of these funds were surely obtained by error or fraud, the fact
is that they made it to California and produced an economic
impact. Assuming the IRS audits and catches some ineligible
claimants, and assuming further that corrected returns and
penalties are assessed, the re-payment of any ill-gotten EITC
payment would occur years after the funds were injected into
the state’s economy, producing an economic impact. A
completely accurate picture of the economic impact would
include a lagged leakage of the amount later collected by the
IRS. Given low audit rates and the likelihood that the
perpetrators will be unable to repay or will have left
California, this leakage is likely to be very small relative to the
initial payment.
About the authors
Dr. Antonio Avalos received his Ph.D. in Economics from
Oklahoma State University with specialization in Economic
Development and International Economics. He received his
B.S. and M.S. degrees from the Universidad Popular
Autónoma del Estado de Puebla and Oklahoma State
University, respectively. Dr. Avalos has spent several years
conducting research on regional economics and workforce
issues as well as on economic impact analysis. He started as
Herman Kahn Fellow at the Hudson Institute in Indianapolis,
Indiana and later as an external consultant for the institute. He
also was a visiting scholar at the Andean Corporation of
Development in Caracas, Venezuela, where he conducted
applied research in international trade, economic development
and labor markets in Latin American economies. Currently,
among other things, Dr. Avalos is investigating the dynamics
of labor markets in the Central Valley. Dr. Avalos’ main goals
are to identify the forces shaping the Central Valley's
economy, analyze the changes in work, the workplace,
compensation and occupations in recent decades and to build a
scenario for the Central Valley's workforce of the future.
Dr. Sean Alley holds a Ph.D. and M.A. in Economics from
Colorado State University, where he specialized in
environmental and natural resource economics and public
finance. He also received his A.B. degree in Economics from
the University of Georgia. Prior to joining California State
University, Fresno, Dr. Alley earned a J.D., magna cum laude,
from the George Mason University School of Law, where he
was a Levy Fellow in Law and Economics. Additionally, he
recently worked as a public finance attorney for a large law
firm in Charlotte, North Carolina. Dr. Alley has extensively
researched last year’s landmark stimulus legislation and has
participated in, published and presented research on corporate
governance law, the economics of collective action,
economics education, suburban economic development and
neighborhood transition. [email protected]
About the Center for Economic Research and
Education of Central California (CERECC).
The Center for Economic Research and Education of Central
California (CERECC) is an ancillary unit of the Department of
Economics at the California State University, Fresno. The
Center provides economic analysis for local business,
community groups, and policymakers, and provides
educational material to local educators. The mission of
CERECC is to integrate and utilize the expertise of
Department of Economics at the California State University,
Fresno, on a broader regional basis. The Center’s goal is to
enhance economic development in our region by pursuing a
two-pronged approach—economic research and economic
education. To realize this goal, the Center provides economic
research in issues relevant to Central California, and provides
extension services for local educators.
new america foundation page 28
About The New America Foundation
The New America Foundation, established in January 1999, is
a non-profit, post-partisan public policy institute whose
purpose is to bring exceptionally promising new voices and
new ideas to the fore of America’s public discourse. Believing
that neither side of the political divide is adequately
addressing the genuine challenges and opportunities of our
era, the New America Foundation seeks to reshape our public
debate by investing in outstanding individuals and ideas that
transcend the conventional political spectrum. The Asset
Building Program of the New America Foundation was
established in 2002 to significantly broaden savings and assets
ownership in America, thereby providing all Americans both
with the means to get ahead and with a direct stake in the
overall success of our economy.
Funding for this report provided by the California
Department of Community Services and Development
Notes
1 “The Earned Income Tax Credit at Age 30: What We Know,” Steve Holt, 2006, The Brookings Institute.
2 “A Hand Up: How State Earned Income Tax Credits Help Working Families Escape Poverty”, Nicholas Johnson, 2001, Center on
Budget and Policy Priorities.
3 “Policy Basics: The Earned Income Tax Credit”, 2009, Center on Budget and Policy Priorities.
4 “Using the EITC to Help Poor Families: New Evidence and a Comparison with the Minimum Wage”, David Neumark and William
Wascher, 2000, NBER Working Paper No. W7599.
5 See for example “Labor Supply Response to the Earned Income Tax Credit”, 1996, Nada Eissa and Jeffrey B. Liebman, The
Quarterly Journal of Economics 111(2): 605-637 and “Not Perfect but Still Pretty Good: The EITC and Other Policies to Support the
US Low-Wage Labor Market”, 2000, V. Joseph Hotz and John Karl Scholz, OECD Economic Studies No. 31.
6 Written Testimony of Mark Zandi, Chief Economist and Cofounder, Moody's Economy.com. Before the Committee on the Budget,
U.S. House of Representatives, "The Economic Outlook and Budget Challenges" January 27, 2009.
http://budget.house.gov/hearings/2009/01.27.2009_Zandi_Testimony.pdf.
7 “Using the Earned Income Tax Credit to Stimulate Local Economies”, Alan Berube, 2007, The Brookings Institute.
8 US General Accounting Office, 2001, “Earned Income Tax Credit Participation”, GAO-02-290R.
9 “Participation in the Earned Income Tax Credit Program For Tax Year 1996”, IRS - Small Business Self Employed Research, 2002,
Internal Revenue Service.
10 See “Another Year of Losses: High-Priced Refund Anticipation Loans Continue To Take a Chunk Out Of Americans’ Tax
Refunds”, 2006, Chi Chi Wu, National Consumer Law Center and “One Step Forward, One Step Back: Progress Seen in Efforts
Against High-Priced Refund Anticipation Loans, but Even More Abusive Products Introduced”, 2007, Chi Chi Wu, National
Consumer Law Center and Jean Ann Fox, Consumer Federation of America.
11 “Participation in the Earned Income Tax Credit Program For Tax Year 1996”, IRS - Small Business Self Employed Research,
2002, Internal Revenue Service.
12 US General Accounting Office, 2001, “Earned Income Tax Credit Participation”, GAO-02-290R.
13 “Analysis of GAO Study of EITC Eligibility and Participation”, Leonard E. Burman and Deborah Kobes, 2002, Urban Institute.
14 “Participation in the Earned Income Tax Credit Program For Tax Year 1996”, IRS - Small Business Self Employed Research,
2002, Internal Revenue Service.
new america foundation page 29
15 See for example “EITC Interactive: User Guide and Data Dictionary”, Alan Berube, The Brookings Institution,
http://www.brookings.edu/metro/EITC/EITC-Data.aspx [accessed February 2010].
16 The Jacob France Institute of the University of Baltimore in its 2004 study “The Importance of the Earned Income Tax Credit and
Its Economic Effects in Baltimore City” assumes that two-thirds of the payments made to city residents were re-spent within the City.
Similarly, John Haskell at Vanderbilt University in his 2006 study “The State of the Earned Income Tax Credit in Nashville: An
Analysis of Economic Impacts and Geographic Distribution of the ‘Working Poor’ Tax Credit, TY 1997-2004” assumes that 87% of
the EITC disbursements would be spent within the Nashville region.
17 Minnesota IMPLAN Group, Inc. was founded in 1993 by Scott Lindall and Doug Olson as an outgrowth of their work at the
University of Minnesota starting in 1984. This developmental work closely involved the U.S. Forest Service's Land Management
Planning Unit in Fort Collins and Dr. Wilbur Maki at the University of Minnesota. Currently, there are over 1,500 active users of
IMPLAN databases and software globally.
18 Internal Revenue Service, “Compliance Estimates for Earned Income Tax Credit Claimed on 1999 Returns”, 2002.
http://www.irs.gov/pub/irs-soi/compeitc.pdf [accessed February 2010]
19 “What is the Magnitude of EITC Overpayments?”, Robert Greenstein, 2003, Center on Budget and Policy Priorities.
http://www.cbpp.org/archiveSite/5-20-03eitc3.pdf [accessed February 2010]
20 “Earned Income Credit Participation—What We (Don’t) Know”, Alan Berube, 2007, The Brookings Institute.
http://www.brookings.edu/metro/eitcparticipation.pdf [accessed February 2010]
© 2010 New America Foundation
This report carries a Creative Commons license, which permits re-use of New America content when proper attribution is provided. This means you
are free to copy, display and distribute New America’s work, or include our content in derivative works, under the following conditions:
Attribution. You must clearly attribute the work to the New America Foundation, and provide a link back to www.Newamerica.net.
Noncommercial. You may not use this work for commercial purposes without explicit prior permission from New America.
Share Alike. If you alter, transform, or build upon this work, you may distribute the resulting work only under a license identical to this one.
For the full legal code of this Creative Commons license, please visit www.creativecommons.org. If you have any questions about citing or reusing
New America content, please contact us.