lee county, florida shore protection project …
TRANSCRIPT

LEE COUNTY, FLORIDA
SHORE PROTECTION PROJECT
GASPARILLA ISLAND SEGMENT
2019 BEACH RENOURISHMENT
YEAR 1 POST-CONSTRUCTION MONITORING REPORT
December 2020
U.S. ARMY CORPS OF ENGINEERS JACKSONVILLE DISTRICT

ii
(THIS PAGE INTENTIONALLY LEFT BLANK)

iii
Contents 1) Introduction .............................................................................................................................................. 1
1.1) Authority ............................................................................................................................................ 1
1.2) Purpose and Scope ............................................................................................................................ 1
1.3) Authorized Project Description .......................................................................................................... 1
2) Project History .......................................................................................................................................... 2
2.1) Summary of Previous Monitoring Cycle ............................................................................................ 3
2.2) Summary of 2019 Nourishment ........................................................................................................ 5
3) Project Monitoring Requirements ............................................................................................................ 8
3.1) Beach Profile Surveys ......................................................................................................................... 8
3.2) Borrow Area Surveys ....................................................................................................................... 11
3.3) Data and Report Submission ........................................................................................................... 11
4) Project Monitoring Data ......................................................................................................................... 12
4.1) Tidal Datums .................................................................................................................................... 12
4.2) Monitoring Surveys .......................................................................................................................... 12
4.2.1) 2019 Pre- and Post-Construction Monitoring Surveys ............................................................. 13
4.2.2) 2020 Year 1 Monitoring Surveys ............................................................................................... 13
5) Survey Analysis ....................................................................................................................................... 13
5.1) Wave Conditions .............................................................................................................................. 14
5.2) Overview of Littoral Processes ........................................................................................................ 16
5.3) Mean High Water Position Change Analysis .................................................................................... 17
5.3.1) Pre-Construction to Post-Construction MHW Position Change Analysis ................................. 17
5.3.2) Post-Construction to Year 1 Monitoring MHW Position Change Analysis ............................... 18
5.4) Volume Change Analysis .................................................................................................................. 24
5.4.1) Pre-Construction to Post-Construction Volume Change Analysis ............................................ 27
5.4.2) Post-Construction to Year 1 Monitoring Volume Change Analysis .......................................... 29
5.5) Borrow Area Survey Analysis ........................................................................................................... 32
5.5.1) Pre-Construction to Post-Construction Borrow Area Analysis ................................................. 34
5.5.2) Post-Construction to Year 1 Monitoring Borrow Area Analysis ............................................... 35
6) Summary ................................................................................................................................................. 36
7) References .............................................................................................................................................. 38

iv
Figures Figure 1: Lee County Gasparilla Island Shore Protection Project Map ......................................................... 5 Figure 2: Typical profile and beach fill template for the federal project ...................................................... 7 Figure 3: Typical profile and beach fill template for southern betterment project ..................................... 7 Figure 4: Aerial Image of Gasparila Island FDEP R-Monuments R-5 to R-14 ................................................ 9 Figure 5: Aerial Image of Gasparila Island FDEP R-Monuments R-15 to R-26A .......................................... 10 Figure 6: Wave Heights in Gulf of Mexico from November 2018 to November 2020 ............................... 14 Figure 7: CDIP Buoy Locations .................................................................................................................... 15 Figure 8: Hurricane Tracks from 2018 to 2020 within 200 nm of Gasparilla Island ................................... 16 Figure 9: MHW Position Change ................................................................................................................. 18 Figure 10: MHW Position from February 2019 to September 2020 from R-10 to R-13 ............................. 20 Figure 11: MHW Position from February 2019 to September 2020 from R-13 to R-17 ............................. 21 Figure 12: MHW Position from February 2019 to September 2020 from R-17 to R-21 ............................. 22 Figure 13: MHW Position from February 2019 to September 2020 from R-21 to R-26 ............................. 23 Figure 14: Volumetric Change from Dune To -13 Ft NAVD88 in the Beach Fill Area .................................. 24 Figure 15: Elevation Change from Pre to Post-Construction Surveys ......................................................... 28 Figure 16: Elevation Changes between Post-Construction and Year 1 Monitoring Surveys ...................... 30 Figure 17: Pre-Construction Borrow Area Depths (Survey 18-256, December 2018) ................................ 32 Figure 18: Post-construction Borrow Area Depths (Survey 19-247, August 2019) .................................... 33 Figure 19: Year 1 Monitoring Borrow Area Depths (Survey 20-244, October 2020) .................................. 33 Figure 20: Borrow Area Pre To Post-Construction Bathmetry Change ....................................................... 34 Figure 21: Borrow Area Post-Construction to Year 1 Monitoring Bathmetry Change ............................... 35
Tables Table 1: Nourishment History of Lee County SPP, Gasparilla Island Segment ............................................. 2 Table 2: Mean High Water Position Change from May 2013 to February 2019........................................... 3 Table 3: Volume Change Between 2013 Nourishment and 2019 Pre-Construction Survey......................... 4 Table 4: FDEP Monument Controls ............................................................................................................... 8 Table 5: Tidal Datums for the Lee County SPP, Gasparilla Island Segment (VDatum at R-17) ................... 12 Table 6: Summary of Monitoring Surveys ................................................................................................... 12 Table 7: Mean High Water Position Change ............................................................................................... 19 Table 8: Volumetric Change – February 2019 to October 2019 ................................................................. 25 Table 9: Volumetric Change – October 2019 to September 2020 .............................................................. 26 Table 10: Percentage of Volume Remaining from October 2019 to September 2020 above DOC ............ 31
Appendices Appendix A: Beach Profile Surveys

1
1) Introduction This report presents the results of the Year 1 Post-Construction Monitoring of the 2019 nourishment of Gasparilla Island, which is part of the Lee County Shore Protection Project (SPP). This report analyzes the field data and investigates the performance of the 2019 nourishment. This report was prepared under the provisions of Florida Department of Environmental Protection (FDEP) Joint Coastal Permit (JCP) No. 0174403-013-JC and the Physical Monitoring Plan dated June 2018.
1.1) Authority The Lee County, Florida, Beach Erosion Control Project was authorized under Section 201 of the Flood Control Act of 1965 (79 Stat. 1073) and approved by Senate Committee Resolution dated December 17, 1970, and House Committee Resolution dated December 15, 1970. This authority was later amended by Section 131 of the Water Resource Development Act of 1976 (WRDA 1976) which raised the $10 Million dollar project limit to $15 Million.
The project was subsequently modified by section 309 of WRDA 2000 to authorize the Secretary to enter into an agreement with the non-Federal interest to carry out the project in accordance with section 206 of the Water Resources Development Act of 1992 (33 U.S.C. 426i–1) if the Secretary determines that the project is technically sound, environmentally acceptable, and economically justified. Such authority is in accordance with Section 206 of WRDA 1992, allowing for non-federal interests to design and construct the authorized project and for reimbursement of the Federal share of the cost.
The 2018 Final Integrated Section 934 Report and Environmental Assessment, which was approved in 2020, determined that the authorized project is still economically justified and developed an optimization of the project nourishment plan. The Section 934 Report extended the Federal participation of the project to 2056.
1.2) Purpose and Scope The purpose of this monitoring report is to evaluate the performance of the most recent nourishment of Gasparilla Island. This report presents volumetric and shoreline position change analyses of the fill areas and adjacent shoreline based upon pre- and post-construction surveys. An analysis and survey of the Boca Grande Ebb Shoal borrow area was also performed. This monitoring report presents the results of the year 1 monitoring survey (September 2020) compared to the post-construction monitoring survey (completed in October 2019) and the pre-construction survey (February 2019). Additionally, this report summarizes the results of the previous monitoring cycle (from the 2013 construction event) to evaluate the project performance during this time period (2013-2019).
1.3) Authorized Project Description The authorized project for the Lee County, Gasparilla Island Shore Protection Project includes a protective beach berm along 2.8 miles of Gulf coastline extending from 14th Street West south to the revetment built in front of the Boca Bay Pass Club Corporation building, just north of the Boca Grande Pass. The primary purpose of the project is to reduce the risk of damage to upland property from storm-induced erosion and flooding. The non-federal sponsor for the project is Lee County.

2
The Section 934 Report recommended plan consist as a 20-foot extension of the project baseline (the 1995 Mean High Water (MHW) line) at 5 ft Mean Low Water (MLW) (3.75 ft NAVD88). It also included foreshore slopes of 1V:15H and a nearshore slope of 1V:25H extending out to the existing bottom. The renourishment interval for the project is 22 years and the Boca Grande ebb shoal is to be used as the borrow source for future nourishments.
2) Project History The local non-federal sponsor (Lee County) completed initial construction of the project in April 2007 under authority provided in Section 206 of the Water Resources Development Act of 1992 (WRDA92). In January 2000 Lee County, under a cost-share agreement with the Florida Department of Environmental Protection (FDEP), initiated engineering design and permitting for this initial construction on a reimbursement basis with the Federal Government under Section 206 Authority. The final design included a segmented breakwater located approximately 325 ft offshore of R-25; two T-head groins in the vicinity of R-26, and restoration from R-11 to R-24 using approximately 920,000 cubic yards of sand from an offshore borrow area. The design template consisted of a 20 ft berm at elevation of +5 ft MLW with a foreshore slope of 1V:15H transitioning to a nearshore slope of 1V:25H at MLW extending out to the intersection with the existing profile. Since its initial construction Gasparilla Island has been nourished two additional times including the 2019 nourishment, as seen in Table 1.
Table 1: Nourishment History of Lee County SPP, Gasparilla Island Segment
Date Complete Project Type Volume (cy) Source Project Location
April 2007 Local/USACE Reimbursement 1,072,781 Boca Grande Ebb Shoal R-10 to R-26
December 2013 FCCE/Cost Share 79,250/378,000 Boca Grande Ebb Shoal R-10 to R-24.5
June 2019 FCCE 141,972 Boca Grande Ebb Shoal R-32 to R-36 June 2019 Local 139,666 Boca Grande Ebb Shoal R-31 to R-36.5
A General Reevaluation Report (GRR) was approved in 2001 with an April 2008 Addendum which updated the cost-sharing percentages from 58.7% federal and 41.3% non-federal to 54.4% federal and 45.6% non-federal. The source of material for the 2007 construction of the Lee County, Gasparilla Island Segment project was the offshore borrow area located one mile southwest of the southern end of Gasparilla Island. The structures were scheduled for construction in 2010, but have not been constructed. The project included construction of 0.9 acres of artificial reef offshore of R-11 to mitigate for adverse impacts to nearshore hardbottom which was completed before initial construction.
Completion of a Rehabilitation Effort for the Lee County Hurricane and Storm Damage Reduction Project Gasparilla Island Segment Project Information Report (PIR, February 2013) for impacts sustained by Tropical Storm Debby (June 2012) resulted in a positive request for Flood Control and Coastal Emergencies (FCCE) and CG funds. A nourishment was completed in 2013 in order to repair the beach following the storm. During the nourishment, the contractor placed 457,834 cy of material. The FCCE program paid for 79,250 cy of material, while the additional 378,034 cy was paid through cost share with the non-federal sponsor.

3
2.1) Summary of Previous Monitoring Cycle The previous monitoring cycle began with the post-construction profiles from the 2013 nourishment event and concludes with the pre-construction survey from the 2019 nourishment. During this time period, conditions were generally calm when considering tropical systems in the Gulf of Mexico with the exception of Hurricane Irma in 2017, which resulted in approximately 52,000 cy of erosion. Other notable tropical systems in this period were Hurricane Hermine and Tropical Storm Colin, both in 2016.
At the time of the Fifth Annual Post-Construction Monitoring Report from the 2013 construction event, in October 2018 (related survey taken August 2018), the project was performing as expected, even when factoring in the impacts from Hurricane Irma, with an average erosion rate of 52,600 cy/yr. This is significantly less than what was anticipated in the 2001 GRR (77,500 cy/yr) but significantly more than the 28,000 cy/yr erosion rate anticipated in the 2018 Lee County, Florida, Shore Protection Project, Gasparilla Island Segment, Final Integrated Section 934 Report and Environmental Assessment (USACE, 2018a).
Between the August 2018 survey and the pre-construction survey in February 2019, the project area experienced significant amounts of erosion (159,000 cy). Erosion during winter months is a typical pattern observed on Florida beaches as the waves become typically rougher during this time period, especially during winter storms. Table 2 shows the MHW position over time and Table 3 shows the condition of the project area in February 2019 compared to the last nourishment event in 2013. The project area from R-10 to R-24 has retained approximately 29% of the monitoring volume change recorded from the 2013 nourishment. The majority of this volume is concentrated in the middle part of this project, between R-15 and R-22. This portion of the project is typically the healthiest portion of the beach. The net transport within the project area is to the south which helps feed the southern portion of the project as material erodes from the northern part. The northern portion of the project from R-10 to R-15 has a series of seawalls that protrude from the shoreline, causing exacerbated erosion in the north and feeding the downdrift area immediately to the south.
Table 2: Mean High Water Position Change from May 2013 to February 2019
FDEPR-Monument
May2013-Feb2014
Feb2014-Jul2015
Jul2015-Jun2016
Jun2016-Jul2017
Jul2017-Aug2018
Aug2018-Feb2019
May2013-Feb2019
Percent Remaining Feb
2014 to Feb 201910 35.0 -7.1 1.0 0.4 1.9 2.2 33.3 95%11 72.1 -26.3 -15.1 -1.3 -8.2 -7.3 13.9 19%12 86.5 -26.0 -25.5 -7.4 -2.8 -1.5 23.4 27%13 91.6 -35.2 -25.3 -3.7 -3.0 13.6 38.1 42%14 105.5 -47.4 -23.0 -17.1 -0.8 -3.5 13.7 13%15 106.0 -26.8 -16.8 -3.7 -29.1 0.7 30.3 29%16 87.8 -5.2 -30.1 -34.9 3.8 -7.3 14.1 16%17 95.3 -12.0 -30.0 -8.8 -5.0 -4.0 35.5 37%18 106.2 -20.1 -37.5 -3.1 -6.3 0.9 40.0 38%19 141.1 -30.8 -23.7 -21.0 0.8 -6.3 60.2 43%20 147.0 -24.8 -7.5 -11.3 -9.7 -9.2 84.5 57%21 157.5 -20.0 -14.2 -2.3 -33.3 -3.3 84.3 54%22 133.0 -4.0 -3.2 -1.4 -30.6 -1.3 92.6 70%23 83.7 21.1 -5.5 5.9 -40.7 0.8 65.3 78%24 55.9 7.4 -0.6 -26.2 -21.5 -20.9 -5.7 0%
AVG 100.3 -17.2 -17.1 -9.1 -12.3 -3.1 41.6 41%
80-100% 60-79% 40-59% 20-39% 0-19%Percent Remaining

4
Table 3: Volume Change Between 2013 Nourishment and 2019 Pre-Construction Survey
2013-2014 Construction
FDEP R-Mon Dist Btw R-Mon (feet) Volume Change (cy) Volume Remaining (cy) Percent Remaining10
1,521 28,263 15,826 56%11
1,195 30,728 10,595 34%12
936 30,896 -8,356 0%13
1,085 40,011 -13,977 0%14
1,000 50,812 -688 0%15
1,133 46,849 21,331 46%16
1,015 38,281 18,916 49%17
1,073 38,417 23,518 61%18
915 40,666 16,945 42%19
1,085 41,970 27,985 67%20
766 39,418 33,456 85%21
1,082 36,060 24,050 67%22
961 29,057 7,360 25%23
547 15,021 -20,317 0%24
738 4,075 -8,764 0%24.5
Average 1,003 34,035 9,859Total 15,052 510,524 147,880 29%
80-100% 60-79% 40-59% 20-39% 0-19%
2014 (Post-Construction) - February 2019
Percent Remaining

5
2.2) Summary of 2019 Nourishment The subject of this monitoring report is the 2019 nourishment of the Lee County, Gasparilla Island Segment SPP. The federal portion of the project was constructed from 4 June 2019 until 12 June 2019 and the non-federal portion of the project was completed between 14 and 19 June 2019. This renourishment was performed to repair damages to the federal project as a result of Hurricane Irma, which impacted Florida from 10 to 12 September 2017. The 2017 Project Information Report (PIR) to assess the damage caused by Hurricane Irma recommended placement of 161,000 cy to restore the full construction template from the project taper at R-10.5 to R-24.5. The 2019 renourishment was originally intended to restore the entire federal project length (R-10.5 to R-24) but the fill density for this length was less than the minimum preferred fill density of 15 cy per linear foot, whereby reduced hydraulic dredge efficiencies can impact production costs. The renourishment length was modified to only include the northern part of the project (R-10.5 to R-16.5) because the majority of the erosion for the SPP was located in this portion of the project. The project was modified once more when the erosion volume between design and construction was higher than anticipated. The recommended renourishment volume of 161,000 cy included 18,300 cy of anticipated erosion between design and construction. However, the actual erosion volume within the construction template between August 2018 and February 2019 was 20,500 cy. In response to the higher erosion the placement area was shortened to R-10.5 to R-15.5, as seen in Figure 1, to not exceed the volume limitation of 161,000 cy (from the 2017 PIR), while still maintaining the minimum fill density of 15 cy/lf. The Federal Government paid for the projected total volume of 161,000 cy at no cost to the local sponsor under FCCE funding.
Figure 1: Lee County Gasparilla Island Shore Protection Project Map

6
In addition to the federal project, the local sponsor funded the additional placement of sand at the southern tip of Gasparilla Island (R-24 to R-26.5) as part of a local sponsor betterment project. The sponsor had a limiting volume of 159,000 cy for the southern betterment project but the projected construction volume was only 127,000 cy. The volume costs for the southern betterment project was paid entirely by the non-federal sponsor. The total cost of the project was $7,084,258, of which $4,270,934 was paid by the Federal Government and $2,813,324 was paid by the non-federal sponsor. The Boca Grande Pass ebb shoal was the borrow area used for both the federal and non-federal portions of the nourishment.
Figure 2 shows a typical construction template as used in the 2019 nourishment. The Lee County SPP authorization requires the construction and maintenance of a specific design template in order to reduce damages due to storm-induced erosion along the project length. The construction template includes a 90-ft wide berm at an elevation of +3.8 ft North American Vertical Datum of 1988 (NAVD88), sloping at 1V:90H to +2.8 ft NAVD88 and then sloping down to existing bottom at a 1V:10H slope between monuments R-10.5 to R-15.5 (including tapers). This design is similar to the one used during the 2013 nourishment event but differs from the original project design. The original project design included a flat berm but the sloped-berm was added to the 2013 nourishment in order to reduce a high magnitude of backwash. The sloped-berm also has the benefit of being more resistant to escarpment formation than traditional, flat berms. The sloped-berm used during the 2013 nourishment reduced scarping compared to the 2007 construction and, as a result, was used again during the 2019 nourishment for both the federal and non-federal projects.
Figure 3 shows a typical construction template used in the southern betterment project for the 2019 nourishment between R-24 to R-26.5. The construction template includes the construction of a landward berm crest (width varies) at elevation +3.8 ft NAVD88 and then a 48-ft wide sloped berm crest with a 1V:60H slope down to +3.0 ft NAVD88. The template then slopes down to existing bottom at a 1V:10H slope.
The final volume placed according to contract payment during the 2019 Lee County, Gasparilla Segment SPP renourishment was 281,638 cy (141,972 cy in the federal placement area and 139,666 cy in the non-federal area) based on the acceptance section surveys, which are performed separately from the pre- and post- fill monitoring surveys. Acceptance section surveys are taken over short reaches of shoreline as the project progresses. As such, they are taken shortly after each section of fill is completed and do not typically reflect equilibration of material due to erosion or profile adjustment. The elapsed time between the pre- and post-construction FDEP profile monitoring surveys is typically much longer, in this case approximately 7 months (February 2019 to August 2019). During this time the project equilibrates to some degree following fill placement (i.e. constructed slopes evolve to foreshore slopes that are more representative of the pre-project beach). Also, since the entire length of the project is surveyed at the same time, these FDEP monitoring surveys give a better “snapshot” of the overall project condition.

7
Figure 2: Typical profile and beach fill template for the federal project
Figure 3: Typical profile and beach fill template for southern betterment project

8
3) Project Monitoring Requirements The 2019 construction of the Gasparilla Island Segment of the Lee County SPP was conducted under JCP No. 0174403-013-JC. A county-wide Physical Monitoring Plan (PMP) was created in 2018 and governs the monitoring requirements associated with this construction event. The PMP components include beach and offshore surveys, offshore borrow area surveys, data analysis, and report preparation.
3.1) Beach Profile Surveys Topographic and bathymetric profile surveys of the beach and offshore are required to be conducted within 90 days prior to commencement of construction of a beach nourishment event, within 60 days following the completion of construction, and biennially thereafter until the next nourishment event or the expiration of the project design life. The pre- and post-construction surveys must include profile surveys at each FDEP DNR reference monument within the bounds of the beach fill area and must also include additional monuments within at least 5,000 ft of adjacent shoreline on both sides of the fill area. Note that the profiles are designated as “DNR” monuments since they were originally placed by Florida’s Department of Natural Resources, which preceded the FDEP. The range monuments (abbreviated to “R-“ for convenience) are located approximately every 1,000 ft along the entire length of Lee County, as seen in Figure 4 and Figure 5. The FDEP monument control information for the R-monuments used for analysis within this report can be found in Table 4.
Table 4: FDEP Monument Controls
FDEP MONUMENT CONTROL (Feet NAVD83 / NAVD88) MON ID M. DATE NORTHING EASTING AZ M. ELEV.
R-5 OCT1981 888716.070 568769.309 250.0 6.86 R-6 JAN1974 887694.790 568894.099 260.0 6.80 R-7 JAN1974 886730.570 569095.309 260.0 6.20 R-8 JAN1974 885730.030 569206.999 260.0 7.43 R-9 OCT1981 884583.420 569523.279 260.0 4.59 R-10 OCT1981 883292.070 569550.789 265.0 5.87 R-11 MAR2001 881771.960 569616.069 265.0 9.99 R-12 JAN1974 880590.970 569796.669 265.0 9.07 R-13 OCT1981 879589.080 569841.269 270.0 9.22 R-14 OCT1981 878569.460 569872.489 265.0 9.05 R-15 MAY1997 877573.720 569900.179 265.0 8.20 R-16 COE1995 876471.620 570214.349 265.0 6.49 R-17 JAN1974 875461.590 570228.529 265.0 7.86 R-18 JAN1974 874397.560 570350.119 265.0 5.29 R-19 OCT1981 873468.070 570220.739 265.0 5.23 R-20 OCT1981 872400.560 570454.729 265.0 3.36 R-21 OCT1981 871531.060 570333.729 270.0 5.05 R-22 DEC1988 870446.630 570561.509 270.0 1.64 R-23 MAR2001 869578.290 570260.269 265.0 9.02 R-24 COE1995 868643.330 570239.049 270.0 5.54 R-25 MAR2001 867602.960 570012.049 279.0 9.20 R-26 DEC1988 866943.900 570632.219 230.0 4.55
R-26A DEC1988 866815.230 571200.399 186.0 7.12

9
Figure 4: Aerial Image of Gasparila Island FDEP R-Monuments R-5 to R-14

10
Figure 5: Aerial Image of Gasparila Island FDEP R-Monuments R-15 to R-26A

11
3.2) Borrow Area Surveys Bathymetric surveys of the borrow areas(s) located at inlet channels and shoals shall be conducted within 90 days prior to commencement of construction and again within 60 days following completion of construction of the project. Thereafter, monitoring surveys of the inlet borrow area(s) shall be surveyed concurrently with the monitoring beach and offshore surveys (USACE, 2018b). Survey grids lines across the borrow area shall be spaced 500 ft apart and shall extend a minimum of 500 ft beyond the boundaries. For borrow sites located in tidal inlet shoals, bathymetric surveys of the entire shoal complex, including any attachment bars, shall be conducted unless otherwise specified by the Department based upon the size of the shoal and the potential effects of the dredging on inlet processes. The borrow area surveys for this project are limited to the Boca Grande Ebb Shoal borrow area, which is located 1.2 miles southwest of the southern end of Gasparilla Island. The location of the borrow area can be seen in Figure 1.
3.3) Data and Report Submission The engineering analysis and monitoring report of the post-construction conditions off the project are to be digitally submitted to the FDEP within 90 days following completion of construction and each biennial monitoring survey. The report shall summarize and discuss the data, the performance of the beach fill project, and identify erosion and accretion patterns within the monitored area. Results shall be analyzed for patterns, trends, or changes between annual surveys and cumulatively since project construction. In addition, the report shall include a comparative review of project performance to performance expectations and identification of adverse effects attributable to the project. The report shall specifically include:
1. A record of the volume and location of all beach fill or inlet sand bypassing material placed within the project area;
2. The volume and percentage of advance nourishment lost since the last beach nourishment project as measured landward of the MHW line of the most recent survey;
3. The most recent MHW shoreline position (feet) in comparison with the design profile at each individual monument location;
4. The MHW shoreline position changes (feet) relative to the pre-construction survey at each individual monument location for all the monitoring periods;
5. The total measured remaining volume (cubic yards) in comparison with the total predicted remaining volume (cubic yards) above the MHW line and above the Depth of Closure for the entire project area over successive monitoring periods;
6. Other shoreline position and volumetric analyses the Permittee or engineer deem useful in assessing, with quantitative measurements, the performance of the project; and,
7. The volume and distribution of infilling of the inlet borrow area(s) and changes of the inlet channels and shoals.1
The report shall include computations, tables and graphic illustrations of volumetric and shoreline position changes for the monitoring area. An appendix shall include superimposed plots of the two most recent beach profile surveys, the design profile, and pre- and post-construction beach profile at each individual monument location (USACE, 2018b). In the case of this monitoring report, these datasets include the pre- and post-construction beach profile surveys for Gasparilla Island (R-5 to R-26A) and surveys of the Boca Grande Ebb Shoal borrow area.
1 This requirement is not mentioned in the permit requirements but is included in the 2018 PMP.

12
4) Project Monitoring Data The project monitoring data for the 2019 nourishment of Gasparilla Island consists of topographic and bathymetric profile surveys of the beach along with surveys of the Boca Grande Ebb Shoal Borrow Area.
4.1) Tidal Datums To evaluate the monitoring surveys with reference to a tidal datum such as MHW, the geodetic datum North American Vertical Datum (NAVD88) must be related to the tidal datum in the project area. The nearest tidal datum in the project area is Port Boca Grande, Station No.8725577 available from NOAA. This gauge is located in Charlotte Harbor on the east side of Gasparilla Island just inside the Boca Grande Pass. Due to tidal compression, this gauge is not representative of the tide range that occurs on the Gulf side of Gasparilla Island where the project is located.
Instead the NOAA VDatum model was applied for three locations along the project, one at the northern end (R-10), the mid-point (R-17), and the final at the southern end (R-25). The results of the VDatum model at R-17 are shown in Table 5 referenced to Mean Lower Low Water (MLLW); VDatum is used for all conversions between NAVD88 and MHW for the survey analysis in this report. Mean High Water is 0.09 ft NAVD88 and Mean Low Water (MLW) is -1.24 ft NAVD88.
Table 5: Tidal Datums for the Lee County SPP, Gasparilla Island Segment (VDatum at R-17)
Datum Elevation (ft-MLLW) Mean Higher High Water (MHHW) 2.02 Mean High Water (MHW) 1.77 North American Vertical Datum of 1988(NAVD88) 1.68 Mean Sea Level (MSL) 1.12 National Geodetic Vertical Datum of 1929 (NGVD29) 0.54 Mean Low Water (MLW) 0.44 Mean Lower Low Water (MLLW) 0.00
4.2) Monitoring Surveys A summary of the surveys used for the beach and borrow area analyses in this report can be found in Table 6 and a description of the each survey can be found below.
Table 6: Summary of Monitoring Surveys
Survey Date Beach Profiles Borrow Area Pre-Construction Borrow Area Survey 18-256 28 December 2018 X Pre-Construction Survey 19-079 24 Jan. to 3 Feb. 2019 R-10 to R-26A Post-Construction Borrow Area Survey 19-247 6-8 August 2019 X Post-Construction Survey 19-236 15-16 October 2019 R-10 to R-26A Year 1 Borrow Area Survey 20-244 14 October 2020 X Year 1 Monitoring Survey 20-250 8-11 September 2020 R-5 to R-26A

13
4.2.1) 2019 Pre- and Post-Construction Monitoring Surveys Both the pre-construction monitoring survey and post-construction monitoring survey consist of beach profile transects surveyed along the Lee County SPP, Gasparilla Island Segment shoreline. Seaside Engineering and Surveying, LLC, performed the pre-construction monitoring survey (19-079) from 24 January 2019 to 3 February 2019. The monitoring survey extends from R-10 (North) to R-26A (South) with profiles spaced every 500 ft, at R-monuments and half monuments, and profile lengths of 3,000 ft. Hyatt Survey Services Inc. performed the post-construction monitoring survey (19-236) which consisted of 3,000 ft long profiles spaced every 500 ft, at R-monuments and half monuments from R-10 to R-26A. This survey was conducted from 15-16 October 2019. The Corps performed the pre-construction borrow area survey (18-256) on 28 December 2018 and the post-construction borrow area survey (19-247) from 6-8 August 2019.
4.2.2) 2020 Year 1 Monitoring Surveys The year 1 monitoring included beach and borrow area surveys. The beach surveys consisted of beach profile transects surveyed along the Lee County SPP, Gasparilla Island Segment shoreline. Park Coastal Surveying, LLC, performed the monitoring survey (20-250) from 8 to 11 September 2020. The monitoring surveys extend from R-5 in the north to R-26A in the south with profiles spaced every 1,000 ft, at FDEP range monuments (R-monuments), and profile lengths of 3,000 ft. The Corps performed the Year 1 Borrow Area Monitoring Survey (20-244) on 14 October 2020.
5) Survey Analysis The subject of the analysis found in this monitoring report is the change in condition of the beach and borrow area. The beach conditions include the difference in volume and MHW position between the pre-construction survey (19-079), post-construction survey (19-236), and Year 1 monitoring survey (20-250) between R-5 and R-26A. Individual beach profile surveys showing the pre-construction and post-construction surveys along with the authorized project template and construction template at each R-monument can be found in Appendix A. The borrow area analysis includes the difference of volume available in the borrow area between the pre-construction survey (18-256), the post-construction survey (19-247), and the Year 1 monitoring survey (20-244).
The first component of the survey analysis is the MHW position change over time at each R-monument. The MHW elevation is 0.09 ft NAVD88 based on the tidal datums at R-17, which is in the middle of the project area, at Gasparilla Island, FL. The MHW positions were measured from each plotted cross-sectional profile at each R-monument using Microstation by Bentley.
The second component is the volumetric change between the pre-construction and post-construction surveys. This change was calculated using Microstation Inroads software by Bentley. Inroads used Digital Terrain Model (DTM) files created from the topographic and hydrographic surveys to calculate the triangulated volumes from each survey. The volume difference between both surveys was calculated between each pair of R-monuments in the surveyed area. The unit volume change between each set of R-monuments was calculated by taking the volume difference and dividing it by the shoreline length between R-monuments. Volumetric change computations include the area extending in the cross-shore direction from the seaward most survey limit (20-250) to the local depth of closure (DOC) of -13 ft NAVD88. The -13 ft DOC is typically the outer limit of the zone of most active sediment transport. The DOC was determined using the Hallermeier Inner Simplified DOC equation and through observation of field surveys.
14
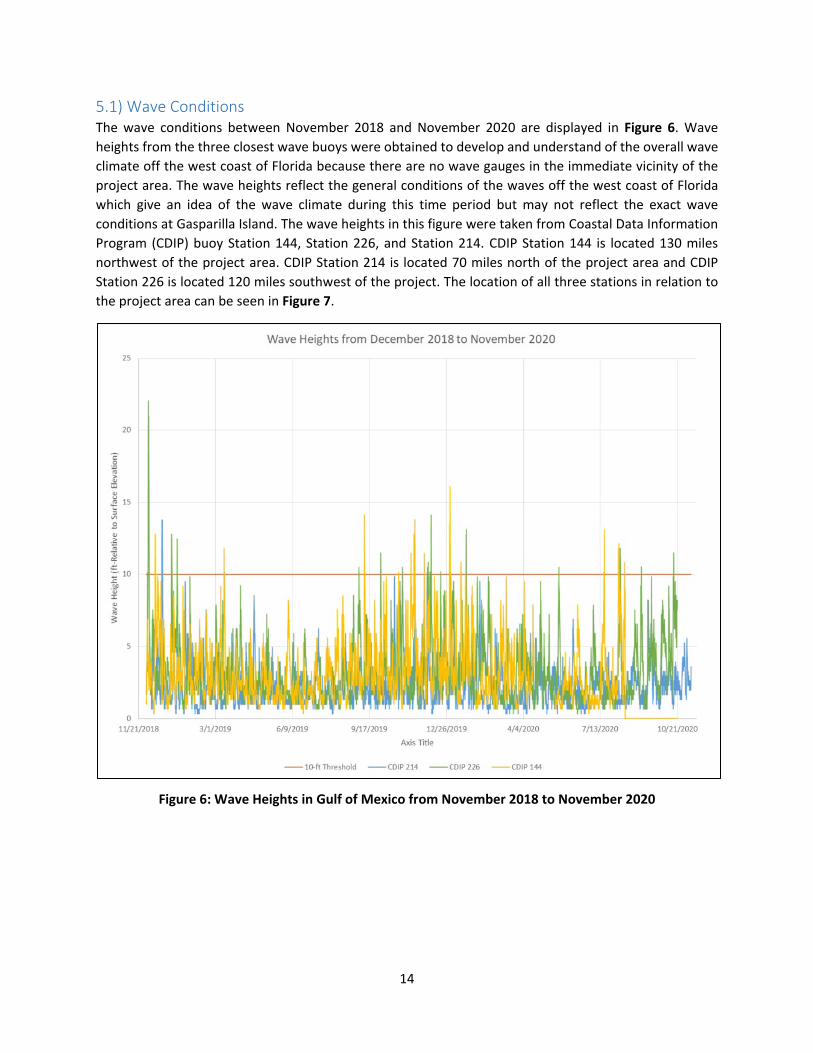
5.1) Wave Conditions The wave conditions between November 2018 and November 2020 are displayed in Figure 6. Wave heights from the three closest wave buoys were obtained to develop and understand of the overall wave climate off the west coast of Florida because there are no wave gauges in the immediate vicinity of the project area. The wave heights reflect the general conditions of the waves off the west coast of Florida which give an idea of the wave climate during this time period but may not reflect the exact wave conditions at Gasparilla Island. The wave heights in this figure were taken from Coastal Data Information Program (CDIP) buoy Station 144, Station 226, and Station 214. CDIP Station 144 is located 130 miles northwest of the project area. CDIP Station 214 is located 70 miles north of the project area and CDIP Station 226 is located 120 miles southwest of the project. The location of all three stations in relation to the project area can be seen in Figure 7.
Figure 6: Wave Heights in Gulf of Mexico from November 2018 to November 2020

15
Figure 7: CDIP Buoy Locations
Figure 8 shows the tracks of tropical storms and hurricanes from 2018 to 2020 within 200 nautical miles (nm) of Gasparilla Island. Following Hurricane Irma in September 2017, Tropical Storm Alberto (May 2018) and Tropical Storm Gordon (September 2018) were the only tropical events in the Gulf of Mexico that passed within 200 nm. Additionally, Tropical Storms Arthur and Bertha (May 2020) and Hurricane Isaias passed within 200 nm but were in the Atlantic Ocean and did not generate significant wave heights in the project area.
In general, the wave conditions during this time period were typical of the region with lower wave heights in the summer and larger wave heights in the fall and winter months. The threshold for elevated wave conditions was set at 10 feet relative to water surface elevation and there are very few instances of wave heights crossing this threshold in this time period. Hurricane Michael (October 2018) became a Category 5 Hurricane but stayed more than 250 miles offshore of the project area, keeping the wave heights below the 10-ft threshold. Hurricane Michael caused significant damage to the panhandle region of Florida but did not cause significantly higher wave heights in the project area. The subsequent weather events in the project area were not significant and likely caused no more than normal background erosion. Only one event was noted between the survey interval of February 2019 and October 2019; a winter storm that exceeded the threshold at CDIP buoy 144. The storm did not cause significant wave heights at any of the other buoys in the region and likely did not have a significant impact on the project area. The 2020 hurricane season was particularly active, but the majority of storms did not provide elevated wave heights to the project area.

16
Figure 8: Hurricane Tracks from 2018 to 2020 within 200 nm of Gasparilla Island
5.2) Overview of Littoral Processes The main forcing mechanism for sediment transport along the Lee County Shoreline is alongshore currents that result from waves impacting the coast at an angle other than shore-normal. The alongshore currents contribute to a net southerly directed sediment transport. Erosion rates for the project were estimated to be 77,400 cy/yr in the 2001 General Re-evaluation Report but were revised to 28,000 cy/yr by the 2018 Section 934 Report. Erosion rates during the last monitoring cycle (2013 to 2018) was 52,600 cy/yr, which is in between the two predicted erosion rates from the feasibility reports.
The sediment transport pattern within the federal project can be divided into two distinct areas. The northern portion of the project (R-10.5 to R-15.5) is lined with seawalls and has a narrower berm than the southern portion of the project (R-15.5 to R-24.5). As a result of the narrow berm and wave energy reflecting off the seawalls (when exposed), the northern portion of the project erodes at a more rapid rate than the southern portion. In addition, the material from the northern portion of the project, helps to maintain the width in the southern portion as it erodes and is transported southward. During the previous monitoring cycle the northern portion of the project lost 77% of the material placed during the 2013 construction, while the southern portion only lost 56% of the volume placed.
At the southern end of the federal project area (R-25) there is a revetment in front of the Boca Bay Pass Club that protrudes from the shoreline and acts like a terminal groin for the project. This revetment helps maintain the material on the north side of the structure.
The non-federal project starts at the revetment and continues south for approximately 1,700 ft to a terminal groin (R-26.5). Material has been placed in this area twice during the project history, 2007 and 2020. This area protrudes into the Pass and has been dynamic when sand has been available in the system,

17
such as the period of time after the 2007 nourishment. The 2007 nourishment built out the berm wide enough to encompass the revetment and allowed material to flow south. However, when the berm eroded back and became landward of the revetment, the revetment at R-25 restricted the sand supply for this portion of the beach and, therefore, it has experienced severe erosion. The 2020 nourishment encompassed the revetment in order to allow sand to flow south and provide material to the southern beach. However, there was significantly less material placed during the 2020 nourishment compared to the 2007 event and the fill material was placed in the north part of the project. As a result, it is likely that the material placed in front of the revetment will eroded at a quicker rate than during the 2007 project due to the lack of feeder material from the adjacent shoreline.
The borrow area is located 1.2 miles south of Gasparilla Island, in the ebb shoal of the Boca Grande Pass. The material that is placed in the project area typically flows south when it leaves the project and recharges the borrow area. This creates a self-sustaining system where material from the ebb shoal borrow area can be used repeatedly without depleting the borrow area.
5.3) Mean High Water Position Change Analysis The changes in MHW position between the pre-construction (February 2019), post-construction (October 2019), and year 1 monitoring (September 2020) surveys are summarized in Table 7 and Figure 9. The MHW elevation in the project area is 0.09 ft NAVD88. Figure 10 through Figure 13 show the MHW position along the project shoreline.
5.3.1) Pre-Construction to Post-Construction MHW Position Change Analysis As expected, analysis of pre-construction and post-construction surveys indicated a substantial shoreline advance along the areas nourished during the construction event (R-10 to R-15 & R-24 to R-26.5). The average MHW position change along the entire length of the surveyed area (R-10 to R-26A) was an advance of 45 ft. This average MHW position change includes both constructed and non-constructed areas of the 2019 nourishment. The average MHW change for the federal construction portion of the project (R-10 to R-15) was 67 ft of advance and the average change for the non-federal construction portion of the project (R-24 to R-26.5) was an advance of 127 ft. The smallest shoreline advances within the areas of the project where fill was placed occurred at the tapers of the fill at R-10 and R-24 (30 ft and 42 ft, respectively). The largest shoreline advance occurred at R-25.5, which saw an advance of 310 ft. This is an outlier within the project area which occurred due to the extremely eroded condition of the beach at this location prior to the nourishment. Typically, the northern fill area saw advances of 60 to 80 ft, while the southern fill area had a larger range of advances (42 to 310 ft).
In the area of the beach that received no fill (R-15 to R-24), the MHW position change varied from 16 ft of retreat to 32 ft of advance, with an average change of 7 ft of advance. The areas outside of the direct placement area that saw the largest advances (R-15.5 and R-23.5) were immediately adjacent to the fill areas. This is expected behavior of a beach following a nourishment event as newly-placed sediment from the construction event disperses to the adjacent beach as the filled area equilibrates.

18
5.3.2) Post-Construction to Year 1 Monitoring MHW Position Change Analysis The post-construction survey was compared to the year 1 monitoring survey in order to analyze the MHW position change that occurred between October 2019 and September 2020. In the federal project fill area (R-10 to R-15) the shoreline has retreated an average of 20 ft, with a minimum retreat of 8 ft at R-15 and maximum retreat at R-14 of 39 ft. The percentage remaining of MHW position for the federal fill area is between 83% and 96%, with the exception of 70% MHW position remaining at R-14.
The non-federal project fill area (R-24 to R-26.5) had MHW position changes ranging from 162 ft of shoreline retreat to 113 ft of shoreline advance. The shoreline retreat was concentrated in one area from R-25.25 to R-25.5. This area is located along the south portion of the revetment and, as seen in Figure 13, the shoreline has retreated all the way back to the structure in this location. The material that has eroded in this area has drifted south and gathered between R-26 and the terminal groin at R-26.5. Based on historical patterns, it is likely that this material will slowly erode from this area back into the inlet shoal complex.
The area between the federal and non-federal fill areas (R-16 to R-23) had shoreline advance at 5 out of 8 profiles and only experienced shoreline retreat between R-19 and R-21. This shoreline retreat was only 1 to 12 ft. The shoreline advance in this area is a result of the fill dispersing from both the federal and non-federal fill areas.
The Year 1 Monitoring survey included the area from R-5 to R-10 but the pre- and post-construction surveys did not. Future monitoring surveys will include this area and it will be included for all future mean high-water position calculations.
Figure 9: MHW Position Change (Highlighted areas denote fill placement areas R-10 to R-15 & R-24 to R-26.5)

19
Table 7: Mean High Water Position Change
Feb-19 Oct-19 Sep-20
Pre-Con Survey Post-Con Survey Year 1 Survey5 N/A N/A N/A N/A 210 N/A N/A N/A N/A N/A6 N/A N/A N/A N/A 115 N/A N/A N/A N/A N/A7 N/A N/A N/A N/A 177 N/A N/A N/A N/A N/A8 N/A N/A N/A N/A 123 N/A N/A N/A N/A N/A9 N/A N/A N/A N/A 312 N/A N/A N/A N/A N/A10 N/A N/A 203 233 222 30 20 N/A -10 96%11 16 165 86 149 137 62 51 121 -12 92%12 149 210 145 217 194 72 49 45 -23 90%13 38 183 103 176 146 73 43 108 -29 83%14 2 140 50 131 92 81 42 90 -39 70%15 8 101 51 109 100 58 49 92 -8 92%16 337 N/A 384 400 412 17 28 75 11 103%17 277 N/A 396 380 401 -16 5 124 21 106%18 320 N/A 483 480 482 -3 -2 162 1 100%19 120 N/A 316 323 310 6 -6 190 -12 96%20 268 N/A 536 537 530 1 -6 262 -7 99%21 145 N/A 392 400 399 8 7 254 -1 100%22 388 N/A 638 633 649 -4 12 261 16 103%23 71 N/A 330 342 360 12 29 289 17 105%24 71 N/A 291 332 306 42 16 235 -26 92%
24.5 N/A 236 105 196 182 91 77 N/A -14 93%25 NW N/A 214 105 108 100 3 -5 N/A -8 93%25 SW N/A 196 82 96 94 15 13 N/A -2 98%25.25 N/A 196 93 186 78 93 -15 N/A -108 42%25.5 N/A 214 5 275 113 270 108 N/A -162 41%26 N/A 244 83 245 246 162 163 N/A 1 100%
26.5 N/A N/A 331 396 510 66 179 N/A 113 129%No Fill 26A N/A N/A 399 359 433 -40 34 N/A 75 121%
48 39 165 -9 93%63 42 91 -20 87%93 67 235 -26 86%2 8 202 6 101%
>79% 60-79% 40-59% 20-39% <20%Percent Remaining Legend
Percent Remaining Oct
2019 to Sep 2020
Federal Fill Area
No Fill
Non-Federal Fill Area
FDEP R-Mon
Average of North Construction Segment (R-10 to R-15)Average of South Construction Segment (R-24 to R-26.5)Average of Non-Constructed Segments (R-5 to R-9 & R-16 to R-23)
Feb 2019 to Sep 2020
MHW Position from R-Mon (ft)Authorized
Design Temp.
2019 Construction
Temp.
Position Change (ft)
Feb 2019 to Oct 2019
Oct 2019 to Sep 2020
No Fill
Average of Entire Project Area (R-10 to R-26A)
Authorized Design to Sep 2020

20
Figure 10: MHW Position from February 2019 to September 2020 from R-10 to R-13 (Aerial Dated 1 Jan 2019)

21
Figure 11: MHW Position from February 2019 to September 2020 from R-13 to R-17 (Aerial Dated 1 Jan 2019)

22
Figure 12: MHW Position from February 2019 to September 2020 from R-17 to R-21 (Aerial Dated 1 Jan 2019)

23
Figure 13: MHW Position from February 2019 to September 2020 from R-21 to R-26 (Aerial Dated 1 Jan 2019)

24
5.4) Volume Change Analysis As part of the monitoring requirements, the Corps measured volumetric changes within the surveyed area. Volume changes were calculated by creating a DTM for each survey and then using Bentley’s Microstation Inroads software to calculate the volume change between the two survey surfaces between every pair of R-monuments. Volumetric calculations extend from the landward extent of the year 1 monitoring survey (20-250) to the -13 ft NAVD88 contour which is the depth of closure. This corresponds to the zone of the most active sediment transport as significant material movement is not expected outside of the DOC. Volume changes between each R-monument can be seen in Table 8, Table 9, and Figure 14. The Year 1 Monitoring survey included the area from R-5 to R-10 but the pre- and post-construction surveys did not. Future monitoring surveys will include this area and it will be included for all future volume calculations.
Figure 14: Volumetric Change from Dune To -13 Ft NAVD88 in the Beach Fill Area

25
Table 8: Volumetric Change – February 2019 to October 2019
*Shaded areas indicate limits of construction fill
FDEPR-Mon
Dist BtwMon (feet)
Above 0.09'NAVD88
0.09 to -13'NAVD88
Above -13'NAVD88
Above 0.09'NAVD88
0.09' to -13'NAVD88
Above -13'NAVD88
101,520 10,160 21,251 31,411 6.7 14.0 20.7
111,195 12,349 16,011 28,360 10.3 13.4 23.7
12935 14,118 21,590 35,708 15.1 23.1 38.2
131,085 14,581 23,551 38,132 13.4 21.7 35.1
141,000 11,354 19,084 30,437 11.4 19.1 30.4
151,135 5,447 8,602 14,049 4.8 7.6 12.4
161,015 -1,507 8,836 7,330 -1.5 8.7 7.2
171,075 446 5,048 5,494 0.4 4.7 5.1
18915 1,250 3,969 5,220 1.4 4.3 5.7
191,085 -1,524 5,657 4,134 -1.4 5.2 3.8
20765 -185 7,183 6,997 -0.2 9.4 9.1
211,080 -2,922 13,447 10,525 -2.7 12.5 9.7
22960 1,493 10,217 11,710 1.6 10.6 12.2
23425 1,854 6,362 8,216 4.4 15.0 19.3
23.5475 3,272 9,164 12,436 6.9 19.3 26.2
24740 9,908 22,978 32,887 13.4 31.1 44.4
24.75610 5,657 36,892 42,549 9.3 60.5 69.8
25.5480 18,181 38,692 56,872 37.9 80.6 118.5
26390 7,352 8,806 16,158 18.9 22.6 41.4
26.5425 -1,763 2,380 617 -4.1 5.6 1.5
26ATotal Volume 17,310 109,520 289,719 399,239 6.3 16.7 23.1
62,561 101,487 164,048 10.9 17.7 28.641,098 107,368 148,466 18.5 48.4 66.95,861 80,864 86,726 0.6 8.6 9.3
Total Volume Non-fed Fill AreaTotal Volume Non-filled Areas
Feb (19-079) to Oct (19-236) 2019 Pre- to Post-Construction
Volume Change (cy) Unit Volume Change (cy/lf)
Total Volume Fed Fill Area

26
Table 9: Volumetric Change – October 2019 to September 2020
*Shaded areas indicate limits of construction fill
FDEPR-Mon
Dist BtwMon (feet)
Above 0.09'NAVD88
0.09' to -13'NAVD88
Above -13'NAVD88
Above 0.09'NAVD88
0.09' to -13'NAVD88
Above -13'NAVD88
101,520 -6,614 -6,392 -13,006 -4.4 -4.2 -8.6
111,195 -2,744 -2,797 -5,541 -2.3 -2.3 -4.6
12935 -3,093 9,189 6,096 -3.3 9.8 6.5
131,085 -4,251 5,779 1,528 -3.9 5.3 1.4
141,000 -1,338 1,287 -51 -1.3 1.3 -0.1
151,135 3,623 -2,141 1,482 3.2 -1.9 1.3
161,015 2,703 824 3,527 2.7 0.8 3.5
171,075 933 2,105 3,038 0.9 2.0 2.8
18915 -1,240 7,403 6,163 -1.4 8.1 6.7
191,085 -855 4,780 3,925 -0.8 4.4 3.6
20765 -802 3,055 2,253 -1.0 4.0 2.9
211,080 544 2,844 3,388 0.5 2.6 3.1
22960 4,521 3,021 7,542 4.7 3.1 7.9
23425 1,001 10 1,011 2.4 0.0 2.4
23.5475 -359 -2,659 -3,018 -0.8 -5.6 -6.4
24740 -9,353 -11,252 -20,605 -12.6 -15.2 -27.8
24.75610 -4,769 -19,356 -24,125 -7.8 -31.7 -39.5
25.5480 6,256 -21,099 -14,843 13.0 -44.0 -30.9
26390 2,576 17,279 19,855 6.6 44.3 50.9
26.5425 6,164 15,155 21,319 14.5 35.7 50.2
26ATotal Volume 17,310 -7,097 7,035 -62 -0.4 0.4 0.0
-18,040 7,066 -10,974 -3.1 1.2 -1.9-5,290 -34,428 -39,718 -2.4 -15.5 -17.916,233 34,397 50,630 1.7 3.7 5.4Total Volume Non-filled Areas
Oct 2019 (19-236) Post-Construction to Sep 2020 (20-250) Year 1
Volume Change (cy) Unit Volume Change (cy/lf)
Total Volume Fed Fill AreaTotal Volume Non-fed Fill Area

27
5.4.1) Pre-Construction to Post-Construction Volume Change Analysis Consistent with the MHW analysis above, the comparison between the pre-construction survey (February 2019) and the post-construction survey (October 2019) resulted in volumetric gains, a direct result of the 2019 nourishment project. Individual volume changes varied within the federal project fill area from a minimum gain of 20.7 cy/ft between R-10 and R-11 and maximum gain of 38.2 cy/ft between R-12 and R-13. Within the non-federal project fill area, the minimum gain was 41.4 cy/ft from R-26 to R-26.5, while the maximum gain was 118.5 cy/ft from R-25.5 to R-26. The minimum volume change in the project area that did not receive any fill was accretion of 3.8 cy/ft from R-19 to R-20 and the maximum volume change was 26.2 cy/ft between R-23.5 and R-24. The areas outside of the project fill areas that saw the most accretion were the areas from R-15 to R-16 and R-23 to R-24, which is expected as the sediment disperses from the fill areas to the adjacent beach. These patterns can be seen by elevation changes depicted in Figure 15.
The average unit volumetric gain across the entire project area (R-10 to R-26A) was 23.1 cy/ft. Within the federal and non-federal construction areas, the average gains were 28.6 cy/ft and 66.9 cy/ft, respectively. The total volume gain within the federal fill area during this time period was 164,000 cy and the total volume gain within the non-federal fill area was 148,500 cy. The project areas that did not receive any fill also saw gains during the pre- and post-construction monitoring period. In these areas, the total volume gain was 86,700 cy. The total volume gain within the entire surveyed area was 399,200 cy.
In the federal fill area, the pay volumes from the construction surveys showed a placement volume of 141,972 cy. This volume was less than the 161,000 cy of volume that were anticipated during the design of the project. This volume is also less than the volume gain seen within the federal fill area during this time period of 164,000 cy, suggesting some accretion of material during the period between monitoring surveys, possibly including the construction period.
In the non-federal fill area, the pay volumes from the construction surveys showed a placement volume of 139,666 cy, which is less than the volume anticipated during design (159,000 cy). This volume is also less than the volume gain within the non-federal fill area of 148,500 cy, again indicative of accretion between construction and the post-construction monitoring survey.
In total the project area (R-10 to R-26A) saw a gain of 399,240 cy of volume while only receiving 281,638 cy from the nourishment projects. This is a difference of 117,562 cy (6.8 cy/ft). From analysis of the beach profiles this additional volume gained within the project area is likely due to material migrating onshore and filling troughs within the profiles - likely caused by Hurricane Irma in September 2017. This natural recovery of the beach following a large storm can occur over a couple of years following the storm, depending on the severity of the storm and how far offshore the storm moved the material. Even the pre-construction survey (February 2019) shows some of the troughs starting to be filled during the period between the August 2018 monitoring survey and the pre-construction survey, despite the large amount of erosion seen during this time period.
In addition, the pre- to post-construction monitoring surveys occur between the spring and fall months of the year. Typically, on Florida beaches, erosion is seen in the winter months as winter storms deliver large amounts of energy to the shoreline. During summer months, recovery from these winter storms is typically seen. The overall pattern of accretion is likely due to the timing of the surveys. As discussed above, in Section 2.1) Summary of Previous Monitoring Cycle, the amount of erosion seen between August

28
2018 and February 2019 was approximately 158,900 cy. When adding the erosion from this time period to the net accretion from February 2019 to October 2019 (117,602 cy after removing the volume added due to the nourishments), the net change in volume neglecting the nourishment was approximately 41,300 cy of erosion from August 2018 to October 2019. Although a significant amount of erosion occurred from during winter from August 2018 to February 2019, the project area saw natural recovery (in addition to the volume from the nourishments) from February to October 2019. This volume of erosion is relatively close to the average annual erosion rate from the previous monitoring cycle of 52,600 cy of erosion per year.
Figure 15: Elevation Change from Pre to Post-Construction Surveys

29
5.4.2) Post-Construction to Year 1 Monitoring Volume Change Analysis The analysis of the volume change between the post-construction survey (October 2019) and the year 1 monitoring survey (September 2020) revealed a pattern of volume losses in areas where material was placed during the 2020 construction and volume gain in areas that did not receive any material. Individual volume changes within the federal project fill area had a maximum loss of material of 8.6 cy/ft between R-10 and R-11 and a maximum gain of 6.5 cy/ft between R-12 and R-13. In the federal fill area, material began eroding from the tapers of the fill onto the adjacent shoreline, while the central part of the fill has been stable or accretional. This pattern is typical after beach fills as the beach begins to equilibrate and the fill begins to disperse.
Within the non-federal project fill area the maximum loss of material was 39.5 cy/ft between R-24.75 and R-25.5 and the maximum gain was 50.9 cy/ft between R-26 and R-26.5. The fill that was placed in front of the revetment (R-25 to R-25.5) eroded immediately after placement and began to drift to the south, where it accumulated at the terminal groin at R-26.5. The fill that was placed in front of the revetment was protruding from the shoreline, which caused it to erode more quickly than the adjacent shorelines. The material predominantly followed the direction of the alongshore transport and moved south. Some of the material was trapped by the terminal groin but some of the material moved around the groin and has accumulated at R-26A. It is likely that this material will continue to erode from this area over time and be lost from the project area. The material lost from the project area will likely return to the inlet shoal complex.
The areas that did not receive any fill (R-16 to R-24) only had erosion in one area (6.4 cy/ft between R-23.5 and R-24). The other areas were accretional with a minimum gain of 1.3 cy/ft between R-15 and R-16 and a maximum gain of 7.9 cy/ft between R-22 and R-23. Figure 16 shows the elevation changes between the post-construction and year 1 monitoring surveys. The patterns of erosion and accretion described above can be seen as blue (erosion) or red (accretion) areas within the figure.
The average unit volumetric change across the entire project area (R-10 to R-26A) was 0.0 cy/ft. Within the federal and non-federal construction areas, the average losses were 1.9 cy/ft and 17.9 cy/ft, respectively. The total volume change within the federal fill area during this time period was a loss of 10,974 cy and the total volume change within the non-federal fill area was a loss of 39,718 cy. The project areas that did not receive any fill saw net gains during the year 1 monitoring period. In these areas (R-16 to R-23.5 and R-26.5 to R-26A), the total volume gain was 50,630 cy (29,311 cy and 21,319 cy, respectively). The total volume change within the entire surveyed area was -62 cy.
This negligible volume change within the surveyed area is a result of the equilibration of the beach profile and the dispersion of the fill material to the adjacent shoreline. Also, as discussed, some of the typical project losses may have been offset by accretion of material from the offshore region. The total surveyed areas experienced erosion of 7,097 cy above MHW but saw a gain of 7,035 cy between MHW and DOC. This is expected as the beach berm equilibrates after construction and the beach adopts a more natural shape. Additionally, material that was lost from the fill areas was captured in the adjacent shorelines as the sand was dispersed from the tapers along the shore. During this time period wave conditions were generally low and the area did not experience any major storms. As a result, material was able to remain in the project system throughout the year 1 monitoring period.

30
Despite the general health of the project, the non-federal fill area is an area of concern moving forward. As seen in Table 10, the area between R-24 and R-25.5 has lost at least 57% of the volume placed during the 2020 nourishment. This is the area in front of the revetment at Boca Bay Pass Club. As material erodes from this area, it feeds the adjacent shorelines to the north and south but at the current rate of erosion, the area will run out of capacity in the near future. The beach north of the revetment will likely continue to receive volume from the federal fill area since the typical littoral drift is from north to south but the area to the south of the revetment will likely see a net deficit as more material erodes than the northern beaches supply - especially once the revetment structure acts like a terminal groin and traps material. It is likely that the beach in the vicinity of R-26 (south of the revetment) will begin to erode at a more rapid pace once this happens.
Figure 16: Elevation Changes between Post-Construction and Year 1 Monitoring Surveys
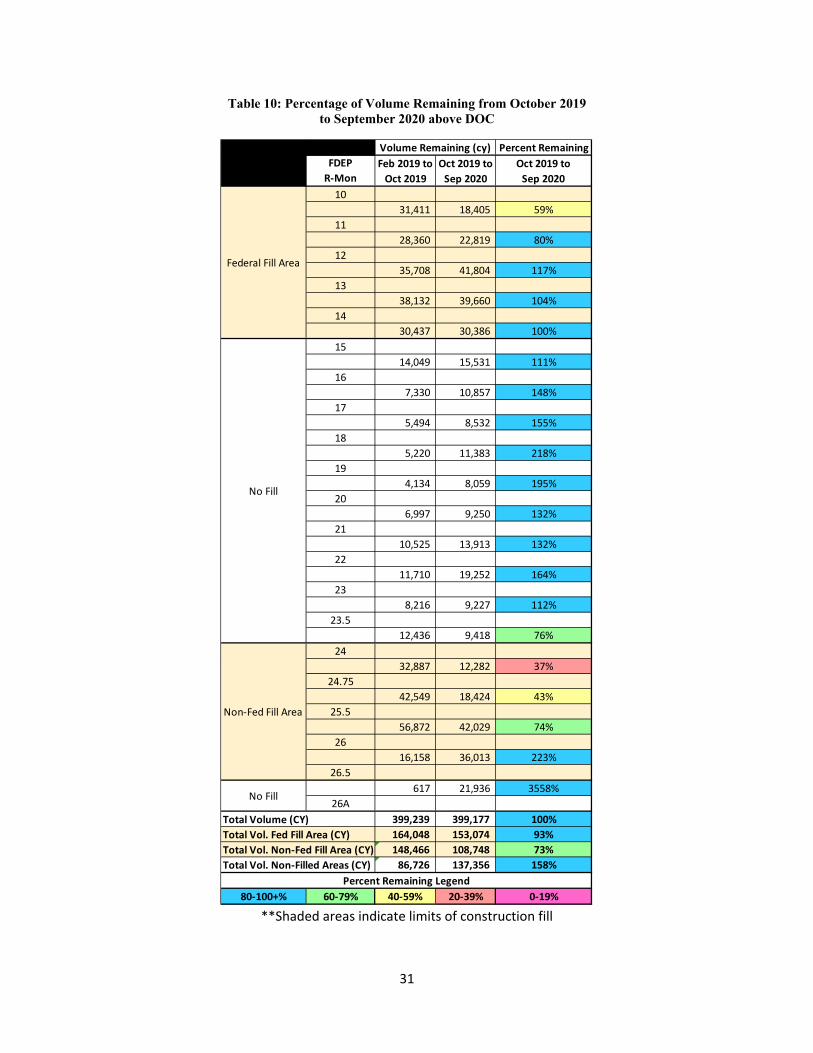
31
Table 10: Percentage of Volume Remaining from October 2019 to September 2020 above DOC
**Shaded areas indicate limits of construction fill
Percent RemainingFDEP
R-MonFeb 2019 to
Oct 2019Oct 2019 to
Sep 2020Oct 2019 to
Sep 202010
31,411 18,405 59%11
28,360 22,819 80%12
35,708 41,804 117%13
38,132 39,660 104%14
30,437 30,386 100%15
14,049 15,531 111%16
7,330 10,857 148%17
5,494 8,532 155%18
5,220 11,383 218%19
4,134 8,059 195%20
6,997 9,250 132%21
10,525 13,913 132%22
11,710 19,252 164%23
8,216 9,227 112%23.5
12,436 9,418 76%24
32,887 12,282 37%24.75
42,549 18,424 43%25.5
56,872 42,029 74%26
16,158 36,013 223%26.5
617 21,936 3558%26A
399,239 399,177 100%164,048 153,074 93%148,466 108,748 73%
86,726 137,356 158%
80-100+% 60-79% 40-59% 20-39% 0-19%
Total Vol. Fed Fill Area (CY)Total Vol. Non-Fed Fill Area (CY)Total Vol. Non-Filled Areas (CY)
Total Volume (CY)
Percent Remaining Legend
Volume Remaining (cy)
Non-Fed Fill Area
No Fill
No Fill
Federal Fill Area

32
5.5) Borrow Area Survey Analysis As part of the monitoring requirements, the Corps measured the volume and distribution of infilling of the inlet borrow area(s) and changes of the inlet channels and shoals. The offshore borrow area for the 2019 Lee County, Gasparilla Island Segment SPP renourishment project is located approximately 1.2 miles southwest of the southern end of Gasparilla Island (see Figure 1), in pre-dredging water depths of approximately -8 to -12 ft, NAVD88. The maximum permitted excavation limits in the borrow area used for this nourishment were -24 ft NAVD88. The dimensions of the permitted borrow area are approximately 600 ft (North-South) by 2,200 ft (East-West).
The Corps analyzed the surveys of the borrow area using the compare surfaces tool of Aquaveo Surface Model System (SMS). Figure 17, Figure 18, and Figure 19 show the borrow area depths from the pre-construction, post-construction, and year 1 monitoring surveys, respectively.
Figure 17: Pre-Construction Borrow Area Depths (Survey 18-256, December 2018)

33
Figure 18: Post-construction Borrow Area Depths (Survey 19-247, August 2019)
Figure 19: Year 1 Monitoring Borrow Area Depths (Survey 20-244, October 2020)

34
5.5.1) Pre-Construction to Post-Construction Borrow Area Analysis This section assesses the condition of the borrow area based on survey 19-247 performed on 6-8 August 2019. Figure 20 displays the bathymetric changes from the pre-construction (December 2018) to post-construction (August 2019) monitoring surveys.
The Corps conducted the pre-construction survey on 28 December 2018 (Survey 18-256) and the post-construction borrow area survey on 6-8 August 2019 (Survey 19-247). The total net volume change measured within the limits of the permitted borrow area is -285,000 cy. This is approximately equal to the contract pay volume within the fill template on the beach (281,638 cy). The difference in volume between the borrow area and beach placement area is likely due to some of the sediment being lost during transport to the beach by the contractor combined with some material entering the borrow area after material was excavated.
Figure 20: Borrow Area Pre To Post-Construction Bathmetry Change

35
5.5.2) Post-Construction to Year 1 Monitoring Borrow Area Analysis This section assesses the condition of the borrow area based on survey 20-244 performed by the Corps on 14 October 2020. Figure 21 displays the bathymetric changes from the post-construction (August 2019) to the year 1 (October 2020) monitoring surveys.
The total net volume change measured within the limits of the permitted borrow area is accretion of 94,500 cy (110,250 cy/yr). Based on Figure 21, the material appears to filling the borrow area from the side slopes adjacent where the dredging occurred. Over time this area is expected to equilibrate and be recharged from material in the Boca Grande Ebb shoal complex. This includes material that erodes from the southern tip of Gasparilla Island and rejoins the shoal complex.
Figure 21: Borrow Area Post-Construction to Year 1 Monitoring Bathmetry Change

36
6) Summary This report summarizes the history of the Lee County, Gasparilla Island Segment SPP and provides details of the 2019 renourishment. The Corps evaluated the changes between the pre-construction (19-079), post-construction (19-236), and year 1 monitoring surveys along with the summary of changes seen during the last monitoring cycle (2013-2019).
The previous monitoring cycle was a 5-year period that began with the 2013 renourishment and concluded in August 2018. During this time period the average erosion rate for the Gasparilla project was approximately 52,600 cy/yr, which is significantly more erosion than is predicted in the 2018 Lee County, Florida, Shore Protection Project, Gasparilla Island Segment, Final Integrated Section 934 Report (28,000 cy/yr). Additionally, 159,000 cy of erosion was calculated between the August 2018 monitoring survey (18-200) and the February 2019 pre-construction survey. This value, over a period of six months, is three times greater than the average erosion rate usually seen over the course of a whole year but it appears to be part of the typical erosion-accretion pattern that is seen over the course of the year at this location (the time period between the surveys only captures the fall and winter months, which typically exhibit greater erosion than during the summer months).
The average MHW position between October 2019 and September 2020 within the federal construction area (R-10 to R-15) retreated 20 ft on average. The non-federal project area (R-24 to R-26.5) retreated 26 ft on average. The area that did not receive any fill during this project advanced 6 ft on average. In this portion of the project, the shoreline retreated in some areas of the beach (up to 12 ft at R-19) and advanced in others (up to 21 ft at R-17). Six out of the eight monuments in this area saw shoreline advance as a result of fill dispersing into this area from the federal and non-federal project areas.
The volumetric change within the federal construction area between October 2019 and September 2020 was a loss of 11,000 cy. The total volume change in the non-federal fill area was a loss of 39,700 cy and the volume change in areas that did not receive fill was an increase of 50,600 cy. The net volume change within the monitored area was 0 cy. This indicates that the volume placed during the construction events has stayed within the monitored area and simply dispersed on either side of the federal and non-federal fill areas or, a commensurate amount of sand entered the monitored area as was removed. The majority of the project area has gained or maintained the volume from the post-construction survey, however the area in front of the Boca Bay Pass Club Corporation building revetment between R-24 and R-25.5 has seen approximately 60% of the material placed during the 2019 construction event be eroded away in the past year. This is caused by the protruding shoreline in this area, which exacerbates erosion due to waves and tidal currents. The shoreline in this area will soon erode back to the revetment. The material in this area has dispersed to the north and to the south of the non-federal placement area.
The borrow area dredged for the 2019 project had a volume loss of 285,000 cy between the December 2018 (18-256) and the August 2019 (19-247) borrow area surveys. This is approximately equal to the volume used during the construction event (281,638 cy). This is likely coincidence given that volume losses between borrow areas and placement areas can be 10 to 20 percent. The borrow area between the August 2019 and October 2020 (20-244) monitoring surveys accreted by 94,500 cy (110,250 cy/yr).

37
In general, the project performed as expected during the previous monitoring cycle. The average erosion rate following the 2013 construction was 52,600 cy/yr, which is less than the anticipated erosion rate prior to that project from the 2001 GRR (77,400 cy/yr). Between the post-construction and year 1 monitoring survey, the monitored area did not lose as much volume as typically predicted. The monitored area had a net loss of 0 cy, which is much less than the predicted 28,000 cy/yr from the 2018 934 Report. The project will be monitored biennially until the next nourishment or until the project life expires.

38
7) References Hallermeier R.J., 1978. Uses for a calculated limit depth to beach erosion. Proceedings of the
Sixteenth Coastal Engineering Conference. American Society of Civil Engineers, New York: A-S-O-C-E, Ch. 88, pp. 1493–1512.
U.S. Army Corps of Engineers (USACE), 2001. Lee County, Florida, Shore Protection Project (Gasparilla and Estero Islands), General Re-evaluation Report with Environmental Impact Statement. Jacksonville District.
U.S. Army Corps of Engineers (USACE), 2013. Project Information Report (PIR), Rehabilitation Effort for the Lee County Hurricane and Storm Damage Reduction Project, Gasparilla Island Segment, Florida. Jacksonville District.
U.S. Army Corps of Engineers (USACE), 2017. Project Information Report (PIR), Rehabilitation Effort for the Lee County, Florida Shore Protection Project, Gasparilla Island Segment.
U.S. Army Corps of Engineers (USACE), 2018a. Lee County, Florida, Shore Protection Project Gasparilla Island Segment, Final Integrated Section 934 Report and Environmental Assessment. Jacksonville District.
U.S. Army Corps of Engineers (USACE), 2018b. Physical Monitoring Plan Lee County, Shore Protection Project, Gasparilla Island Segment. Jacksonville District.