lectures in macroeconomics- charles w. upton extending the model
Post on 21-Dec-2015
223 views
TRANSCRIPT

Lectures in Macroeconomics- Charles W. Upton
Extending the Model
D
SSRSLR
H*
w*

Extending the Model
Labor Supply and Demand
D
S
H*
w*

Extending the Model
Backward Bending Supply
• People value both money and the things it can buy and the time to enjoy the things money can buy.
• At some point, people decide to spend less time working.

Extending the Model
Evidence on Backward Bending
Gross Domestic Product and Hours Worked
in the United States, 1820-1989 Year Per Capita
GDP Hours
Worked 1870 2,254 2,964 1890 3,115 2,789 1913 4,868 2,605 1929 6,336 2,342 1938 5,568 2,062 1950 8,611 1,867 1960 9,995 1,795 1973 14,103 1,717 1987 17,340 1,608 1989 18,317 1,604
Extending the Model
Evidence on Backward BendingYear Per Capita
GDP Hours
Worked “Wage Rate”
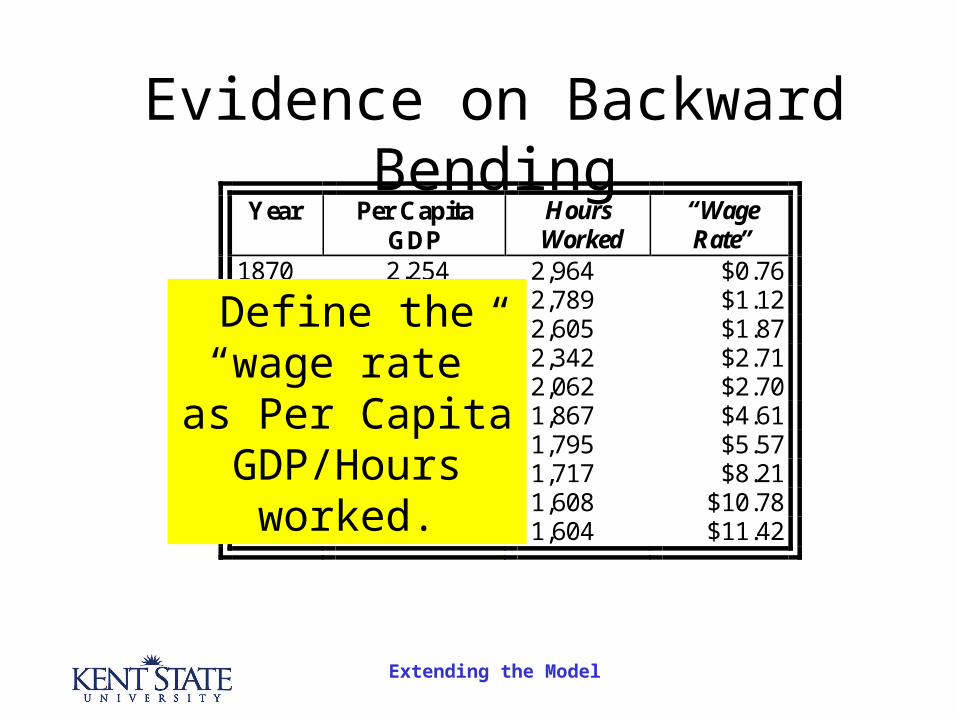
1870 2,254 2,964 $0.76 1890 3,115 2,789 $1.12 1913 4,868 2,605 $1.87 1929 6,336 2,342 $2.71 1938 5,568 2,062 $2.70 1950 8,611 1,867 $4.61 1960 9,995 1,795 $5.57 1973 14,103 1,717 $8.21 1987 17,340 1,608 $10.78 1989 18,317 1,604 $11.42
Define the “wage rate” as Per Capita
GDP/Hours worked.

Extending the Model
Evidence on Backward BendingYear Per Capita
GDP Hours
Worked “Wage Rate”
1870 2,254 2,964 $0.76 1890 3,115 2,789 $1.12 1913 4,868 2,605 $1.87 1929 6,336 2,342 $2.71 1938 5,568 2,062 $2.70 1950 8,611 1,867 $4.61 1960 9,995 1,795 $5.57 1973 14,103 1,717 $8.21 1987 17,340 1,608 $10.78 1989 18,317 1,604 $11.42

Extending the Model
Evidence on Backward BendingYear Per Capita
GDP Hours
Worked “Wage Rate”
1870 2,254 2,964 $0.76 1890 3,115 2,789 $1.12 1913 4,868 2,605 $1.87 1929 6,336 2,342 $2.71 1938 5,568 2,062 $2.70 1950 8,611 1,867 $4.61 1960 9,995 1,795 $5.57 1973 14,103 1,717 $8.21 1987 17,340 1,608 $10.78
1989 18,317 1,604 $11.42
Over time, wages have risen and hours
worked have fallen. We seem to be in the
backward bending portion.

Extending the Model
The Backward-Bending Labor Supply Curve
D
S
H*
w*
Extending the Model
The Backward-Bending Labor Supply Curve
D
S
H*
w*
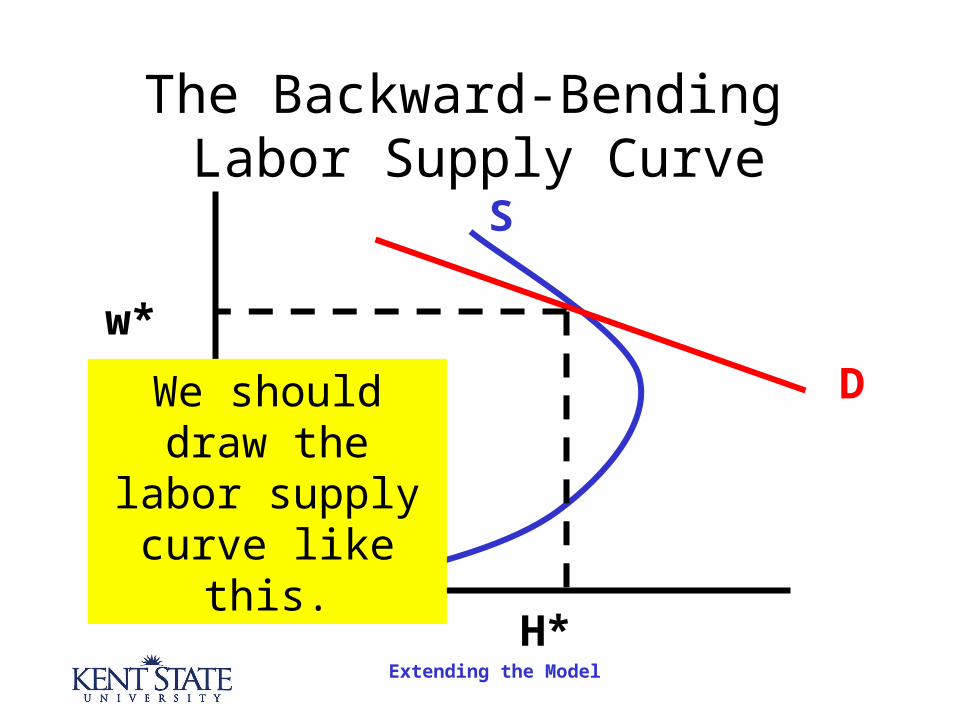
We should draw the labor supply curve like this.

Extending the Model
The Backward-Bending Labor Supply Curve
D
S
H*
w*
We should draw the labor supply curve like this.
While there is debate on where
the curve begins to bend back, we
seem to be in the backward bending
portion

Extending the Model
But there is more to the story…….

Extending the Model
A Simple Experiment
• Miller’s Pizzeria offers you $1,000 an hour. The owner promises – and you believe – that you can earn that rate for the rest of your life.

Extending the Model
A Simple Experiment
• Miller’s Pizzeria offers you $1,000 an hour. The owner promises – and you believe – that you can earn that rate for the rest of your life.– No doubt you will work fewer hours,
using the leisure, to spend your extra income (wisely?)

Extending the Model
A Simple Experiment
• Miller’s Pizzeria offers you $1,000 an hour. The owner promises – and you believe – that you can earn that rate for the rest of your life.
• Miller’s Pizzeria is desperate for your efforts right now. This bonanza will not continue for long.

Extending the Model
A Simple Experiment
• Miller’s Pizzeria offers you $1,000 an hour. The owner promises – and you believe – that you can earn that rate for the rest of your life.
• Miller’s Pizzeria is desperate for your efforts right now. This bonanza will not continue for long.
You will work like a dog and put money aside for the future.
In short, people make hay – or pizzas – while the
sun shines.

Extending the Model
Our Revised Model
SSRSLR
H*
w*

Extending the Model
Our Revised Model
SSRSLR
H*
w*
$1000

Extending the Model
Our Revised Model
D
SSRSLR
H*
w*

Extending the Model
Our Revised Model
D
SSRSLR
H*
w*
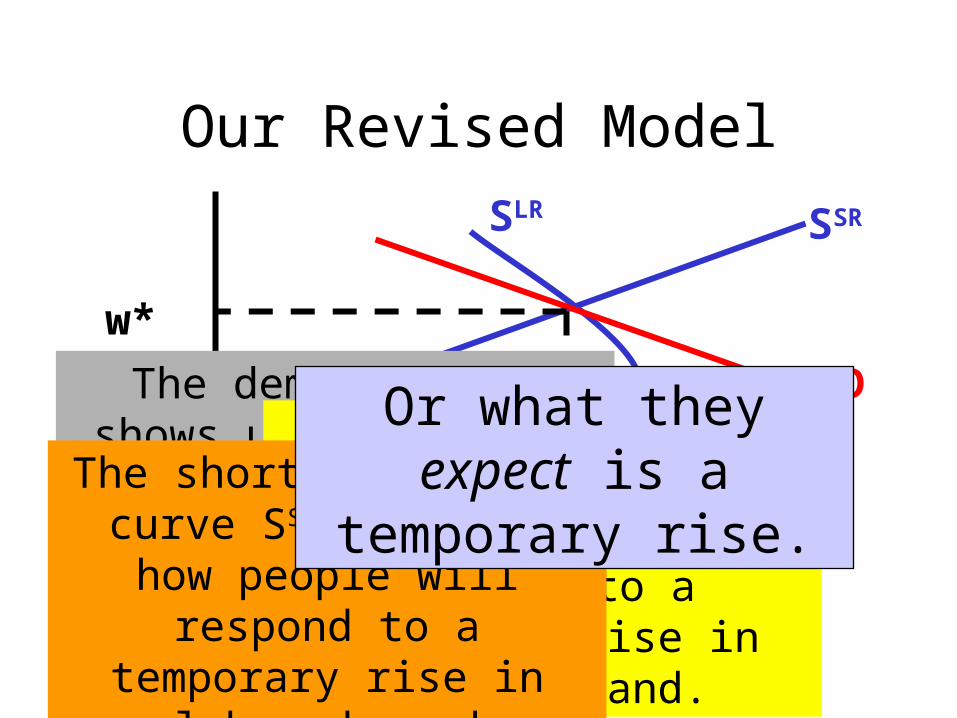
The demand curve shows us the demand for work as a function of the wage rate.

Extending the Model
Our Revised Model
D
SSRSLR
H*
w*
The demand curve shows us the demand for work as a function of the wage rate.
The long run supply curve SLR shows us how people will
respond to a permanent rise in labor demand.

Extending the Model
Our Revised Model
D
SSRSLR
H*
w*
The demand curve shows us the demand for work as a function of the wage rate.
The long run supply curve SLR shows us how people will
respond to a permanent rise in labor demand.
The short run supply curve SSR shows us how people will
respond to a temporary rise in labor demand
Or what they expect is a temporary rise.

Extending the Model
Permanent vs. Temporary
D
SSRSLR
H*
w*
We will defer that question. Let’s see what happens when
you know whether it is a permanent or temporary
change in your wage rate.

Extending the Model
A Permanent Increase
D’
SSRSLR
D
H*H’
w*
w’

Extending the Model
A Permanent Increase
D’
SSRSLR
D
H*H’
w*
w’
Wages up, hours of
work down.

Extending the Model
A Temporary Increase
D’
SSRSLR
D
H* H’
w*w’

Extending the Model
A Temporary Increase
D’
SSRSLR
D
H* H’
w*w’
Wages up, hours of work up

Extending the Model
A Permanent Decrease
D’
SSRSLR
D
H’H*
w*
w’

Extending the Model
A Permanent Decrease
D’
SSRSLR
D
H’H*
w*
w’Wage rate down,
hours up

Extending the Model
A Temporary Decrease
D’
SSRSLR
D
H’ H*
w*
w’

Extending the Model
A Temporary Decrease
D’
SSRSLR
D
H’ H*
w*
w’Wage rate down,
hours down.

Extending the Model
SummaryDemand for Labor Wage
Rate Hours of
Work Permanent Increase in Demand for Labor w+ H- Temporary Increase in Demand for Labor w+ H+ Permanent Decrease in Demand for Labor w- H+ Temporary Decrease in Demand for Labor w- H-

Extending the Model
End
©2004 Charles W. Upton. All rights reserved