lecturer: jack wu [email protected] 吳文傑 taiwan economic development
TRANSCRIPT

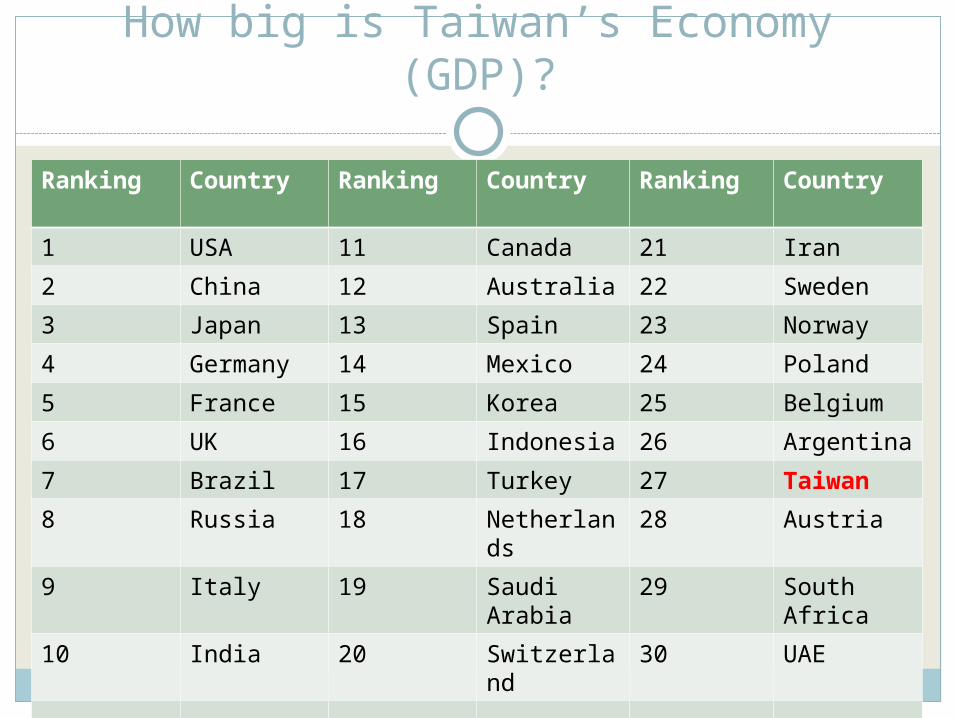
How big is Taiwan’s Economy (GDP)?
Ranking Country Ranking Country Ranking Country
1 USA 11 Canada 21 Iran
2 China 12 Australia 22 Sweden
3 Japan 13 Spain 23 Norway
4 Germany 14 Mexico 24 Poland
5 France 15 Korea 25 Belgium
6 UK 16 Indonesia 26 Argentina
7 Brazil 17 Turkey 27 Taiwan
8 Russia 18 Netherlands
28 Austria
9 Italy 19 Saudi Arabia
29 South Africa
10 India 20 Switzerland
30 UAE
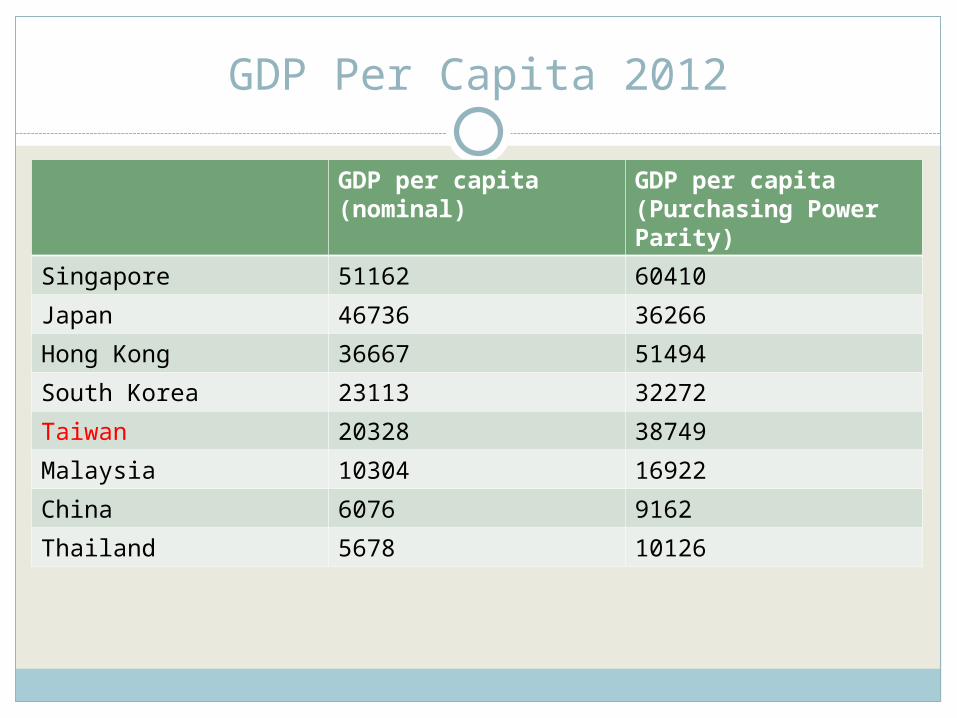
GDP Per Capita 2012
GDP per capita (nominal)
GDP per capita(Purchasing Power Parity)
Singapore 51162 60410
Japan 46736 36266
Hong Kong 36667 51494
South Korea 23113 32272
Taiwan 20328 38749
Malaysia 10304 16922
China 6076 9162
Thailand 5678 10126

GDP Per Capita (PPP) world ranking 2012
Ranking GDP (PPP) Ranking GDP(PPP)
3. Singapore 60410 19. Taiwan 38749
5. Hong Kong 51494 20. Belgium 37883
6. USA 49922 21. Denmark 37657
8. Switzerland 45418 22. UK 36941
9. Canada 42734 23. Finland 36395
10. Australia 42640 24. Japan 36266
11. Austria 42409 25. France 35548
15. Netherlands 41400 26. Israel 32312
18. Germany 39028 27. Korea 32272
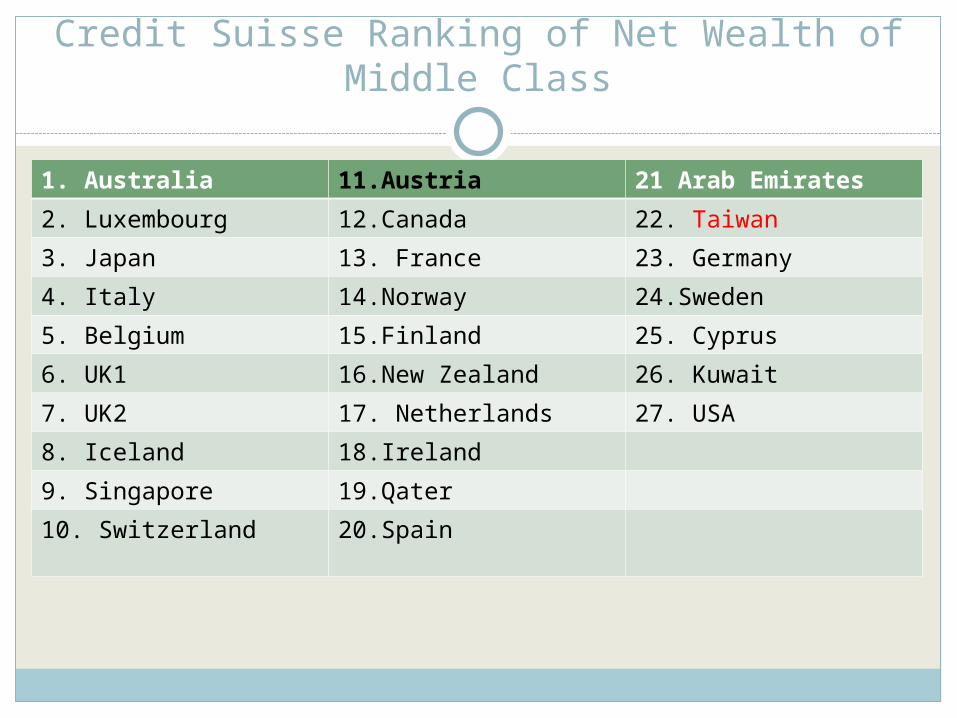
Credit Suisse Ranking of Net Wealth of Middle Class
1. Australia 11.Austria 21 Arab Emirates
2. Luxembourg 12.Canada 22. Taiwan
3. Japan 13. France 23. Germany
4. Italy 14.Norway 24.Sweden
5. Belgium 15.Finland 25. Cyprus
6. UK1 16.New Zealand 26. Kuwait
7. UK2 17. Netherlands 27. USA
8. Iceland 18.Ireland
9. Singapore 19.Qater
10. Switzerland 20.Spain
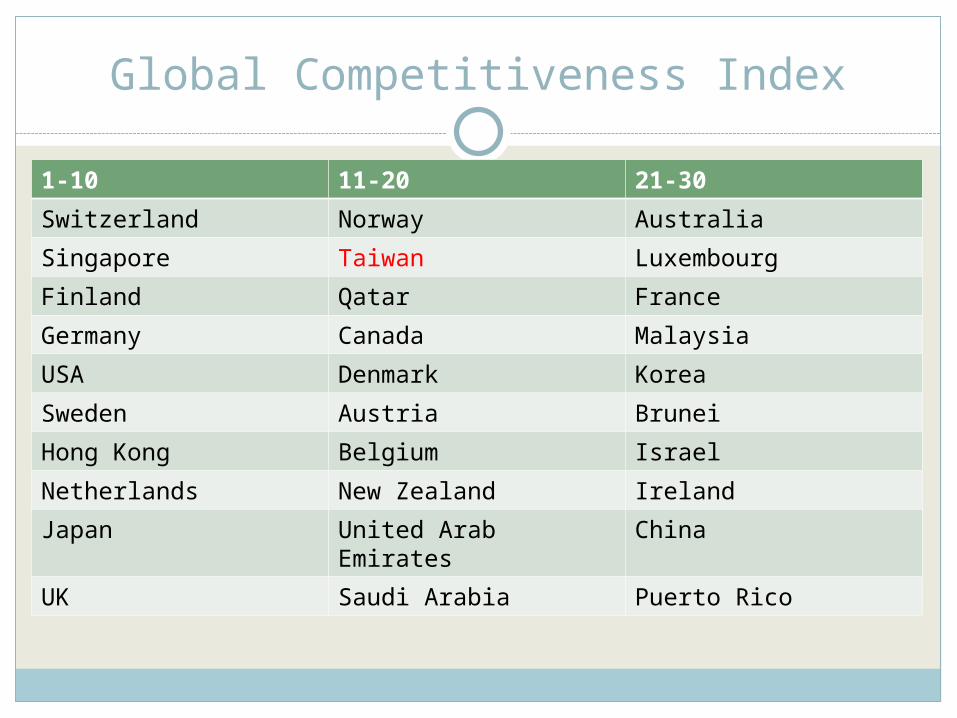
Global Competitiveness Index
1-10 11-20 21-30
Switzerland Norway Australia
Singapore Taiwan Luxembourg
Finland Qatar France
Germany Canada Malaysia
USA Denmark Korea
Sweden Austria Brunei
Hong Kong Belgium Israel
Netherlands New Zealand Ireland
Japan United Arab Emirates China
UK Saudi Arabia Puerto Rico

Income Distribution and Government Debt
Gini Coefficient(%) Debt Ratio (%)
Singapore 48 111.4
Japan 38 214.3
Hong Kong 53 30
South Korea 31 33.7
Taiwan 34 36
Malaysia 46 55
China 47 31.7
Thailand 40 43.3
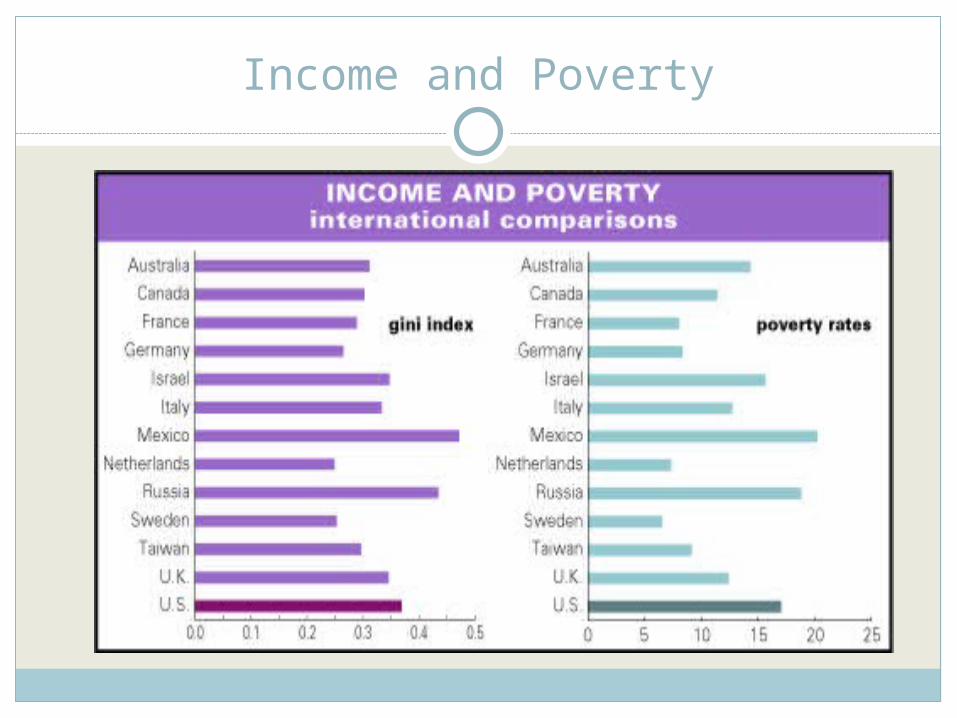
Income and Poverty

Top Export Countries
Ranking Country Ranking Country
1 China 11 Italy
2 USA 12 Canada
3 Germany 13 Spain
4 Japan 14 Singapore
5 France 15 Saudi Arabia
6 Korea 16 Mexico
7 Netherlands 17 UAE
8 Russia 18 India
9 HK 19 Switzerland
10 UK 20 Taiwan

Top Import Countries
Ranking Country Ranking Country
1 USA 11 Netherlands
2 China 12 Italy
3 Germany 13 Thailand
4 Japan 14 Mexico
5 UK 15 Russia
6 France 16 Spain
7 Korea 17 Belgium
8 India 18 Switzerland
9 HK 19 Taiwan
10 Canada 20 Australia

Which Ones are Taiwanese Companies?
Foxconn Hon Hai TSMC Formosa Plastic Co.
HTC ACER ASUS Trend Micro
MASTER KONG WANT-WANT GIANT SYNNEX
MAXXIS 85 C ADVANTECH MERIDA
D-LINK UNI-PRESIDENT
ZYXEL JOHNSON
CYBERLINK TRANSCEND DELTA WOWPRIME

Major Economic Indicator of Taiwan
YearGDP Per
Capita(US$)
GDP Growth Rate(%)
Average GDP
Growth Rate(10 year,%)
Unemployment Rate(%)
CPI Growth Rate(%)
AverageCPI Growth Rate(%)
Gini coefficien
t
Foreign reserve(billio
n US$)
1970 393 11.40 9.4 1.70 3.60 3.4 0.2941975 978 4.90 - 2.40 5.20 - 0.3121980 2385 7.80 9.8 1.23 19.00 10.4 0.2771985 3290 13.50 - 2.91 -0.20 - 0.290 225.61990 8124 3.80 7.7 1.67 4.10 3.1 0.312 724.41995 12918 6.38 - 1.79 3.70 - 0.317 903.12000 14704 5.80 6.2 2.99 1.30 2.6 0.326 1067.42001 13147 -1.65 - 4.57 -0.01 - 0.350 1222.12002 13404 5.26 - 5.17 -0.20 - 0.345 1616.62003 13773 3.67 - 4.99 -0.28 - 0.343 2066.32004 15012 6.19 - 4.44 1.62 - 0.338 2417.42005 16051 4.70 - 4.13 2.30 - 0.340 2532.92006 16491 5.44 - 3.91 0.60 - 0.339 2661.52007 17154 5.98 - 3.91 1.80 - 0.340 2703.02008 17399 0.73 - 4.14 3.53 - 0.341 2917.12009 16359 -1.87 3.2 5.85 -0.87 0.9 0.345 3482.02010 18503 4.72 - 5.21 -0.96 - 0.342 3820.12011 20006 4.07 - 5.39 1.42 - 0.342 3855.52012 20386 1.32 - 4.24 1.93 - - 4031.7Source: Directorate-General of Budget, Accounting and Statistics, Statistic Abstract of National
Income, Executive Yuan, Taiwan.
Before Takeoff
Japanese Colonial Era (before 1945)KMT brought 2 million mainlanders (human
capital) to Taiwan, 1949U.S. Aid (1950-1967)

Major economic indicators of Taiwan between 1950 and 1970
Year Population
(thousands)
literary
rate
(%)
GDP
per capita
(USD)
GDP growth
rate (real)
(%)
Average GDP
growth rate
(%)
inflation rate
(%)
Average
inflation rate
(%)
Gini
Coefficient
1952 8128 57.9 196 12.0 - 8.8 - 0.618
1955 9079 62.1 203 8.1 - 14.1 - 0.396
1960 10792 72.9 154 6.3 7.7 18.5 8.8 0.457
1965 12628 76.9 217 11.1 - -0.1 - 0.321*
1970 14676 85.3 389 11.4 9.6 3.6 2.0 0.294
Source: Council for Economic Planning and Development, Taiwan Statistical Data Book, 1993. Directorate General of Budget, Accounting and Statistics, Executive Yuan,
R.O.C.
Note: *1964 data
14

Golden Years
• Export expansion policy, Export Processing Zone, 1965-80
• Second import substitute policy, 1975- 80• Ten Public Projects, 1974-1979• High-tech industry, 1980-• Financial liberalization, 1990-

16
GDP growth rate and inflation rate:of the world ,1961-1988 Units:%
GDP growth rate CPI inflation rate
World average 3.8 8.7
Industrialized Countries 3.6 5.7
Developing Countries 4.7 21.0
Four Little Dragons
Taiwan 9.3 5.6
S. Korea 8.6 12.7
Hong Kong 8.4 6.3
Singapore 8.5 3.4
Source:Yeh (1991) , “ Taiwan’s Economics Plans“ , in C.Kao and J.Lee eds ,The
Taiwan Experience 1948-1989, p.59, Commonwealth Publishing Co.
(in Chinese)

All Patents Granted in USPTO
Country 2012 Accumulated
Japan 50677 902998
Germany 13835 360194
UK 5213 146564
France 5386 134641
Taiwan 10646 104954
Korea 13233 103895
China 4637 17284
After Golden Years
Open direct investment in China, 1990- Tension between Taiwan and China, 1996-
2001 Join World Trade Organization, 2002- Cross-strait Direct Flight, 2008- Sign ECFA with China, 2010-

Current Economic Issues
Sluggish wage growthUnequal income distributionHigh housing priceEconomic Reliance on China
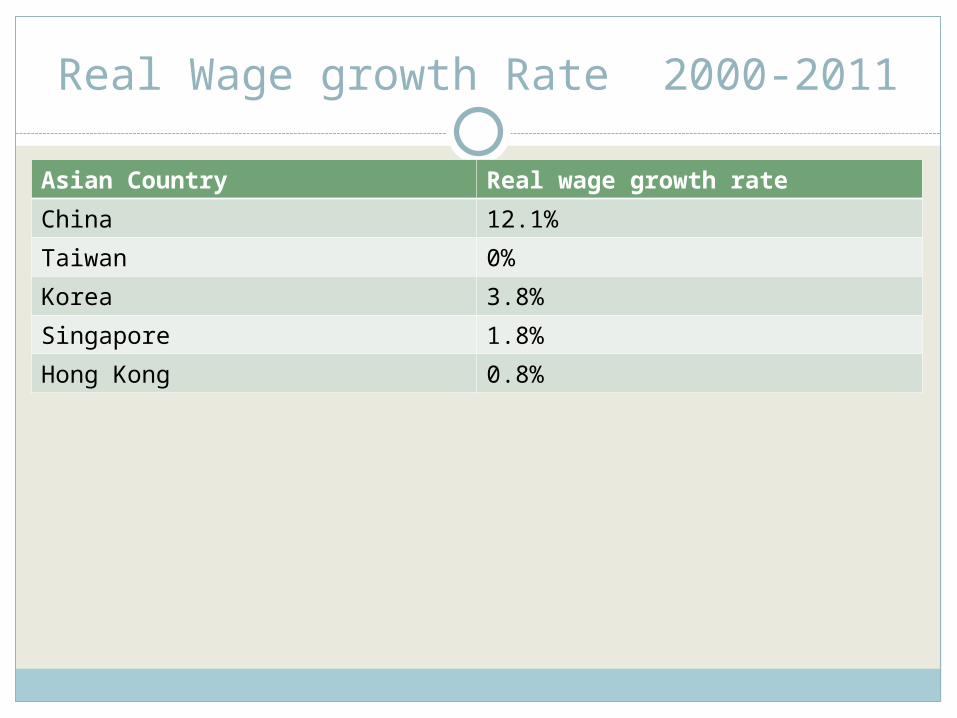
Real Wage growth Rate 2000-2011
Asian Country Real wage growth rate
China 12.1%
Taiwan 0%
Korea 3.8%
Singapore 1.8%
Hong Kong 0.8%
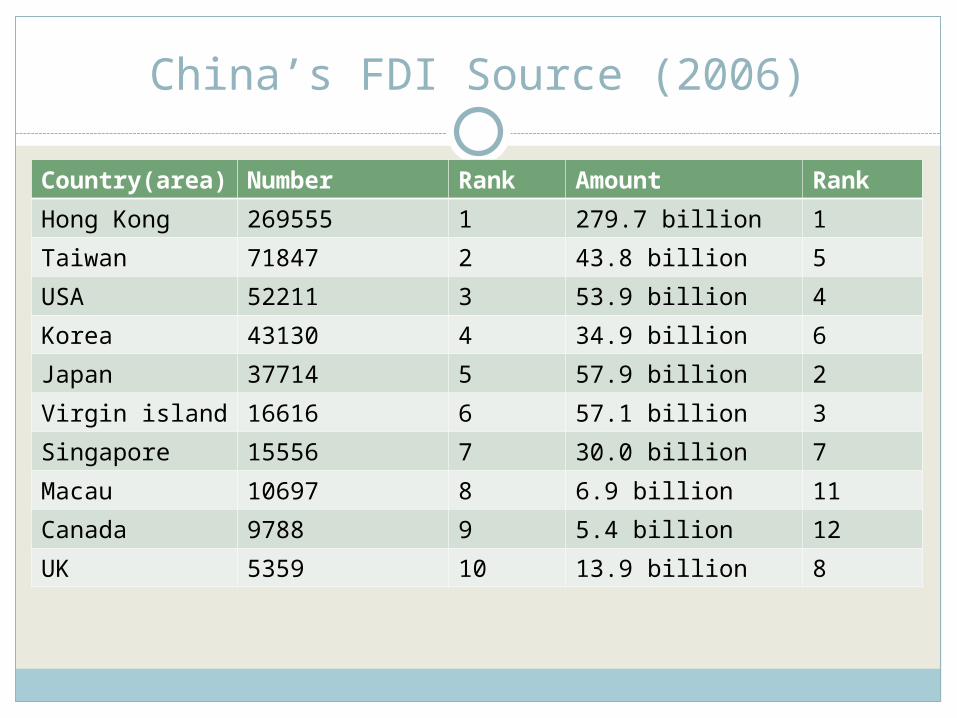
China’s FDI Source (2006)
Country(area)
Number Rank Amount Rank
Hong Kong 269555 1 279.7 billion 1
Taiwan 71847 2 43.8 billion 5
USA 52211 3 53.9 billion 4
Korea 43130 4 34.9 billion 6
Japan 37714 5 57.9 billion 2
Virgin island 16616 6 57.1 billion 3
Singapore 15556 7 30.0 billion 7
Macau 10697 8 6.9 billion 11
Canada 9788 9 5.4 billion 12
UK 5359 10 13.9 billion 8
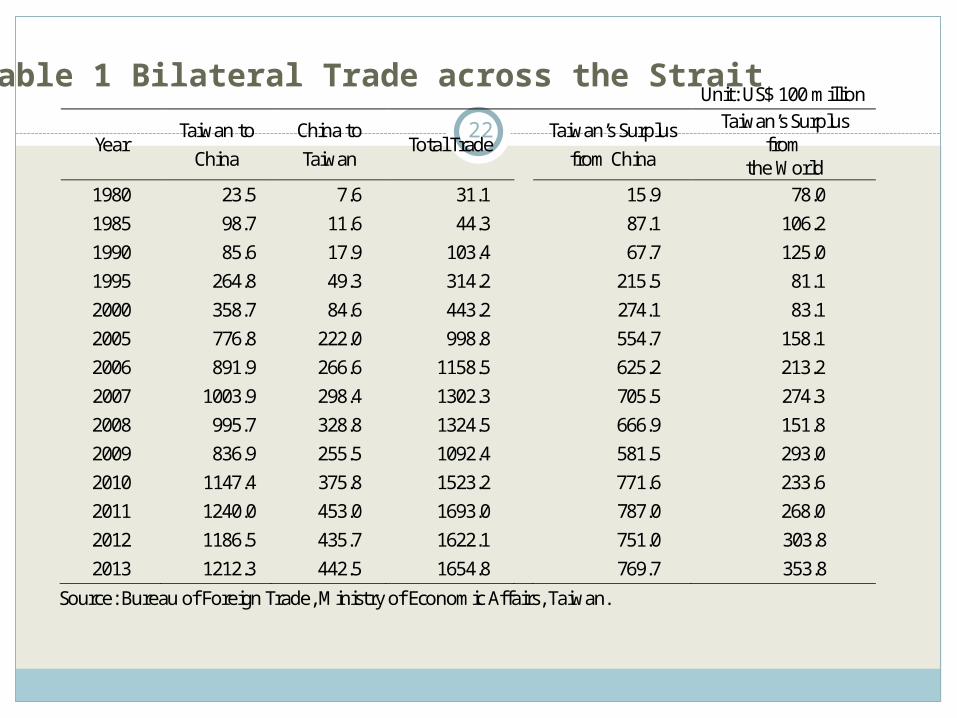
Table 1 Bilateral Trade across the Strait Unit: US$ 100 million
Year Taiwan to
China China to Taiwan
Total Trade Taiwan’s Surplus
from China
Taiwan’s Surplus from
the World 1980 23.5 7.6 31.1 15.9 78.0 1985 98.7 11.6 44.3 87.1 106.2 1990 85.6 17.9 103.4 67.7 125.0 1995 264.8 49.3 314.2 215.5 81.1 2000 358.7 84.6 443.2 274.1 83.1 2005 776.8 222.0 998.8 554.7 158.1 2006 891.9 266.6 1158.5 625.2 213.2 2007 1003.9 298.4 1302.3 705.5 274.3 2008 995.7 328.8 1324.5 666.9 151.8 2009 836.9 255.5 1092.4 581.5 293.0 2010 1147.4 375.8 1523.2 771.6 233.6 2011 1240.0 453.0 1693.0 787.0 268.0 2012 1186.5 435.7 1622.1 751.0 303.8 2013 1212.3 442.5 1654.8 769.7 353.8
Source: Bureau of Foreign Trade, Ministry of Economic Affairs, Taiwan.
22