lecture topic 15: value and valuation – a more in- depth review presentation to cox mba students...
TRANSCRIPT

Lecture Topic 15: Value and Valuation – A More In-Depth Review
Presentation to Cox MBA Students
FINA 6214: International Financial Markets
Presentation to Cox Business Students
FINA 3320: Financial Management
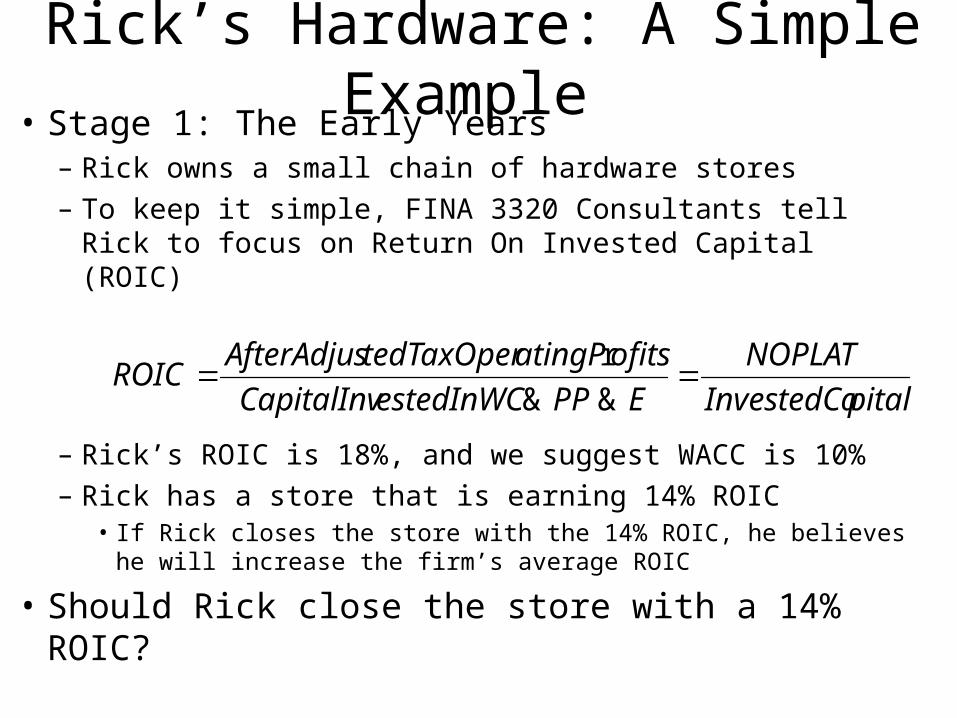
Rick’s Hardware: A Simple Example • Stage 1: The Early Years
– Rick owns a small chain of hardware stores
– To keep it simple, FINA 3320 Consultants tell Rick to focus on Return On Invested Capital (ROIC)
– Rick’s ROIC is 18%, and we suggest WACC is 10%
– Rick has a store that is earning 14% ROIC• If Rick closes the store with the 14% ROIC, he believes he will
increase the firm’s average ROIC
• Should Rick close the store with a 14% ROIC?
pitalInvestedCa
NOPLAT
EPPestedInWCCapitalInv
ofitsatingPtedTaxOperAfterAdjusROIC
&&
r

Rick’s Hardware: A Simple Example • Should Rick close the store with the 14% ROIC?
– NO!
– FINA 3320 Consultants now tell Rick that he should care not about ROIC itself, but the combination of two items:
• (1) ROIC relative to WACC (the firm’s cost of capital)
• (2) Amount of capital invested
– This information can be expressed as Economic Profit:
• FINA 3320 Consultants show Rick that as long as there is a positive spread of ROIC over WACC, additional Invested Capital will produce a higher Economic Profit!
• Rick’s objective should be to maximize long-term Economic Profit
)(r WACCROICpitalInvestedCaofitEconomicP

Rick’s Hardware: A Simple Example • Stage 2: Growing the Business
– For many years, Rick was happy with the Economic Profit framework (until he developed Rick’s Superhardware idea)
• If Rick undertakes Superhardware concept, the firm’s Economic Profit will drop for the first four years, after which it will be higher
• How was Rick to determine the trade-off between short- and long-term Economic Profit?
– FINA 3320 Consultants now tell Rick that he needs some more sophisticated financial tools, DCF:
• DCF Value of firm without the Superhardware concept is $53M
• DCF Value of firm with the Superhardware concept is $62M
nn
WACC
FCF
WACC
FCF
WACC
FCFDCFValue
)1(...
)1()1( 22
11
0

Rick’s Hardware: A Simple Example • Should Rick undertake the new concept?
– Of course!• Rick’s new Superhardware concept is projected to be more
valuable than the present concept
– But now Rick is confused and asks: • “When do I use Economic Value and when do I use DCF?”
– FINA 3320 Consultants tell Rick that Economic Profit and DCF are the same:
nn
WACC
FCF
WACC
FCF
WACC
FCFDCFValue
)1(...
)1()1( 22
11
0
)(r WACCROICpitalInvestedCaofitEconomicP
DCFValueofitEconomicP r

Rick’s Hardware: A Simple Example • Stage 3: Rick Goes Public
– Using DCF framework, Rick makes many important long-term strategic decisions and Superhardware is successful
– Rick now wants to expand but needs access to more capital• Rick decides he should undertake an IPO and returns for advice…
– FINA 3320 Consultants tell Rick that he will have to learn to manage both the financial markets and the real markets
– Real Markets• Until now, Rick has had to manage the real markets by addressing:
– Amount of cash flow earned relative to the amount of capital invested
– Maximization of value via Economic Profit and DCF
• Decision Rule for Real Market decisions– Choose strategies or make operational decisions that maximize PV of
future FCFs

Rick’s Hardware: A Simple Example – Financial Markets
• FINA 3320 Consultants explain to Rick that when the firm enters the financial, or capital, markets, the real market decision rule does not change
• However, life becomes more complicated because management must now simultaneously deal with outside investors and analysts
– FINA 3320 Consultants tell Rick that he will have to continue maximizing value, but that he must learn to also manage investors’, or the market’s, expectations
• If the market’s expectations are higher than what is ultimately realized, the stock’s price will fall even though ROIC > WACC
– The loss of credibility in this instance may take years to overcome
• If the market’s expectations are too low, share price will be too low, and the firm may be subject to a hostile takeover

Rick’s Hardware: A Simple Example • Stage 4: Conglomerate Expansion
– Publicly-traded Rick’s Hardware grew quickly and regularly beat expectations and became a top market performer
• So, Rick decided to expand into Rick’s Furniture and Rick’s Garden Supplies
• But Rick was concerned about delegating decision-making to management (as he knew he must if he expanded)
– FINA 3320 Consultants explain to Rick that he needed a planning and control system to tell him about the “health” of the firm
• That is, the ability of the firm to continue to grow and create value
• This required a forward-looking metric, not just backward-looking ones

Rick’s Hardware: A Simple Example – FINA 3320 Consultants explain to Rick that the problem
with financial metrics is that they cannot tell how management is doing in terms of creating future value
– For example:• In the short run, managers could improve short-term financial
results by cutting back on customer service– i.e., decreasing the number of employees available in the store at any time to
help customers, or reducing employee training
• Or, in the short run, management could improve short-term financial results by deferring maintenance on existing fixed assets, deferring purchase of new fixed assets, or reducing spending on brand-building (e.g., advertising, etc.)
– Rick’s hardware must incorporate metrics related to customer satisfaction or brand awareness
• Such metrics provide an idea about the future, not just the present

Rick’s Hardware: A Simple Example • Summarizing Rick’s Hardware Lessons
• (1) In the real market, you create value by earning a ROIC greater than the opportunity cost of capital, or WACC
• (2) The more you can invest above the cost of capital, the more value you create
– Growth creates more value as long as the ROIC exceeds the WACC
• (3) You should select strategies that maximize the PV of expected cash flows, or Economic Profit
– You get the same answer regardless of which you choose
• (4) The value of a firm’s shares in the stock market is based on the market’s expectations of future performance
– Market’s expectations can deviate from intrinsic value if the market is less than fully informed about the firm’s true prospects
• (5) After the initial price is set, shareholders’ returns earned depend more on the changes in expectations about the firm’s future performance than the actual realized performance of the firm

Long-Term Financial Forecasting
The Pro Forma Financial Statement

Past and Future• Historical data provides an analyst with an
understanding of the past and present of a firm’s cash flows– However, it doesn’t provide much in the way of the
present value of the firm
• Historic cash flows have already been obtained– Therefore, new owner would not be entitled to these
historic cash flows
• We require forward-looking (pro forma) statements to estimate future cash flows

Assessing Firm’s Future ‘Health’• Assessing the long-term financial health of a firm
is an important task for:– (1) Managers: as they formulate goals and strategies– (2) Creditors: as they consider lending money– (3) Investors: as they consider buying equity
• Management has to be able to predict future growth in sales, assets, etc.
• Management must also ensure funds are available for growth
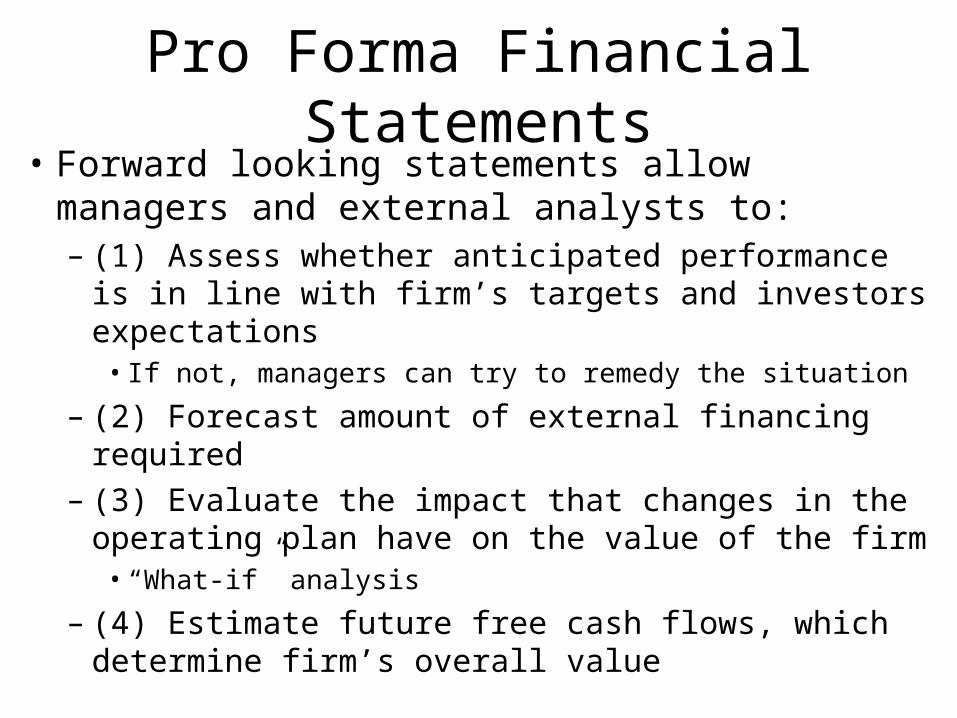
Pro Forma Financial Statements• Forward looking statements allow managers and
external analysts to:– (1) Assess whether anticipated performance is in line
with firm’s targets and investors expectations• If not, managers can try to remedy the situation
– (2) Forecast amount of external financing required– (3) Evaluate the impact that changes in the operating
plan have on the value of the firm• “What-if” analysis
– (4) Estimate future free cash flows, which determine firm’s overall value

Ingredients of Pro Forma• Sales forecast may be derived using one of two
approaches– Top-down:
• Relies heavily on macroeconomic and industry forecasts
• However, senior management usually establishes firm’s objectives for increased sales
– Start with reviews of sales and sales growth over past 5-10 years
– Bottom-up:• Begins by talking to customers to assess demand
• Many firms use a blend of the two approaches

Ingredients of Pro Forma• Perfectly accurate forecasts are not available
because sales depends on uncertain future state of:– (1) Economy– (2) Industry– (3) Company
• Scenario analysis should be used to examine what happens under various assumptions and states:– (1) Most Likely Worst-case– (2) Most Likely, or Base-case– (3) Most Likely Best-case
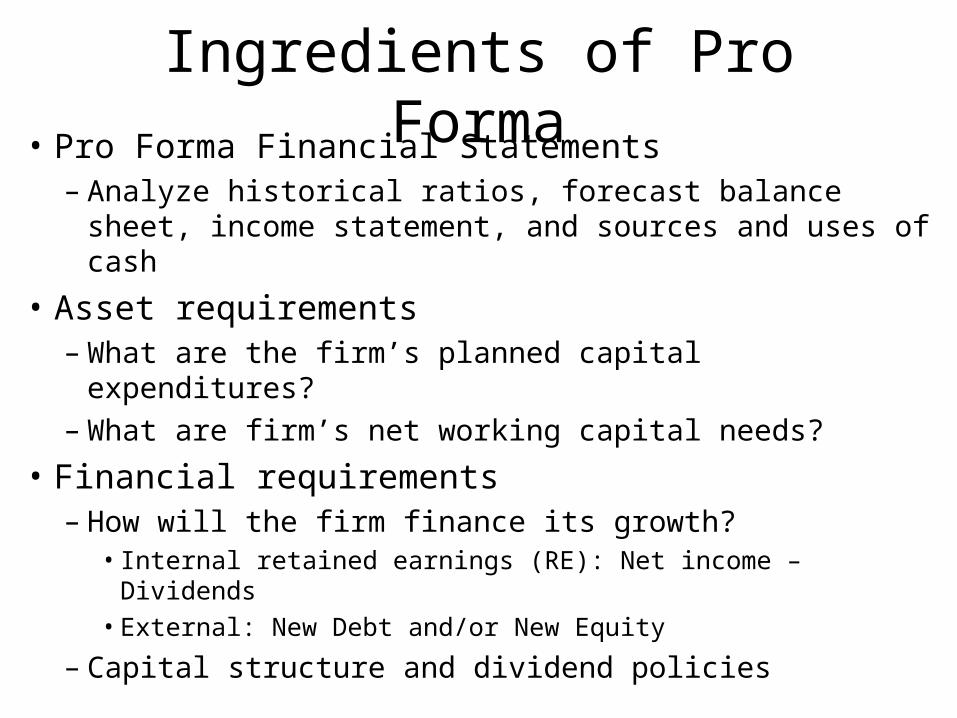
Ingredients of Pro Forma• Pro Forma Financial Statements
– Analyze historical ratios, forecast balance sheet, income statement, and sources and uses of cash
• Asset requirements– What are the firm’s planned capital expenditures?– What are firm’s net working capital needs?
• Financial requirements– How will the firm finance its growth?
• Internal retained earnings (RE): Net income – Dividends
• External: New Debt and/or New Equity
– Capital structure and dividend policies

Ingredients of Pro Forma• Economic assumptions
– Interest rates, industry growth rates, etc.
• Plug– Pro forma will usually assume that sales, costs, and net
income grow at g1
– If pro forma assumes that assets and liabilities grow at g2, a third variable (e.g., equity) may be forced to grow at g3 in order to make the first two growth rates compatible and have the balance sheet identity hold:
EquityDebtAssets

Example: Pro Forma – The Plug
%20000,1$
200$arP
Sales
NetIncomeginrofitM
Income Statement 2008 Balance Sheet 2008
Sales $1,000 Assets $500 Debt $250
Costs 800 Equity 250
Net Income $ 200 Total $500 Total $500
– Assume all variables are directly tied to sales (i.e., grow at same rate) and current relations are optimal
– What happens to balance sheet and income statement if sales are forecast to increase by 20% in 2009?
1250$
250$
Equity
DebtuityDebt-to-Eq

Example: Pro Forma – The PlugIncome Statement 2009 Balance Sheet 2009
Sales $1,200 Assets $600 Debt $300
Costs 960 Equity 300
Net Income $ 240 Total $600 Total $600
– Net income is $240 in 2009– But equity only increased by $50 since we assumed it
grew at the same rate as sales– What does this imply about dividends?
– The firm must have paid $190 in dividends
50$240$ DivDivNIRE
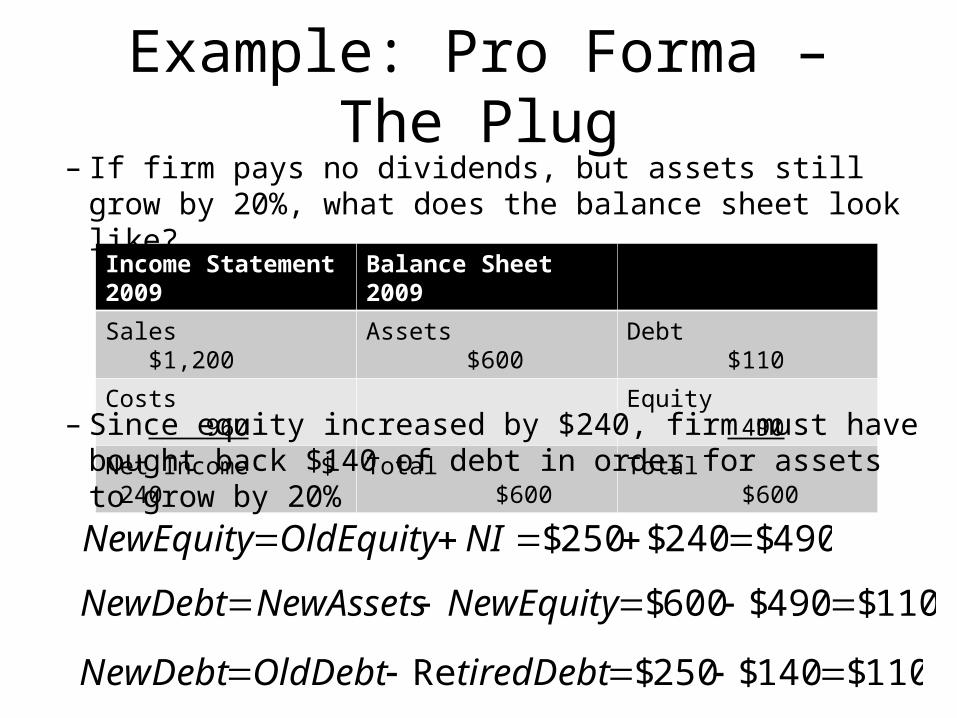
Example: Pro Forma – The Plug
Income Statement 2009 Balance Sheet 2009
Sales $1,200 Assets $600 Debt $110
Costs 960 Equity 490
Net Income $ 240 Total $600 Total $600
– If firm pays no dividends, but assets still grow by 20%, what does the balance sheet look like?
– Since equity increased by $240, firm must have bought back $140 of debt in order for assets to grow by 20%
490$240$250$ NIOldEquityNewEquity
110$490$600$ NewEquityNewAssetsNewDebt
110$140$250$Re tiredDebtOldDebtNewDebt

Percent of Sales Method• Most common technique to forecast balance sheet
and income statement– Begins with sales forecast expressed as an annual
growth rate in sales revenues– Assumes that many items on balance sheet and income
statement increase proportionally with sales• Forecasted value is % of forecasted sales
• Cash/Sales next year = Cash/Sales this year – Or average of Cash/Sales for past x years
– Remaining items that are not directly tied to sales depend on firm’s dividend policy and its use of debt versus equity financing

Percent of Sales Method– (1) Forecast sales
– (2) Analyze historical ratios• Percent of sales approach assumes costs/assets are a
specified percentage of that year’s sales
• Calculate ratio of costs and/or assets to sales in past years and assume ratio remains constant in the future
– (3) Forecast income statement• Note: Interest expense is function of amount of debt and
interest rate, and is not assumed to be fixed percent of sales
• Tax rate and depreciation also not generally assumed to be fixed percent of sales

Percent of Sales Method– (4) Forecast balance sheet
• Note: Firms rarely issue common stock or preferred stock, so their forecasts are usually equal to last year’s amount
• Further, we usually assume that firms will not issue any new long-term debt, which often requires approval of board of directors
• Change in RE is function of net income and dividends paid
– (5) Given above forecasts, are additional funds needed?
• Compare forecasted assets to forecasted liabilities + equity

Percent of Sales Method• Current sales = $20,000,000,
and are expected to grow at 10% over the next year
• Assets and current liabilities vary directly with sales (stay same % of sales)
• Profit margin = 10%
• Dividend payout = 50%
• Given this information, forecast the firm’s pro forma balance sheet
Balance Sheet 2008
Current Assets $ 6,000,000
Fixed Assets 24,000,000
Total Assets $30,000,000
Current Liabilities $10,000,000
Long-Term Debt 6,000,000
Common Stock 4,000,000
Retained Earnings 10,000,000
Total Liabs & Equity $30,000,000

Percent of Sales Method
• The firm has $33M in assets, but only $32.1M in liabilities and equity, so it needs to issue $900,000 in external funds
Balance Sheet 2008 % of Sales Balance Sheet 2009
Current Assets $ 6,000,000 6/20 = 30% $ 6,600,000 ($22,000,000 x 0.3)
Fixed Assets 24,000,000 24/20 = 120% 26,400,000 ($22,000,000 x 1.2)
Total Assets $30,000,000 30/20 = 150% $33,000,000 ($22,000,000 x 1.5)
Current Liabilities $10,000,000 10/20 = 50% $11,000,000 ($22,000,000 x 0.5)
Long-Term Debt 6,000,000 Constant 6,000,000
Common Stock 4,000,000 Constant 4,000,000
Retained Earnings 10,000,000 11,100,000*
Total Liabs & Equity $30,000,000 $32,100,000
000,100,11$5.0)1.0000,000,22($000,000,10$* oREAdditionsTOldRENewRE
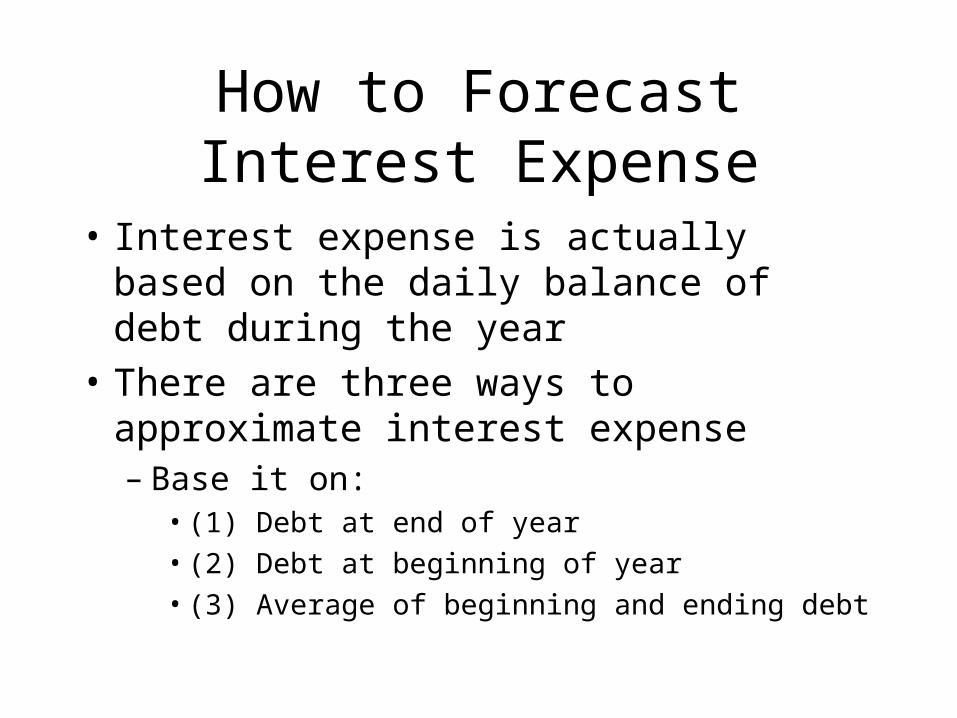
How to Forecast Interest Expense
• Interest expense is actually based on the daily balance of debt during the year
• There are three ways to approximate interest expense– Base it on:
• (1) Debt at end of year
• (2) Debt at beginning of year
• (3) Average of beginning and ending debt

Forecasting Interest Expense• (1) Base interest expense on debt at end of year
• Will over-estimate interest expense if debt is added throughout the year instead of all on January 1st
• Causes circularity called financing feedback – more debt causes more interest, which reduces net income, which
reduces retained earnings, which causes more debt, etc.
• (2) Base interest expense on beginning of year debt• Will under-estimate interest expense if debt is added throughout the
year instead of all on December 31st
• But doesn’t cause problem of circularity
• (3) Base interest expense on average debt• Will accurately estimate interest payments if debt is added smoothly
throughout year
• But also has problem of circularity
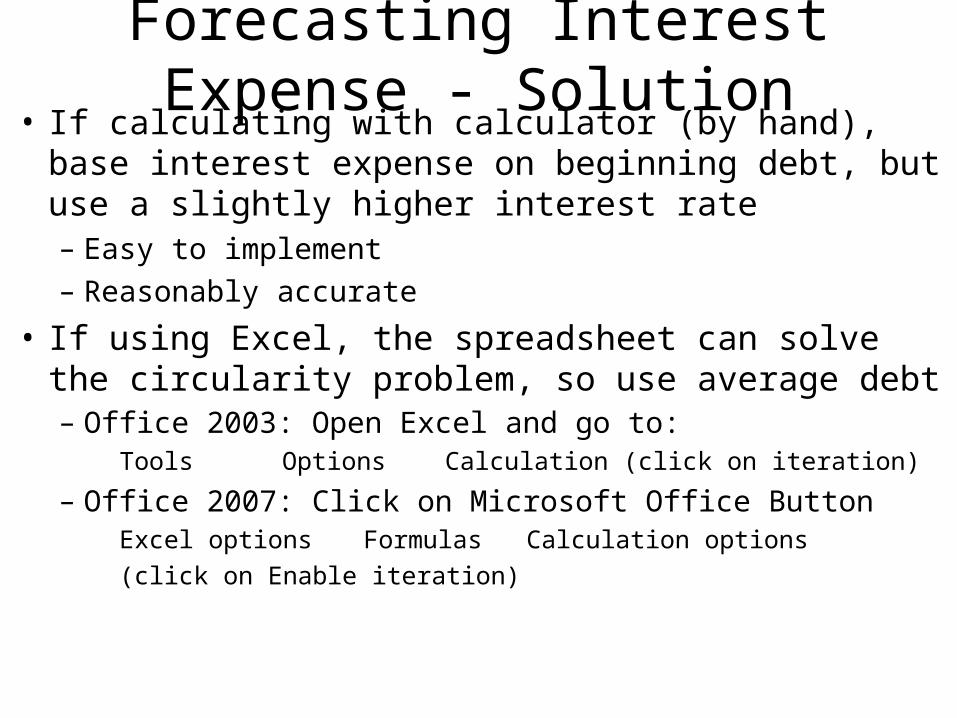
Forecasting Interest Expense - Solution• If calculating with calculator (by hand), base interest
expense on beginning debt, but use a slightly higher interest rate– Easy to implement
– Reasonably accurate
• If using Excel, the spreadsheet can solve the circularity problem, so use average debt– Office 2003: Open Excel and go to:
Tools Options Calculation (click on iteration)
– Office 2007: Click on Microsoft Office ButtonExcel options Formulas Calculation options
(click on Enable iteration)

Additional Funds Needed (AFN)• If ratios are expected to remain constant, the following
formula can be used to forecast funds needed:
Where A are the assets tied directly to sales
L are the liabilities tied directly to sales
S0 is this year’s sales
∆S is the change in sales
S1 is next year’s projected sales
p is the profit margin
RR is the retention ratio, or (1 – dividend payout ratio)
RRSpSS
LS
S
AAFN
1
00

Additional Funds Needed (AFN)• Using the information from our previous example:
Where A = $30 million (i.e., total assets)
L = $10 million (i.e., current liabilities)
S0 = $20 million (i.e., given)
S1 = $22 million (i.e., $20 x 1.1)
∆S = $2 million (S1 – S0)
p = 0.10 (i.e., given)
RR = 1 – 0.5 (i.e., dividend payout ratio given)
MMMM
MM
M
MAFN 9.0$)5.01(22$1.02$
20$
10$2$
20$
30$

Problems with AFN and Percent of Sales Methods
• In reality, these models are too simple– Costs are not always proportional to sales
– Assets are not always a fixed proportion of sales, etc.• Economies of scale may result in the ratios changing over time as
firm size increase
• Fixed assets may be “lumpy” and need to be added in large, discrete units
• Excess capacity can allow sales to grow with no increase in fixed assets
• Percent of sales is only a starting point– Use common sense and your knowledge of the firm to think
more deeply about what items might deviate from a constant proportion

What Determines Sales Growth?• Firms frequently make sales growth assumptions a part
of the planning process
• We know, however, that the goal of management should be shareholder wealth maximization
• Thus, growth should not be a goal in and of itself, but a consequence of decisions that maximize NPV
• Otherwise, if management accepts negative NPV projects just to grow the firm, shareholders (but not necessarily managers) will be worse off!
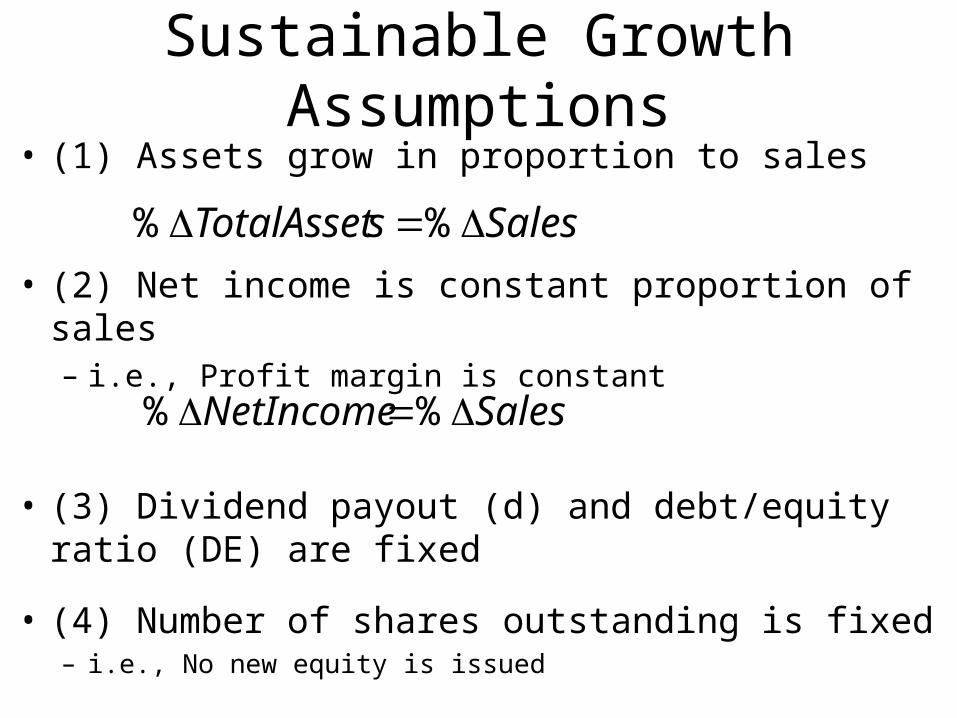
Sustainable Growth Assumptions• (1) Assets grow in proportion to sales
• (2) Net income is constant proportion of sales– i.e., Profit margin is constant
• (3) Dividend payout (d) and debt/equity ratio (DE) are fixed
• (4) Number of shares outstanding is fixed– i.e., No new equity is issued
SalessTotalAsset %%
SalesNetIncome %%

Sustainable Growth Assumptions• Under the previous assumptions, the amount by which
a firm can increase sales without increasing leverage (i.e., total debt/total assets) or issuing new equity is fixed and given by:
Where , , ,
• Approximation:
Where ,
)1()1(
)1()1(
DEdpT
DEdp
Sales
Sales
Sales
NetIncomep
NetIncome
Dividendsd
Equity
DebtDE
Sales
sTotalAssetT
)1( dROESales
Sales
1'
t
t
EquityrsShareholde
NetIncomeROE purchasesShareymentsDividendPad Re

Sustainable Growth Assumptions• Assumptions 1 and 2 hold investment policy and ROI
constant
• Assumptions 3 and 4 hold dividend and financing policies constant
• The formula says that a firm’s sustainable growth depends on profit margin, asset turnover, dividend policy, and capital structure
• Firm cannot grow faster than ∆S/S, unless– (1) Issue new equity
– (2) Change one of the factors in sustainable growth formula• Decrease dividend payout, Increase profit margin, or ∆ capital
structure

Example: Sustainable Growth
p = profit margin = 10%
T = total assets/sales = 150%
DE = D/E = 100%
D = dividend payout = 50%
• If firm does not want to grow, what would it need to do?– Change dividend payout to 100%!
)1()1(
)1()1(
DEdpT
DEdp
Sales
Sales
%14286.7)11()5.01(1.05.1
)11()5.01(1.0
Sales
Sales

Uses of Sustainable Growth
• Bankers and credit analysts use sustainable growth formula to assess a firm’s creditworthiness
• If actual growth consistently exceeds sustainable growth, borrower runs the risk of “growing broke” unless it can continue to raise external funds

Thank You!
Charles B. (Chip) Ruscher, PhD
Department of Finance and Business Economics