lecture ricardo v. lago (feb 16 ,2009 ) : bail-out and stimulus : will they work ?
DESCRIPTION
The problems confronting the US and internatiomal economies and the possible outcomes in the coming months . A central question for individuals and families : where do I invest my money ?TRANSCRIPT

PROF JULIE ZENG’s GRADUATE SEMINAR INTERNATIONAL
RELATIONS
16TH February ,2009 Florida InternaHonal University
Ricardo Lago Economist and Consultant
Former Senior of the EBRD, The World Bank , IADB Former Director of Economic Policy of the Treasury of
Mexico
1

BAIL‐OUTS & STIMULUS : WILL THEY WORK ?

THEMES
Bail outs
SHmulus
Investments
BAIL OUTS

MONETARY STIMULUS

FISCAL STIMULUS

WHERE DO I PUT MY MONEY ?

THREE GENERAL REFLECTIONS
• THE TALE THAT SUB‐PRIME MORTGAGES WERE THE CAUSE OF THE CRISIS IS SIMPLISTIC AND FLAWED . SUB‐PRIME WAS THE FIRST MANIFESTATION OF A BROADER AND DEEPER PROBLEM
• IN THE 1990s and 2000s LIKE IN THE 1920s : WE HAD ENTERED AN ERA OF
– InnovaHon and fast producHvity growth – Great expectaHons : prosperity was here to stay! – Easy money and excessive consumer spending in US and Europe
– High leverage raHos – Regulators : too many , too uncoordinated , looking at the wrong
thing in the wrong places, and red‐taping everyone with costs
• FREE MARKETS WORK .THE PROBLEM IS THAT USA AND EUROPE ARE DEPARTING FROM THE RULES AND ETHICS OF FREE MARKETS

9
Look at Peru with free markets 18 years : the point of departure was complete chaos in 1990
(Average anual GDP growth 2002- 2008)

TWO ERAS OF UNPRECEDENTED PROSPERITY
• IN THE 1920s – InnovaHons : radio , electrificaHon , and telephone – Market expansion : the resumpHon of mulHlateral trade a^er World War I
• IN THE 1990s and 2000s – InnovaHons : PCs , Cellphones , and Internet – Market expansion : incorporaHon of China , India and Eastern Europe to world trade
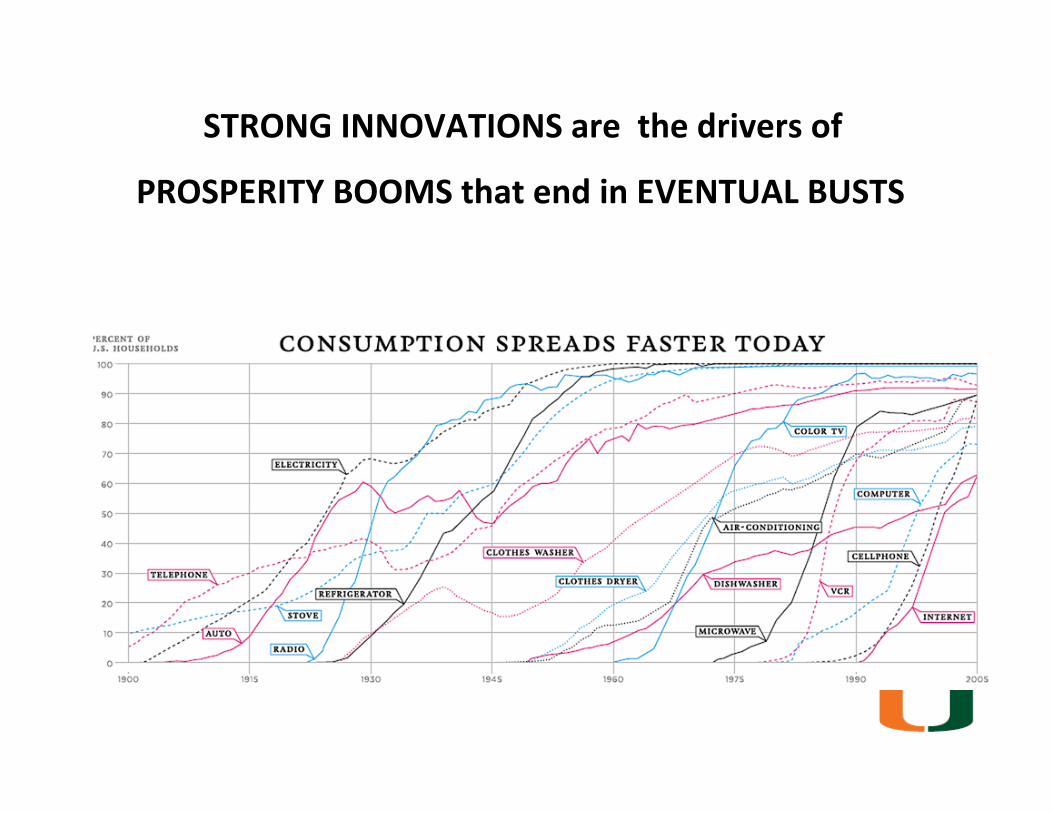
STRONG INNOVATIONS are the drivers of
PROSPERITY BOOMS that end in EVENTUAL BUSTS
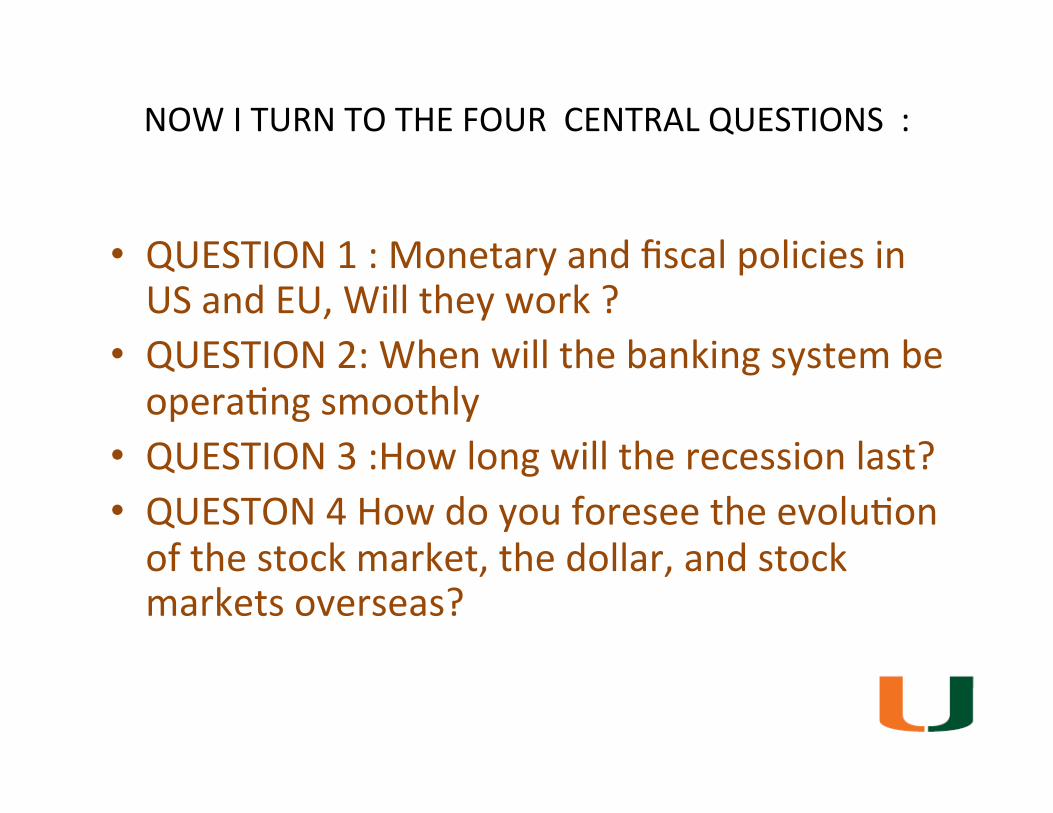
NOW I TURN TO THE FOUR CENTRAL QUESTIONS :
• QUESTION 1 : Monetary and fiscal policies in US and EU, Will they work ?
• QUESTION 2: When will the banking system be operaHng smoothly
• QUESTION 3 :How long will the recession last? • QUESTON 4 How do you foresee the evoluHon of the stock market, the dollar, and stock markets overseas?

QUESTION 1
Monetary and fiscal policies in US and EU, Will they work ?

MONETARY STIMULUS

TRIVIA QUESTION
What is the cost of producing a US$100 dollar note ?

ANSWER
• During 2008 the Bureau of Engraving and Prin0ng delivered 7.7 billion notes
• At an average cost of 6.4 cents per note.

INJECTING LIQUIDITY
• Then , where is the liquidity problem if US$100 notes can be produced at 6.4 cents each
• The Federal Reserve can produce dollars at a profit of US$99.93 each and inject as many as needed
• Is this the right thing to do ? • Is it all that easy ? • The short answer is clearly : NO

Vernon Smith , Nobel Laureate to WSJ
“Why is this crash a classic? In every market, there is ul0mately only one source of
liquidity: buyers. And this is what central bankers hope to see return when they speak euphemis0cally of restoring
confidence.All other sources of liquidity are stop gaps,bridges,
band aids, and now a duct‐tape bailout. Every seller in dire need of a buyer is in a liquidity crisis”

MACROECONOMICS 101 – MONEY SUPPLY • MONETARY BASE (MB)
– The Fed lends to banks , to the government ( by buying TBs or long bonds) , to others , or buys foreign currencies
– How ? : by wriHng checks on itseld , i.e. by prinHng money • MONEY SUPPLY MULTIPLIER (k)
– That money ends in people’s pockets , part they keep it in the pocket and part they deposit in the banks
– Banks invest the deposits either in loans to business or to people or else leave it idle as Reserves (in TBs or at the Fed)
• MONEY SUPPLY (M)
M =MB x K

WHAT IS HAPPENING NOW WITH MONEY SUPPLY GROWTH ?
• Monetary Base (MB) is growing at a huge 144% p.a. • Monetary Supply (M2) is growing at 7.6% p.a • Hence , the MulHplier (k) has declined by 56% p.a
• CONCLUSION : – Fed is prinHng to much money – Individuals are keeping much of it in cash – Banks are accumulaHng reserves rather than lending
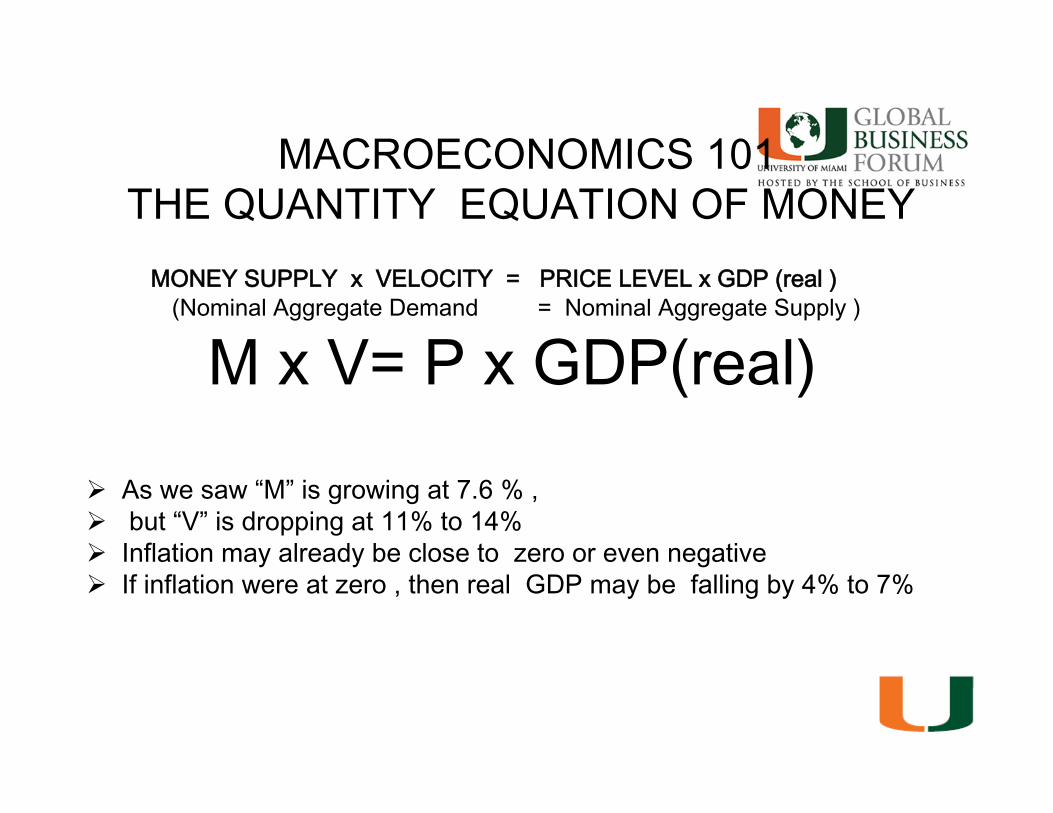
MACROECONOMICS101THEQUANTITYEQUATIONOFMONEY MONEYSUPPLYxVELOCITY=PRICELEVELxGDP(real)
(NominalAggregateDemand=NominalAggregateSupply)
MxV=PxGDP(real)
Aswesaw“M”isgrowingat7.6%, but“V”isdroppingat11%to14% Inflationmayalreadybeclosetozeroorevennegative Ifinflationwereatzero,thenrealGDPmaybefallingby4%to7%
FISCAL ESTIMULUS

MACROECONOMICS 101 FISCAL POLICY
• THE PEOPLE DO NOT CONSUME MUCH , AND BUSINESS DO NOT INVEST ENOUGH
• WHY NOT HAVE THE GOVERNMENT SPEND MORE TO MAKE UP FOR IT !
• PRESIDENT OBAMA’S 800 ‐Billion DOLLAR STIMULUS PLAN AND OTHERS
• WILL IT WORK ?

FISCAL STIMULUS INTERNATIONAL COORDINATION
• IDEAL SCENARIO ( US$ 3 TRILLION OR 6% of World GDP) – THE CREDITOR COUNTRIES ( CHINA ,GULF COUNTRIES , ETC ) SHOULD HAVE TAKEN MUCH MORE OF THE STIMULUS BURDEN
– IT IS A PROBLEM THE DEBTOR NATIONS , UK , US, , EUROPEAN UNION AND OTHERS ARE PILING UP MORE DEBT

Everet Dirksen’s famous quote Republican Senator from Illinois 1932‐69
"A billion here, a billion there, preIy soon, you're talking real money"

DOES IT MEAN THAT THERE HAS BEEN NO STIMULUS IN THE USA SO FAR ?
• BUT SO FAR THERE HAVE BEEN ALREADY A MYRIAD OF VERY EXPENSIVE PUBLIC INTERVENTIONS . RESCUE AND /OR STIMULUS HOWEVER WE WANT TO CALL THEM
• BAIL OUTS : TARP , BEAR STERNS , AIG , FANNIE , FREDDY , AUTO INDUSTRY , SEVERAL FED SCHEMES ETC ETC
• FURTHER , IN 2008 THERE WAS A TAX REDUCTION STIMULUS PACKAGE FO US$150 billion .
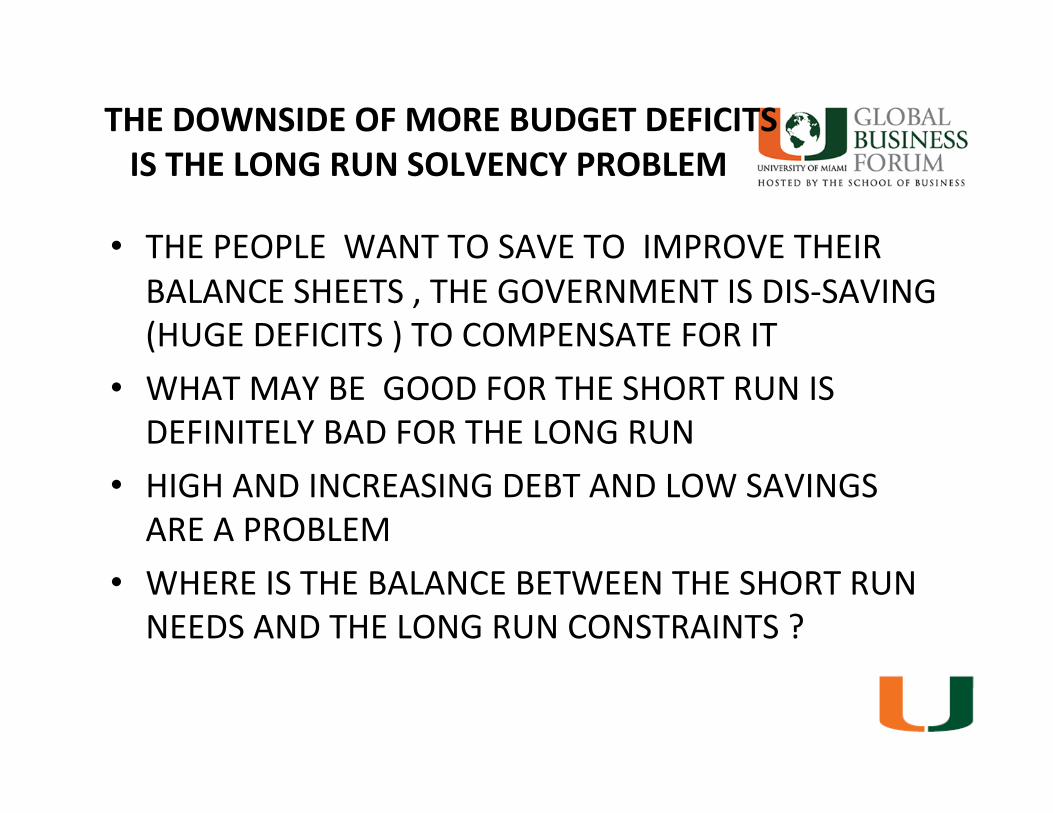
THE DOWNSIDE OF MORE BUDGET DEFICITS IS THE LONG RUN SOLVENCY PROBLEM
• THE PEOPLE WANT TO SAVE TO IMPROVE THEIR BALANCE SHEETS , THE GOVERNMENT IS DIS‐SAVING (HUGE DEFICITS ) TO COMPENSATE FOR IT
• WHAT MAY BE GOOD FOR THE SHORT RUN IS DEFINITELY BAD FOR THE LONG RUN
• HIGH AND INCREASING DEBT AND LOW SAVINGS ARE A PROBLEM
• WHERE IS THE BALANCE BETWEEN THE SHORT RUN NEEDS AND THE LONG RUN CONSTRAINTS ?

THE PUBLIC DEBT BUILD UP IS A SERIOUS PROBLEM
• THE UNDERFUNDING OF SOCIAL SECURITY AND MEDICARE
• PLUS THE GROWING INTEREST PAYMENTS ON THE PUBLIC DEBT
• LOOK AT THE PROJECTION PATH FORECASTED BY THE GOVERNMENT ACCOUNTABILITY OFFICE (a department of the Federal Government )
• AND THAT PROJECTION WAS IN 2007 ,BEFORE THE MELTDOWN
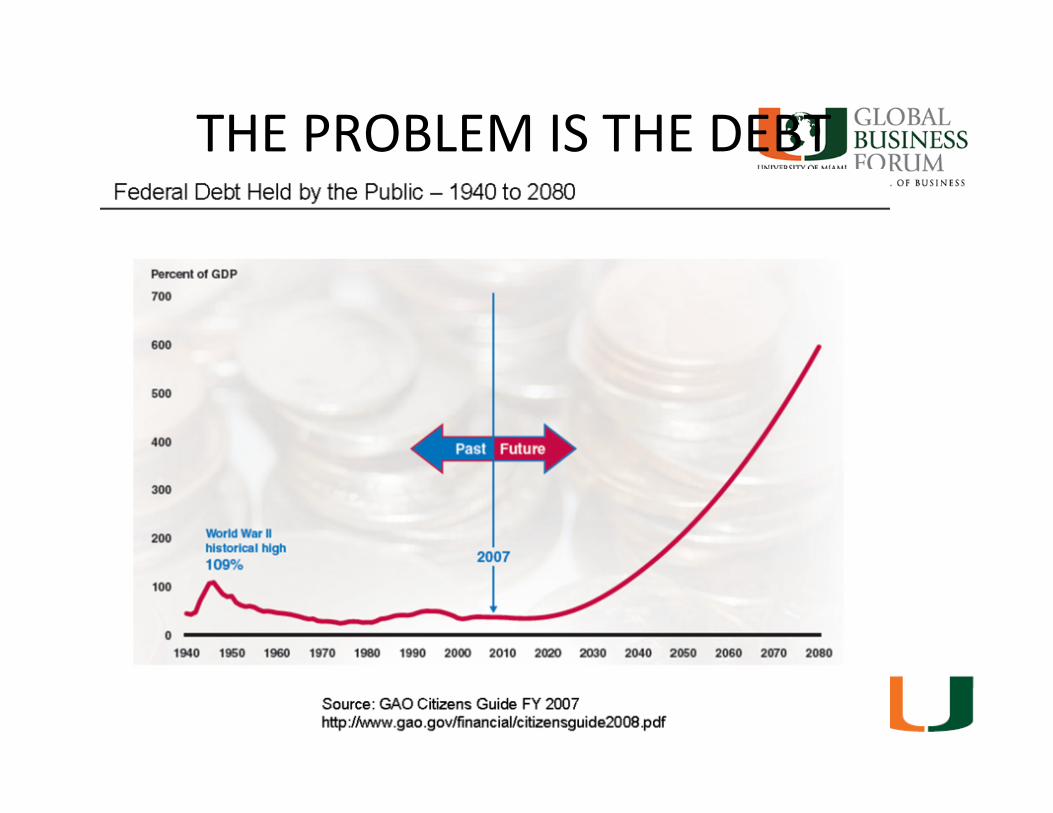
THE PROBLEM IS THE DEBT

LET ME ILLUSTRATE THE PROBLEM OF THE UNDERFUNDING OF SOCIAL SECURITY WITH AN ELOQUENT CARTOON

BERNIE MADOFF

THE WAY OUT OF THE RECESSION
• SO WHERE ARE WE HEADING FOR IN THE NEXT 2 TO 3 YEARS
• TWO POSSIBILITIES : – One very bad : DeflaHon and stagnaHon – The other less bad : high inflaHon and weak recovery

THE WAY OUT OF THE RECESSION : THE RAZOR BLADE PATH PROBLEM
• DEFLATION MOOD , NO GROWTH SCENARIO : JAPAN ( 1991 to PRESENT )
– GDP STAGNATION – PERPETUATION OF INSOLVENT BANKS – TOO MUCH FISCAL ACTIVISME AND EXPLODING PUBLIC DEBT
• HIGH INFLATION , RACHITIC GROWTH SCENARIO
– REWINDING OF THE BALANCE SHEET OF THE FED– ONCE MONEY MULTIPLIER AND VELOCITY PICK UP – AND BALANCING THE BUDGET MAY BE DIFFICULT TO STAGE
– RISK OF FALLING INTO HIGH INFLATION OR EVEN HYPERINFLATION
– VERY WEAK GDP RECOVERY
• I THINK THE LATTER IS MORE LIKELY

QuesHon 2
When will the banking system be operaHng smoothly?

WILL IT WORK ?

• WHEN INSOLVENT BANKS ARE WOUND UP OR PROPERLY CAPITALIZED
• WHEN BANKING INTERMEDIATION SHRINKS TO THE REAL VALUE OF THE ASSETS : MAL‐INVESTMENTS ARE WRITTEN OFF
• WHEN LEVERAGE RATIOS ARE BROUGHT DOWN TO REASONABLE LEVELS
• AS STOCK MARKETS SEE THE LIGHT AT THE END OF THE TUNNEL

QUESTION 3
How long will the recession last?
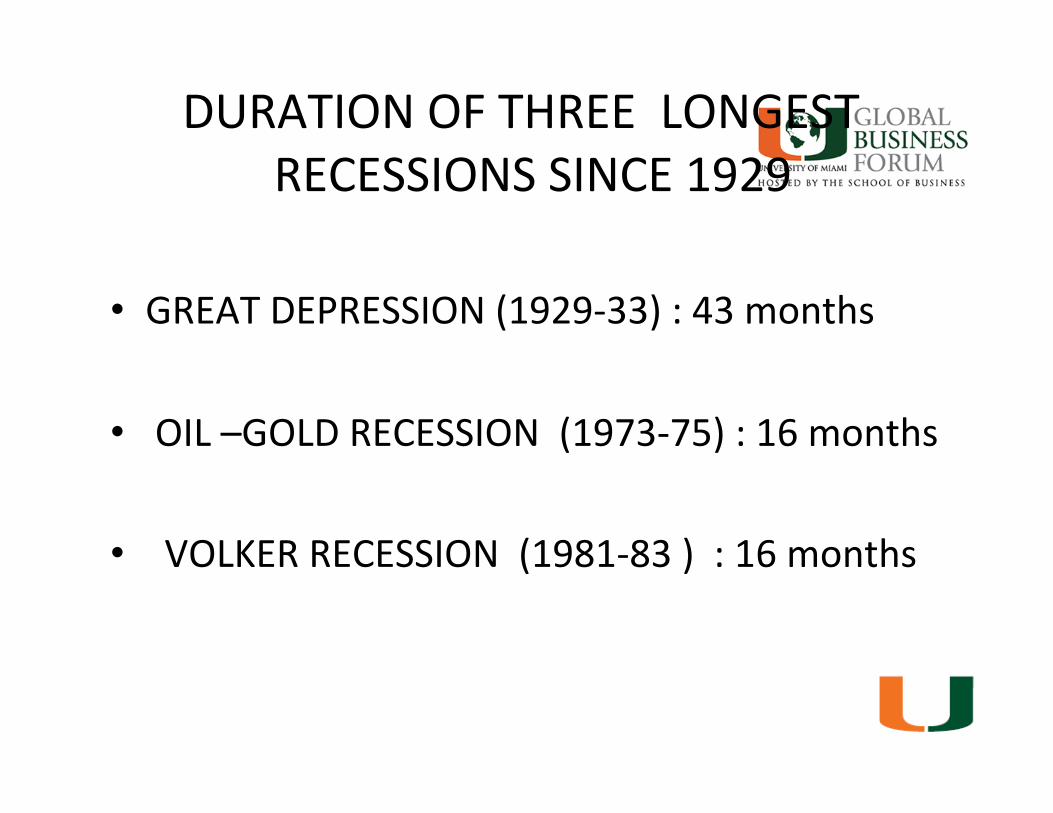
DURATION OF THREE LONGEST RECESSIONS SINCE 1929
• GREAT DEPRESSION (1929‐33) : 43 months
• OIL –GOLD RECESSION (1973‐75) : 16 months
• VOLKER RECESSION (1981‐83 ) : 16 months

THE SMOOT‐HOWLEY ACT OF 1930
Willis Hawley, a congressman from Oregon,
and Reed Smoot, a senator from Utah

1929 ‐1933 Collapse of Word Trade
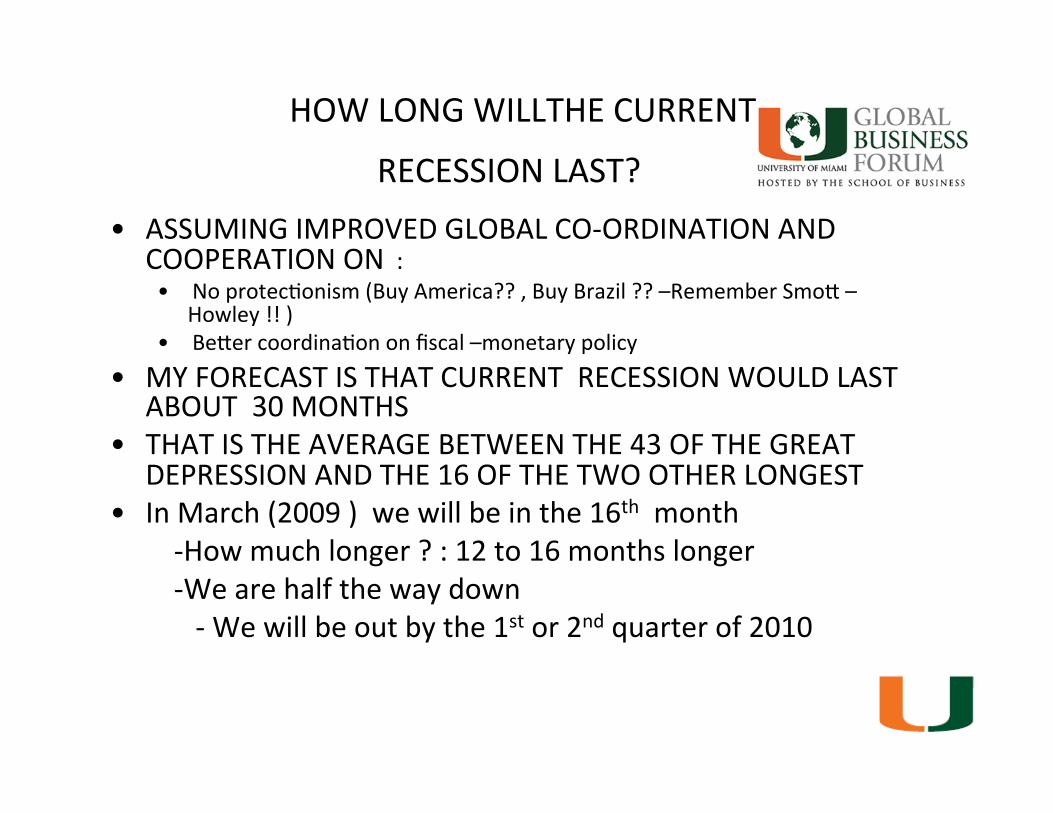
HOW LONG WILLTHE CURRENT
RECESSION LAST? • ASSUMING IMPROVED GLOBAL CO‐ORDINATION AND
COOPERATION ON : • No protecHonism (Buy America?? , Buy Brazil ?? –Remember Smos –
Howley !! ) • Beser coordinaHon on fiscal –monetary policy
• MY FORECAST IS THAT CURRENT RECESSION WOULD LAST ABOUT 30 MONTHS
• THAT IS THE AVERAGE BETWEEN THE 43 OF THE GREAT DEPRESSION AND THE 16 OF THE TWO OTHER LONGEST
• In March (2009 ) we will be in the 16th month ‐How much longer ? : 12 to 16 months longer ‐We are half the way down ‐ We will be out by the 1st or 2nd quarter of 2010

QUESTION 4 How do you foresee the evoluHon of the stock market, the dollar, and stock markets overseas?

WHERE DO I PUT MY MONEY ?

Ranking of currencies with beser to worse perspecHves
• Gold • Some emerging countries currencies : Yuan, Real , Chilean Peso ,Sol
• Euro • Dollar • Yen • Sterling Pound

Best Stock markets
• BRICs and some other emerging markets – They will be leading the recovery
• US : Technology Stocks (Nasdaq 100) – They are global companies with lots of cash and no debt – These are growth‐stocks now discounted to price mulHples of value‐stocks

Treasury Bills
• If you have any bonds ( maturiHes 3 years of longer ) of the US , UK , and many European countries , dump them as quickly as you can
• If you are a more sophisHcated investor then sell them short

STOCK MARKETS
• US and other stock markets are massively undervalued by any standard
• The problem is not figuring out the prospects of the stocks themselves ,
• The problem is the value of the dollar and the Euro , and the other currencies agaisnt themselves and of all of them against gold

WHY ARE STOCKS MASSIVELY UNDERVALUED ?
• Because in the last 200 years the value of stocks ( inclusive of reinvestment of dividends ) has scasered year
a^er year around an exponenHal line • This exponenHal line shows an average real return of 6.6%
per year • The deviaHon from that line can be as much as :
+100% in an extreme Bull market ‐50% in a extreme Bear market
• But has not exceeded those boundaries on a year average basis
• Note , though, that the range of deviaHon is huge : if being right on the line the value is 100 , the upper bound can be as high as 200 and the lower bound as low as 50 !
• That is the upper bound is 4 Hmes the lower bound

WHY ARE US STOCKS MASSIVELY UNDERVALUED ?
• Because in the last 200 years their value ( inc. Reinvestment of dividends ) has scasered year a^er year around an exponenHal line
• This exponenHal line shows a real return of 6.6% per year
• The deviaHon from that line can be as much as : +100% in an extreme Bull market ‐50% in an extreme Bear market
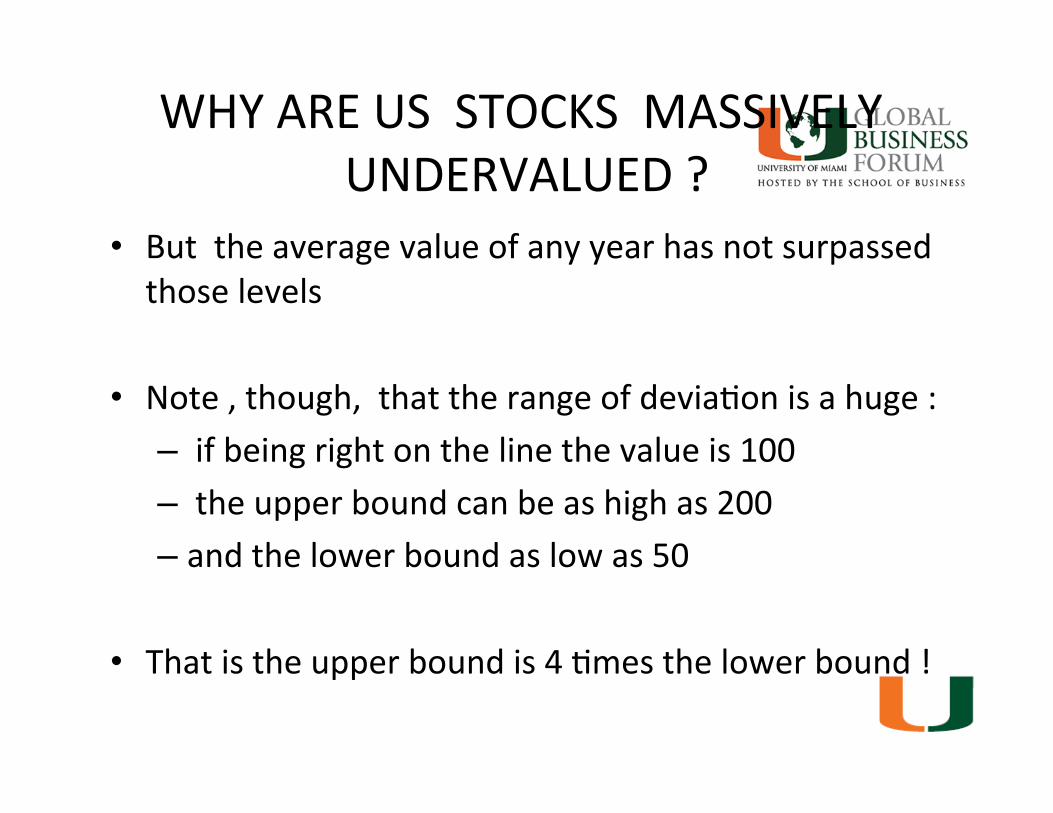
WHY ARE US STOCKS MASSIVELY UNDERVALUED ?
• But the average value of any year has not surpassed those levels
• Note , though, that the range of deviaHon is a huge : – if being right on the line the value is 100 – the upper bound can be as high as 200 – and the lower bound as low as 50
• That is the upper bound is 4 Hmes the lower bound !

LET ME USE AN EXAMPLE

• IF WE PLOT THE CHART IN LOGARITHMIC PAPER : IT FLATTENS THE VERTICAL AXIS HENCE , CONVERTING :
– 10 into 1 – 100 into 2 – 1000 into 3 – 10000 into 4 – And so on
• AND WITH TH REAL DATA OF 200 YEARS WE GET SOMETHING LIKE THAT…………

THEN WE GET ….

And where are we now ?

SO WHY ARE US AND OTHER STOCKS MASSIVELY UNDERVALUED ?
• Because at the lowest point on November 21st ,2008 , stocks prices were precisely below the line by exactly ‐ 50%
• Today , January 15th , stocks prices are below the line ‐42%

THE TWO REAL THREATS IN THE MONTHS AHEAD
• ON THE INFLATION FRONT THE MONETARY AND FISCAL STIMULUS MAY GET US OUT OF
DEFLATION /DEPRESSION BUT WITH HYPERINFLATION AND RACHITIC GDP RECOVERY
• ON THE REAL GDP FRONT A RETURN TO PROTECTIONISM : STRAIGHT OR IN DISGUISE (Buy Spain , Buy America , Buy Brazil, etc )
• HENCE , NEED FOR GLOBAL CO‐ORDINATION ON FREE TRADE AND ON FISCAL /MONETARY STIMULUS

Now going back to our friend Ben Franklin in the US$100 note
….

What is he telling me?

Franklin’s most famous quote !
“We must, indeed, all hang together or,
most assuredly,
we shall all hang separately”