lecture material 05 - cheric · ti me pr obability pr obability of m issing ... te, new period of...
TRANSCRIPT

Risk Assessment

Components
Identify hazards using PHA methods
Identify scenarios for hazards to cause
incidents, e.g., using HAZOP
Assess consequences of events
Estimate probabilities of events using
failure rate data
Risk comparisons, reductions, and risk
management
The Problem Example
You have a very important appointment
tomorrow at 9:00 a.m. The distance
between your house and the interview
location is 10 miles and under best
conditions it would take you 15 minutes
to get there by car.
What time will you leave your house?

Risk Table Example
Scenario Likelihood Consequence

Risk TableExample
Scenario Likelihood Consequence
(minutes
delayed)1. Car does not start Low 5
2. Car breaks down
enroute
Very low 30
3. Minor traffic
congestion
High 10
4. Severe traffic
congestion
Moderate 20
5. Police stops you Low 15
6. Minor accident Low 30
7. Major accident Very low 2 hours
Calibrating the Likelihood Example
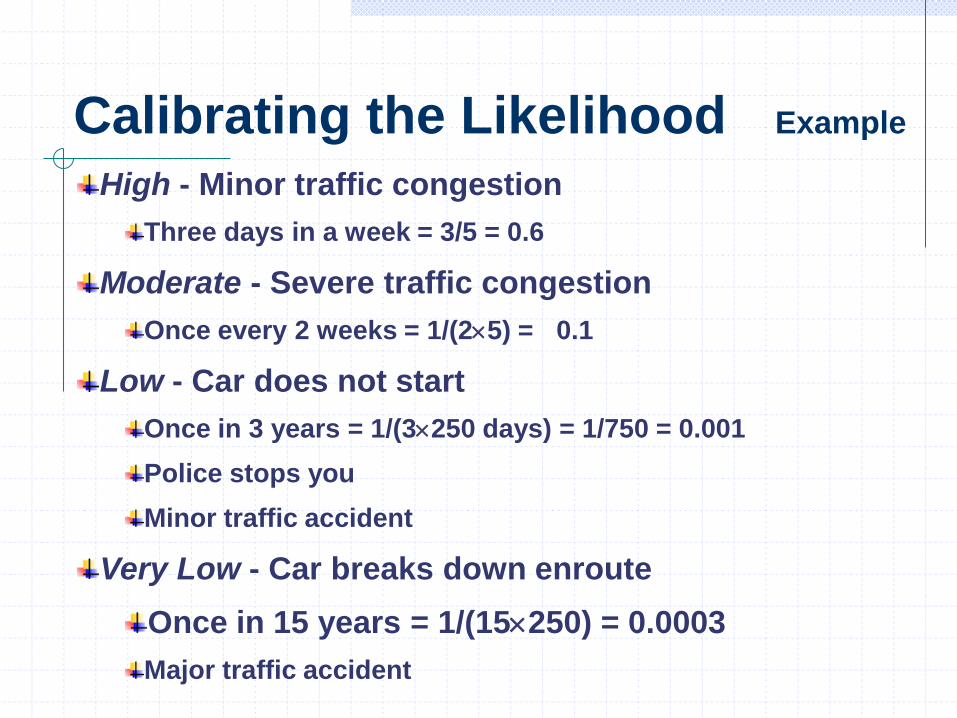
High - Minor traffic congestion
Three days in a week = 3/5 = 0.6
Moderate - Severe traffic congestion
Once every 2 weeks = 1/(25) = 0.1
Low - Car does not start
Once in 3 years = 1/(3250 days) = 1/750 = 0.001
Police stops you
Minor traffic accident
Very Low - Car breaks down enroute
Once in 15 years = 1/(15250) = 0.0003
Major traffic accident
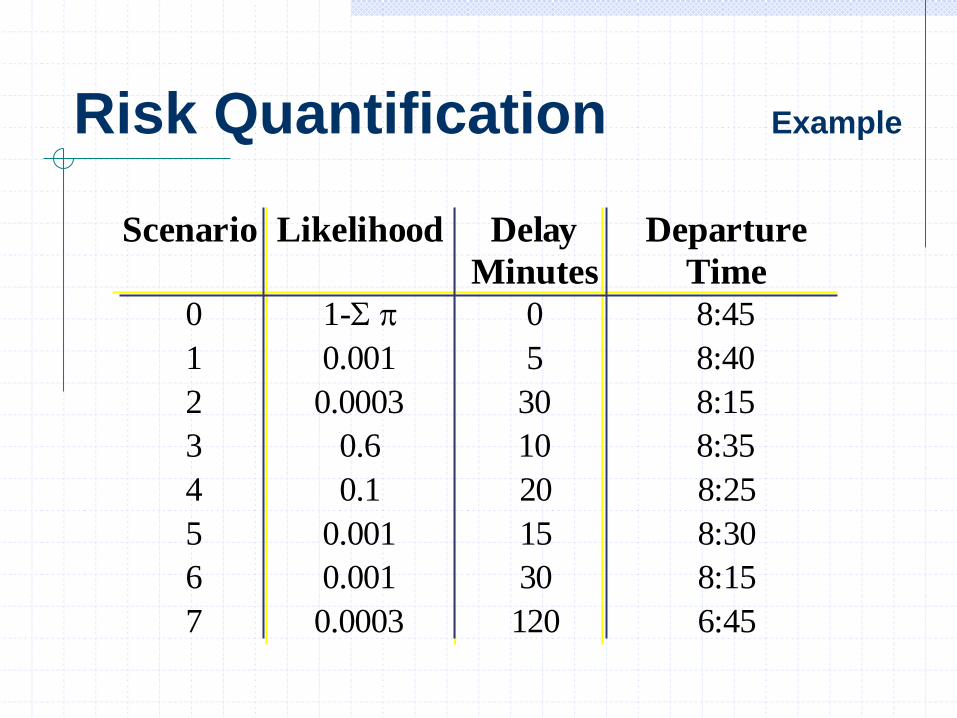
Risk Quantification Example
Scenario Likelihood Delay
Minutes
Departure
Time
0 1- 0 8:45
1 0.001 5 8:40
2 0.0003 30 8:15
3 0.6 10 8:35
4 0.1 20 8:25
5 0.001 15 8:30
6 0.001 30 8:15
7 0.0003 120 6:45
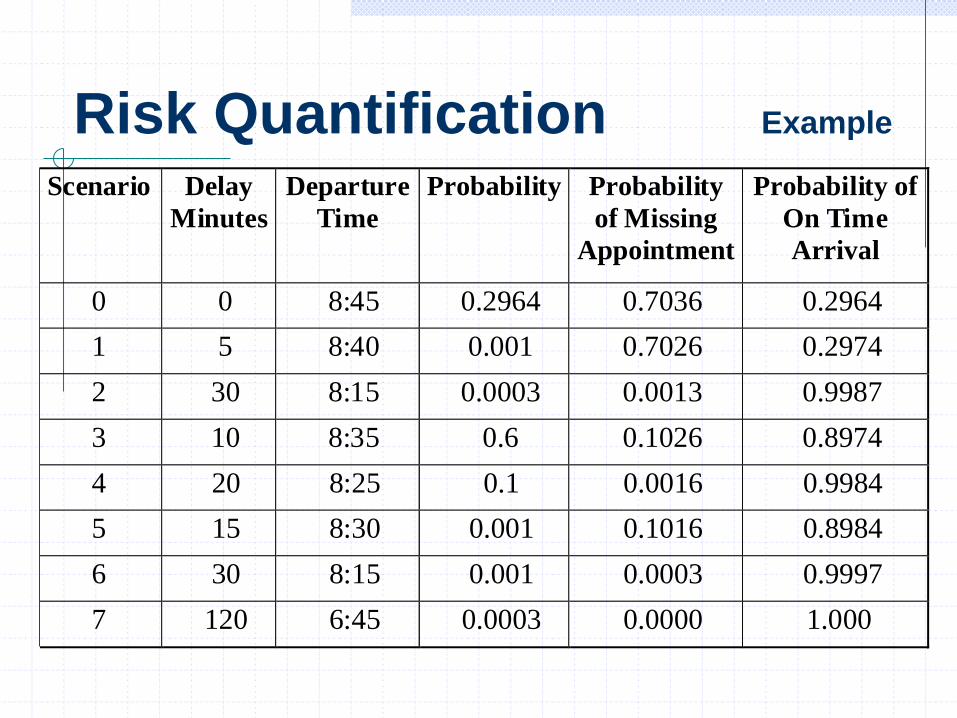
Risk Quantification Example
Scenario Delay
Minutes
Departure
Time
Probability Probability
of Missing
Appointment
Probability of
On Time
Arrival
0 0 8:45 0.2964 0.7036 0.2964
1 5 8:40 0.001 0.7026 0.2974
2 30 8:15 0.0003 0.0013 0.9987
3 10 8:35 0.6 0.1026 0.8974
4 20 8:25 0.1 0.0016 0.9984
5 15 8:30 0.001 0.1016 0.8984
6 30 8:15 0.001 0.0003 0.9997
7 120 6:45 0.0003 0.0000 1.000

Risk Curve Example
0
0.1
0.2
0.3
0.4
0.5
0.6
0.7
0.8
0.9
1
8:45 8:40 8:35 8:30 8:25 8:15 8:15 6.45
Departure Time (a.m.)
Pro
ba
bil
ity
of
La
te A
rriv
al
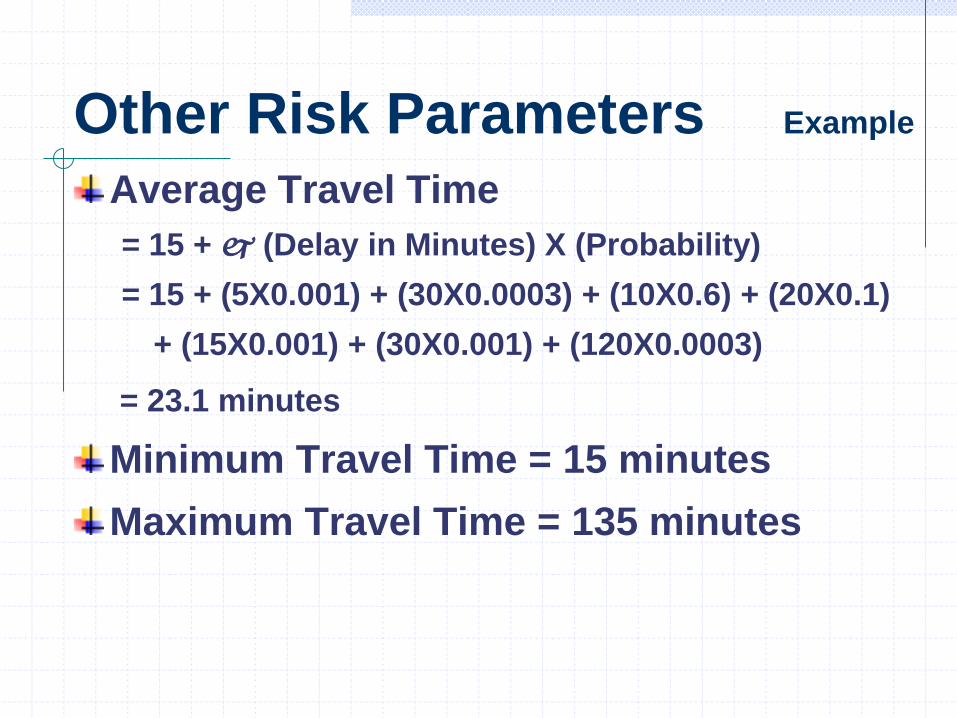
Other Risk Parameters Example
Average Travel Time
= 15 + (Delay in Minutes) X (Probability)
= 15 + (5X0.001) + (30X0.0003) + (10X0.6) + (20X0.1)
+ (15X0.001) + (30X0.001) + (120X0.0003)
= 23.1 minutes
Minimum Travel Time = 15 minutes
Maximum Travel Time = 135 minutes
Fault Tree Analysis
Fault tree analysis (FTA) is a deductive
technique that focuses on one particular
incident and then constructs a logic
diagram of all conceivable event
sequence that could lead to the incident.
FTA identifies ways that hazards can
lead to incidents.
Fault Tree Analysis
PurposeTo identify failure pathways, both mechanical and human that could lead to an incident.
ApplicationsCan be used during design, modification, or operation of a facility
ResultsA set of logic diagrams that illustrate how certain combination failures and/or errors can result in specific incidents
Fault Tree Analysis
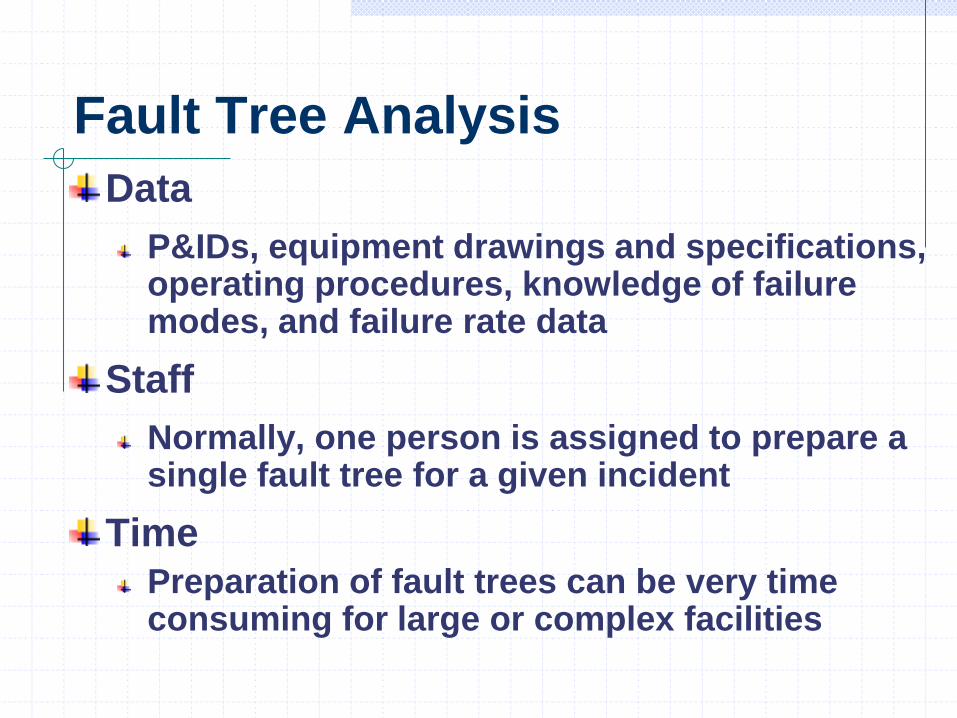
Data
P&IDs, equipment drawings and specifications, operating procedures, knowledge of failure modes, and failure rate data
Staff
Normally, one person is assigned to prepare a single fault tree for a given incident
Time
Preparation of fault trees can be very time consuming for large or complex facilities

Basic Components
Basic EventA basic initiating fault (e.g.,
component failure)
Intermediate
Event
Undeveloped
“And” Gate
“Or” Gate
Occurs as a result of events at a lower
level acting through logic gates
Undeveloped event due to lack of
information or significance
Output occurs if all input events occur
Output occurs if any input event
occurs
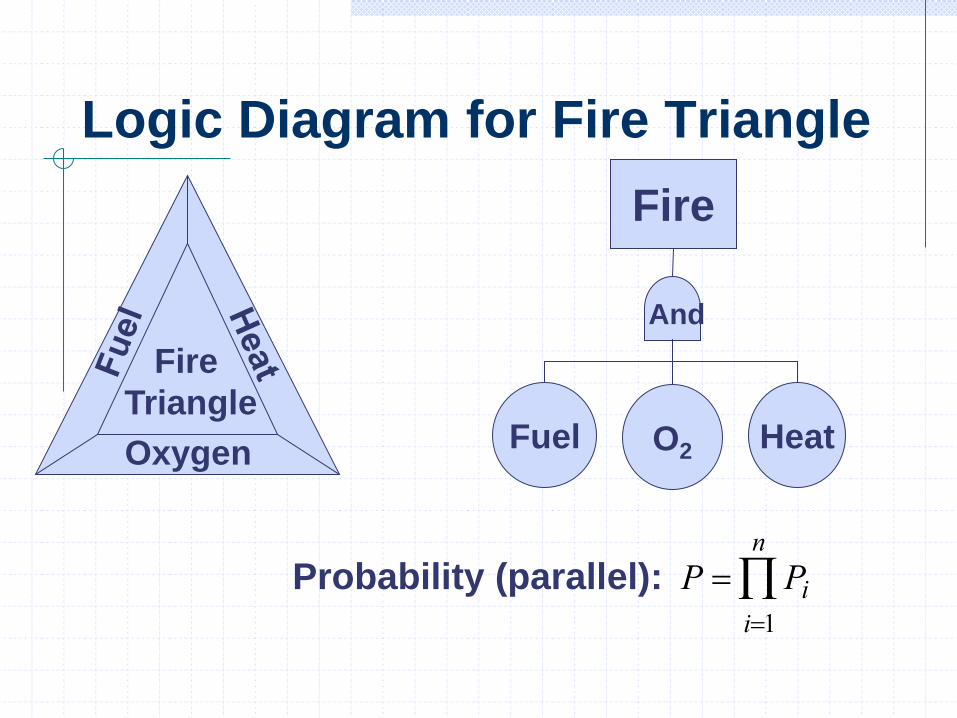
Logic Diagram for Fire Triangle
Fire
Triangle
Oxygen
Fire
Fuel O2 Heat
And
P Pii1
n
Probability (parallel):

Fault Tree for a Flashlight
Failure
Battery Switch Bulb
Or
Switch
Bulb
+-+- Battery Battery
Flashlight
Probability (series):
P Pii1
n

Process Hardware Failure Rate and
Probability of Failure During (0, t)
new oldperiod of stable µ
Fa
ilu
re R
ate
, µ
(fa
ult
s/t
ime
)
Time, t
P(t) 1e t
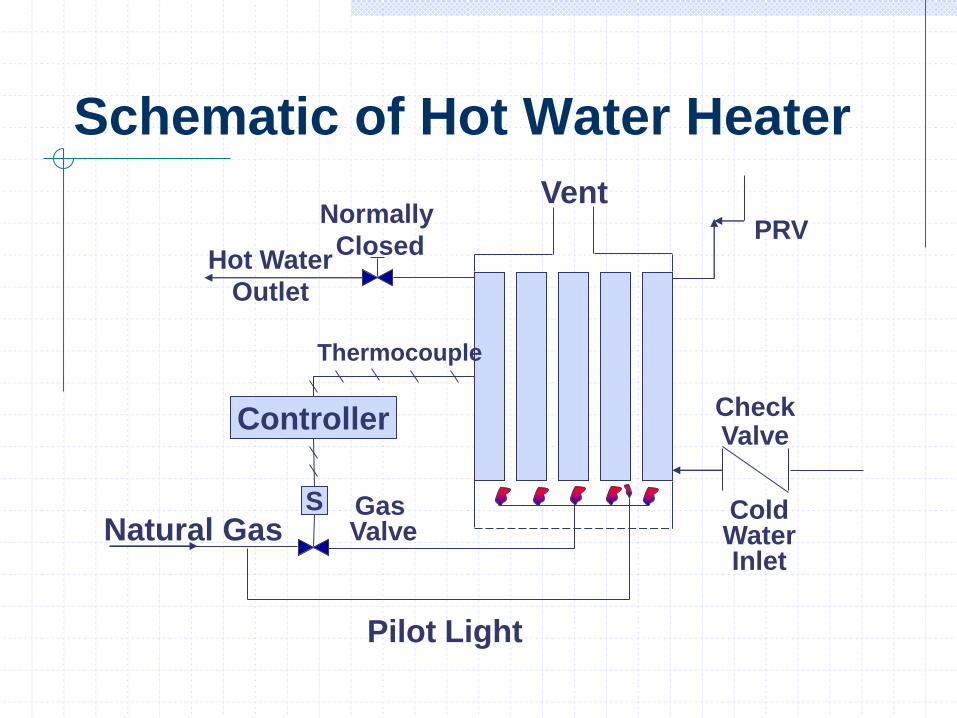
Schematic of Hot Water Heater
Controller
S
Pilot Light
Gas ValveNatural Gas
Thermocouple
Hot Water
Outlet
Normally
Closed
VentPRV
CheckValve
ColdWaterInlet

Fault Tree Rupture of Hot Water Tank
Tank Rupture
Pressure Relief Valve
Fails to Open
Overpressure
Excessive Heat Input
Material
Failure
Controller
Fails to
Close Gas
Valve
Thermocouple
Fails to
Sense High
Temperature
Gas
Valve
Fails
Open
Valve
Mechanically
Defective
Valve
Improperly
Adjusted
Or
Or
Or
And
0.0034
0.00140.002
0.018
0.003 0.005 0.01
0.079
0.06 0.019
= Probability,
events/yr
Acceptability of Risk
Acceptability of risks is judged by comparing the average individual risks with risks associated with some common activities and incidents.
Two categories of risk are:
Voluntary
Involuntary
Industrial workers are voluntary risk recipients.
Persons living in residential areas near the plant are involuntary risk recipients.

Comparison of Voluntary and Involuntary Risks

Acceptability of Risk
Voluntary RiskSociety's acceptance of voluntary risk is about the
same as acceptance of death by disease.
1 x 10⁻⁶ fatalities per person hour of exposure, or
8.76 x 10⁻³ fatalities per person year with continuous
exposure (8,760 hours)
A risk of 1 x 10⁻³ fatalities per person year is generally
acceptable to industrial workers.
Involuntary RiskAcceptable level of risk is about one one-thousandth
of the value for voluntary exposure, i.e., about 1 x 10⁻⁶
fatalities per person year.

Acceptability of Risk I
Each individual in the population has a different
perception of risk, a different opinion as to the
level of risk posed by various activities, and a
different opinion on how much risk is acceptable
Factors influence individual perceptions of risk:
Cultural and educational background,
how much benefit the individual feels that will
be received from the activity; i.e., the benefit
received is sufficient to justify the risk.

Acceptability of Risk II
Public's lack of understanding of risk indicators.
Accidents that result in multiple fatalities
cause more public concern than accidents
that cause only one or two fatalities but occur
more often.
Some members of the public may never be
convinced that a hazardous materials facility is
safe enough.
Most regulatory agencies take a realistic
approach and are willing to license or approve
facilities that satisfy their risk criteria.

Case Study
CHLORINE RAIL TANK CAR
LOADING FACILITY
Source: Chemical Process Quantitative Risk Analysis, CCPS, AIChE, New York
(1989)

Chlorine Rail Tank Car Loading
Facility
Steps involved in the risk assessment:
Data gathering
Hazard scenario development
Consequence analysis
Probability of occurrence
Risk estimation

Diagram of Liquid Cl2 Rail Tank Car Loading
Installation

Simplified Chlorine Rail Car Loading Procedures
Empty rail tank car
arrives at plant
Stored on a siding
Moved to suitable
location for venting
and inspection. Small
maintenance required
Moved to loading berth
Liquid chlorine
transferred to
rail tank car
Moved to siding
Full rail tank
car dispatched
Batch supply
tank vented
Nitrogen pad used to
transfer chlorine to
rail tank car
Liquid chlorine
transferred to batch
supply tank
Rail Tank Cars
Pressurized Chlorine
Storage
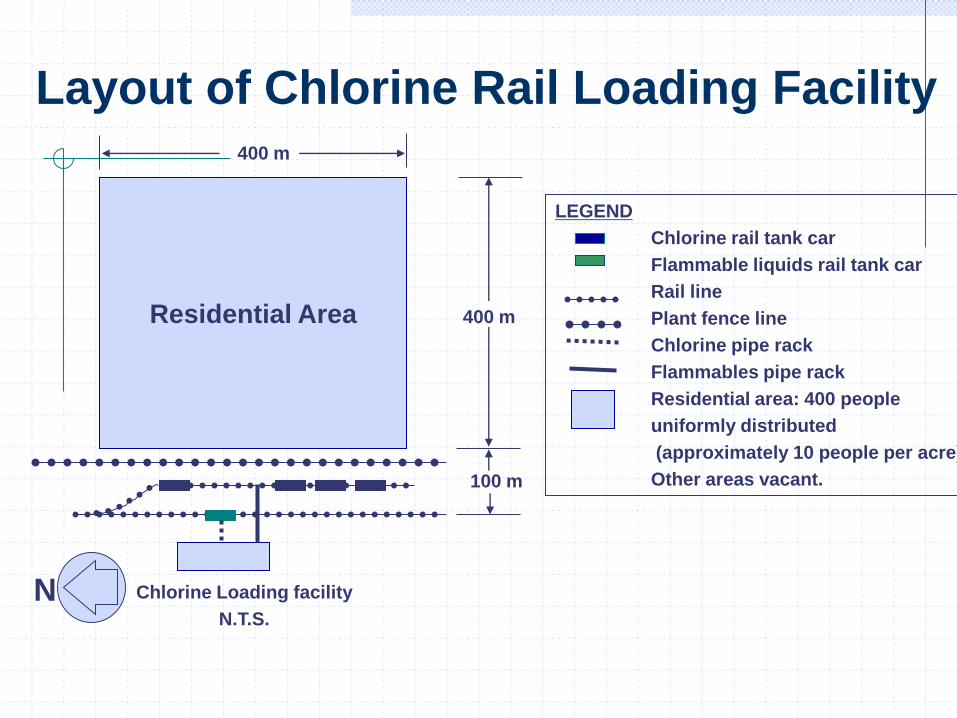
Layout of Chlorine Rail Loading Facility
Residential Area
Chlorine Loading facility
N.T.S.
N
100 m
400 m
400 m
LEGEND
Chlorine rail tank car
Flammable liquids rail tank car
Rail line
Plant fence line
Chlorine pipe rack
Flammables pipe rack
Residential area: 400 people
uniformly distributed
(approximately 10 people per acre).
Other areas vacant.
Hazard Identification
To estimate public risk, localized incidents
with consequences that do not extend
beyond the boundary fence are not
evaluated.
Major incidents of similar scale are grouped
and represented as single incidents with
frequency determined from contributions of
all individual incidents in each group.
The risk assessment is based on specific
chlorine release incidents.
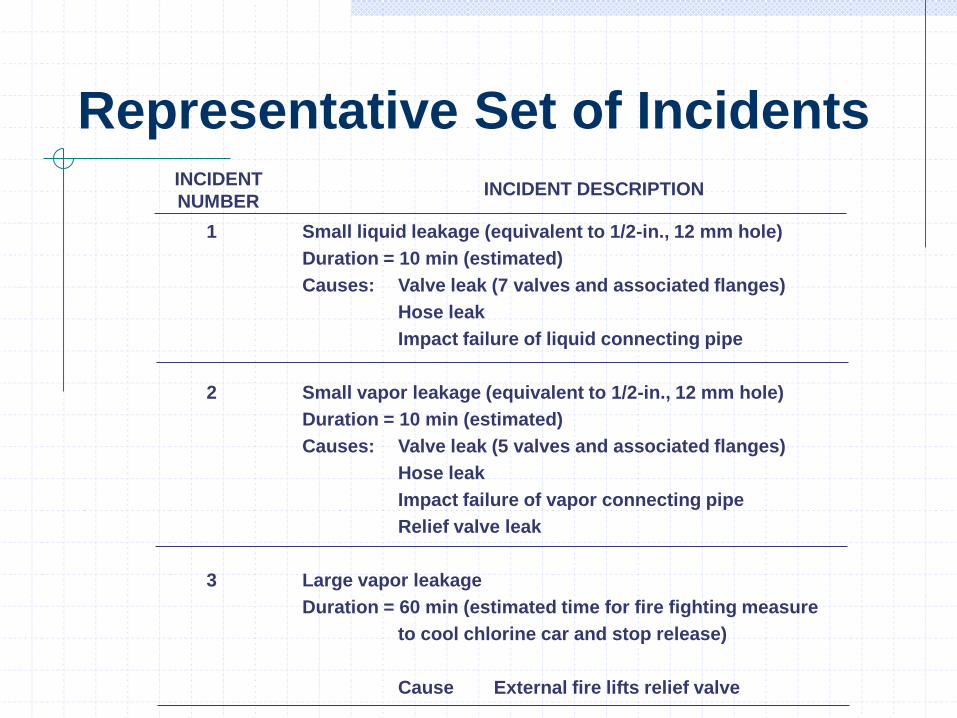
Representative Set of IncidentsINCIDENT
NUMBERINCIDENT DESCRIPTION
1 Small liquid leakage (equivalent to 1/2-in., 12 mm hole)
Duration = 10 min (estimated)
Causes: Valve leak (7 valves and associated flanges)
Hose leak
Impact failure of liquid connecting pipe
2 Small vapor leakage (equivalent to 1/2-in., 12 mm hole)
Duration = 10 min (estimated)
Causes: Valve leak (5 valves and associated flanges)
Hose leak
Impact failure of vapor connecting pipe
Relief valve leak
3 Large vapor leakage
Duration = 60 min (estimated time for fire fighting measure
to cool chlorine car and stop release)
Cause External fire lifts relief valve
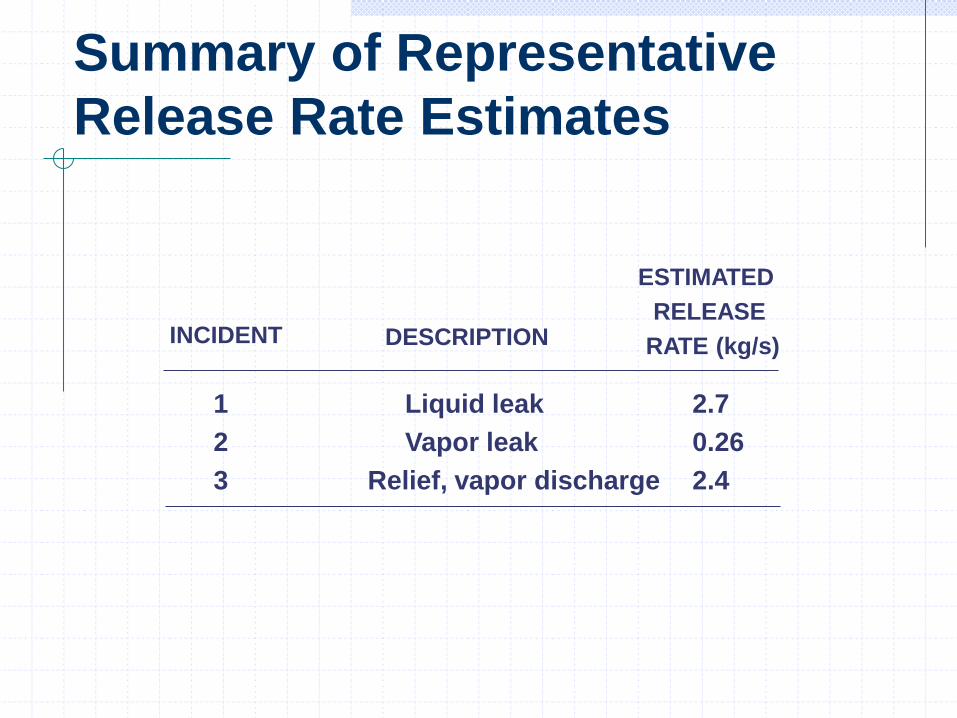
Summary of Representative
Release Rate Estimates
1 Liquid leak 2.7
2 Vapor leak 0.26
3 Relief, vapor discharge 2.4
INCIDENT DESCRIPTION
ESTIMATED
RELEASE
RATE (kg/s)
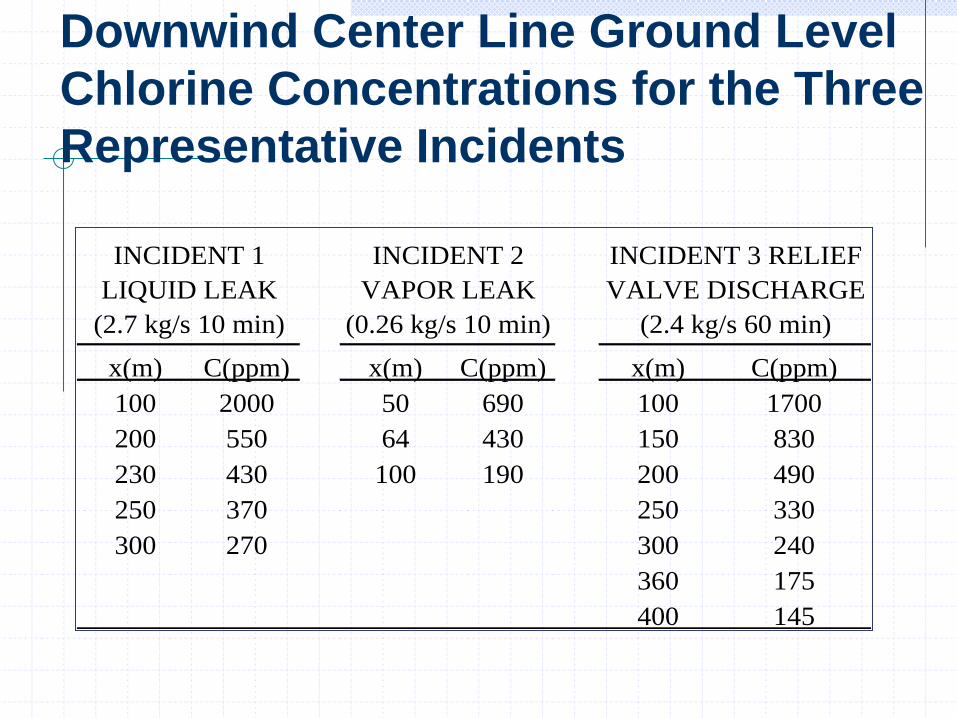
Downwind Center Line Ground Level
Chlorine Concentrations for the Three
Representative Incidents
x(m) C(ppm) x(m) C(ppm) x(m) C(ppm)
100 2000 50 690 100 1700
200 550 64 430 150 830
230 430 100 190 200 490
250 370 250 330
300 270 300 240
360 175
400 145
INCIDENT 1
LIQUID LEAK
(2.7 kg/s 10 min)
INCIDENT 3 RELIEF
VALVE DISCHARGE
(2.4 kg/s 60 min)
INCIDENT 2
VAPOR LEAK
(0.26 kg/s 10 min)
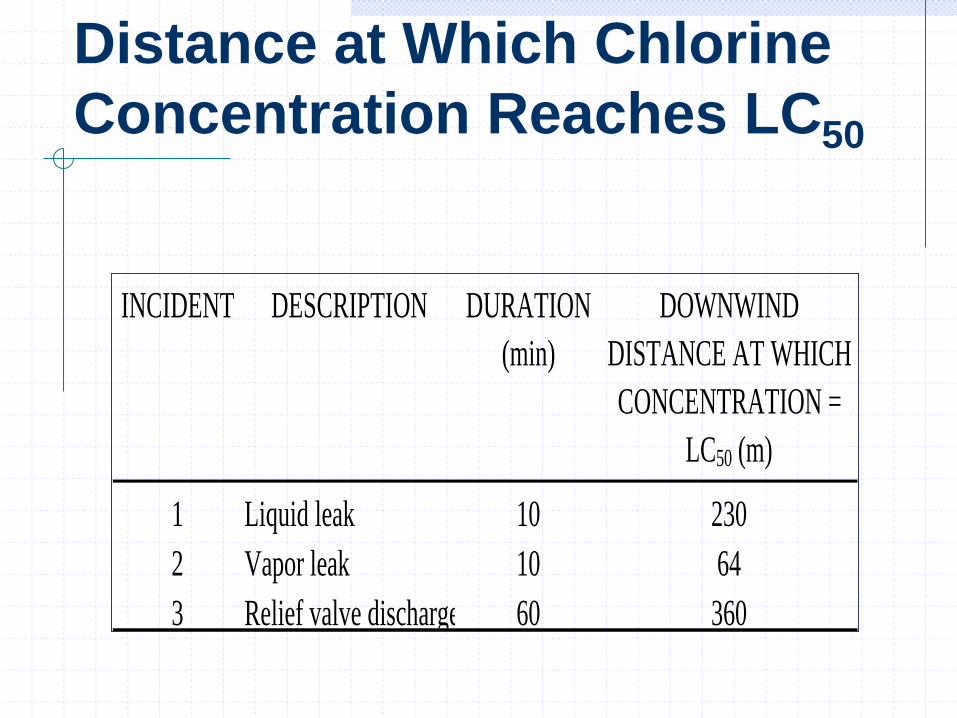
Distance at Which Chlorine
Concentration Reaches LC50
INCIDENT DESCRIPTION DURATION
(min)
DOWNWIND
DISTANCE AT WHICH
CONCENTRATION =
LC50 (m)
1 Liquid leak 10 230
2 Vapor leak 10 64
3 Relief valve discharge 60 360

Estimated Failure Frequency for
Chlorine System Components
FAILURE
DESCRIPTION
FAILURE
FREQUENCY,
AVERAGE SERVICE
(events/year)
Valve leak 1 x 10⁻⁵
Hose leak 5 x 10⁻⁴
Impact failure of pipea
1 x 10⁻⁵
Relief valve leak at
normal operating
pressure
1 x 10⁻⁴
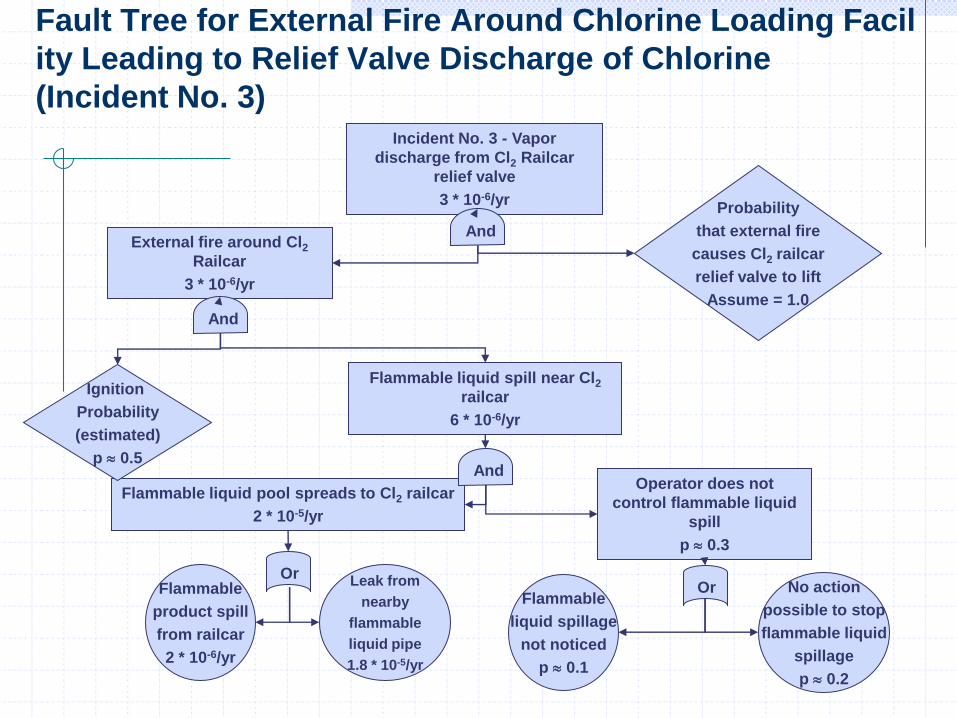
Fault Tree for External Fire Around Chlorine Loading Facil
ity Leading to Relief Valve Discharge of Chlorine
(Incident No. 3)Incident No. 3 - Vapor
discharge from Cl2 Railcar
relief valve
3 * 10-6/yr
External fire around Cl2Railcar
3 * 10-6/yr
Flammable liquid spill near Cl2railcar
6 * 10-6/yr
Operator does not
control flammable liquid
spill
p 0.3
Flammable liquid pool spreads to Cl2 railcar
2 * 10-5/yr
And
OrFlammable
product spill
from railcar
2 * 10-6/yr
And
And
OrLeak from
nearby
flammable
liquid pipe
1.8 * 10-5/yr
Flammable
liquid spillage
not noticed
p 0.1
No action
possible to stop
flammable liquid
spillage
p 0.2
Ignition
Probability
(estimated)
p 0.5
Probability
that external fire
causes Cl2 railcar
relief valve to lift
Assume = 1.0
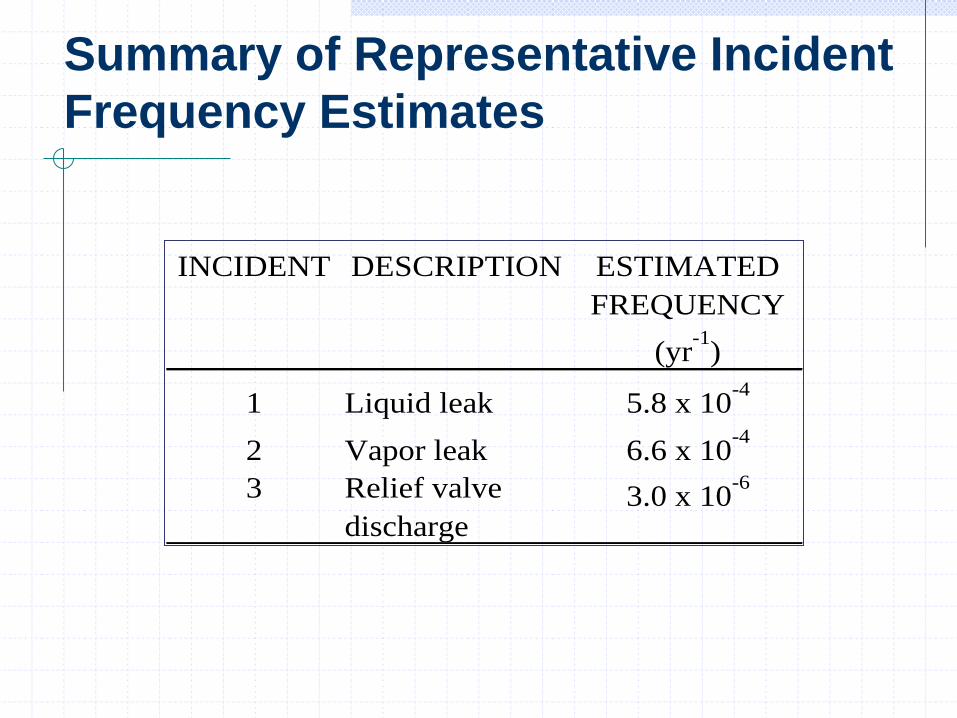
Summary of Representative Incident
Frequency Estimates
INCIDENT DESCRIPTION ESTIMATED
FREQUENCY
(yr-1
)
1 Liquid leak 5.8 x 10⁻⁴
2 Vapor leak 6.6 x 10⁻⁴
3 Relief valve
discharge3.0 x 10
-6
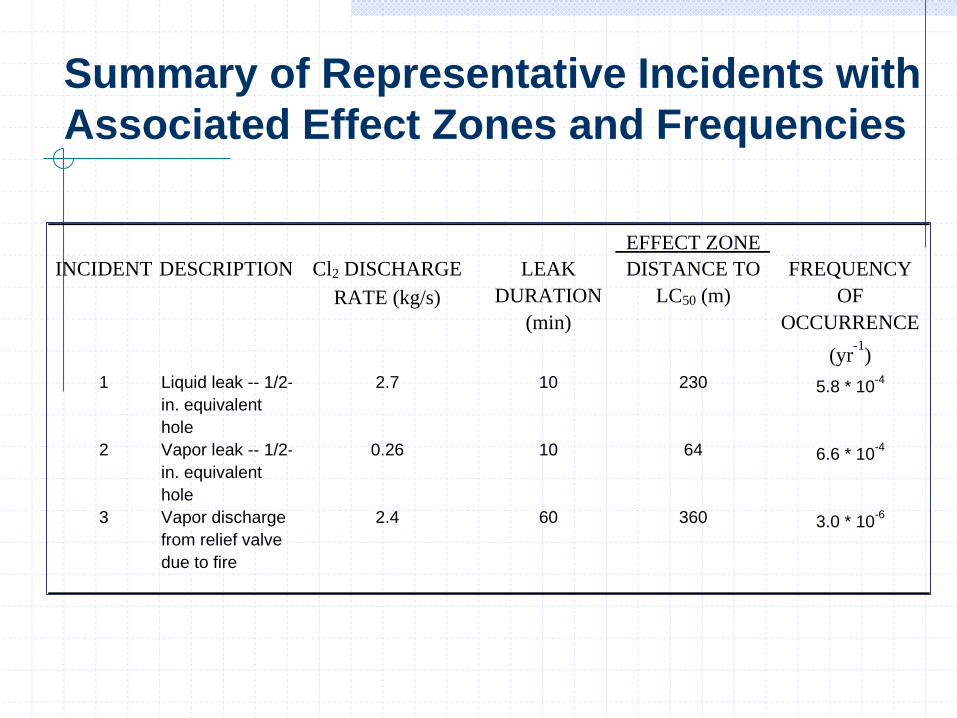
Summary of Representative Incidents with
Associated Effect Zones and Frequencies
EFFECT ZONE
INCIDENT DESCRIPTION Cl2 DISCHARGE
RATE (kg/s)
LEAK
DURATION
(min)
DISTANCE TO
LC50 (m)
FREQUENCY
OF
OCCURRENCE
(yr-1
)
1 Liquid leak -- 1/2-
in. equivalent
hole
2.7 10 230 5.8 * 10-4
2 Vapor leak -- 1/2-
in. equivalent
hole
0.26 10 64 6.6 * 10-4
3 Vapor discharge
from relief valve
due to fire
2.4 60 360 3.0 * 10-6

List of Incident Outcome Cases
Assuming an 8-point Wind Rose, 1INCIDENT
OUTCOME CASE
INCIDENT INCIDENT FREQUENCY
(yr-1
)
NO. WIND DIRECTION
PROBABILITYFREQUENCY (yr
-1) COMMENTS
a
1 5.8 x 10⁻⁴
1SW 0.125 7.3 x 10⁻⁵
A
1W 0.125 7.3 x 10⁻⁵
A
1NW 0.125 7.3 x 10⁻⁵
A
1N 0.125 7.3 x 10⁻⁵
B
1NE 0.125 7.3 x 10⁻⁵
B
1E 0.125 7.3 x 10⁻⁵
B
1SE 0.125 7.3 x 10⁻⁵
B
1S 0.125 7.3 x 10⁻⁵
B
aA, Effect zone affects populated area; B, effect zone does not affect populated area.
where Ni = number of fatalities resulting from incident outcome case i
Pi = the total number of people within the effect zone for incidnet outcome case i
Pf,i = the probability of fatality within the effect zone for incident outcome case i
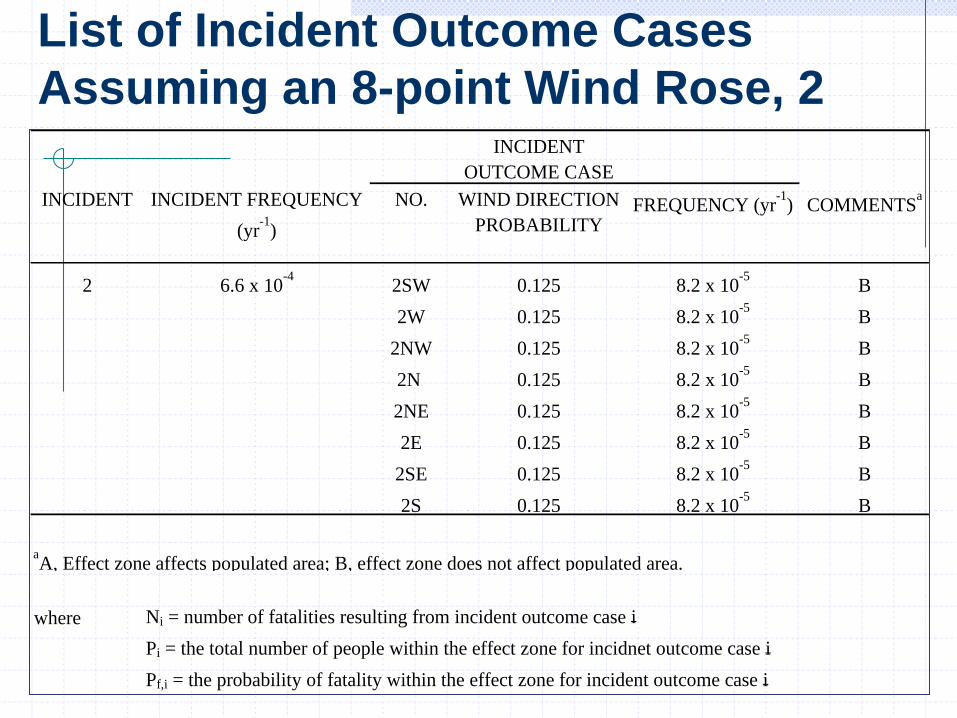
INCIDENT
OUTCOME CASE
INCIDENT INCIDENT FREQUENCY
(yr-1
)
NO. WIND DIRECTION
PROBABILITYFREQUENCY (yr
-1) COMMENTS
a
2 6.6 x 10⁻⁴
2SW 0.125 8.2 x 10⁻⁵
B
2W 0.125 8.2 x 10⁻⁵
B
2NW 0.125 8.2 x 10⁻⁵
B
2N 0.125 8.2 x 10⁻⁵
B
2NE 0.125 8.2 x 10⁻⁵
B
2E 0.125 8.2 x 10⁻⁵
B
2SE 0.125 8.2 x 10⁻⁵
B
2S 0.125 8.2 x 10⁻⁵
B
aA, Effect zone affects populated area; B, effect zone does not affect populated area.
where Ni = number of fatalities resulting from incident outcome case i
Pi = the total number of people within the effect zone for incidnet outcome case i
Pf,i = the probability of fatality within the effect zone for incident outcome case i
List of Incident Outcome Cases
Assuming an 8-point Wind Rose, 2
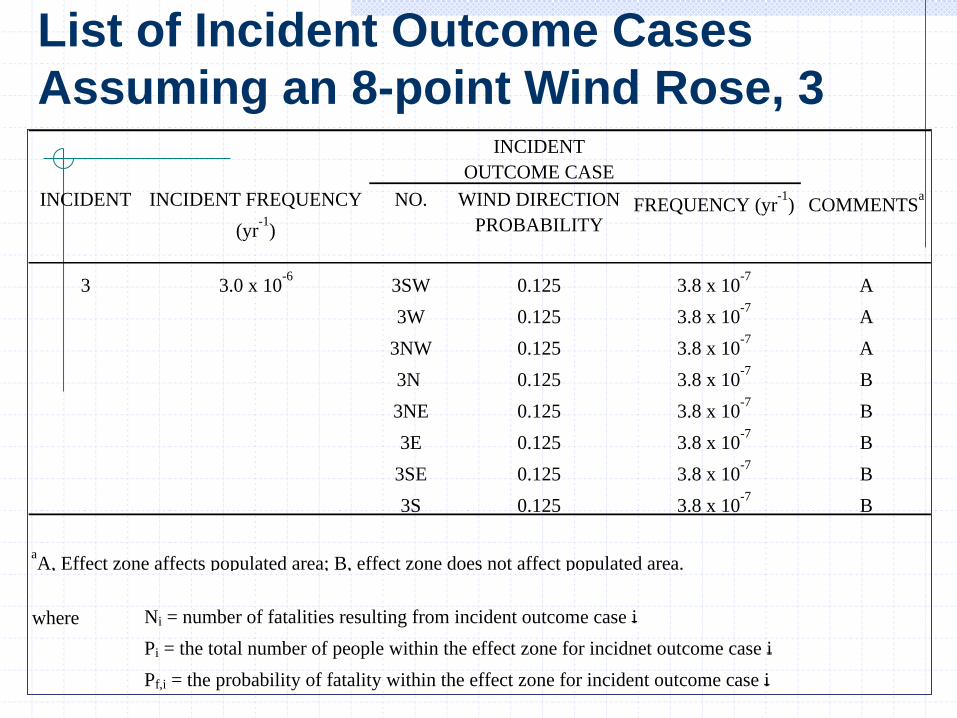
INCIDENT
OUTCOME CASE
INCIDENT INCIDENT FREQUENCY
(yr-1
)
NO. WIND DIRECTION
PROBABILITYFREQUENCY (yr
-1) COMMENTS
a
3 3.0 x 10⁻⁶
3SW 0.125 3.8 x 10⁻⁷
A
3W 0.125 3.8 x 10⁻⁷
A
3NW 0.125 3.8 x 10⁻⁷
A
3N 0.125 3.8 x 10⁻⁷
B
3NE 0.125 3.8 x 10⁻⁷
B
3E 0.125 3.8 x 10⁻⁷
B
3SE 0.125 3.8 x 10⁻⁷
B
3S 0.125 3.8 x 10⁻⁷
B
aA, Effect zone affects populated area; B, effect zone does not affect populated area.
where Ni = number of fatalities resulting from incident outcome case i
Pi = the total number of people within the effect zone for incidnet outcome case i
Pf,i = the probability of fatality within the effect zone for incident outcome case i
List of Incident Outcome Cases
Assuming an 8-point Wind Rose, 3
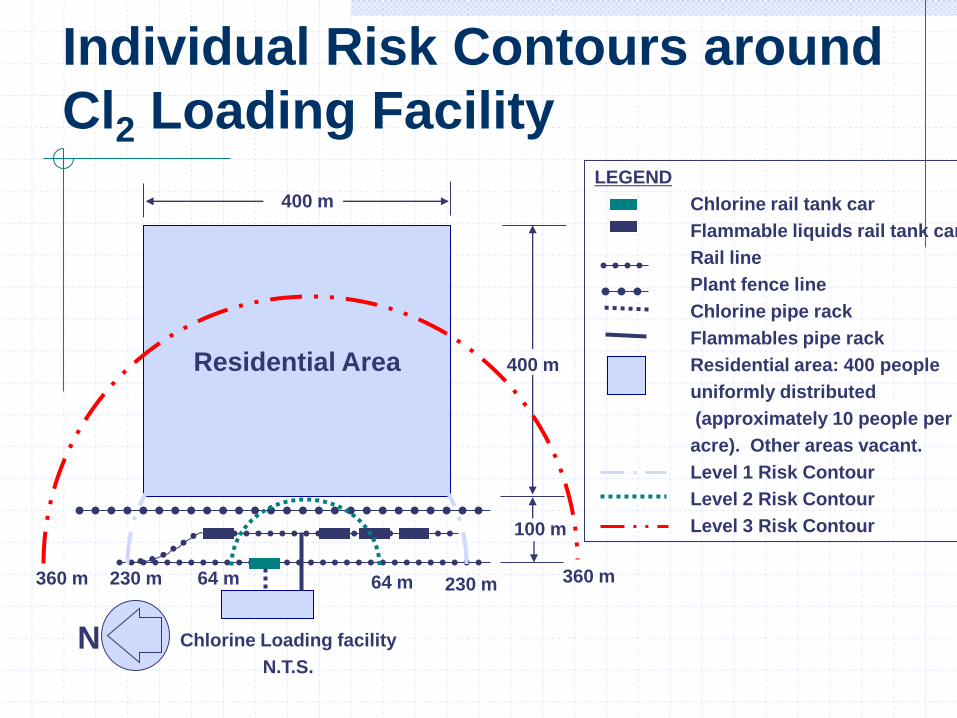
Individual Risk Contours around
Cl2 Loading Facility
Residential Area
Chlorine Loading facility
N.T.S.
N
100 m
400 m
400 m
LEGEND
Chlorine rail tank car
Flammable liquids rail tank car
Rail line
Plant fence line
Chlorine pipe rack
Flammables pipe rack
Residential area: 400 people
uniformly distributed
(approximately 10 people per
acre). Other areas vacant.
Level 1 Risk Contour
Level 2 Risk Contour
Level 3 Risk Contour
64 m64 m 230 m230 m 360 m360 m

Effect Zones for Incident No. 3
Residential Area
Chlorine Loading facility
N.T.S.
N
100 m
400 m
400 m LEGEND
Chlorine rail tank car
Flammable liquids rail tank car
Rail line
Plant fence line
Chlorine pipe rack
Flammables pipe rack
I.O.C. Incident Outcome Case
Residential area: 400 people
uniformly distributed
(approximately 10 people per
acre). Other areas vacant.
rA = 360 m rB = 100 m
rB
rA
Area B
Area A
I.O.C. 3W
Area = 15,000 m2
I.O.C. 3SW
Area = 7900 m2
I.O.C. 3NW
Area = 7900 m2
Example area calculations
222
222
308.1360
15100
360
964.16360
15360
360
mrBArea
mrAArea
B
A
Area Impacted = Area A - Area B 15,656 m2
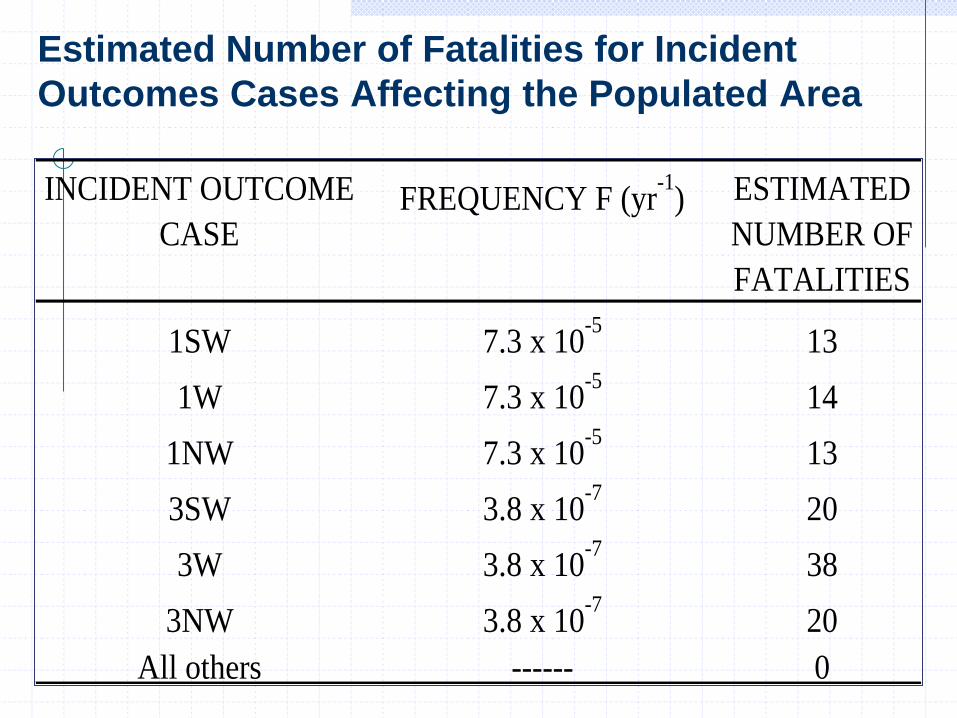
Estimated Number of Fatalities for Incident
Outcomes Cases Affecting the Populated Area
INCIDENT OUTCOME
CASEFREQUENCY F (yr
-1) ESTIMATED
NUMBER OF
FATALITIES
1SW 7.3 x 10⁻⁵
13
1W 7.3 x 10⁻⁵
14
1NW 7.3 x 10⁻⁵
13
3SW 3.8 x 10⁻⁷
20
3W 3.8 x 10⁻⁷
38
3NW 3.8 x 10⁻⁷
20
All others ------ 0
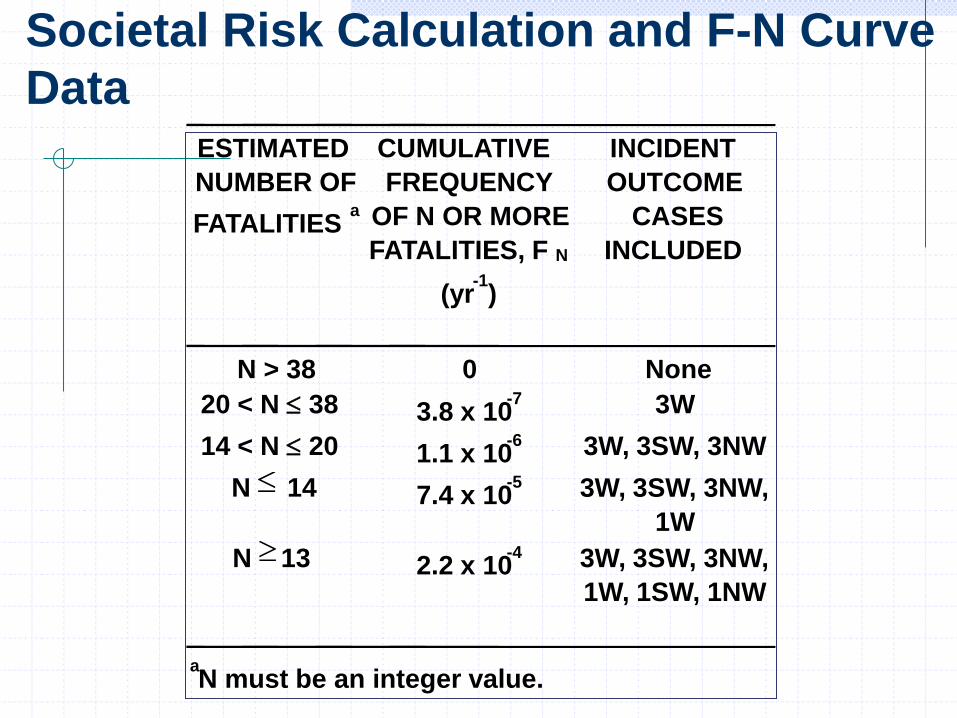
Societal Risk Calculation and F-N Curve
DataESTIMATED
NUMBER OF
FATALITIESa
CUMULATIVE
FREQUENCY
OF N OR MORE
FATALITIES, F N
(yr-1
)
INCIDENT
OUTCOME
CASES
INCLUDED
N > 38 0 None
20 < N 38 3.8 x 10⁻⁷ 3W
14 < N 20 1.1 x 10⁻⁶ 3W, 3SW, 3NW
N 14 7.4 x 10⁻⁵ 3W, 3SW, 3NW,
1W
N 13 2.2 x 10⁻⁴ 3W, 3SW, 3NW,
1W, 1SW, 1NW
aN must be an integer value.
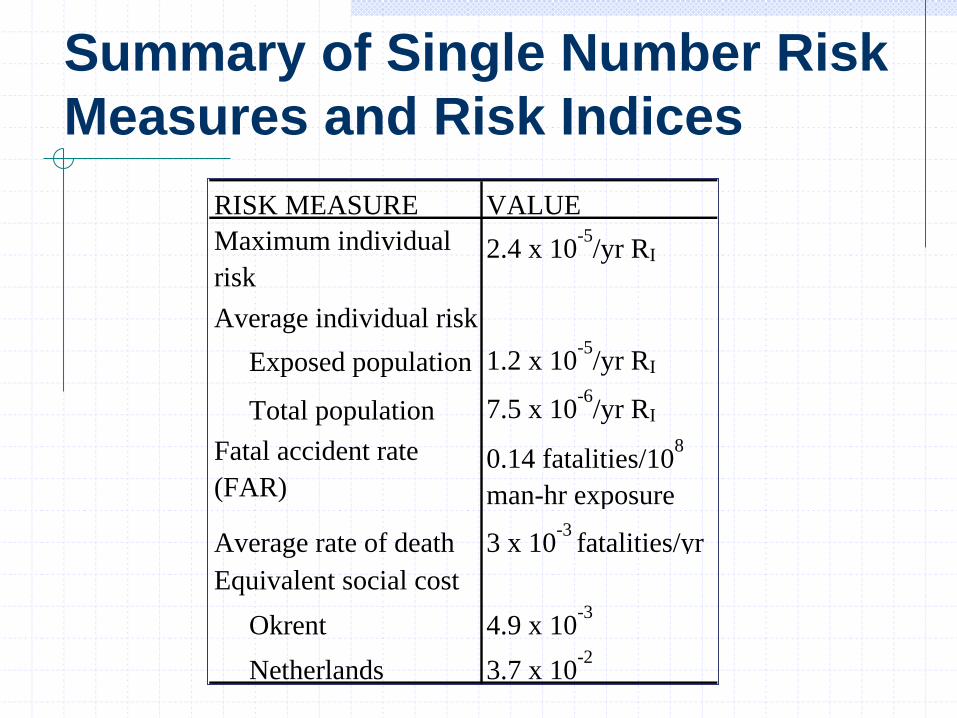
Summary of Single Number Risk
Measures and Risk Indices
RISK MEASURE VALUE
Maximum individual
risk2.4 x 10
-5/yr RI
Average individual risk
Exposed population 1.2 x 10⁻⁵
/yr RI
Total population 7.5 x 10⁻⁶
/yr RI
Fatal accident rate
(FAR)0.14 fatalities/10
8
man-hr exposure
Average rate of death 3 x 10⁻³
fatalities/yr
Equivalent social cost
Okrent 4.9 x 10⁻³
Netherlands 3.7 x 10⁻²