lecture 7 part ii tissue optical properties (absorption) acknowledgement slides on absorption...
TRANSCRIPT

Lecture 7Part II
Tissue optical properties (Absorption)Acknowledgement
Slides on absorption spectroscopy based on Lecture prepared by Dr. Nimmi Ramanujam,
University of Wisconsin at Madison

Tissue optical properties
• There are two main tissue optical properties which characterize light-tissue interaction and determine therapeutic or diagnostic outcome:– Absorption coefficient: a (cm-1)
a=a*Na =A/L*ln10 a=atomic absorption cross section (cm2)• Na=# of absorbing molecules/unit volume (cm-3)• A=Absorbance• L=sample length
– Scattering coefficient: s (cm-1) s=s*Ns s=atomic scattering cross section (cm2)• Ns=# of scattering molecules/unit volume (cm-3)
Area
Area
a = Qa Area
s = Qs Area
Qa – absorption efficiencyQs – scattering efficiency
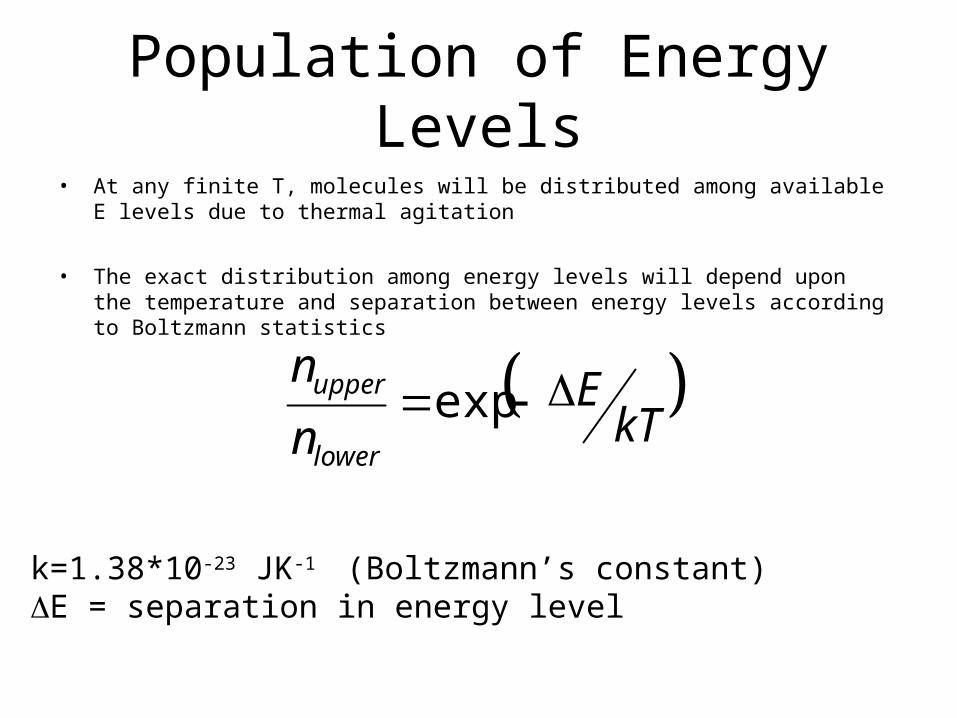
Population of Energy Levels• At any finite T, molecules will be distributed among available E levels due to thermal
agitation
• The exact distribution among energy levels will depend upon the temperature and separation between energy levels according to Boltzmann statistics
kTE
n
n
lower
upper exp
k=1.38*10-23 JK-1 (Boltzmann’s constant)E = separation in energy level

Energy Levels
Population of energy levels
Absorption SpectroscopyPopulation of energy levels
• Net absorption depends on the difference between the populations of the energy levels
• The more populated the ground state, the more intense the net absorption is
• Two factors that influence absorption are the energy level spacing and the temperature

Energy LevelsUV Visible absorption spectroscopy involves transitions betweenelectronic energy levels
UV ~ 200-400nmVis ~ 400-750nm
For < 200nm (absorption by oxygen in air is significant) – vacuum UV

II. Absorption SpectroscopyElectron transition rules• Energy is absorbed by transitions induced between different electronic
energy states of a molecule
• Transition occurs only if there is an induced dipole moment
• Resonance condition; the frequency of radiation must be equal to the frequency of the dipole
E = hf where, E = separation of energy states, h = Planck’s constant, f = frequency
h=6.626x10⁻³⁴ m2kg/s
Absorption strength
• The transition probability from electronic state m to state n is given by:
Where, mn is the transition dipole moment and is molar extinction coefficient at particular frequency,
2|| mnd
II. Absorption Spectroscopy

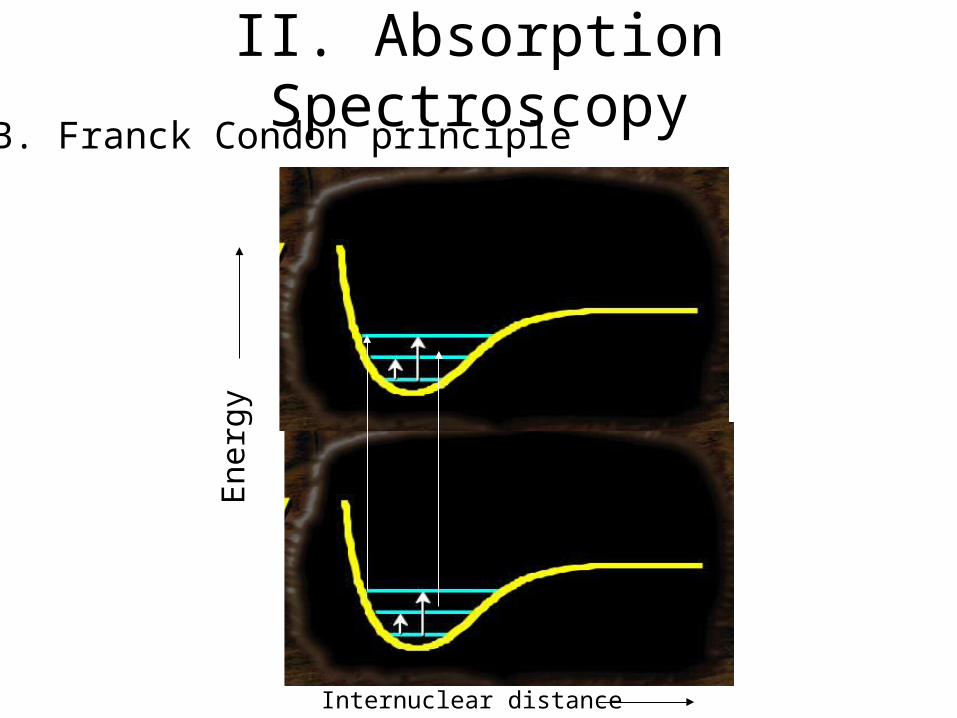
II. Absorption SpectroscopyB. Franck Condon principle• The time for an electronic transition is: t=1/ =/c ~ 10-15 s (at 420 nm)
• Franck Condon principle: electronic transitions occur so rapidly that during the transition the nuclei are static
• Thus, all electronic transitions are vertical (internuclear distance doesn’t change)
Ene
rgy
II. Absorption SpectroscopyB. Franck Condon principle
Internuclear distance

II. Absorption SpectroscopyB. Spectral line widths• Electronic transitions to different vibrational energy levels
• With enough of these transitions the absorption spectrum looks more like a smooth curve rather than a line

Absorption spectroscopy
• Lifetime broadening– A molecule spends only a short amount of time in
its excited state, which defines the lifetime, , of the state.
– If a molecule changes states at a rate of 1/, then the energy levels become blurred and the corresponding spread in the energy levels around E is (Heisenberg uncertainty principle)
E
= 10-12s 0.08nm (for = 400nm)
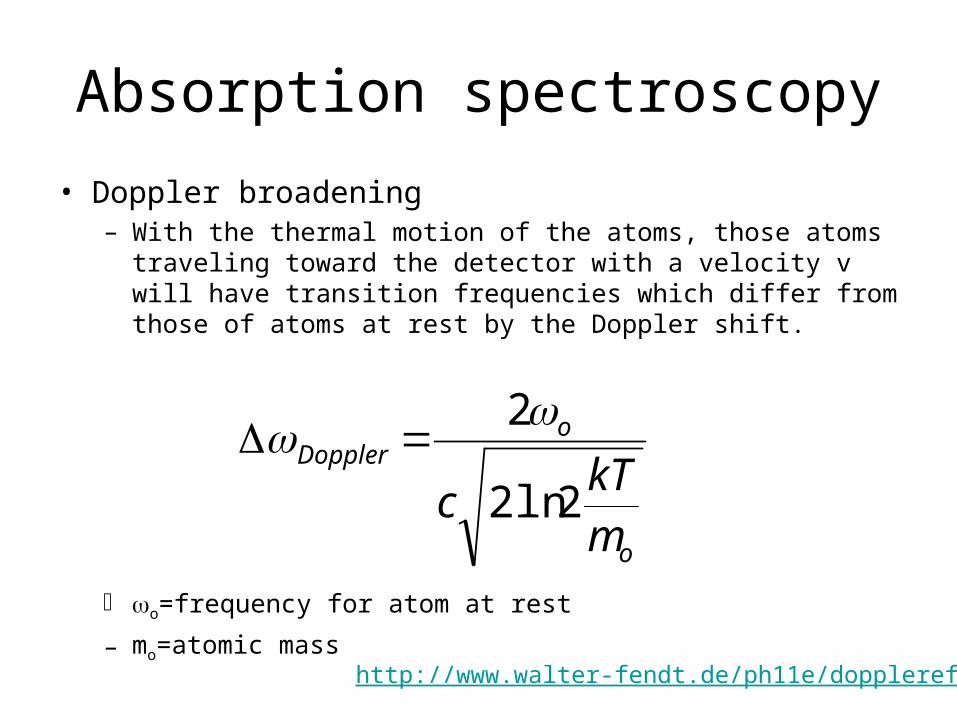
Absorption spectroscopy
• Doppler broadening– With the thermal motion of the atoms, those atoms traveling
toward the detector with a velocity v will have transition frequencies which differ from those of atoms at rest by the Doppler shift.
o=frequency for atom at rest
– mo=atomic mass
o
oDoppler
mkT
c 2ln2
2
http://www.walter-fendt.de/ph11e/dopplereff.htm

II. Absorption Spectroscopy
C. Biological chromophores1. The peptide bonds and amino acids in proteins
• The p electrons of the peptide group are delocalized over the carbon, nitrogen, and oxygen atoms. The n-* transition is typically observed at 210-220 nm, while the main -* transition occurs at ~190 nm.
• Aromatic side chains contribute to absorption at > 230 nm
2. Purine and pyrimidine bases in nucleic acids and
their derivatives
3. Highly conjugated double bond systems

III. Biological Chromophores
Molecule (nm) (x10-3) (cm2.mol-1)
Tryptophan 280, 219 5.6,47
Tyrosine 274,222,193 1.4,8,48
Phenylalanine 257,206,188 0.2,9.3,60
Histidine 211 5.9
Cystine 250 0.3
1. Amino acids

III. Biological ChromophoresTryptophan absorption is used as the basis for protein concentrationmeasurements

III. Biological Chromophores
Molecule (nm) (x10-3) (cm2.mol-1)
Adenine 260.5 13.4
Adenosine 259.5 14.9
NADH 340,259 6.23, 14.4
NAD+ 260 5.9, 18
FAD+ 450 unknown
2. Bases and their derivatives

III. Biological Chromophores
3. Highly conjugated double bond systemsSpectrum is often in the visible region (electrons less restricted, energy levels closer)
Metal porphyrin ring system is mainly responsible for the
color in heme proteins
The most intense band is called the Soret band after its
discoverer

3. Hemoglobin Absorption Spectra
• Major absorption peaks around 400 and 540-580nm are due to * transitions of the porphyrin ring•The band in HbO2 around 900 nm arises from charge transfer between the porphyrin protein and the Fe(II) atom

Beta carotene absorption spectrum
Absorption due to
transitions

Melanin absorption
• eumelaninA black-to-dark-brown insoluble material found in human black hair and in the retina of the eye.
• pheomelaninA yellow-to-reddish-brown alkali-soluble material found in red hair and red feathers. A variety of low molecular weight pheomelanins are called "trichromes".

Tissue absorbers
Therapeutic window: 600-900 nm region where not much absorption takes place
II.Absorption SpectroscopyD. Concentration of molecules• Absorption depends on the number of molecules in which transitions
are induced.
• Absorption spectra can be used quantitatively
• The effect of sample concentration on the absorption is the basis of most analytical applications
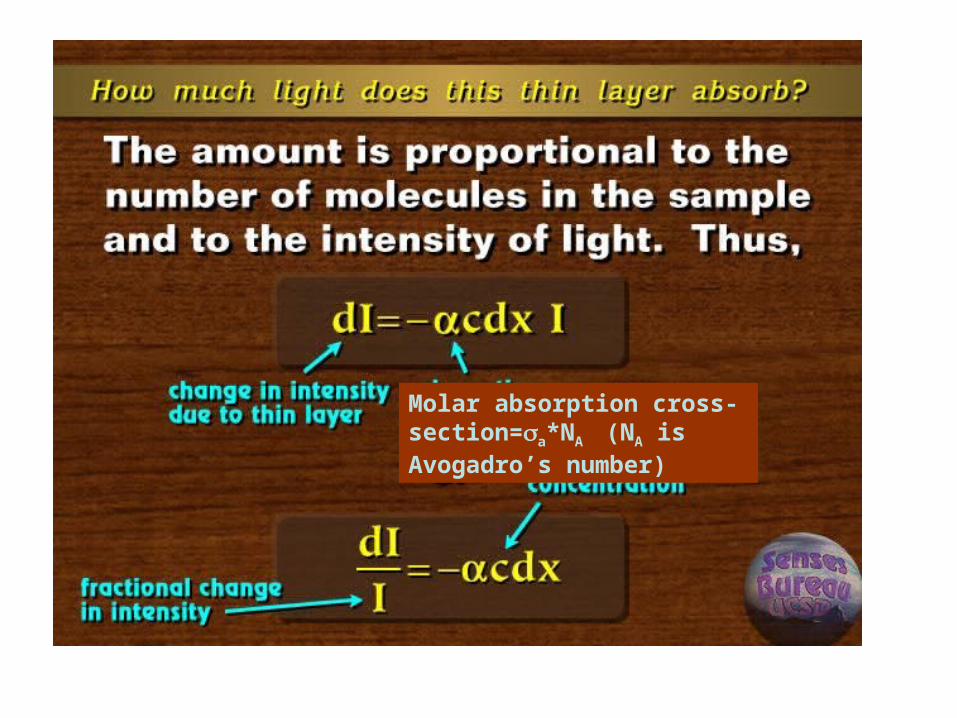
Molar absorption cross-section=a*NA (NA is Avogadro’s number)

)ln()ln()ln(
00
0I
III
I
dI ff
I
I
f

1/log10(e)=2.303

Determining Concentrations (C)
Io I
Path length, L
Absorbing sampleof concentration C
CLI
I
f
o 10log

II. Absorption Spectroscopy
F. Instrumentation and measurement1. Typical instrument
2. Experimental techniques

II. Absorption Spectroscopy
Mono-chromator
White Light
S
R
Sample Chamber
Electronics
DetectorBS
M
ChopperBS
M
I
Io
Absorption Spectroscopy
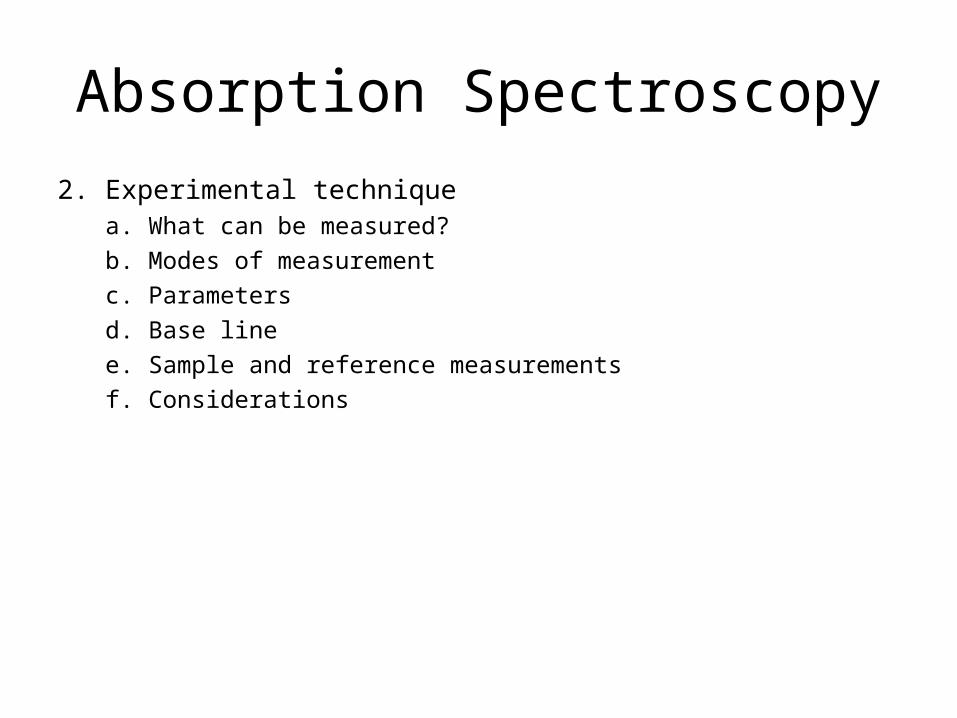
2. Experimental techniquea. What can be measured?
b. Modes of measurement
c. Parameters
d. Base line
e. Sample and reference measurements
f. Considerations
II. Absorption Spectroscopy
a. What can be measured?Absorbing, non-scattering samples
Liquid samples contained in cuvettes

II. Absorption Spectroscopy
b. Modes of measurementAbsorption (A) or optical density (O.D.)
A = log10 (Io/I);
% Transmission (%T)
%T = I/Io; A = log10 (1/ T);
II. Absorption Spectroscopy
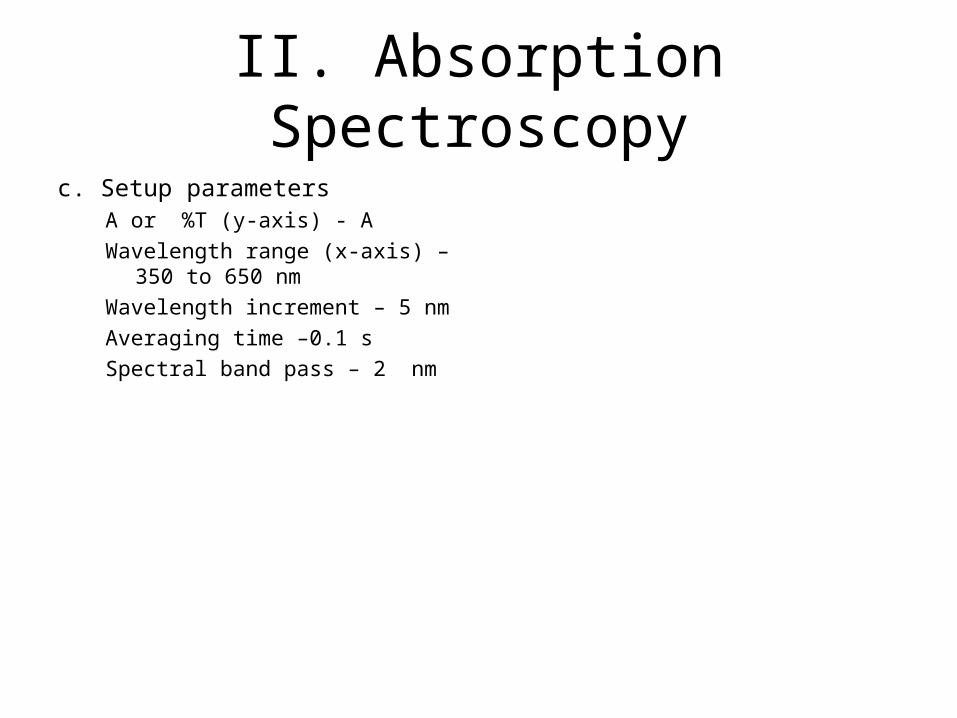
c. Setup parametersA or %T (y-axis) - A
Wavelength range (x-axis) – 350 to 650 nm
Wavelength increment – 5 nm
Averaging time –0.1 s
Spectral band pass – 2 nm

II. Absorption Spectroscopyd. Record Baseline (for specific setup parameters)
Removes variations in:• Throughput of reference and sample optics• Detector sensitivity
Run baseline for setup parameters and no sample inside spectrophotometer
Store base line file
Run a wavelength scan to make sure that absorbance (A) is zero at all wavelengths

Baseline Correction
Wavelength (nm)
Abs
orba
nce
(O.D
.)
0

II. Absorption Spectroscopye. Sample and reference measurements
Use identical cuvettes in sample and reference arms and ensure that they have the same path length; cuvette should have low absorption in region of interest
Fill the sample cuvette with the sample of interest
Fill the reference cuvette with everything in the sample cuvette, except the absorber
Run a wavelength scan of the sample

Absorbance of Sample
Wavelength (nm)
Abs
orba
nce
(O.D
.)
0
4

II. Absorption Spectroscopyf. Considerations
Dynamic range (limits on detector sensitivity)
Typical dynamic range – 4 O.D.
If sample has an absorbance of more than dynamic range of instrument – flat line
Turbid SamplesLight lost to scattering looks like absorption
Need integrating sphere accessory to make accurate absorption
measurements

Dynamic Range
Wavelength (nm)
Abs
orba
nce
(O.D
.)
4
