lecture 4. chromosome theory of inheritance. sex
TRANSCRIPT
Lecture 4. Chromosome theory of inheritance. Sex determination and the
inheritance of sex-linked traits.
1. Chromosome theory of inheritance.
2. Chromosome mapping.
3. Sex determination and the inheritance of sex-linked traits.
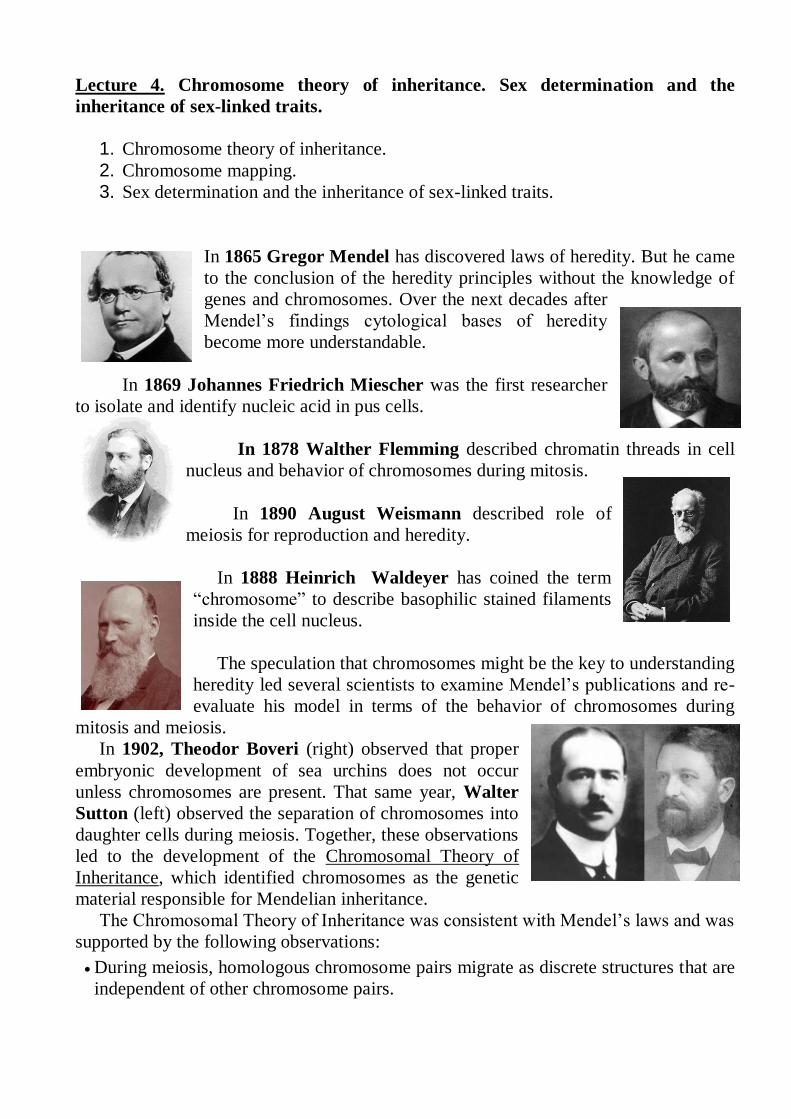
In 1865 Gregor Mendel has discovered laws of heredity. But he came
to the conclusion of the heredity principles without the knowledge of
genes and chromosomes. Over the next decades after
Mendel’s findings cytological bases of heredity
become more understandable.
In 1869 Johannes Friedrich Miescher was the first researcher
to isolate and identify nucleic acid in pus cells.
In 1878 Walther Flemming described chromatin threads in cell
nucleus and behavior of chromosomes during mitosis.
In 1890 August Weismann described role of
meiosis for reproduction and heredity.
In 1888 Heinrich Waldeyer has coined the term
“chromosome” to describe basophilic stained filaments
inside the cell nucleus.
The speculation that chromosomes might be the key to understanding
heredity led several scientists to examine Mendel’s publications and re-
evaluate his model in terms of the behavior of chromosomes during
mitosis and meiosis.
In 1902, Theodor Boveri (right) observed that proper
embryonic development of sea urchins does not occur
unless chromosomes are present. That same year, Walter
Sutton (left) observed the separation of chromosomes into
daughter cells during meiosis. Together, these observations
led to the development of the Chromosomal Theory of
Inheritance, which identified chromosomes as the genetic
material responsible for Mendelian inheritance.
The Chromosomal Theory of Inheritance was consistent with Mendel’s laws and was
supported by the following observations:
During meiosis, homologous chromosome pairs migrate as discrete structures that are
independent of other chromosome pairs.

The sorting of chromosomes from each homologous pair into pre-gametes appears to
be random.
Each parent synthesizes gametes that contain only half of their chromosomal
complement.
Even though male and female gametes (sperm and egg) differ in size and
morphology, they have the same number of chromosomes, suggesting equal genetic
contributions from each parent.
The gametic chromosomes combine during fertilization to produce offspring with the
same chromosome number as their parents.
In 1909 Wilhelm Johannsen introduced the term «gene».
Despite compelling correlations between the behavior of
chromosomes during meiosis and Mendel’s abstract laws, the
Chromosomal Theory of Inheritance was proposed long before there
was any direct evidence that traits were carried on chromosomes.
Critics pointed out that individuals had far more independently
segregating traits than they had chromosomes. It was only after several
years of carrying out crosses with the fruit fly, Drosophila
melanogaster, that Thomas Hunt Morgan provided experimental
evidence to support the Chromosomal Theory of Inheritance.
He studied and explained the following questions:
1) Importance of chromosomes as carriers of hereditary information;
2) Linkage of genes;
3) Crossing-over and chromosome mapping;
4) Chromosomal definition of sex;
5) Sex-linked inheritance.
But before, in the early 1900s, William Bateson (left)
and R. C. Punnett (right) were studying inheritance in
the sweet pea. They studied two genes: one affecting
flower color (P, purple, and p, red) and the other
affecting the shape of pollen grains (L, long, and l,
round). They crossed pure lines P/P · L/L (purple, long)
× p/p · l/l (red, round), and selfed the F1 P/p ·
L/l heterozygotes to obtain an F2.
Table 1. shows the proportions of each phenotype in the F2 plants.
Table 1. Sweet Pea Phenotypes Observed in the F2 by Bateson and Punnett
NUMBER OF PROGENY
Phenotype (and genotype) Observed Expected from 9:3:3:1 ratio
purple, long (P/– · L/–) 4831 3911
purple, round (/– P· l/l) 390 1303
red, long (p/p · L/–) 393 1303
red, round (p/p · l/l) 1338 435
6952 6952
The F2 phenotypes deviated strikingly from the expected 9:3:3:1 ratio. This does not
appear to be explainable as a modified Mendelian ratio. Two phenotypic classes are
larger than expected: the purple, long phenotype and the red, round phenotype. As a
possible explanation for this, Bateson and Punnett proposed that the F1 had actually
produced more P · L and p · l gametes than would be produced by
Mendelian independent assortment. Because these genotypes were the gametic types in
the original pure lines, the researchers thought that physical coupling between the
dominant alleles P and L and between the recessive alleles p and l might have prevented
their independent assortment in the F1. However, they did not know what the nature of
this coupling could be.
The confirmation of Bateson and Punnett’s hypothesis had to await
the development of Drosophila as a genetic tool.
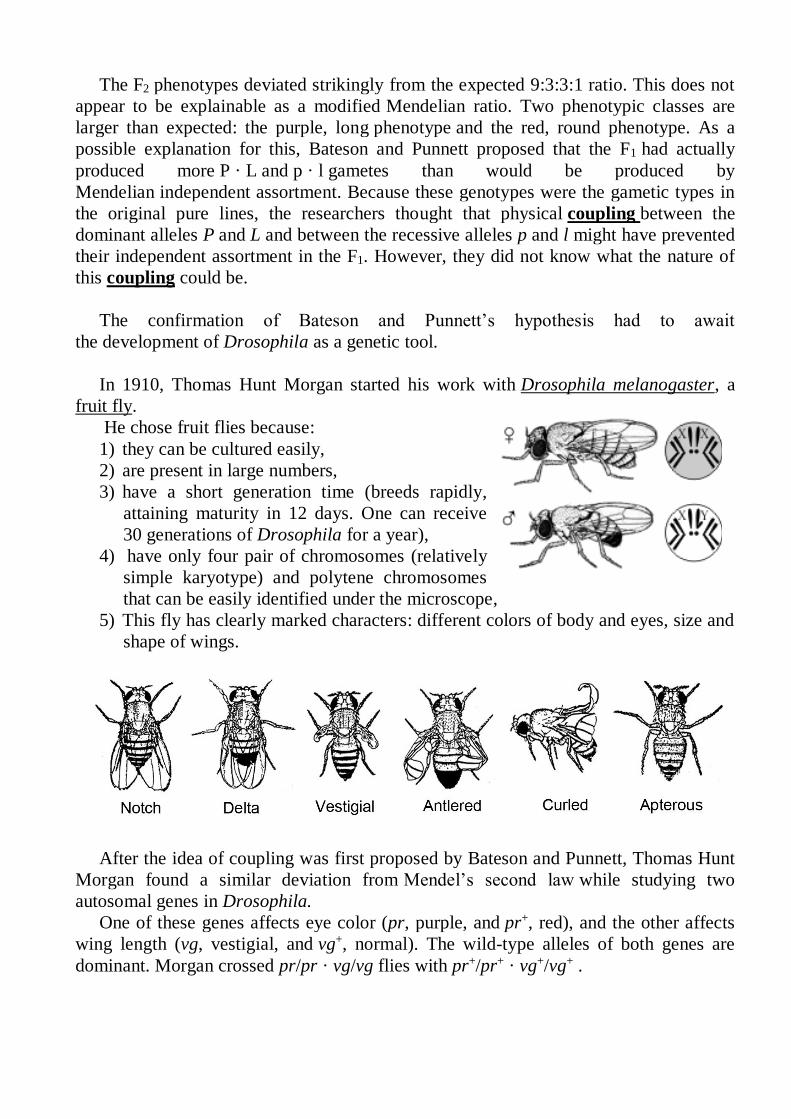
In 1910, Thomas Hunt Morgan started his work with Drosophila melanogaster, a
fruit fly.
He chose fruit flies because:
1) they can be cultured easily,
2) are present in large numbers,
3) have a short generation time (breeds rapidly,
attaining maturity in 12 days. One can receive
30 generations of Drosophila for a year),
4) have only four pair of chromosomes (relatively
simple karyotype) and polytene chromosomes
that can be easily identified under the microscope,
5) This fly has clearly marked characters: different colors of body and eyes, size and
shape of wings.
After the idea of coupling was first proposed by Bateson and Punnett, Thomas Hunt
Morgan found a similar deviation from Mendel’s second law while studying two
autosomal genes in Drosophila.
One of these genes affects eye color (pr, purple, and pr+, red), and the other affects
wing length (vg, vestigial, and vg+, normal). The wild-type alleles of both genes are
dominant. Morgan crossed pr/pr · vg/vg flies with pr+/pr+ · vg+/vg+ .

Then he testcrossed the doubly heterozygous F1 females: pr+/pr · vg+/vg ♀ × pr/pr ·
vg/vg ♂.
The use of the testcross is extremely important. Because one parent (the tester)
contributes gametes carrying only recessive alleles, the phenotypes of the offspring
reveal the gametic contribution of the other, doubly heterozygous parent. Hence, the
analyst can concentrate on meiosis in one parent and forget about the other. This
contrasts with the analysis of progeny from an F1 self, where
there are two sets of meioses to consider: one in the male parent
and one in the female. Morgan’s results follow; the alleles
contributed by the F1 female specify the F2 classes:

Obviously, these numbers deviate drastically from the Mendelian prediction of a
1:1:1:1 ratio, and they indicate a coupling of genes. The two largest classes are the
combinations pr+ · vg+ and pr · vg, originally introduced by the homozygous parental
flies. You can see that the testcross clarifies the situation. It directly reveals the allelic
combinations in the gametes from one sex in the F1, thus clearly showing the coupling
that could only be inferred from Bateson and Punnett’s F1 self. The testcross also
reveals something new: there is approximately a 1:1 ratio not only between the two
parental types, but also between the two nonparental types.
Now let us consider what may be learned by repeating the crossing experiments but
changing the combinations of alleles contributed as gametes by the homozygous parents
in the first cross. In this cross, each parent was homozygous for one dominant allele and
for one recessive allele. Again F1 females were testcrossed:
The following progeny were obtained from
the testcross:
Again, these results are
not even close to a
1:1:1:1 Mendelian ratio.
Now, however, the largest
classes are those that have one dominant allele or the other rather than, as before, two
dominant alleles or two recessives. But notice that once again the allelic combinations
that were originally contributed to the F1 by the parental flies provide the most frequent
classes in the testcross progeny. In the early work on coupling, Bateson and Punnett
coined the term repulsion to describe this situation, because it seemed to them that, in
this case, the nonallelic dominant alleles “repelled” each other — the opposite of the
situation in coupling, where the dominant alleles seemed to “stick together.” What is the
explanation of these two phenomena: coupling and repulsion? Morgan suggested that
the genes governing both phenotypes are located on the same pair of homologous
chromosomes. Thus, when pr and vg are introduced from one parent, they are
physically located on the same chromosome, whereas pr+ and vg+ are on the
homologous chromosome from the other parent (Figure 1).
Figure 1. Simple inheritance of two pairs of alleles located on the same chromosome
pair.

This hypothesis also explains repulsion. In that case, one parental chromosome
carries pr and vg+ and the other carries pr+ and vg. Repulsion, then, is just another case
of coupling: in this case, the dominant allele of one gene is coupled with the recessive
allele of the other gene. This hypothesis explains why allelic combinations from P
remain together, but how do we explain the appearance of nonparental combinations?
Morgan suggested that, when homologous chromosomes pair in meiosis, the
chromosomes occasionally exchange parts in a process called crossing-over. Figure
2 illustrates this physical exchange of chromosome segments. The two new
combinations are called crossover products.
Figure 2. Crossing-over in meiosis.
An individual offspring receives one homolog from each parent. The exchange of
parts by crossing-over may produce gametic chromosomes whose allelic combinations
differ from the parental combinations.
Morgan’s hypothesis that homologs may exchange parts may seem a bit farfetched. Is
there any cytologically observable process that could account for crossing-over?
In meiosis, when duplicated homologous chromosomes pair with each other, two
nonsister chromatids often appear to cross each other, as diagrammed in Figure 3. The
resulting cross-shaped structure is called a CHIASMA.
Figure 3. Diagrammatic representation of chiasmata at meiosis.
Each line represents a chromatid of a pair of synapsed chromosomes.
Thus, chiasmata are the visible manifestations of crossovers.

To Morgan, the appearance of the chiasmata visually corroborated the concepts of
crossing-over. Morgan did not arrive at this interpretation out of nowhere; he was
looking for a physical explanation for his genetic results.
His achievement in correlating the results of breeding experiments with cytological
phenomena thus emphasizes the importance of the chromosome theory as a powerful
basis for research.
Data like those just presented, showing coupling and repulsion in testcrosses and
in F1 selfs, are commonly encountered in genetics. Clearly, results of this kind are a
departure from independent assortment. Such exceptions, in fact, constitute a major
addition to Mendel’s view of the genetic world.
To conclude, when two genes are close together on the same chromosome pair,
they do not assort independently. The residing of genes on the same chromosome pair
is termed linkage. Two genes on the same chromosome pair are said to be linked.
It is also proper to refer to the linkage of specific alleles: for example, in one A/a ·
B/b individual, A might be linked to b; a would then of necessity be linked to B. These
terms graphically allude to the existence of a physical entity linking the genes—that is,
the chromosome itself. You may wonder why we refer to such genes as “linked” rather
than “coupled”; the answer is that the
words coupling and repulsion are now
used to indicate two different types of
linkage conformation in a
double heterozygote, as follows:
In other words, coupling refers to the linkage of two dominant or two recessive
alleles, whereas repulsion indicates that dominant alleles are linked with recessive
alleles. To ascertain whether a double heterozygote is in coupling or repulsion
conformation, an investigator must testcross the double heterozygote or consider the
genotypes of its parents.
Based on the results of his experiments T.H.Morgan in 1915 published “The
mechanism of Mendelian Heredity” in which formulated the main principles of
chromosome theory of inheritance.
Postulates of the Chromosome Theory of Heredity are the following:
The genes are located on chromosomes in the linear order.
Each gene occupies a certain place (locus) on chromosome.
Each homologous chromosome contains only one allelic gene from the allelic
pair.
Genes of one chromosome form a group of linkage and are inherited together.
The number of linkage groups is equal to the number of the haploid set of
chromosomes of the species.
Linkage of genes can be interrupted during meiosis by crossing over
(recombination). It is the exchange of allelic genes between homologous
chromosomes.
The percentage of crossing-over is directly proportional to the distance between
genes.
The distance between genes on a chromosome can be estimated from the
proportion of recombinant offsprings.

Genes of non-homologous chromosomes can independently assort from each
other.
In 1933 Thomas H. Morgan was awarded the Nobel Prize in Physiology and
Medicine “for his discoveries concerning the role played by chromosome in heredity”.
Genetic linkage occurs when particular genes are inherited together. Linkage can
be complete (when crossing-over does not occur) and incomplete (when crossing-
over occurs) (Figure 4).
Figure 4. Types of gene linkage.
Examples of complete linkage in humans are:
Inheritance of RH-factor genes (RHD and RHCE);
Inheritance of MN and Ss blood groups;
Inheritance of HLA antigen.
Examples of incomplete linkage in humans are:
Inheritance of RH-factor genes and gene of elliptocytosis (oval shape of
erythrocytes) that are in the first chromosome at the 3% crossing-over distance;
Inheritance of red-green color blindness and hemophilia that are in the X
chromosome at the 9.8% crossing-over distance.
Crossing over is the exchange of homologous regions between homologous
chromosomes. Crossing-over happens in Pachytene phase of the Prophase I (The First
Meiotic division). It can be in one or several parts of the chromosome.

Crossing-over is genetically determined process. In most number of species
crossing-over may occur in both males and females, but in some species (like
drosophila) it occurs only in homogametic sex (females).
Significance of crossing-over:
it is molecular basis of genetic variation (gene recombination);
analysis of gene linkage allows composing genetic maps of chromosomes.
SINCE THE PROBABILITY OF CROSSING-OVER IS LOW, A NUMBER OF
NON-CROSSOVER GAMETES FORMED IS ALWAYS MORE THAN
CROSSOVER ONES IN INCOMPLETE LINKAGE.
FRACTION OF INDIVIDUALS WITH NEW COMBINATIONS OF TRAITS
(CROSSOVERS) IS LESS THAN 50% OF THE TOTAL NUMBER OF OFFSPRING.

A study of the linkages between many genes enables the creation of a linkage map
or genetic maps.
The observation by Tomas Hunt Morgan that the amount of
crossing-over between linked genes differs, led to idea that crossover
frequency might indicate the distance separating genes on the
chromosome. Morgan’s student Alfred Sturtevant developed the
first genetic map, also called a linkage map or genetic map.
Genetic map is the arrangement of genes on chromosome.
Figure 5. Chromosome 2 of Drosophila Melanogaster (fruit fly)
Sturtevant postulated:
genes are arranged in a linear series on chromosome;
genes which are close together will be separated by crossing over less
frequently than genes which are father apart;
it should be possible, by determining the frequencies of crossovers, to plot the
sequence of the genes along the chromosome and the relative distance
between them.
As standard unit of measure, he arbitrarily took the distance that would give (on
the average) one crossover per 100 fertilized eggs. Thus, genes with 10 percent
crossover would be 10 units apart. Unit of distance was named as centimorgan (cM) in
honor of his teacher.
Recombination is defined as the occurrence of progeny with combinations of genes
other than those that occurred in the parents due to independent assortment or crossing
over. The frequency of crossing over (recombination frequency) is calculated from the
proportion of recombinants over total offspring:
%100offspring ofnumber total
tsrecombinan ofnumber over crossing ofFrequency
If among the offspring 80 per cent have the parental combination of dominant genes
A and B, and 20 per cent have a new combination of genes A and B not found in either
parent, the genes are said to show 20 per cent recombination, i.e., they are 20 map units
apart.
Distances between any two genes are measured in terms of map units (m.u.), one
map unit is also known as a centimorgan (cM), being equal to 1 per cent of crossing
over. The frequency of recombination gives the
frequency of crossing over and thereby the distance,
between any two loci on a given chromosome, in map
units.
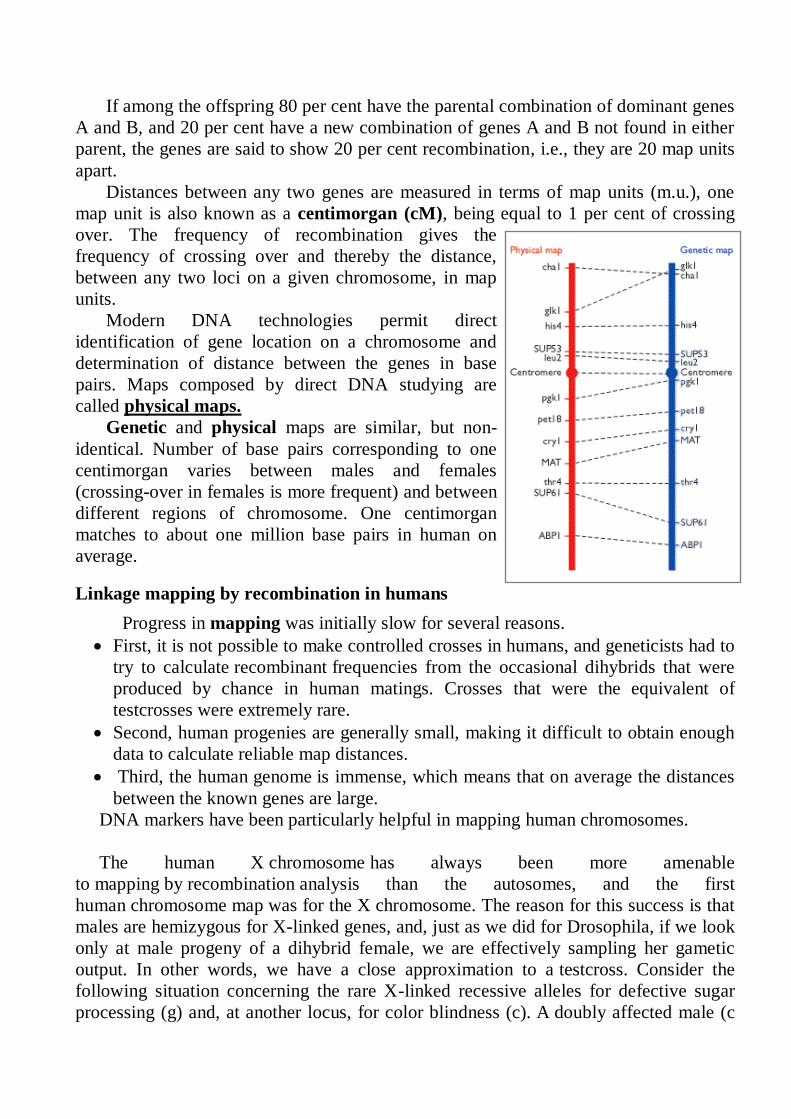
Modern DNA technologies permit direct
identification of gene location on a chromosome and
determination of distance between the genes in base
pairs. Maps composed by direct DNA studying are
called physical maps.
Genetic and physical maps are similar, but non-
identical. Number of base pairs corresponding to one
centimorgan varies between males and females
(crossing-over in females is more frequent) and between
different regions of chromosome. One centimorgan
matches to about one million base pairs in human on
average.
Linkage mapping by recombination in humans
Progress in mapping was initially slow for several reasons.
First, it is not possible to make controlled crosses in humans, and geneticists had to
try to calculate recombinant frequencies from the occasional dihybrids that were
produced by chance in human matings. Crosses that were the equivalent of
testcrosses were extremely rare.
Second, human progenies are generally small, making it difficult to obtain enough
data to calculate reliable map distances.
Third, the human genome is immense, which means that on average the distances
between the known genes are large.
DNA markers have been particularly helpful in mapping human chromosomes.
The human X chromosome has always been more amenable
to mapping by recombination analysis than the autosomes, and the first
human chromosome map was for the X chromosome. The reason for this success is that
males are hemizygous for X-linked genes, and, just as we did for Drosophila, if we look
only at male progeny of a dihybrid female, we are effectively sampling her gametic
output. In other words, we have a close approximation to a testcross. Consider the
following situation concerning the rare X-linked recessive alleles for defective sugar
processing (g) and, at another locus, for color blindness (c). A doubly affected male (c

g/Y) marries a normal woman (who is al-most certainly C G/C G). The daughters of this
mating are coupling-conformation
heterozygotes. The male children of women
of this type will provide an opportunity for
geneticists to measure the frequency of
recombinants issuing from the maternal
meioses (Figure 6). However,
silent DNA markers also can be used in this
type of X-chromosome mapping.
Figure 6. The phenotypic proportions in
male children of women heterozygous for
two X-linked genes can be used to
calculate recombinant frequency.
Thus, the X chromosome can be mapped by combining such pedigrees.
Lod score for linkage testing by pedigrees
The small numbers of progeny in human families mean that it is impossible to
determine linkage on the basis of single matings. To obtain reliable RF
(recombination frequency) values, large sample sizes are necessary. However, if the
results of many identical matings can be combined, then a more reliable estimate can be
made. The standard way of doing so is to calculate Lod scores. Lod stands for “log of
odds.” The method simply calculates the probability of obtaining a set of results in a
family on the basis of independent assortment and a specific degree of linkage. Then the
ratio (odds) of the two probabilities is calculated, and the logarithm of this number is
calculated, which is the Lod. Because logarithms are exponents, the Lod score has the
useful feature that scores from different matings for which the same markers are used
can be added, hence providing a cumulative set of data either supporting or not
supporting some particular linkage value.
Mapping human genes by using human–rodent somatic cell hybrids
The technique of somatic cell hybridization is extensively used in
human genome mapping. The procedure uses cells growing in culture. A virus called
the Sendai virus has a useful property that makes the mapping technique possible. Each
Sendai virus has several points of attachment, so it can simultaneously attach to two
different cells if they happen to be close together. However, a virus is very small in
comparison with a cell, so the two cells to which the virus is attached are held very
close together indeed. In fact, the membranes of the two cells may fuse together and the
two cells become one — a binucleate heterokaryon. If suspensions of human and

mouse cells are mixed together in the presence of Sendai virus that has been inactivated
by ultraviolet light, the virus can mediate fusion of the cells from the different species.
When the cells have fused, the nuclei subsequently fuse to form a uni-nucleate
cell line composed of both human and mouse chromosome sets. Because the mouse and
human chromosomes are recognizably different in number and shape, the two sets in
the hybrid cells can be readily distinguished. However, in the course of subsequent cell
divisions, for unknown reasons the human chromosomes are gradually eliminated from
the hybrid at random. The loss of human
chromosomes can be arrested in the following way
to encourage the formation of a stable
partial hybrid (Figure 7).
Chromosome stains such as quinacrine and
Giemsa reveal a pattern of banding within the
chromosomes. The size and the position of these
bands vary from chromosome to chromosome, but
the banding patterns are highly specific and
invariant for each chromosome. Thus, it is easy to
identify the human chromosomes that are present
in any hybrid cell. Different hybrid cells are grown
separately into lines; eventually a bank of lines is
produced that contains, in total, all the human
chromosomes. With a complete bank of
chromosomes, we can begin to assign genes or
markers to chromosomes.
Figure 7.Cell-fusion techniques applied to human and mouse cells produce colonies,
each of which contains a full mouse genome plus a few human chromosomes (blue).
If the human chromosome set is homozygous for a human molecular marker—such
as an allele that controls a cell-surface antigen,
drug resistance, a nutritional requirement, a
specific protein, or a DNA marker — then the
presence or absence of this genetic marker in
each line of hybrid cells can be correlated with
the presence or absence of certain human
chromosomes in each line.
For example, chromosome 15 - contains
approximately 1200 genes, approximately 100
million base pairs, of which over 80% have
been determined.

SEX DETERMINATION AND THE INHERITANCE OF SEX-LINKED
TRAITS.
Sex is set of features, which provide recombination of genetic material during
reproduction. Sex is hereditary determined trait.
Human cells have 23 pairs of chromosomes – 22 pairs of autosomes (A - the same
for males and females) and 1 pair of sex chromosomes (marked XX and XY).
The female produce one kind of gametes with X chromosome and are termed as
homogametic. Males produce two kinds of gametes (50% sperms contain X
chromosome and 50% - Y chromosome) and are termed as heterogametic.
The sex is determined at the
moment of fertilization by the kind
of sperm that fuses with an ovum!!!
Gender ratio at birth corresponds
about 1:1.
In fact, sex ratio of males to females
born is 106:100. Possible explanation
of this fact is based on different size,
so sperm carrying it moves faster and
quite often reaches egg first.
There are other variants of chromosomal determination of sex. In birds and some
reptiles females are heterogametic (referred as ZW) and males are homogametic
(referred as ZZ). In some insects males have only one X chromosome (XO), and males
have two X chromosomes (XX). In honey bee females develop from fertilized diploid
egg and males develop by parthenogenesis from non-fertilized haploid eggs.
The X chromosome is a submetacentric
chromosome belonged to group C. There are
about 2000 human X-linked genes. It is about
6% of the total DNA. The Y chromosome, a
member of group G, is a small acrocentric
chromosome and contains just 78 genes. Traits
coded for by genes on the Y chromosome are
said to be holandric.
The sexual identity of an individual is
determined at several levels:
XX XY
X X Y
XX XY

Level Events Timing
Chromosomal /
genetic
XY = male
XX = female Fertilization
Gonadal sex Undifferentiated structure becomes
testis or ovary
9-16 weeks after
fertilization
Phenotypic sex
Development of external and internal
reproductive structures continues as
male or female in response to hormones
8 weeks after
fertilization
Gender identity Strong feeling of being male or female
develop
From childhood,
possibly earlier
Discovery of the sex-linked traits. In 1910, Morgan published details of his research in an article titled “Sex Limited Inheritance
in Drosophila". Just before Morgan’s discovery of the white-eyed, male fly, some careful work had been done on
the cells of Drosophila. They have three pair of autosomes (three pairs of chromosomes which are the
same for male and female) and a
pair of sex chromosomes. In the
female, the fourth pair is made
up of identical, rod-shaped
chromosomes called X
chromosome. In the male there
is only one X chromosome. The
other member of the pair is a
hook-shaped chromosome called
Y chromosome.
First, Morgan took the
white mutant and bred it with
pure red-eyed female flies. All
of the females that resulted from
that breeding had red eyes.
Morgan then took those red-eyed females and mated
them with the original white-eyed mutant male to
determine whether or not the inheritance of eye color
followed Mendel’s inheritance patterns. If Mendel’s
patterns applied to Morgan’s flies, there would be one
white-eyed fly to every three red-eyed flies in the
resulting generation of flies, regardless of sex.
Although Morgan did observe one white-eyed fly to
every three red flies, that inheritance pattern was not
shared equally across males and females. Most of the
white-eyed flies were male. That result indicated that
the flies did not follow Mendel’s ratio in a traditional
sense.
After observing the white-eye inheritance pattern,
Morgan hypothesized that a factor, or gene, controlling eye color was located on the X chromosome.
Female flies have two X chromosomes, and males have one X chromosome and one Y chromosome. If
a trait, like eye color, correlated with a specific factor on the X chromosome, then the trait was called

X-linked. Because males only have one X chromosome, they display all X-linked traits. Females, on
the other hand, often need an X-linked trait to exist on both X chromosomes to display that trait.
Morgan hypothesized that, in his breeding experiment, the first generation of flies contained males
only with white eyes because the gene controlling eye color was on the X chromosome. Males
displayed the white eye trait because the trait was present on their only X chromosome. Females did
not display the white eye trait because the trait was only present on one of their X chromosomes.
Sex traits in human can be categorized into three types of inheritance:
1) sex-linked,
2) sex-limited,
3) sex-influenced.
Sex-linked traits are controlled by genes present on X and Y chromosomes.
Sex of human beings influences on some other characters, the development of which
is determined by the genes located in autosomes of both sexes.
Difference Kind of character
Sex limited traits Sex influenced traits
Expression
(Manifestation)
Traits expressed in only one
sex. (It may be controlled by
sex linked or autosomal
loci).
They are expressed in both men
and women, but variously
(different degree of expressivity).
Examples
All secondary sexual
characters. Genes
determining beard growth or
mammary glands (breast
size).
Pattern baldness is a condition
which is dominant in men but
recessive in women; kind of
human singing voice (bass,
baritone, tenor, soprano, mezzo-
soprano, contralto)
All genes of sex chromosomes could be divided into three groups:
1) genes of X chromosome present on the regions which do not have
homologous regions on Y chromosome (such genes do not have allelic pair in Y
chromosome, they exist only in one copy in heterogametic gender (males) and called
hemizygous);
2) genes of non-homologous region of Y chromosome (traits encoded by
these genes are said to be holandric – they are present only in males and passed from
father to son);
3) genes of homologous regions of X and Y chromosomes -
(pseudoautosomal regions) – at the ends of chromosomes.
The pseudoautosomal region is homologous section of X and
Y chromosomes, i.e., a region of similarity between sex
chromosomes. The region is responsible for pairing the X and Y
chromosomes during meiotic prophase I. In this region genes are
present in two copies in males and females and thus are inherited

like autosomal genes, whereas other Y-linked genes are passed on only from father to
son.
These genes are also known as incompletely sex-linked because crossing over
may occur in the homologous sections of X and Y chromosomes. Certain examples of
such “XY-linked genes” in humans are achromatopsia (total colour blindness),
nephritis, xeroderma pigmentosum, etc.
There are X-linked (dominant or recessive) and Y-linked patterns of inheritance.
X-linked dominant mode of inheritance:
females are affected more often;
a dominant gene on the X chromosome causes a characteristic to be manifested
in the offspring;
When the father alone is the carrier of a defective gene associated with a
disease or disorder, he too will have the disorder. His children will inherit the
disorder as follows:
His daughters: 100% will have the disorder, since all of his daughters will
receive one copy of his single X chromosome.
His sons: none will have the disorder; sons do not receive an X chromosome
from their father.
when the mother alone is the carrier of a mutated gene, her daughters and
sons: 50% will have the disorder, 50% will be completely unaffected.

X-linked dominant mode of inheritance
X-linked recessive mode of inheritance
X-linked recessive disease usually occurs in males who have inherited a recessive
X-linked mutation from their mother. Rarely, the disease may be seen in females who
have inherited mutations in the same gene X-linked from both parents. More typically,
the mother is a carrier and is unaffected, although it is not uncommon for female
carriers of X-linked disorders to have mild clinical manifestations related to the
disorder.
A male child of a woman who is a carrier has a 50% risk of inheriting the
disorder.
A female child of a woman who is a carrier has a 50% risk of inheriting
the gene mutation and thus being a carrier herself.
An affected male - if able to reproduce - will pass on the gene mutation to
all daughters, who are therefore obligate carriers. The affected male never
passes the disease on to a son.
The typical family history for an X-linked recessive condition is of disease in maternal
uncles. A woman who has both a brother and a son affected with an X-linked disease is
also an obligate carrier.
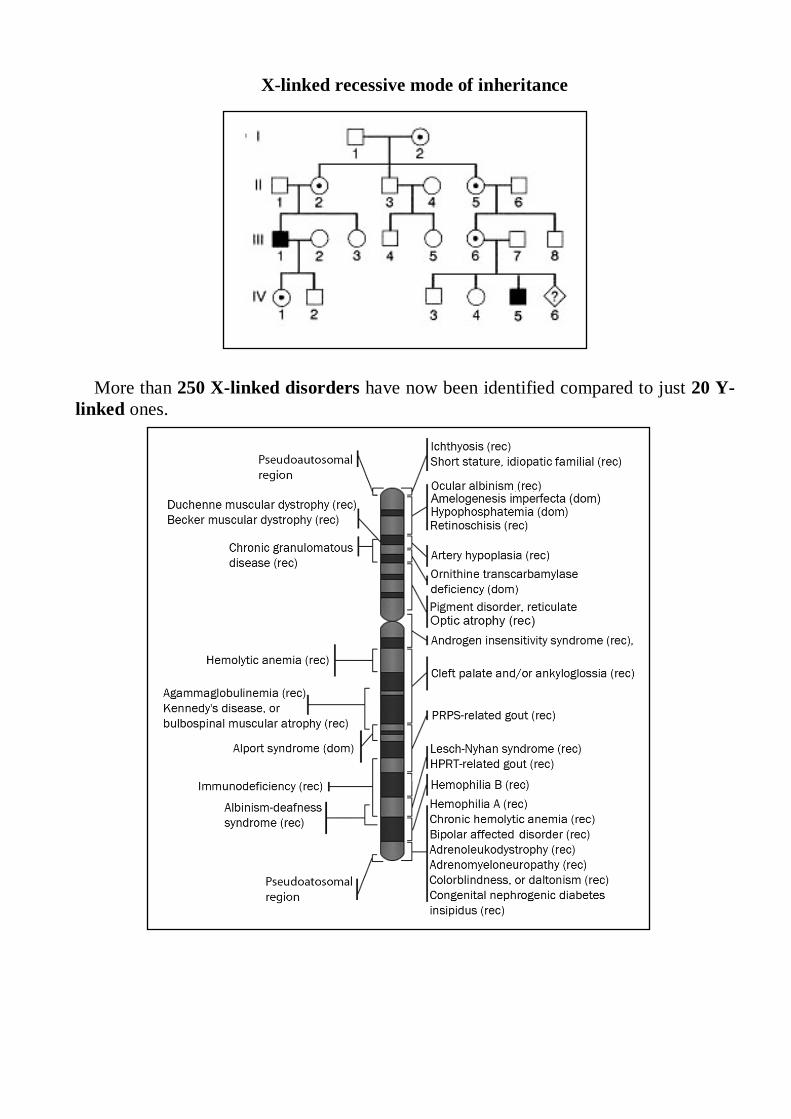
X-linked recessive mode of inheritance
More than 250 X-linked disorders have now been identified compared to just 20 Y-
linked ones.

Inheritance of hemophilia
in theRoyal family of
Queen Victoria
Y -linked mode of inheritance:
only men are affected;
genes are simply passed from father to all son;
each affected son has affected father.
Examples: syndactily,
haired pinna
Human males differ from human females in the fact that they have an Y
chromosome and females do not.
In 1990, the SRY gene (which
stands for Sex-Determining
region Y gene) was found. In
humans, a single functional copy
of the SRY gene, normally located
on the Y chromosome, determines
phenotypic maleness by causing
gonads to differentiate into testes.
This gene codes for TDF protein
(Testis Determining Factor). In the
absence of a functional SRY gene,
gonads differentiate into ovaries and the individual is phenotypically female An Introduction to Genetic Analysis. 7th edition. Griffiths AJF, Miller JH, Suzuki DT, et
al. New York: W. H. Freeman; 2000.