lecture 4: case study – south koreawbrooks/lecture4.pdf · the case of south korea 50 million...
TRANSCRIPT
Lecture 4: Case Study – South Korea
1
28 January 2020
Prof. Wyatt Brooks
Policy is RiskyTruism:
Good policy is good.
Bad policy is bad.
Good policy and bad policy are hard to tell apart.
Inherent risk to government policy
Sometimes decentralized decision-making is better
than centralized decision-making
Always?
South Korea South Korea is considered a “growth miracle”
From very poor to very rich in 50 years
Common story:
“Embraced free markets and economy took off”
That’s “70% right, 30% wrong”
More complicated than that
Go through details of South Korea’s experience
Compare to Argentina (next class)

The Case of South Korea
50 million people 38,000 sq miles (a little larger
than Indiana) 2014 per capita GDP
(nominal): $25,970 (about half of the US)
2014 per capita GDP (G-K $): $35,700 (about 2/3 of the US)
Currency: Won (KRW) Democratic government Major industries: electronics
(Samsung, LG) , automotives(Hyundai), shipbuilding
Major cities: Seoul, Busan
Korea up to the 20th Century Korea was united until end of WW2
Called the “Hermit Kingdom” because of isolation
Relationship with China defined its history
Solidly within Chinese sphere of influence until the
late 19th century
Relatively poor (compared to China)
Invaded by Japan and ruled as a colony from 1910-
1945
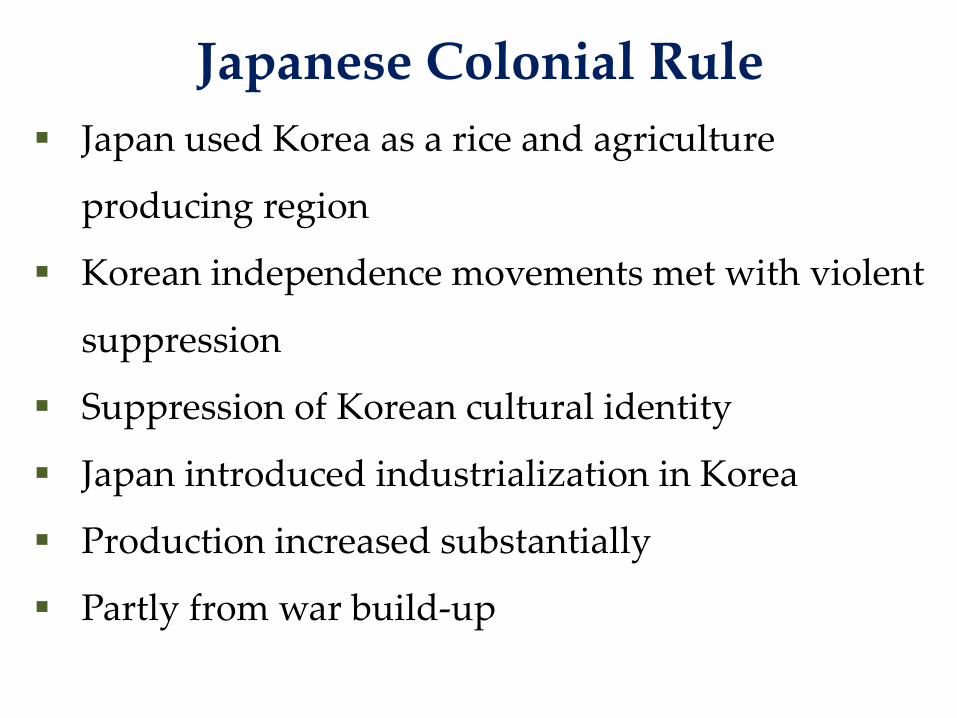
Japanese Colonial Rule Japan used Korea as a rice and agriculture
producing region
Korean independence movements met with violent
suppression
Suppression of Korean cultural identity
Japan introduced industrialization in Korea
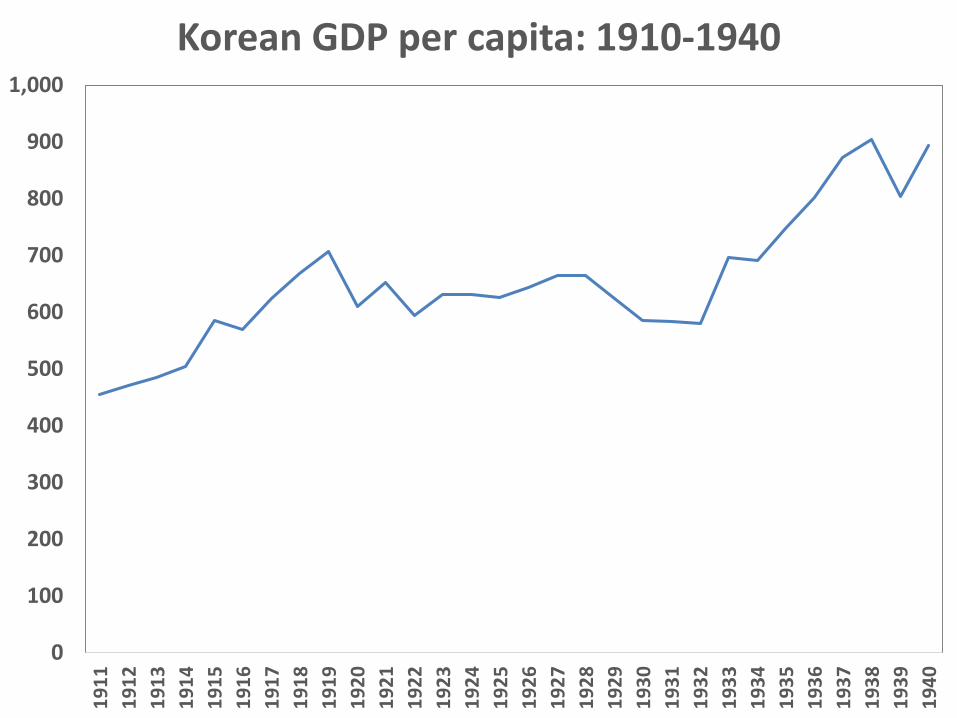
Production increased substantially
Partly from war build-up
0
100
200
300
400
500
600
700
800
900
1,00019
1119
1219
1319
1419
1519
1619
1719
1819
1919
2019
2119
2219
2319
2419
2519
2619
2719
2819
2919
3019
3119
3219
3319
3419
3519
3619
3719
3819
3919
40
Korean GDP per capita: 1910-1940

World War II and aftermath During World War II, Korea was used to produce
for the Japanese war effort
Large number of Korean workers moved to Japan
to work in Japanese factories
With the surrender of Japan, Korea became
independent
Korea separated at the 38th parallel, the north
administered by USSR and the south by USA
Korean War USSR withdrew troops in 1948 and the USA in 1949
North Korean army invaded South Korea on June
25th, 1950
Ideological conflict between socialism (north)
and capitalism (south)
South Korean army was unprepared and was badly
beaten
By August 1950, South Korean government only
controlled the “Pusan Perimeter”
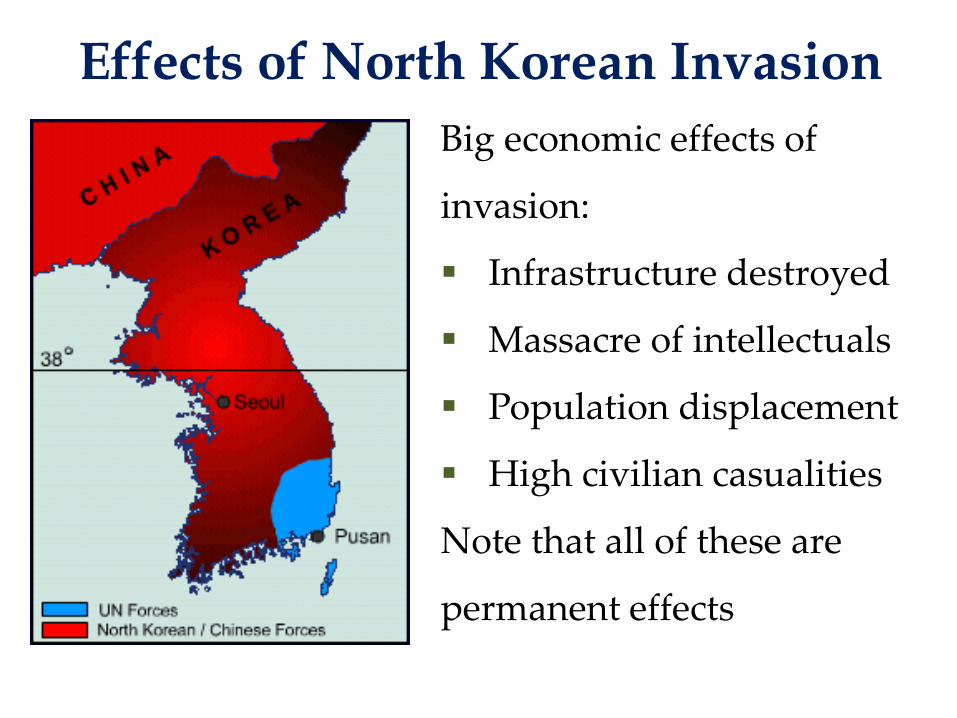
Effects of North Korean InvasionBig economic effects of
invasion:
Infrastructure destroyed
Massacre of intellectuals
Population displacement
High civilian casualities
Note that all of these are
permanent effects
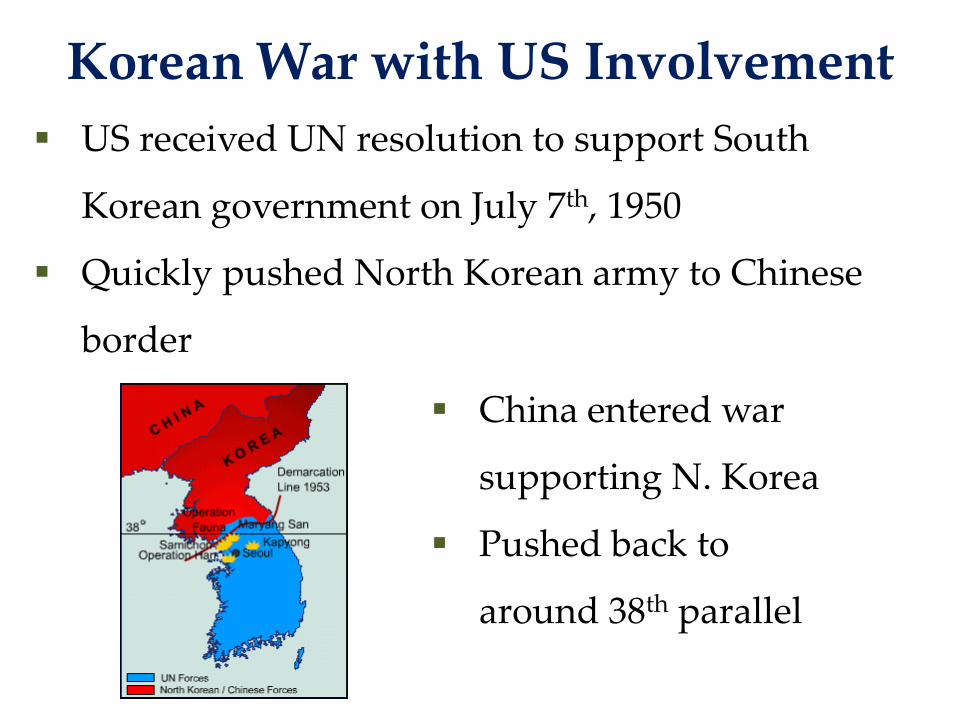
Korean War with US Involvement US received UN resolution to support South
Korean government on July 7th, 1950
Quickly pushed North Korean army to Chinese
border
China entered war
supporting N. Korea
Pushed back to
around 38th parallel
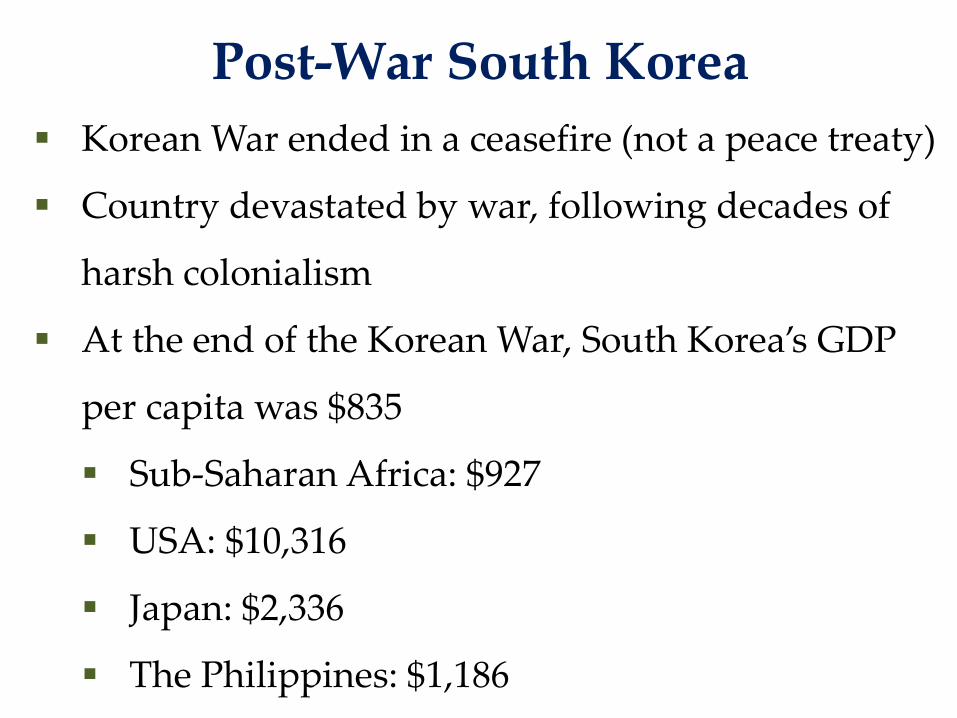
Post-War South Korea Korean War ended in a ceasefire (not a peace treaty)
Country devastated by war, following decades of
harsh colonialism
At the end of the Korean War, South Korea’s GDP
per capita was $835
Sub-Saharan Africa: $927
USA: $10,316
Japan: $2,336
The Philippines: $1,186

Post-War Politics and Economy Syngman Rhee ruled South Korea through the war
until 1960
Economic mismanagement and stagnation
Increasingly autocratic
Election rigging and centralization of power
After extremely fraudulent 1960 election,
overthrown by popular student-led movement

Military Dictatorship After the Rhee government fell, popularly elected
leftist government came into power
Anti-military, anti-police policies
Military leaders under General Park Chung-hee
took over the government
Stated reason was to protect the state from
communism
Also, obvious self-interest

Summary up to 1961South Korea in 1961 had:
Long history of exploitative colonial rule
Series of recent, devastating wars
Used by large foreign powers to fight proxy wars
Unstable and ineffective governments
Military control of state
In 1961, had 1/10th US GDP per capita
Sound familiar?
Economic Policy under Gen. Park Big inflows of aid from Japan and USA
Export-oriented growth:
Provided zero interest loans for exports
Promoted imports of raw materials and
exports of foreign goods
Normalized relations with Japan
Industrial policy: textiles, then heavy industry,
then heavy chemicals
Heavy government borrowing
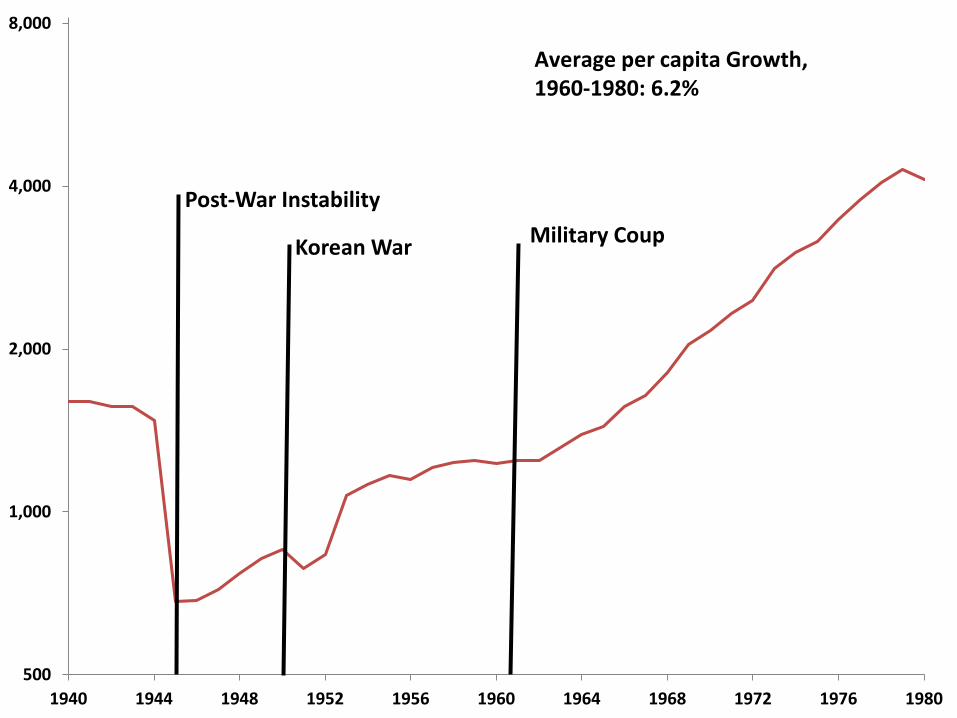
500
1,000
2,000
4,000
8,000
1940 1944 1948 1952 1956 1960 1964 1968 1972 1976 1980
Average per capita Growth, 1960-1980: 6.2%
Korean War Military CoupPost-War Instability

Transition to Democracy In 1979, General Park was assassinated
Followed two months later by another coup,
leading to another military government
Spring/Summer 1987: May 18th: Catholic Priests for Justice Association
reveals student tortured to death June 10th: Government announces choice as next
military-backed president June 10-29th: Nation-wide pro-democracy protests June 29th: Government accedes to pro-democracy
demands
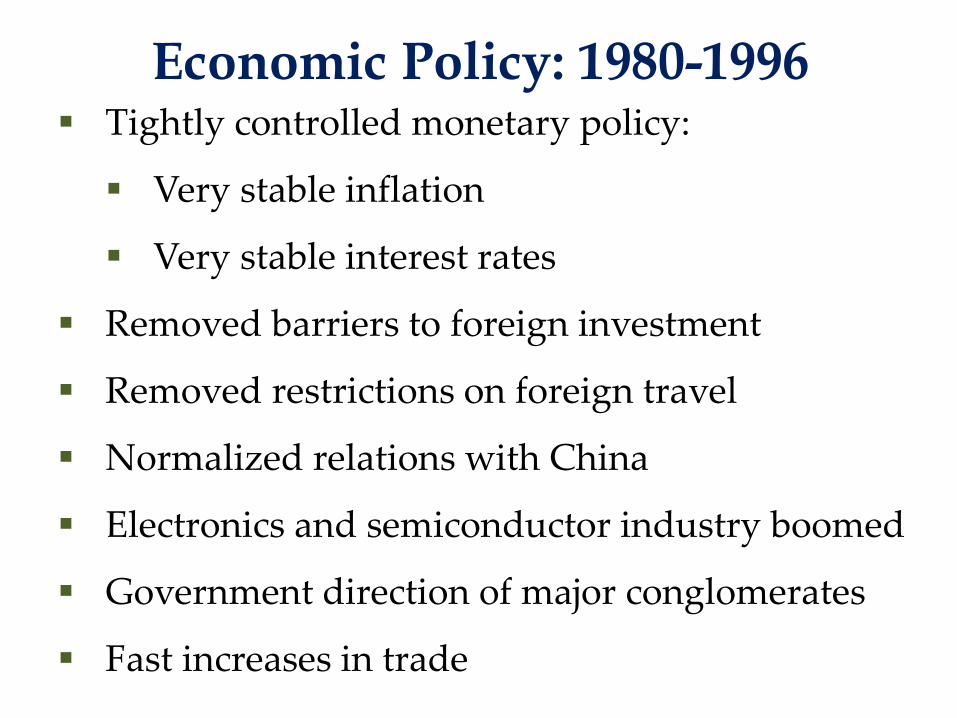
Economic Policy: 1980-1996 Tightly controlled monetary policy:
Very stable inflation
Very stable interest rates
Removed barriers to foreign investment
Removed restrictions on foreign travel
Normalized relations with China
Electronics and semiconductor industry boomed
Government direction of major conglomerates
Fast increases in trade
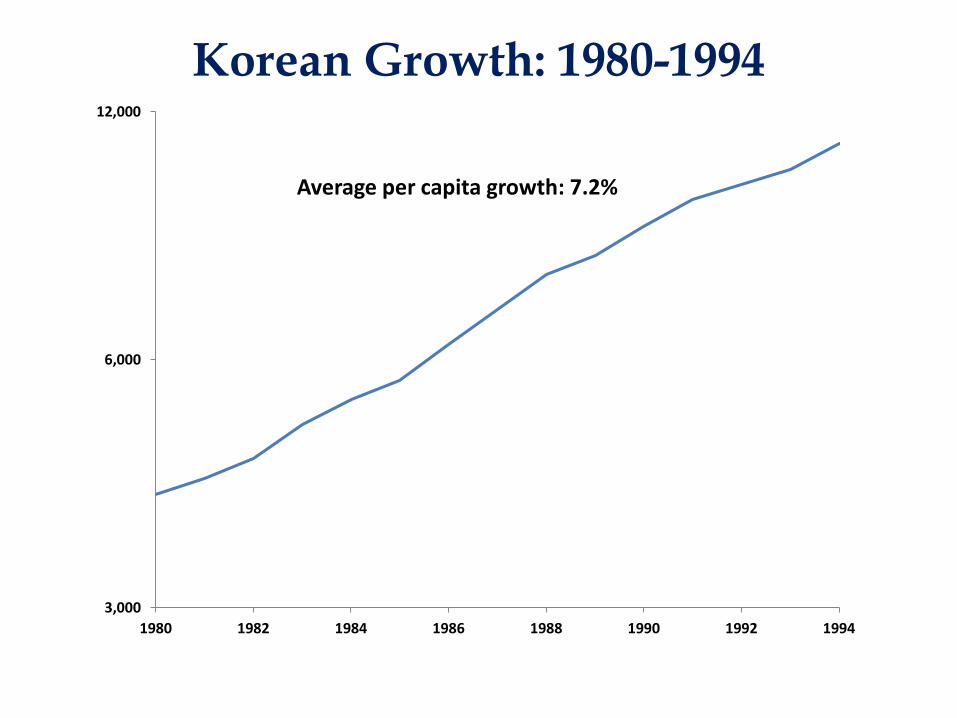
Korean Growth: 1980-1994
3,000
6,000
12,000
1980 1982 1984 1986 1988 1990 1992 1994
Average per capita growth: 7.2%
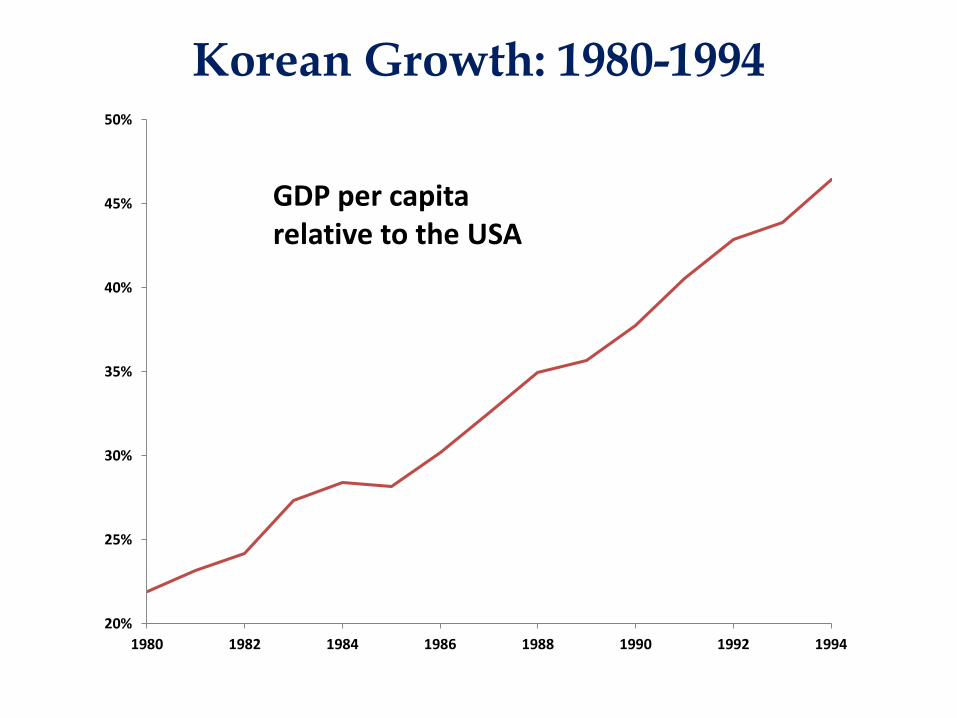
Korean Growth: 1980-1994
20%
25%
30%
35%
40%
45%
50%
1980 1982 1984 1986 1988 1990 1992 1994
GDP per capita relative to the USA
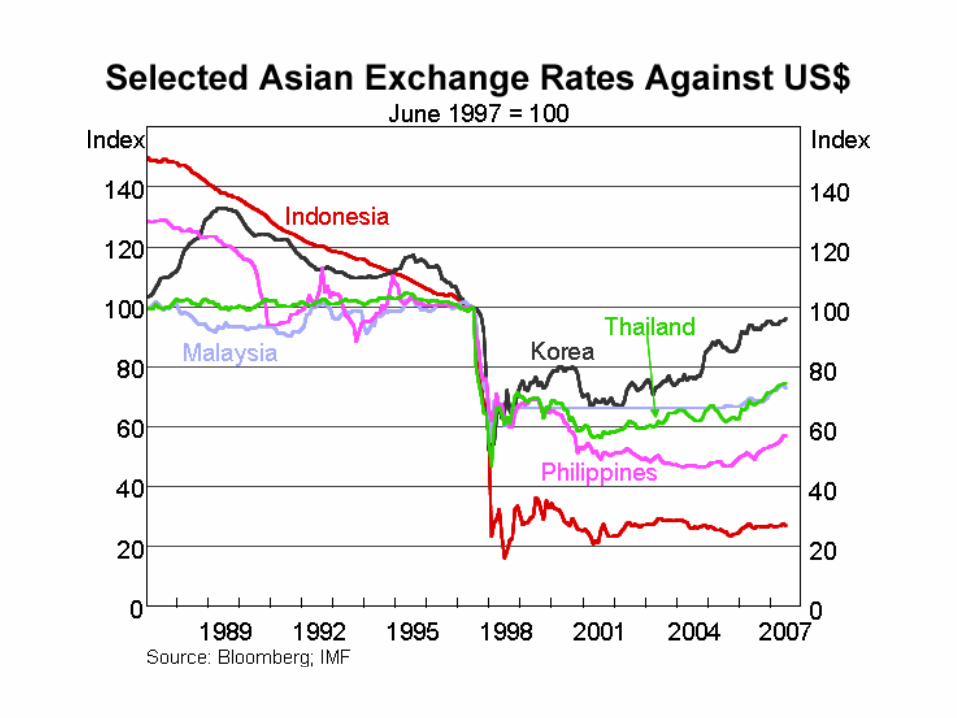
Asian Financial Crisis South Korea very dependent on trade and
foreign financing
Small changes in exchange rates had a big effect
on the economy
Several east Asian economies started to have
problems (Thailand, Indonesian, Malaysia)
Investors worried about South Korea and
stopped lending, leading to big swings in
exchange rates

Asian Financial Crisis, conclusion The International Monetary Fund (IMF) gave
South Korea a $30.2 billion emergency loan
IMF is designed to help stabilize currencies
Required country to pursue austerity measures
Less spending by government
More taxes
Losses in growth were temporary

Korean Growth: 1995-2008
40%
45%
50%
55%
60%
65%
70%
1994 1996 1998 2000 2002 2004 2006 2008
GDP per capita relative to the USA

Korean Growth: 1911-2008
500
1,000
2,000
4,000
8,000
16,000
32,000
1911 1923 1935 1947 1959 1971 1983 1995 2007
Average per capita Growth, 1960-2008: 6%
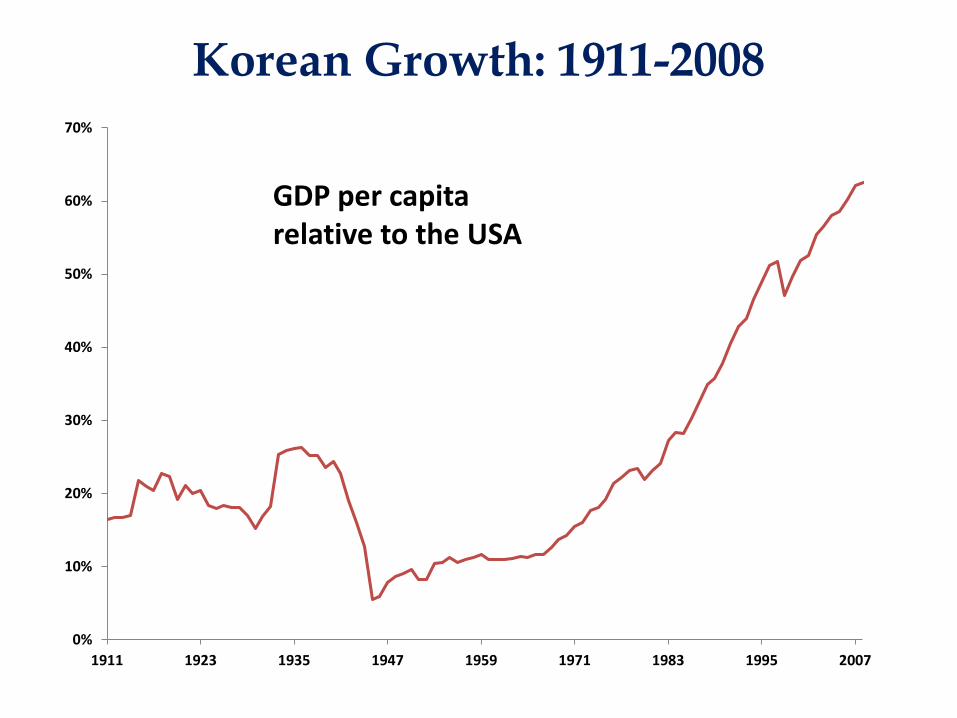
Korean Growth: 1911-2008
0%
10%
20%
30%
40%
50%
60%
70%
1911 1923 1935 1947 1959 1971 1983 1995 2007
GDP per capita relative to the USA
What did we learn? Thought experiment: If you were the leader of a
country that is currently poor, what can you
learn from South Korea?