lecture 4 1.protein function prediction using network concepts 2.hierarchical clustering
TRANSCRIPT

Lecture 4
1.Protein Function prediction using network concepts
2.Hierarchical Clustering

Topology of Protein-protein interaction is informative but further analysis can reveal other information.
A popular assumption, which is true in many cases is that similar function proteins interact with each other.
Based on these assumption, we have developed methods to predict protein functions and protein complexes from the PPI networks mainly based on cluster analysis.

Cluster Analysis
Cluster Analysis, also called data segmentation, implies grouping or segmenting a collection of objects into subsets or "clusters", such that those within each cluster are more closely related to one another than objects assigned to different clusters.
In the context of a graph densely connected nodes are considered as clusters
Visually we can detect two clusters in this graph

K-cores of Protein-Protein Interaction Networks
Definition
Let, a graph G=(V, E) consists of a finite set of nodes V and a finite set of edges E.
A subgraph S=(V, E) where V V and E E is a k-core or a core of order k of G if and only if v V: deg(v) k within S and S is the maximal subgraph of this property.

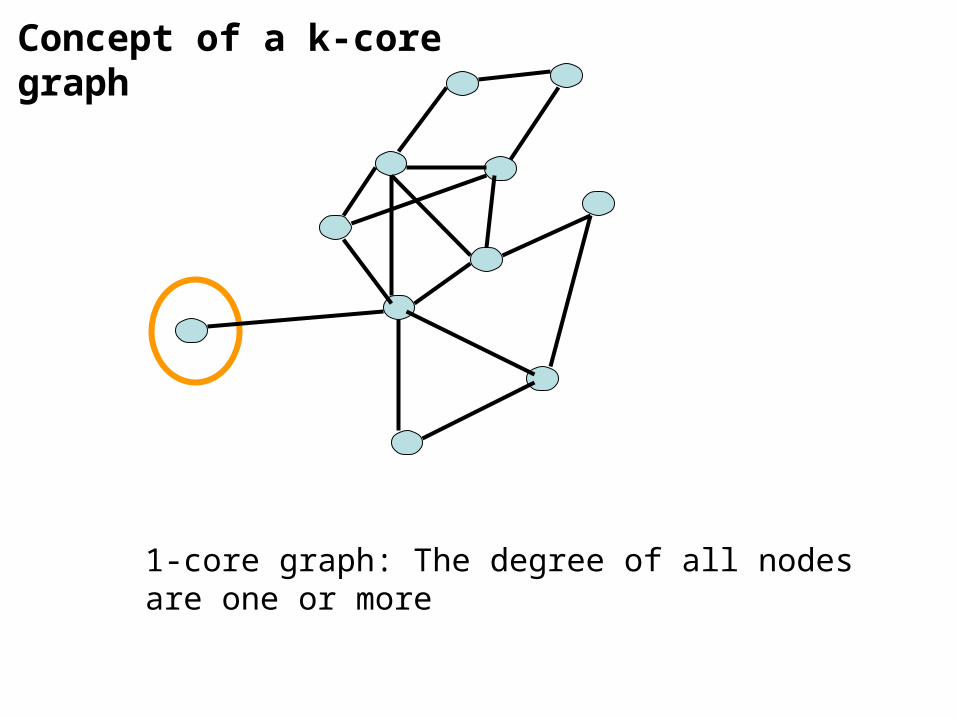
1-core graph: The degree of all nodes are one or more
Graph G
Concept of a k-core graph
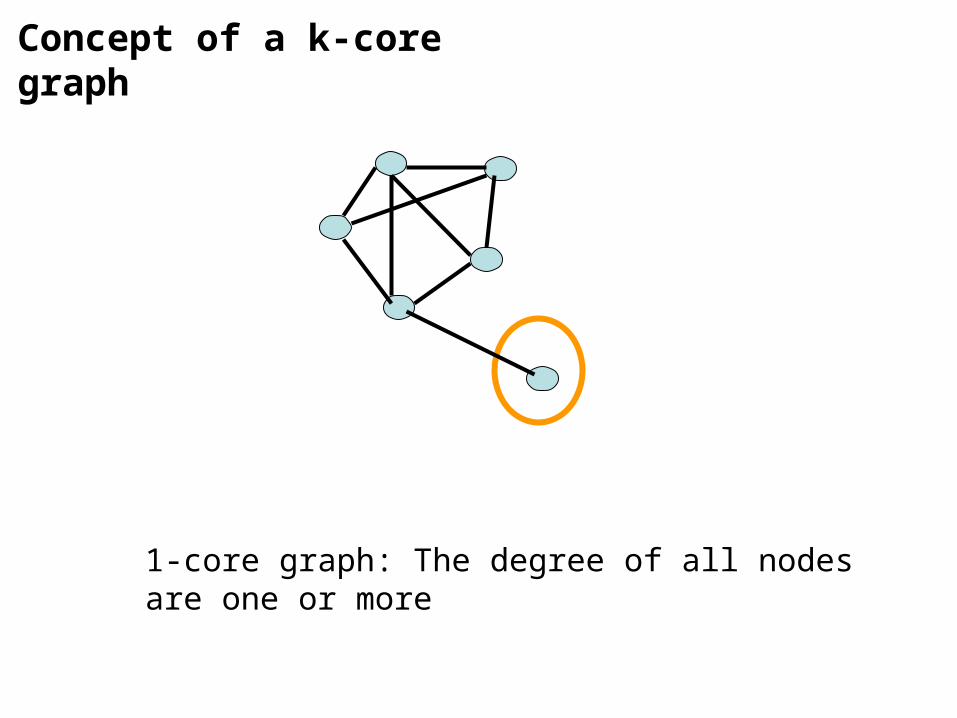
1-core graph: The degree of all nodes are one or more
Concept of a k-core graph

2-core graph: The degree of all nodes are two or more
Concept of a k-core graph
1-core graph: The degree of all nodes are one or more
Concept of a k-core graph

3-core graph: The degree of all nodes are three or more
The 3-core is the highest k-core subgraph of the graph G
Graph G

Analyzing protein-protein interaction data obtained from different sources, G. D. Bader and C.W.V. Hogue, Nature biotechnology, Vol 20, 2002
Application of a k-core graph


Protein function prediction using k-core graphs

Hishigaki, H., Nakai, K., Ono, T., Tanigami, A., and Tagaki, T. Assessment of prediction accuracy of protein function from protein-protein interaction data. Yeast 18, 523-531 (2001)
Reported similar results..
Schwikowski, B., Uetz, P. and Fields, S. A network of protein-protein interactions in yeast. Nature Biotech. 18, 1257-1261 (2000)
Deals with a network of 2039 proteins and 2709 interactions.
65% of interactions occurred between protein pairs with at least one common function
Introduction : Function prediction

14
HypothesisUnknown function proteins that form densely connected subgraph with proteins of a particular function may belong to that functional group.
Introduction : Function prediction
UNCLASSIFIED PROTEINS
CLASS A
UNCLASSIFIED PROTEINS
CLASS A
We utilize this concept by determining k-cores of strategically constructed sub-networks.

Prediction of Protein Functions Based on K-cores of Protein-Protein Interaction Networks
“Prediction of Protein Functions Based on K-cores of Protein-Protein Interaction Networks and Amino Acid Sequences”, Md. Altaf-Ul-Amin, Kensaku Nishikata, Toshihiro Koma, Teppei Miyasato, Yoko Shinbo, Md. Arifuzzaman, Chieko Wada, Maki Maeda, Taku Oshima, Hirotada Mori, Shigehiko Kanaya The 14th International Conference on Genome Informatics December 14-17, 2003, Yokohama Japan.
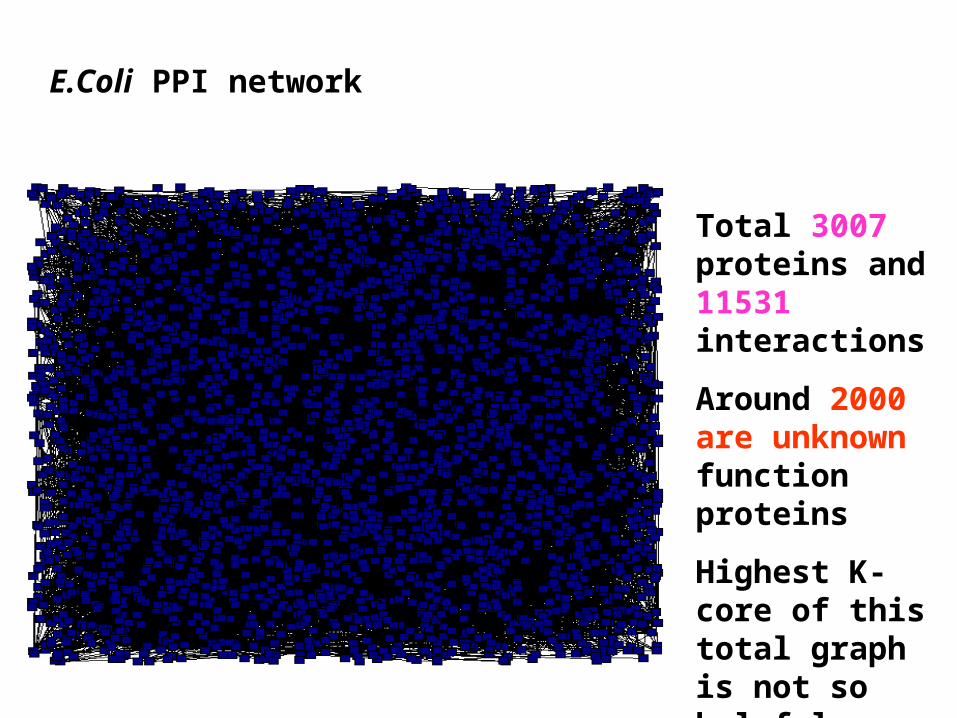
Total 3007 proteins and 11531 interactions
Around 2000 are unknown function proteins
Highest K-core of this total graph is not so helpful
E.Coli PPI network

10-core graph—the highest k-core of the E.Coli PPI network
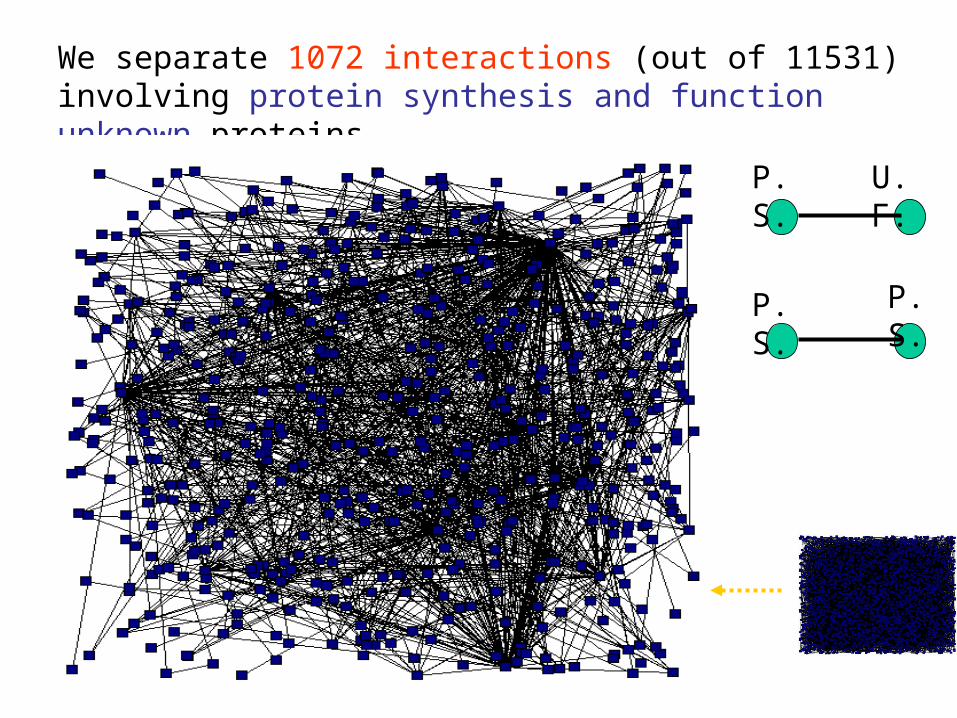
We separate 1072 interactions (out of 11531) involving protein synthesis and function unknown proteins.
P. S. U. F.
P. S. P. S.

Unknown
Function unknown Proteins of this 6-kore graph are likely to be involved in protein synthesis

Extending the k-core based function prediction method and its application to PPI data of Arabidopsis thaliana
Protein Function Prediction based on k-cores of Interaction Networks, Norihiko Kamakura, Hiroki Takahashi, Kensuke Nakamura, Shigehiko Kanaya and Md. Altaf-Ul-Amin, Proceedings of 2010 International Conference on Bioinformatics and Biomedical Technology (ICBBT 2010)

21
Materials and Methods : Dataset All PPI data of Arabidopsis thaliana
•3118 interactions involving 1302 proteins.
• Collected from databases and scientific literature by our laboratory.
Green= Unknown proteins
(289 proteins)
Pink= Known proteins
(1013 proteins)

22
function names number of proteinsCELL CYCLE AND DNA PROCESSING 69CELL FATE 5CELL RESCUE, DEFENSE AND VIRULENCE 32CELLULAR COMMUNICATION/ SIGNAL TRANSDUCTION MECHANISM 171CONTROL OF CELLULAR ORGANIZATION 3DEVELOPMENT (Systemic) 9ENERGY 51Endoplasmic reticulum biogenesis 4METABOLISM 120Mitochondria biogenesis 4PROTEIN ACTIVITY REGULATION 1PROTEIN FATE (folding, modification, destination) 112PROTEIN SYNTHESIS 20REGULATION OF / INTERACTION WITH CELLULAR ENVIRONMENT 1STORAGE PROTEIN 1SYSTEMIC REGULATION OF / INTERACTION WITH ENVIRONMENT 2TRANSCRIPTION 362TRANSPORT FACILITATION 46UNCLASSIFIED PROTEINS 289
Materials and Methods : Dataset
Functional groups in the network The PPI dataset contains proteins of 19 different functions according to the first level categories of the KNApSAcK database.

23
Materials and Methods : DatasetThe trends of interactions in the context of functional
similarity
function name No No 1 2 3 4 5 6 7 8 9 10 11 12 13 14 15 16 17 18 19METABOLISM 1 72 23 1 9 10 0 1 0 67 0 29 0 4 3 0 0 0 0 0UNCLASSIFIED PROTEINS 2 23 82 19 166 279 9 3 4 189 0 35 0 35 16 0 0 0 0 1CELL RESCUE, DEFENSE AND VIRULENCE 3 1 19 9 15 7 0 0 0 38 0 1 0 3 4 0 0 0 0 0TRANSCRIPTION 4 9 166 15 689 64 6 1 0 354 0 2 3 22 7 0 0 0 1 0PROTEIN FATE (folding, modification, destination) 5 10 279 7 64 137 0 9 2 20 0 22 2 7 5 0 0 0 0 0DEVELOPMENT (Systemic) 6 0 9 0 6 0 1 0 0 1 0 0 0 0 2 0 0 0 0 0CELL FATE 7 1 3 0 1 9 0 1 0 2 0 0 0 0 1 0 0 0 0 0PROTEIN SYNTHESIS 8 0 4 0 0 2 0 0 17 2 0 1 0 1 1 0 0 0 0 0CELLULAR COMMUNICATION/ SIGNAL TRANSDUCTION MECHANISM9 67 189 38 354 20 1 2 2 374 0 24 0 35 11 0 0 1 1 0Mitochondria biogenesis 10 0 0 0 0 0 0 0 0 0 3 0 0 0 0 0 0 0 0 0ENERGY 11 29 35 1 2 22 0 0 1 24 0 64 0 3 8 0 0 0 0 0SYSTEMIC REGULATION OF / INTERACTION WITH ENVIRONMENT 12 0 0 0 3 2 0 0 0 0 0 0 0 0 0 0 0 0 0 0CELL CYCLE AND DNA PROCESSING 13 4 35 3 22 7 0 0 1 35 0 3 0 44 2 2 0 0 0 0TRANSPORT FACILITATION 14 3 16 4 7 5 2 1 1 11 0 8 0 2 17 0 2 0 0 3CONTROL OF CELLULAR ORGANIZATION 15 0 0 0 0 0 0 0 0 0 0 0 0 2 0 1 0 0 0 0REGULATION OF / INTERACTION WITH CELLULAR ENVIRONMENT 16 0 0 0 0 0 0 0 0 0 0 0 0 0 2 0 0 0 0 0PROTEIN ACTIVITY REGULATION 17 0 0 0 0 0 0 0 0 1 0 0 0 0 0 0 0 0 0 0STORAGE PROTEIN 18 0 0 0 1 0 0 0 0 1 0 0 0 0 0 0 0 0 0 0Endoplasmic reticulum biogenesis 19 0 1 0 0 0 0 0 0 0 0 0 0 0 3 0 0 0 0 6
Diagonal elements show number of interactions between similar function proteins.
24
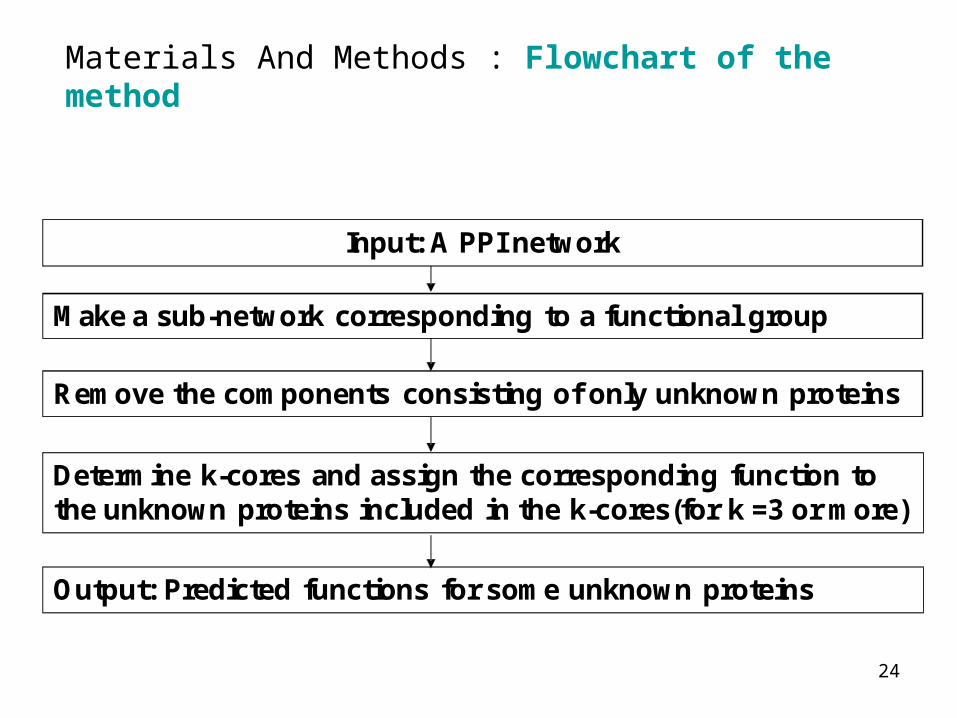
Materials And Methods : Flowchart of the method
Input: A PPI network
Make a sub-network corresponding to a functional group
Determine k-cores and assign the corresponding function to the unknown proteins included in the k-cores(for k =3 or more)
Output: Predicted functions for some unknown proteins
Remove the components consisting of only unknown proteins

25
Results : Subnetworks
we do not consider in this work the sub-networks that contain less than 100 interactions.And finally I consider subnetworks corresponding to 9 functional classes.
Subnetwork Name Number of interactions

26
Subnetwork extraction
Cellular communication-Cellular communication
Cellular communication-Unknown,
Unknown-Unknown
Total 603 interactions
We extracted the following 3 types of interactions.
Results : Subnetwork corresponding to cellular communication
As an example here we show the subnetworks and k-cores corresponding to cellular communication.

27
1-core
Results : Subnetwork corresponding to cellular communication
The red nodes : known proteins.The green nodes : unknown proteins.

28
2-core 3-core
The red color nodes represent known proteins, the green color nodes represent function unknown proteins.
Results : k-cores corresponding to cellular communication
The red nodes : known proteins.The green nodes : unknown proteins.

29
4-core 5-core
The red nodes : known proteins
The green nodes : unknown proteins.
6-core 7-core
This figure implies that determination of k-cores in strategically constructed sub-networks can reveal which unknown proteins are densely connected to proteins of a particular functional class.
Results : k-cores corresponding to cellular communication

30
k-core 2 k-core 3 k-core 4 k-core 5 k-core 6 k-core 7 k-core 8
cell_cycle 11 7
cell_rescue 4
cellular_communication 37 33 23 15 12 8
energy 5 2 2 2 2 2 2
metabo 5 1 1
protein_fate 69 35 25 25 15 10
protein_synthesis 2
transcription 33 24 14 11 8 8
transport_facilitation 2
total 129 88 64 52 36 27 2
The number of unknown genes included in different k-cores corresponding to different functional groups
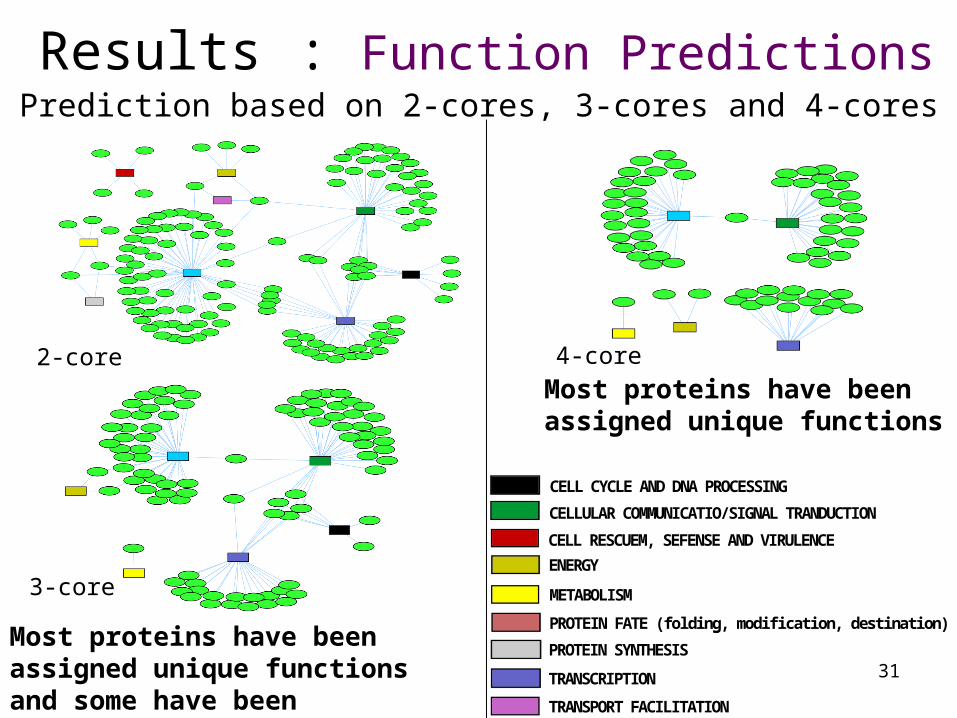
Results : Function Predictions
31
Most proteins have been assigned unique functions and some have been assigned multiple functions
2-core
3-core
Prediction based on 2-cores, 3-cores and 4-cores
Results : Function Predictions
4-core
Most proteins have been assigned unique functions
PROTEIN SYNTHESIS
METABOLISM
TRANSCRIPTION
PROTEIN FATE (folding, modification, destination)
TRANSPORT FACILITATION
CELL CYCLE AND DNA PROCESSING
ENERGY
CELL RESCUEM, SEFENSE AND VIRULENCE
CELLULAR COMMUNICATIO/SIGNAL TRANDUCTION
PROTEIN SYNTHESISPROTEIN SYNTHESIS
METABOLISMMETABOLISM
TRANSCRIPTIONTRANSCRIPTION
PROTEIN FATE (folding, modification, destination)PROTEIN FATE (folding, modification, destination)
TRANSPORT FACILITATIONTRANSPORT FACILITATION
CELL CYCLE AND DNA PROCESSINGCELL CYCLE AND DNA PROCESSING
ENERGYENERGY
CELL RESCUEM, SEFENSE AND VIRULENCECELL RESCUEM, SEFENSE AND VIRULENCE
CELLULAR COMMUNICATIO/SIGNAL TRANDUCTIONCELLULAR COMMUNICATIO/SIGNAL TRANDUCTION

32
Assessment of Predictions
However to assess statistically, we constructed 1000 random graphs consisting of the same 1,302 proteins but I inserted 3,118 edges randomly and constructed subnetworks.
When k is much larger than one, the effect of false positives is greatly reduced.
As most of the function predicted proteins are still unknown their annotations do not contain clear information on their functions.

Cell Cycle Cell Rescue Cellular Communication
Energy Metabolism Protein fate
Protein Synthesis
Transcription Transport
The box plots show the distribution of k-cores with respect to their size in 1000 graphs corresponding to each sub-network and the filled triangles show the size of k-cores in real PPI sub-networks.
Assessment of Predictions

3434
Assessment of Predictions•it can be theoretically concluded that the existence of higher order k-core graphs in PPI sub-networks compared to in the random graphs of the same size are likely to be because of interaction between similar function proteins. •Therefore we assume that the function prediction based on k-cores for the value of k greater than highest possible value of k for corresponding random graphs are statistically significant predictions.• Based on this we predicted the functions of 67 proteins(list is available online at http://kanaya.naist.jp/Kcore/supplementary/Function_prediction.xls.

“Prediction of Protein Functions Based on Protein-Protein Interaction Networks: A Min-Cut Approach”, Md. Altaf-Ul-Amin, Toshihiro Koma, Ken Kurokawa, Shigehiko Kanaya, Proceedings of the Workshop on Biomedical Data Engineering (BMDE), Tokyo, Japan, pp. 37-43, April 3-4, 2005.

Outline
•Introduction
•The concept of Min-Cut
•Problem Formulation
•A Heuristic Method
•Evaluation of the Proposed Method
•Conclusions

Outline
•Introduction
•The concept of Min-Cut
•Problem Formulation
•A Heuristic Method
•Evaluation of the Proposed Method
•Conclusions

Introduction
After the complete sequencing of several genomes, the challenging problem now is to determine the functions of proteins
1) Determining protein functions experimentally
2) Using various computational methods
a) sequence
b) structure
c) gene neighborhood
d) gene fusions
e) cellular localization
f) protein-protein interactions

Present work predicts protein functions based on protein-protein interaction network.
Introduction
For the purpose of prediction, we consider the interactions of
•function-unknown proteins with function-known proteins and
• function-unknown proteins with function-unknown proteins
In the context of the whole network.
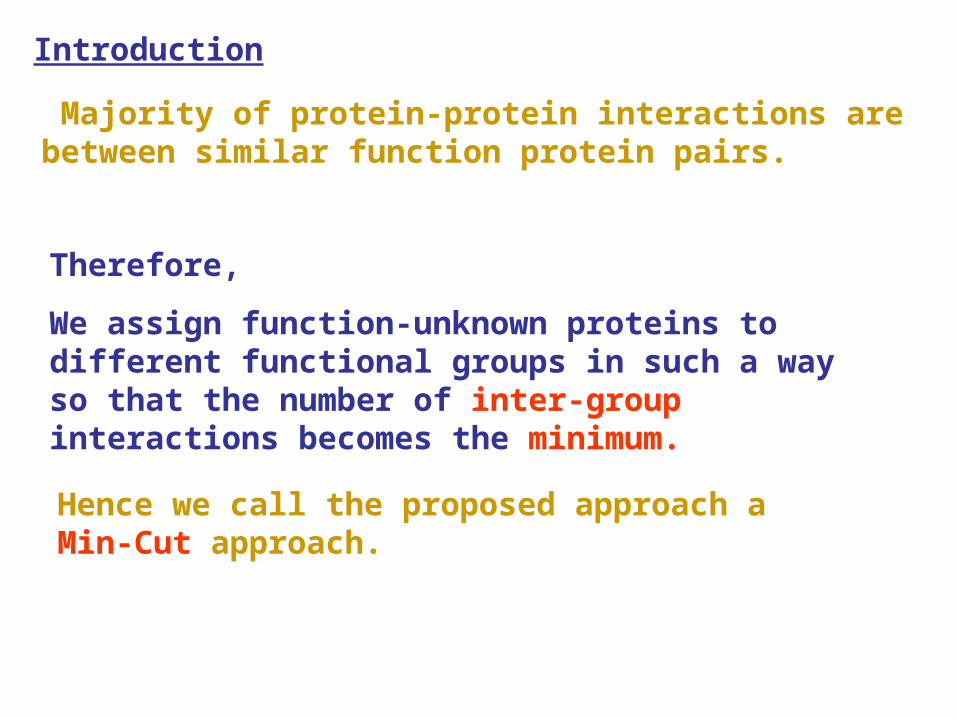
Hence we call the proposed approach a Min-Cut approach.
Introduction
Majority of protein-protein interactions are between similar function protein pairs.
Therefore,
We assign function-unknown proteins to different functional groups in such a way so that the number of inter-group interactions becomes the minimum.
Outline
•Introduction
•The concept of Min-Cut
•Problem Formulation
•A Heuristic Method
•Evaluation of the Proposed Method
•Conclusions

U4
K2K6
K4
K3
K1K8
K5U1
U2
U3
The concept of Min-Cut
G1
G2
A typical and small network of known and unknown proteins
U4
KK
K
K
KK
KU1
U2
U3
G1
G2
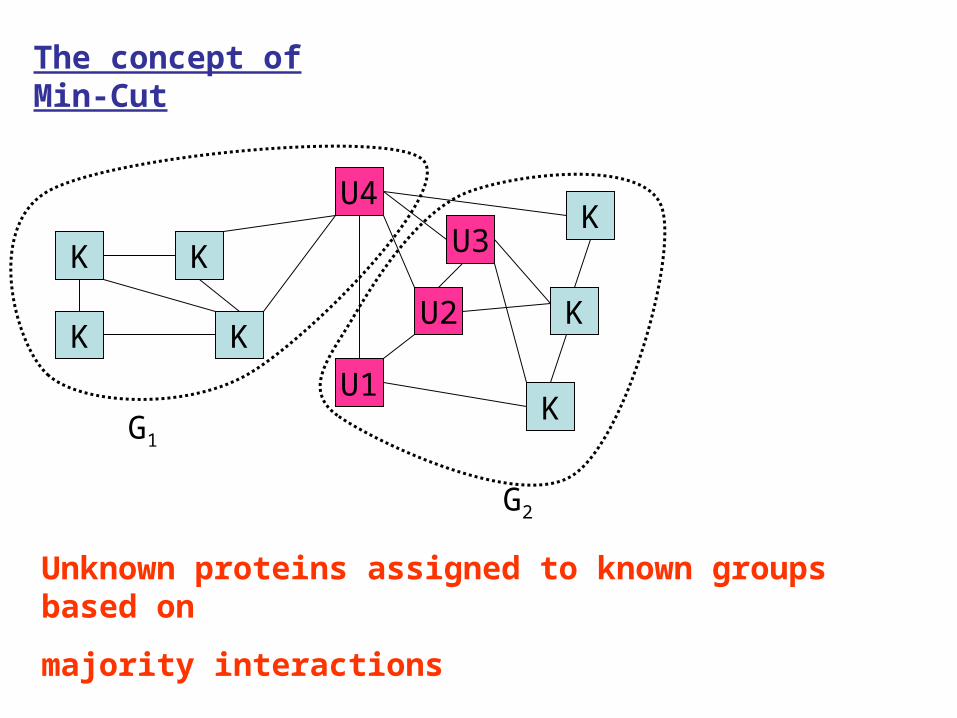
The concept of Min-Cut
Unknown proteins assigned to known groups based on
majority interactions
U4
KK
K
K
KK
KU1
U2
U3
G1
G2
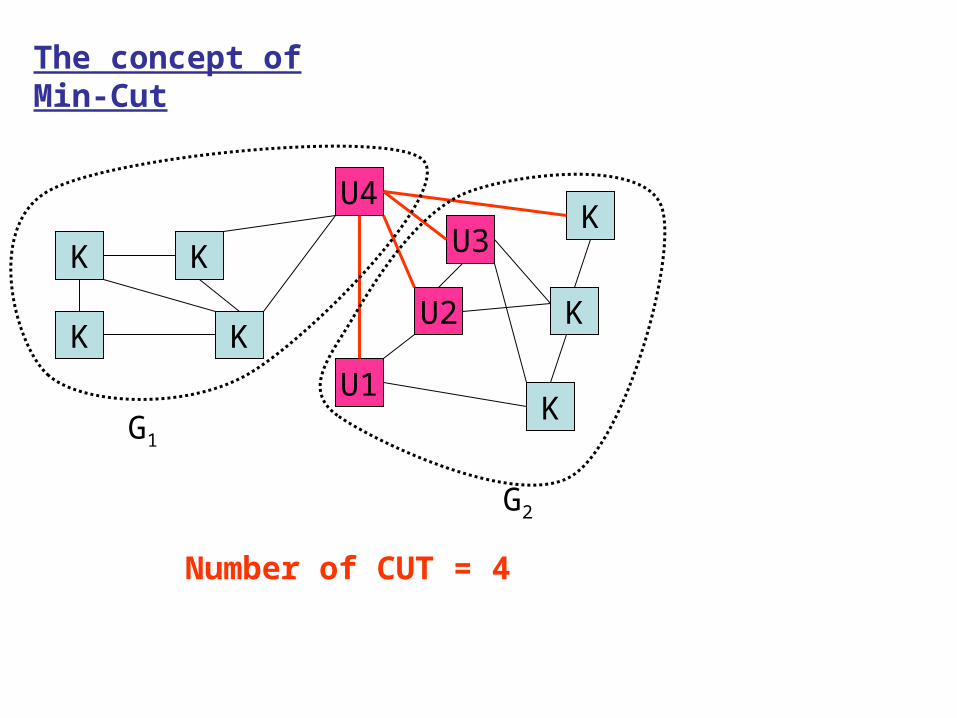
The concept of Min-Cut
Number of CUT = 4
U4
KK
K
K
KK
KU1
U2
U3
G1
G2
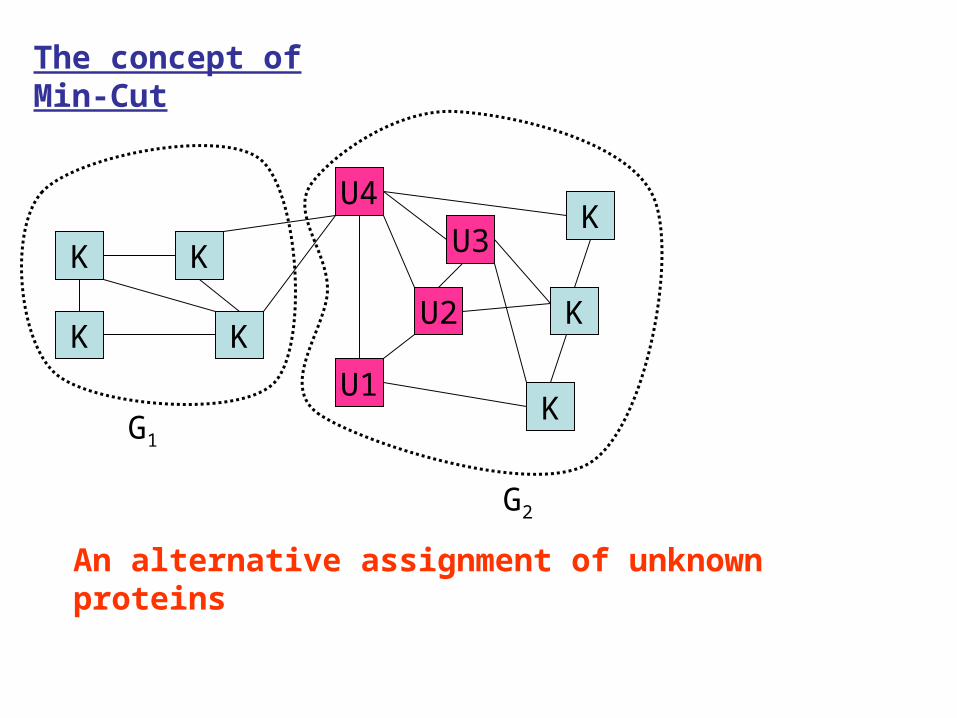
The concept of Min-Cut
An alternative assignment of unknown proteins

U4
KK
K
K
KK
KU1
U2
U3
G1
G2
The concept of Min-Cut
Number of CUT = 2
For every assignment of unknown proteins, there is a value of CUT.
Min-cut approach looks for an assignment for which the number of CUT is minimum.

Outline
•Introduction
•The concept of Min-Cut
•Problem Formulation
•A Heuristic Method
•Evaluation of the Proposed Method
•Conclusions

Problem Formulation
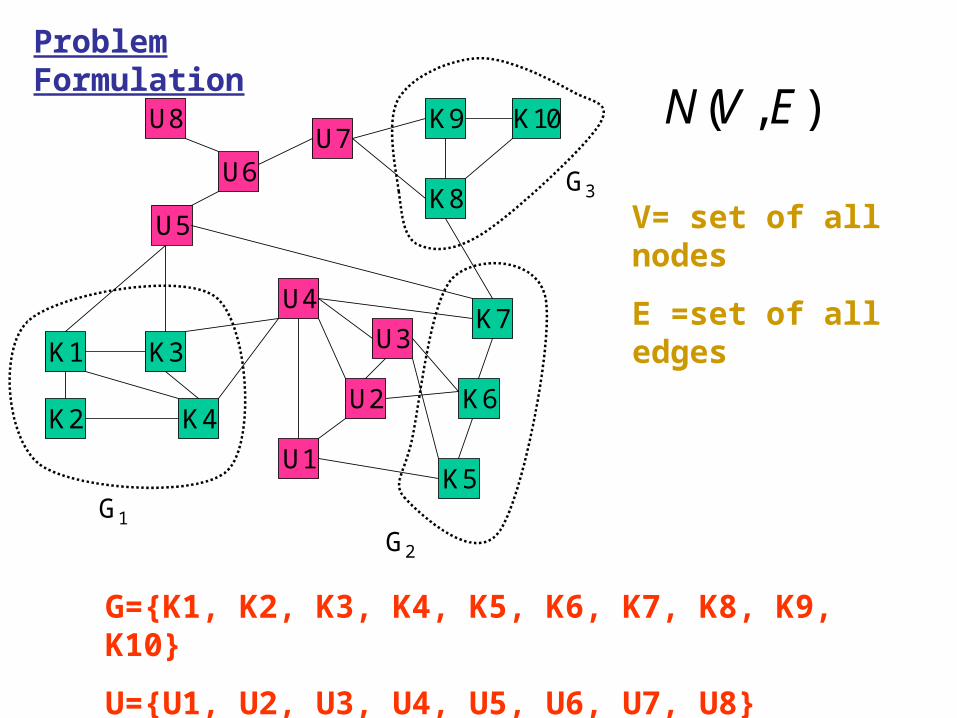
L e t 1G , 2G , … … . . , nG a r e n s e t s / g r o u p s o f f u n c t i o n -k n o w n p r o t e i n s s u c h t h a t a l l p r o t e i n s o f a g r o u p a r e o f s i m i l a r f u n c t i o n . M u l t i p l e f u n c t i o n p r o t e i n s a r e m e m b e r s o f m o r e t h a n o n e g r o u p . T h e r e f o r e , t h e s e t o f a l l f u n c t i o n - k n o w n p r o t e i n s 1
nk kG G . T h e s e t o f
f u n c t i o n - u n k n o w n p r o t e i n s i s d e n o t e d b y U . ( , )N V E i s a g r a p h / n e t w o r k w h e r e iv V i s a n o d e r e p r e s e n t i n g a p r o t e i n a n d ( , )i j i je v v E i s a n e d g e r e p r e s e n t i n g … … .
Here we explain some points with a typical example.
U4
K2K6
K3
K4
K1K7
K5U1
U2
U3
K10
K8
K9U7
U5
U8
U6
G1
G2
G3
( , )N V E
V= set of all nodes
E =set of all edges
G={K1, K2, K3, K4, K5, K6, K7, K8, K9, K10}
U={U1, U2, U3, U4, U5, U6, U7, U8}
Problem Formulation

U´= {U1, U2, U3, U4, U5, U6, U7}
Problem Formulation
We generate U´ U such that each protein of U´ is connected in N with at least one protein of group G by a path of length 1 or length 2.
U4
K2K6
K3
K4
K1K7
K5U1
U2
U3
K10
K8
K9U7
U5
U8
U6
G1
G2
G3

U4
K2K6
K3
K4
K1K7
K5U1
U2
U3
K10
K8
K9U7
U5
U8
U6
G1
G2
G3
For this assignment of unknown proteins, the CUT= 6
Interactions between known protein pairs can never be part of CUT
Problem FormulationWe can assign proteins of U´ to different groups and calculate CUT

The problem we are trying to solve is to assign the proteins of set U´ to known groups G1 , G2 ,…….., G3 in such a way so that the CUT becomes the minimum.
Problem Formulation
Outline
•Introduction
•The concept of Min-Cut
•Problem Formulation
•A Heuristic Method
•Evaluation of the Proposed Method
•Conclusions
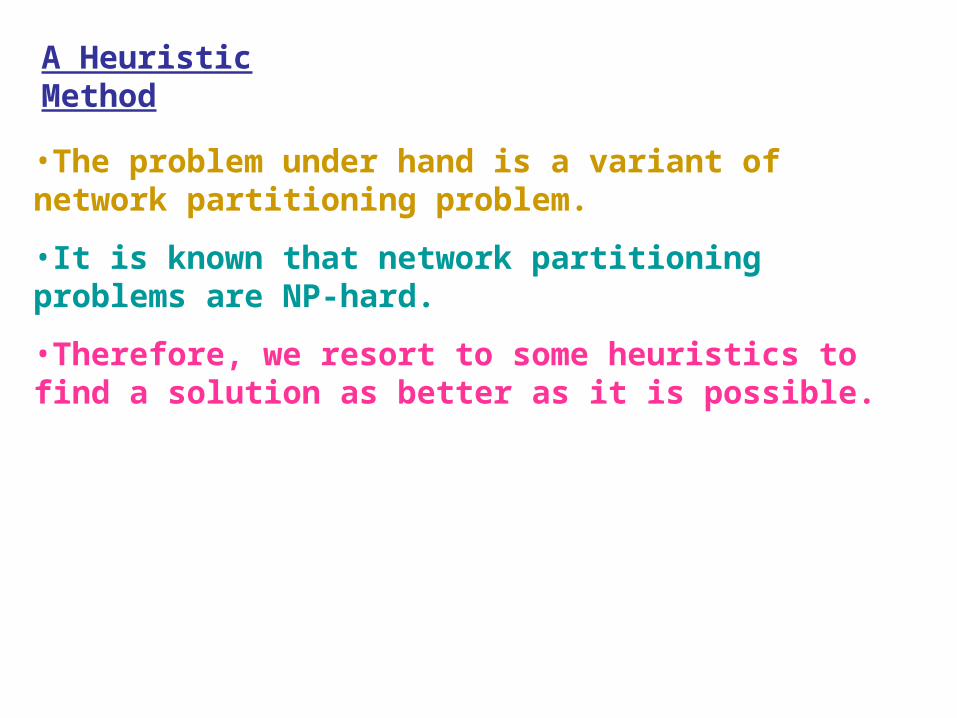
•The problem under hand is a variant of network partitioning problem.
•It is known that network partitioning problems are NP-hard.
•Therefore, we resort to some heuristics to find a solution as better as it is possible.
A Heuristic Method

A Heuristic Method min_cut = |E|
iteration = 0
Make a table for each protein of U containing maximum 3 IDs of respective priority groups
Assign each protein of Uto some randomly or intentionally chosen group from among its priority groups
Calculate CUT
CUT < min_cut
iteration = iteration + 1
iteration < max_value
min_cut = CUT Record the current
assignment
Print min_cut, corresponding assignment and Exit
YES
NO
NO
YES
U1
U2
U3
U4
U5
U6
U7
U1 G2 G1 x
U2
U3
U4
U5
U6
U7
U4
K2K6
K3
K4
K1K7
K5U1
U2
U3
K10
K8
K9U7
U5
U8
U6
G1
G2
G3
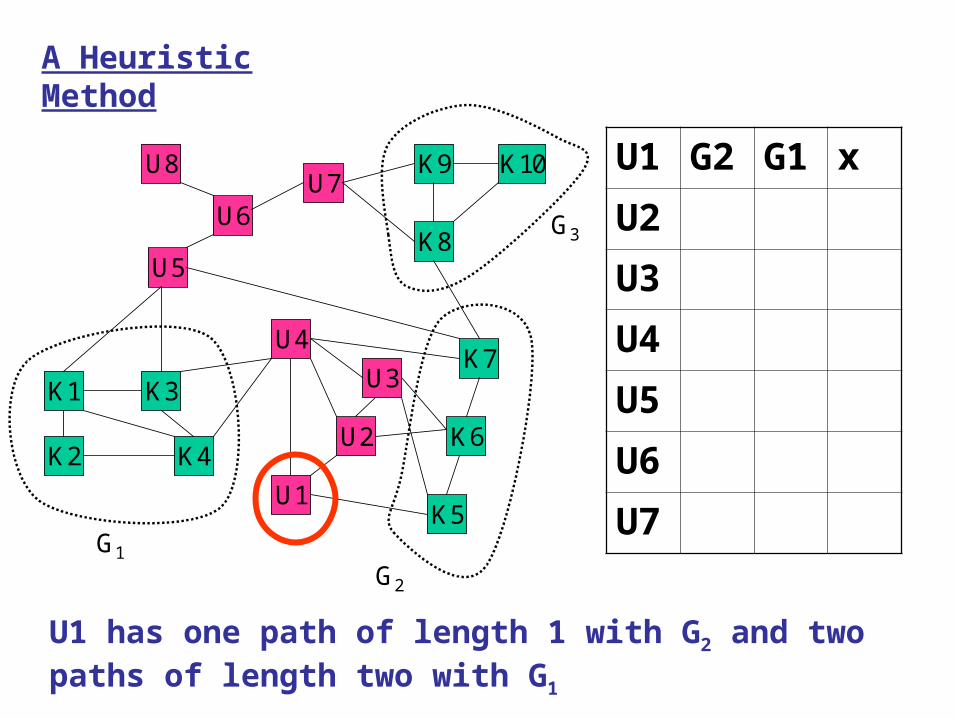
A Heuristic Method
U1 has one path of length 1 with G2 and two paths of length two with G1

U1 G2 G1 x
U2 G2 G1 x
U3 G2 G1 x
U4 G1 G2 G3
U5
U6
U7
U4
K2K6
K3
K4
K1K7
K5U1
U2
U3
K10
K8
K9U7
U5
U8
U6
G1
G2
G3
A Heuristic Method
U4 has two paths of length 1 with G1, one path of length one with G2 and one path of length two with G3.

U1 G2 G1 x
U2 G2 G1 x
U3 G2 G1 x
U4 G1 G2 G3
U5 G1 G2 G3
U6 G1 G3 G2
U7 G3 G2 x
U4
K2K6
K3
K4
K1K7
K5U1
U2
U3
K10
K8
K9U7
U5
U8
U6
G1
G2
G3
A Heuristic Method

U1 G2 G1 x
U2 G2 G1 x
U3 G2 G1 x
U4 G1 G2 G3
U5 G1 G2 G3
U6 G1 G3 G2
U7 G3 G2 x
A Heuristic Method min_cut = |E|
iteration = 0
Make a table for each protein of U containing maximum 3 IDs of respective priority groups
Assign each protein of Uto some randomly or intentionally chosen group from among its priority groups
Calculate CUT
CUT < min_cut
iteration = iteration + 1
iteration < max_value
min_cut = CUT Record the current
assignment
Print min_cut, corresponding assignment and Exit
YES
NO
NO
YES

U1 G2 G1 x
U2 G2 G1 x
U3 G2 G1 x
U4 G1 G2 G3
U5 G1 G2 G3
U6 G1 G3 G2
U7 G3 G2 x
U4
K2K6
K3
K4
K1K7
K5U1
U2
U3
K10
K8
K9U7
U5
U8
U6
G1
G2
G3
A Heuristic Method
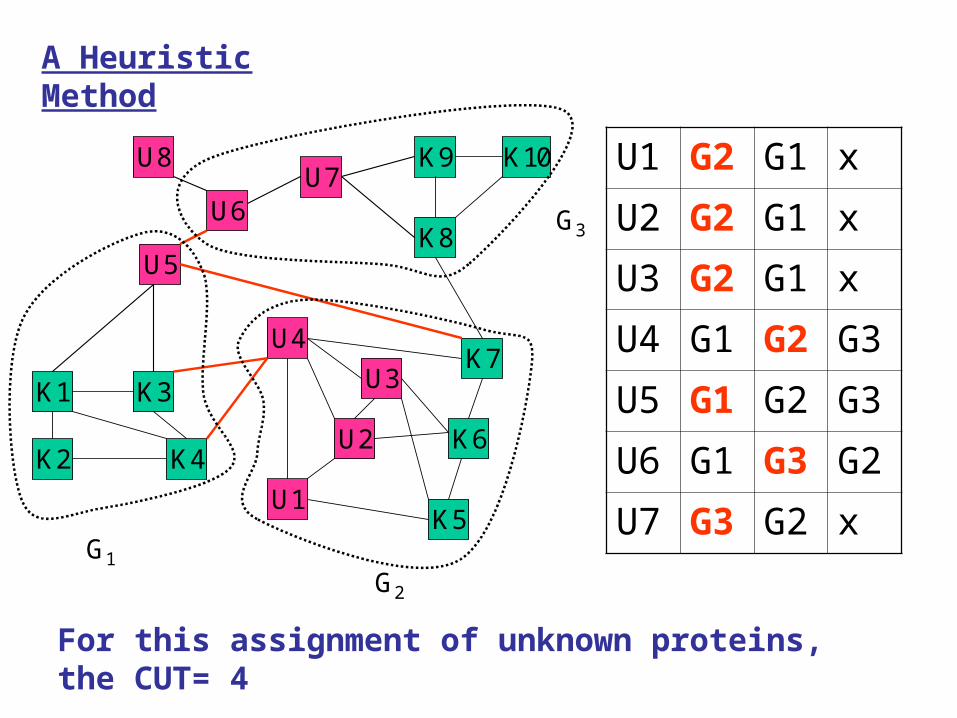
By assigning all the unknown proteins to respective height priority groups, CUT = 6
U1 G2 G1 x
U2 G2 G1 x
U3 G2 G1 x
U4 G1 G2 G3
U5 G1 G2 G3
U6 G1 G3 G2
U7 G3 G2 x
A Heuristic Method
U4
K2K6
K3
K4
K1K7
K5U1
U2
U3
K10
K8
K9U7
U5
U8
U6
G1
G2
G3
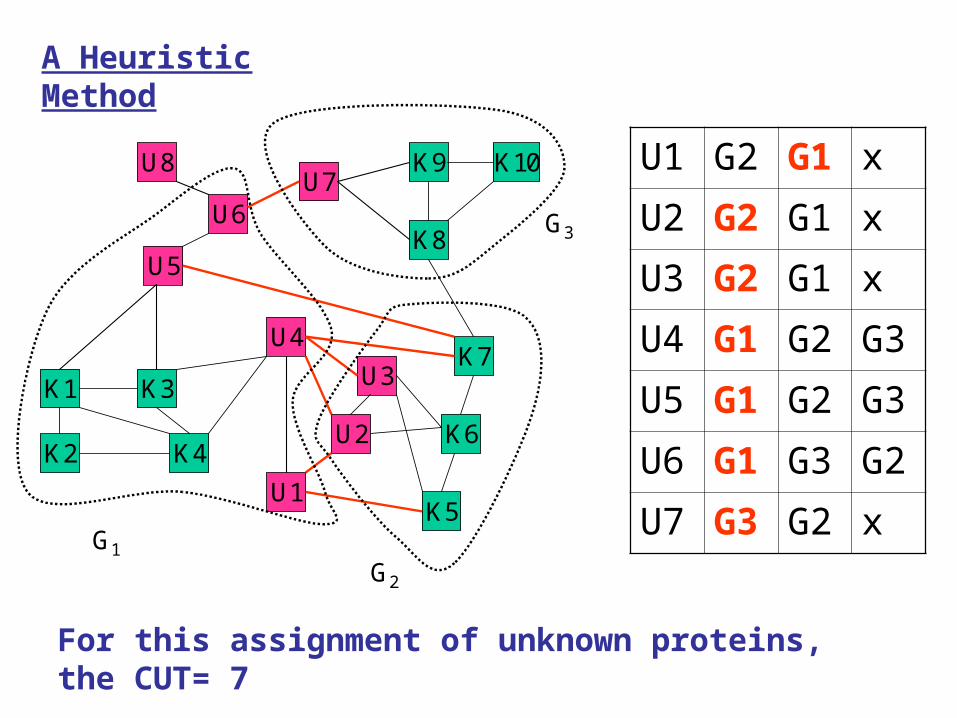
For this assignment of unknown proteins, the CUT= 7
U1 G2 G1 x
U2 G2 G1 x
U3 G2 G1 x
U4 G1 G2 G3
U5 G1 G2 G3
U6 G1 G3 G2
U7 G3 G2 x
U4
K2K6
K3
K4
K1K7
K5U1
U2
U3
K10
K8
K9U7
U5
U8
U6
G1
G2
G3
For this assignment of unknown proteins, the CUT= 4
A Heuristic Method

Outline
•Introduction
•The concept of Min-Cut
•Problem Formulation
•A Heuristic Method
•Evaluation of the Proposed Method
•Conclusions
Evaluation of the Proposed Approach
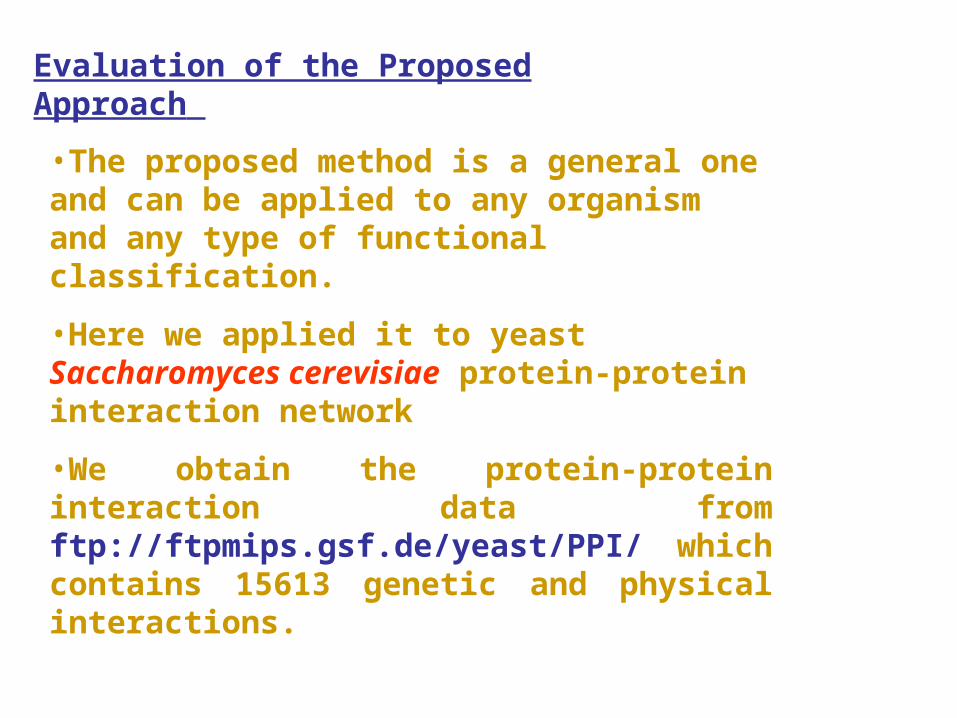
•The proposed method is a general one and can be applied to any organism and any type of functional classification.
•Here we applied it to yeast Saccharomyces cerevisiae protein-protein interaction network
•We obtain the protein-protein interaction data from ftp://ftpmips.gsf.de/yeast/PPI/ which contains 15613 genetic and physical interactions.

YAR019c YMR001c
YAR019c YNL098c
YAR019c YOR101w
YAR019c YPR111w
YAR027w YAR030c
YAR027w YBR135w
YAR031w YBR217w
------------- -------------
------------- -------------
Total 12487 pairs
We discard self-interactions and extract a set of 12487 unique binary interactions involving 4648 proteins.
Evaluation of the Proposed Approach

A network of 12487 interactions and 4648 proteins is reasonably big
Evaluation of the Proposed Approach

Name of functional class # of
proteins METABOLISM 984 ENERGY 260 CELL CYCLE AND DNA PROCESSING
690
TRANSCRIPTION 842 PROTEIN SYNTHESIS 381 PROTEIN FATE (folding, modification, destination)
631
PROTEIN WITH BINDING FUNCTION OR COFACTOR REQUIREMENT (structural or catalytic)
39
PROTEIN ACTIVITY REGULATION 27 CELLULAR TRANSPORT, TRANSPORT FACILITATION AND TRANSPORT ROUTES
719
CELLULAR COMMUNICATION/SIGNAL TRANSDUCTION MECHANISM
94
CELL RESCUE, DEFENSE AND VIRULENCE
296
INTERACTION WITH THE CELLULAR ENVIRONMENT
336
TRANSPOSABLE ELEMENTS, VIRAL AND PLASMID PROTEINS
118
BIOGENESIS OF CELLULAR COMPONENTS
451
CELL TYPE DIFFERENTIATION 339
We collect from http://mips.gsf.de/genre/proj/yeast/index.jsp the classification data
Evaluation of the Proposed Approach

Name of functional class # of proteins
METABOLISM 984 ENERGY 260 CELL CYCLE AND DNA PROCESSING
690
TRANSCRIPTION 842 PROTEIN SYNTHESIS 381 PROTEIN FATE (folding, modification, destination)
631
PROTEIN WITH BINDING FUNCTION OR COFACTOR REQUIREMENT (structural or catalytic)
39
PROTEIN ACTIVITY REGULATION 27 CELLULAR TRANSPORT, TRANSPORT FACILITATION AND TRANSPORT ROUTES
719
CELLULAR COMMUNICATION/SIGNAL TRANSDUCTION MECHANISM
94
CELL RESCUE, DEFENSE AND VIRULENCE
296
INTERACTION WITH THE CELLULAR ENVIRONMENT
336
TRANSPOSABLE ELEMENTS, VIRAL AND PLASMID PROTEINS
118
BIOGENESIS OF CELLULAR COMPONENTS
451
CELL TYPE DIFFERENTIATION 339
•The proposed approach is intended to predict the functions of function-unknown proteins.
•However, by predicting the functions of function-unknown proteins, it is not possible to determine the correctness of the predictions.
•We consider around 10% randomly selected proteins of each group of Table 1 as function-unknown proteins.
Evaluation of the Proposed Approach

Name of functional class # of
proteins METABOLISM 984 ENERGY 260 CELL CYCLE AND DNA PROCESSING
690
TRANSCRIPTION 842 PROTEIN SYNTHESIS 381 PROTEIN FATE (folding, modification, destination)
631
PROTEIN WITH BINDING FUNCTION OR COFACTOR REQUIREMENT (structural or catalytic)
39
PROTEIN ACTIVITY REGULATION 27 CELLULAR TRANSPORT, TRANSPORT FACILITATION AND TRANSPORT ROUTES
719
CELLULAR COMMUNICATION/SIGNAL TRANSDUCTION MECHANISM
94
CELL RESCUE, DEFENSE AND VIRULENCE
296
INTERACTION WITH THE CELLULAR ENVIRONMENT
336
TRANSPOSABLE ELEMENTS, VIRAL AND PLASMID PROTEINS
118
BIOGENESIS OF CELLULAR COMPONENTS
451
CELL TYPE DIFFERENTIATION 339
•The union of 10% of all groups consists of 604 proteins. This is the unknown group U.
•The union of the rest 90% of each of the functional groups constitutes the set of known proteins G. There are total 3783 proteins in G.
•We generate U´ U such that each protein of U´ is connected in N with at least one protein of group G by a path of length 1 or length 2. There are 470 proteins in U´ .
•We predicted functions of these 470 proteins using the proposed method.
Evaluation of the Proposed Approach
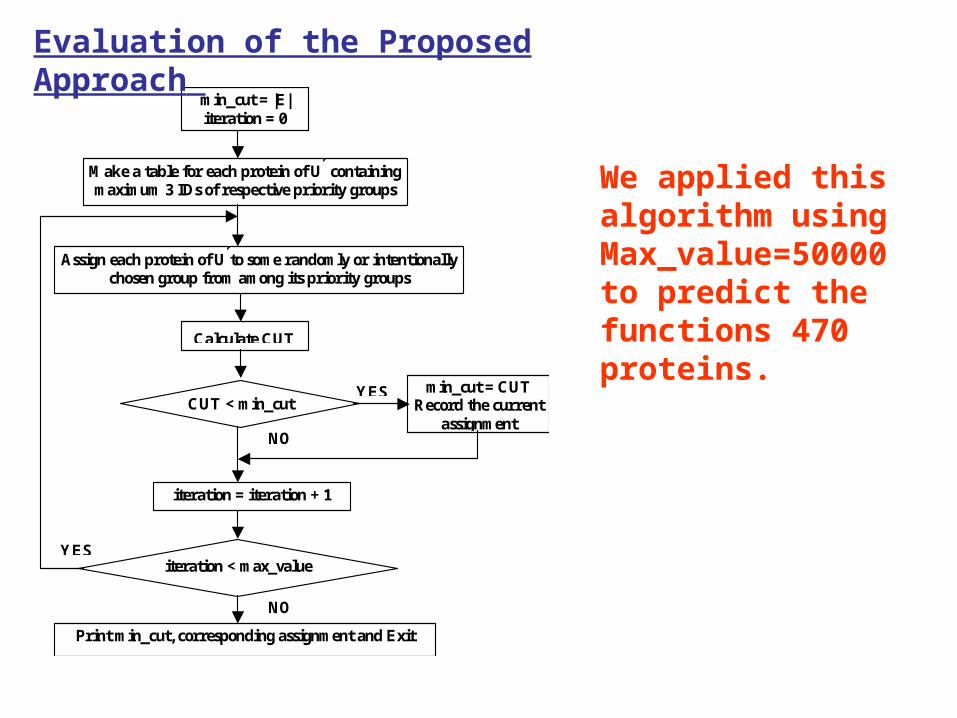
min_cut = |E| iteration = 0
Make a table for each protein of U containing maximum 3 IDs of respective priority groups
Assign each protein of Uto some randomly or intentionally chosen group from among its priority groups
Calculate CUT
CUT < min_cut
iteration = iteration + 1
iteration < max_value
min_cut = CUT Record the current
assignment
Print min_cut, corresponding assignment and Exit
YES
NO
NO
YES
We applied this algorithm using Max_value=50000 to predict the functions 470 proteins.
Evaluation of the Proposed Approach

•We cannot guarantee that minimum CUT corresponds to maximum successful prediction.
•However, the trends of the results of the Figure above shows that it is very likely that the lower is the value of CUT the greater is the number of successful predictions
Evaluation of the Proposed Approach

We then examine the relation of successful predictions with the number of degrees of the proteins in the network .
Evaluation of the Proposed Approach
U4
K2K6
K3
K4
K1K7
K5U1
U2
U3
K10
K8
K9U7
U5
U8
U6
G1
G2
G3
Degree of U4 =7
Degree of U7=3
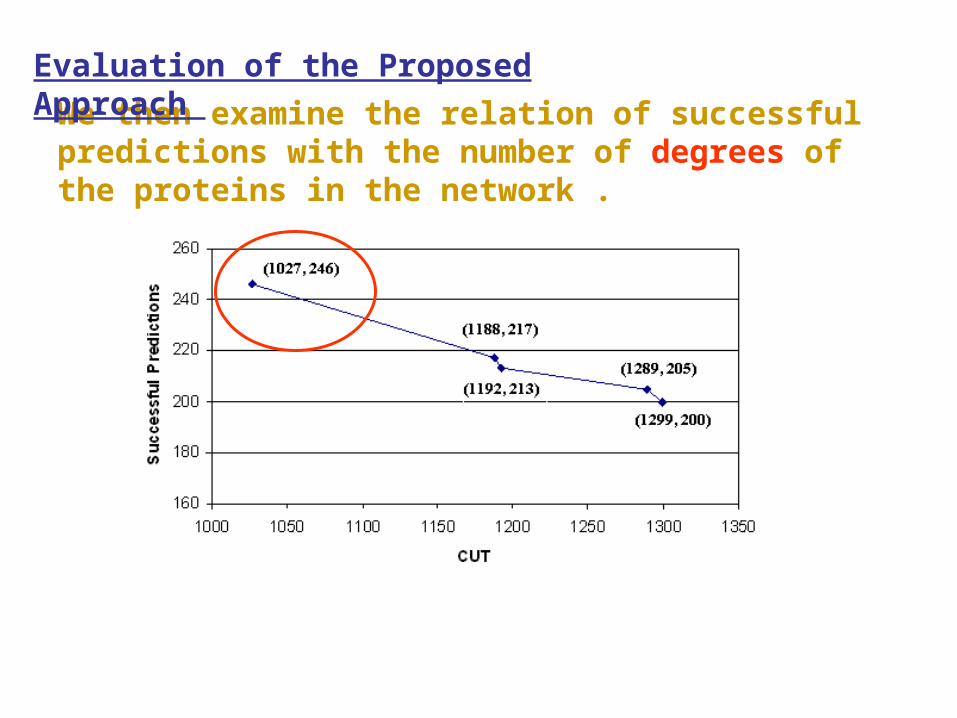
We then examine the relation of successful predictions with the number of degrees of the proteins in the network .
Evaluation of the Proposed Approach

Degree Number of proteins
Successful prediction
Percentage
1 128 39 30.46 2 80 39 48.75 3 60 32 53.33 4 33 24 72.72 5 23 15 65.21 6 24 14 58.33 7 17 12 70.58
>7 105 71 67.61 Total 470 246 52.34
0
20
40
60
80
100
0 1 2 3 4 5 6 7 8
Degree
Suc
cess
Per
cent
age
•The success rate of prediction is as low as 30.46% for proteins that have only one degree in the interaction network.
•However it is 67.61% for proteins that have degrees 8 or more.
•This implies that the reliability of the prediction can be improved by providing reasonable amount of interaction information
Evaluation of the Proposed Approach
Hierarchical clustering

Hierarchical Clustering
AtpB AtpAAtpG AtpEAtpA AtpHAtpB AtpHAtpG AtpHAtpE AtpH
Data is not always available as binary relations as in the case of protein-protein interactions where we can directly apply network clustering algorithms.
In many cases for example in case of microarray gene expression analysis the data is multivariate type.
An Introduction to Bioinformatics Algorithms by Jones & Pevzner

We can convert multivariate data into networks and can apply network clustering algorithm about which we will discuss in some later class.
If dimension of multivariate data is 3 or less we can cluster them by plotting directly.
Hierarchical Clustering
An Introduction to Bioinformatics Algorithms by Jones & Pevzner

However, when dimension is more than 3, we can apply hierarchical clustering to multivariate data.
In hierarchical clustering the data are not partitioned into a particular cluster in a single step. Instead, a series of partitions takes place.
Some data reveal good cluster structure when plotted but some data do not.
Data plotted in 2 dimensions
Hierarchical Clustering

Hierarchical clustering is a technique that organizes elements into a tree.
A tree is a graph that has no cycle.
A tree with n nodes can have maximum n-1 edges.
A Graph A tree
Hierarchical Clustering
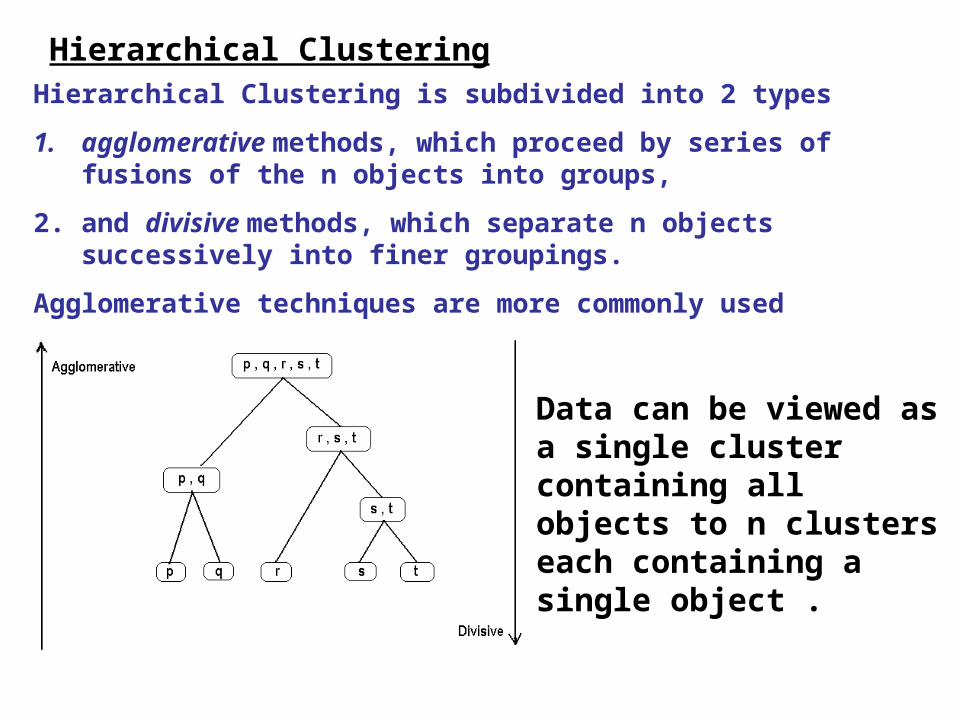
Hierarchical Clustering is subdivided into 2 types
1. agglomerative methods, which proceed by series of fusions of the n objects into groups,
2. and divisive methods, which separate n objects successively into finer groupings.
Agglomerative techniques are more commonly used
Data can be viewed as a single cluster containing all objects to n clusters each containing a single object .
Hierarchical Clustering
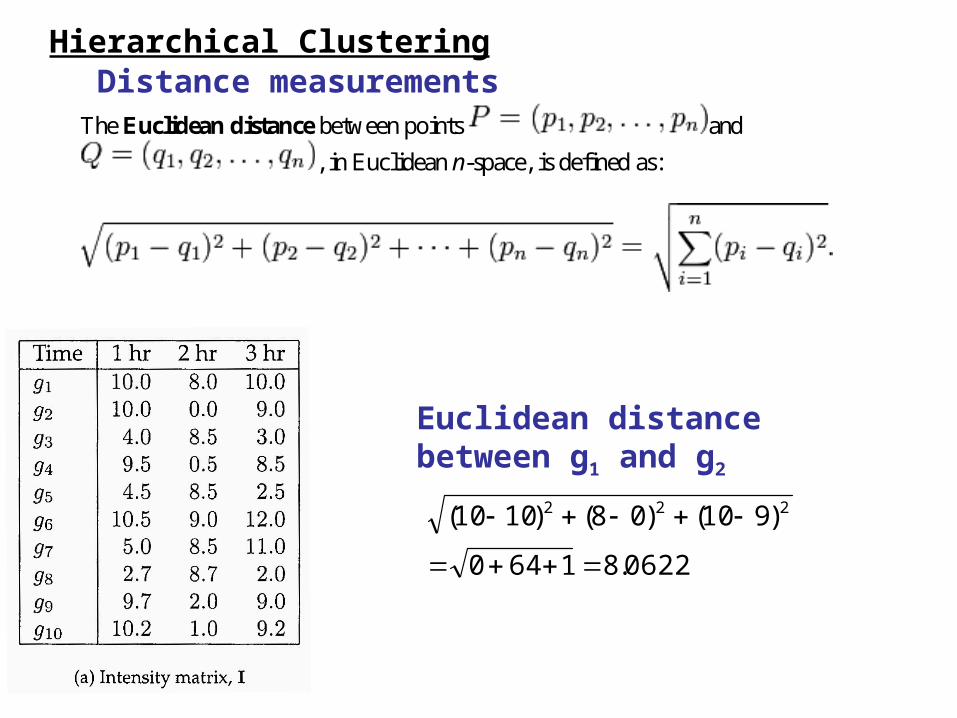
Distance measurementsThe Euclidean distance between points and
, in Euclidean n-space, is defined as:
Euclidean distance between g1 and g2
0622.81640
)910()08()1010( 222
Hierarchical Clustering

An Introduction to Bioinformatics Algorithms by Jones & Pevzner
In stead of Euclidean distance correlation can also be used as a distance measurement.
For biological analysis involving genes and proteins, nucleotide and or amino acid sequence similarity can also be used as distance between objects
Hierarchical Clustering

•An agglomerative hierarchical clustering procedure produces a series of partitions of the data, Pn, Pn-1, ....... , P1. The first Pn consists of n single object 'clusters', the last P1, consists of single group containing all n cases. •At each particular stage the method joins together the two clusters which are closest together (most similar). (At the first stage, of course, this amounts to joining together the two objects that are closest together, since at the initial stage each cluster has one object.)
Hierarchical Clustering

An Introduction to Bioinformatics Algorithms by Jones & Pevzner
Differences between methods arise because of the different ways of defining distance (or similarity) between clusters.
Hierarchical Clustering

How can we measure distances between clusters?
Single linkage clustering
Distance between two clusters A and B, D(A,B) is computed as
D(A,B) = Min { d(i,j) : Where object i is in cluster A and object j is cluster B}
Hierarchical Clustering

Complete linkage clustering
Distance between two clusters A and B, D(A,B) is computed as D(A,B) = Max { d(i,j) : Where object i is in cluster A and
object j is cluster B}
Hierarchical Clustering
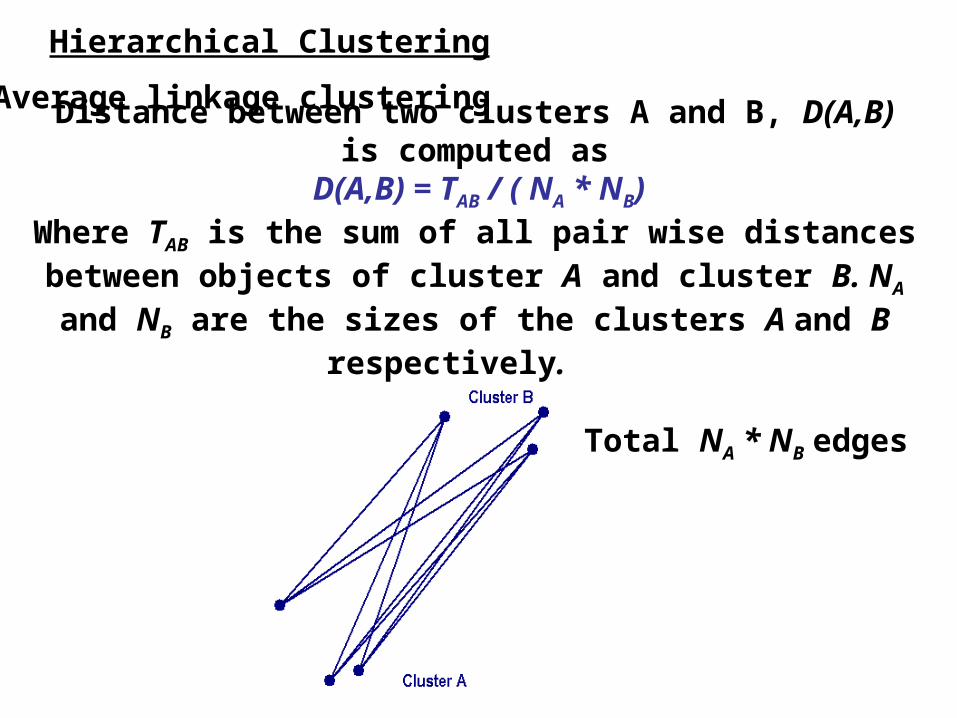
Average linkage clustering
Distance between two clusters A and B, D(A,B) is computed as D(A,B) = TAB / ( NA * NB)
Where TAB is the sum of all pair wise distances between objects of cluster A and cluster B. NA and NB are the sizes of the clusters
A and B respectively.
Total NA * NB edges
Hierarchical Clustering

Average group linkage clustering
Distance between two clusters A and B, D(A,B) is computed as D(A,B) = = Average { d(i,j) : Where observations i and j are in
cluster t, the cluster formed by merging clusters A and B }
Total n(n-1)/2 edges
Hierarchical Clustering
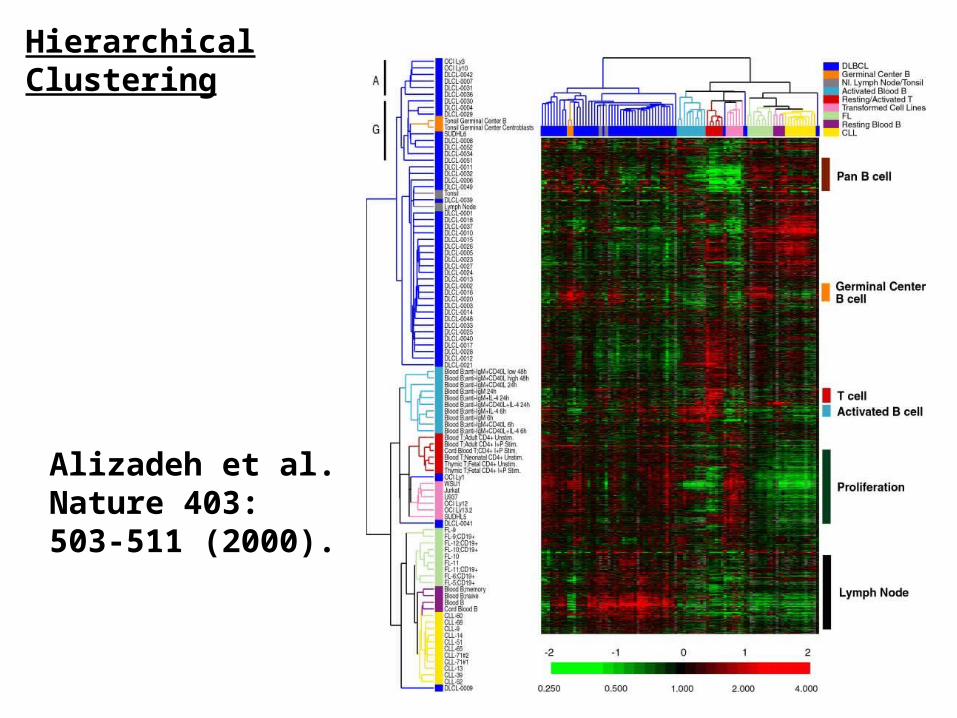
Alizadeh et al. Nature 403: 503-511 (2000).
Hierarchical Clustering

Classifying bacteria based on 16s rRNA sequences.