lecture 36 monsoon variability and agriculture:part...
TRANSCRIPT

Lecture 36
Monsoon Variability and Agriculture:part 2

Monsoon variability and Agriculture part 2 Cultivating rain-fed groundnut over
Anantapur/Pavgada region

• The traditional crops largely provided food grains for local consumption. The development programmes that the government of India undertook after freedom from colonial rule, such as road construction and electrification, led to the spread of a market economy in the region.
•
Transition from traditional to current cropping patterns

• At the same time, food grains became available at rates subsidized by the Government and hence the need for cultivation of food crops for home consumption decreased.
• With the setting up of oil mills, the price for groundnut increased and it became profitable for the farmers to change over to a groundnut based cropping system.
• Groundnut cultivation on a large scale began in the 70s with the introduction of the TMV-2 variety.

Farmer perceptions
• In order to understand the level of knowledge and approach of the farmers, it is important to note that rainfed agriculture has been practiced for a very long time in India. The strong links between climate variability and agricultural production of the Indian region are well known.

• In fact, over 2000 years ago, Kautilya (who is believed to be a contemporary of Aristotle) stated that for agriculture (over the Indo-Gangetic plains), the optimum distribution of rainfall during the summer
monsoon (June–September) is one with 1/3 of the rainfall in the first and fourth
month and 2/3 in the middle two months .

• Some of the crops grown today such as sorghum and pigeonpea have been cultivated in India for over 2000 years. Even relatively recently introduced groundnut crop has been cultivated for more than one 100 years.
• Not surprisingly, farmers have considerable knowledge of the nature of the impact of the rainfall variability in their region on traditional crops.

This knowledge is reflected in several proverbs such as the following from our study region:
Uttara chusi, yattara gampa
Wait for the Uttara rain (i.e. rainfall during 13–26 September), if it fails, leave the place.

or the following from the Indo-Gangetic plains, where Kautilya resided:
Awat adar nahi diyo, Jat no diyo hasta Bina khane dona gaye Pahuna aur
Grihasta If there is no rain in Ardra (22 June–5 July)
with the onset of the monsoon, and no rain in Hasta (27 September–9 October) during the retreat, then both the host and guest have to go without food.

• The time units used by the farmers all over India are not weeks or months, but 13–14 day periods called nakshatras (Table 1) based on the solar calendar.
• Meteorological data are available for several stations in the country for over 100 years. However, meteorologists have not derived information on variability of rainfall from these data in these time units that the farmers use.


• Although farmers have considerable knowledge of the impact of the local climate and its climate variability on traditional crops, they have not cultivated the present cropping pattern sufficiently long to provide these insights for the newer crops.
Impact of rainfall variability on present cropping system

• In fact, our collaboration on monsoon variability and agriculture began when one day in early October, Seshagiri Rao, a student in the Centre for Ecological Sciences at our Institute, who is also a farmer in the Pavgada/Anantapur region, asked me why it rains so often during the harvest season nowadays.
• Note that generally sowing is done during 22June-mid August, depending on when the soil becomes moist enough. Harvest is about 100-120 days later.

• This implies that if the sowing is done early in the sowing window (around 22 June) harvest has to be done in early October, whereas if it is done in early August then the harvest is in mid-November.
• Seshagiri Rao was surprised when I explained to him that the nature of the variability of the rainfall over the region is such that the rain is, in fact, maximum in early October and the chance of wet spells more than 50%, whereas it decreases somewhat by mid November (following slides) .

Variability of rainfall from year to year and within each year is large


Weekly rainfall
Prob. of : wet spells Rfl>1 or2cms
Dry spells Rfl<0.25cms or 0cms

• Thus the farmers were not aware of this important facet of the climatology of rainfall over the region.
• This incidence drives home the importance of deriving needed information on rainfall variability with the rich data set available with the India Meteorological department (IMD) using time-units which are commonly used by the farmers in India viz. the nakshatras
• .

RAINFO for farmers • Using daily rainfall data for hundred years at
170 stations in the state we have derived basic information on rainfall variability in the time units used by the farmers i.e. nakshatras. It is available in English as well as Kannada .
• We have also developed an interactive system by which the probability of occurrence of given quantity of rainfall or wet spells/ dry spells are given for any period chosen by the user for any station.
This is available on the website of our centre at the Institute (http://cas.iisc.ernet.in).

PAVGADA Daily Rainfall : May - November

RAINFO- FOR FARMERS
Pavgada and neighbouring stations

6-19July 13-26Sept.
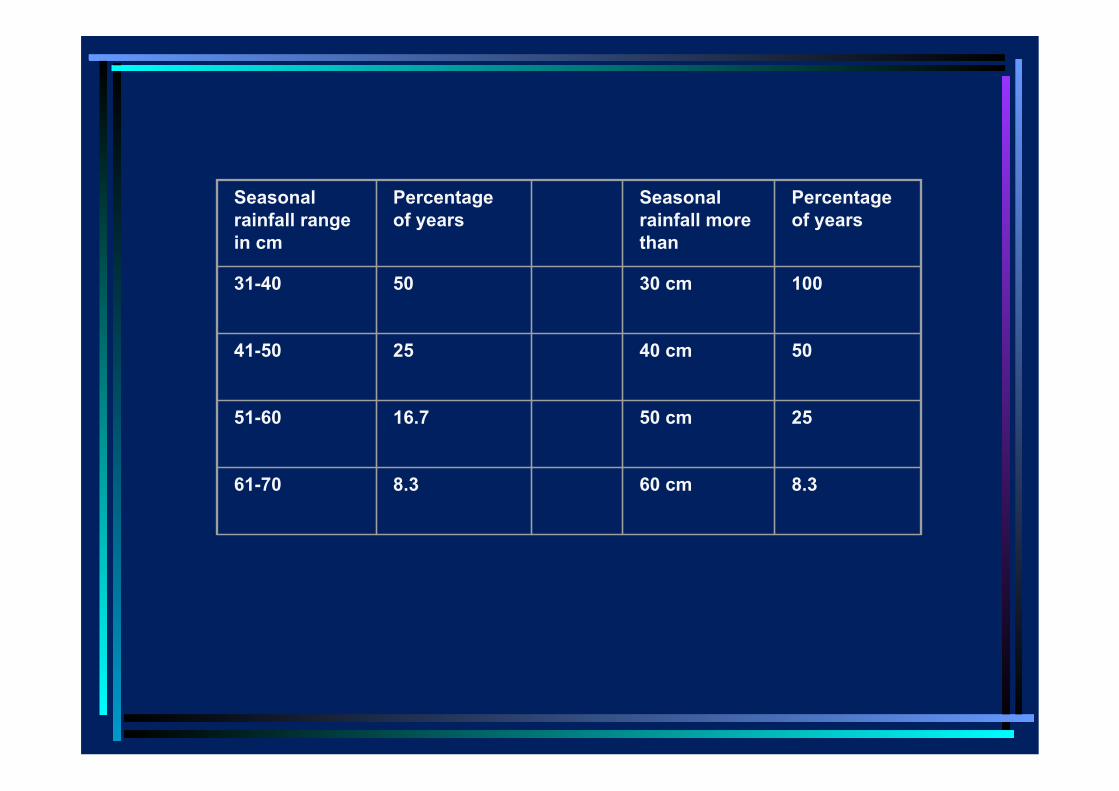
Seasonal rainfall range in cm
Percentage of years
Seasonal rainfall more than
Percentage of years
31-40 50
30 cm 100
41-50 25
40 cm 50
51-60 16.7
50 cm 25
61-70 8.3
60 cm 8.3

Nakshatra 3-4 Days wet spell 5-6 Days wet spell 7-8 Days wet spell
>9 Days wet spell Once Twice Once Twice
ASHWINI 3 0 0 0 0 0 BHARANI 6 1 0 0 0 0 KRITTIKA 9 1 0 0 0 0 ROHINI 9 1 0 0 0 0 MRIGASHIRA 3 0 1 0 0 0 ARDRA 8 1 0 0 0 0 PUNARVASU 11 0 1 0 0 0 PUSHYA 11 0 1 0 0 0 ASLESHA 8 1 2 0 1 0 MAKHA 17 2 4 0 1 0 PUBBA 15 0 1 0 2 0 UTTARA 19 2 5 0 2 2 HASTA 24 0 1 0 0 0 CHITTA 20 2 4 0 0 0 SWATHI 10 2 6 1 1 0 VISHAKHA 16 2 2 0 1 0 ANURADHA 4 0 0 0 0 0 JYESHTHA 3 0 1 0 0 0 MOOLA 2 0 0 0 0 0 POORVASHADHA 1 0 0 0 0 0 UTTARASHADHA 0 0 0 0 0 0 SARVANA 0 0 0 0 0 0 DHANISHTHA 0 0 0 0 0 0 SATHABHISHA 1 0 0 0 0 0

Nakshatra 3-4 Days wet spell 5-6 Days wet spell 7-8 Days wet spell
>9 Days wet spell Once Twice Once Twice
ASHWINI 3 0 0 0 0 0 BHARANI 6 1 0 0 0 0 KRITTIKA 9 1 0 0 0 0 ROHINI 9 1 0 0 0 0 MRIGASHIRA 3 0 1 0 0 0 ARDRA 8 1 0 0 0 0 PUNARVASU 11 0 1 0 0 0 PUSHYA 11 0 1 0 0 0 ASLESHA 8 1 2 0 1 0 MAKHA 17 2 4 0 1 0 PUBBA 15 0 1 0 2 0 UTTARA 19 2 5 0 2 2 HASTA 24 0 1 0 0 0 CHITTA 20 2 4 0 0 0 SWATHI 10 2 6 1 1 0 VISHAKHA 16 2 2 0 1 0 ANURADHA 4 0 0 0 0 0 JYESHTHA 3 0 1 0 0 0 MOOLA 2 0 0 0 0 0 POORVASHADHA 1 0 0 0 0 0 UTTARASHADHA 0 0 0 0 0 0 SARVANA 0 0 0 0 0 0 DHANISHTHA 0 0 0 0 0 0 SATHABHISHA 1 0 0 0 0 0 POORVABHADRA 1 0 0 0 0 0 UTTARABHADRA 0 0 0 0 0 0 REVATHI 0 0 0 0 0 0

Table 6: Pavgada: Dry Spells
Percentage of years with dry spells of different duration in different Nakshatras Nakshatra 3-4 Days Dry Spell 5-6 Days Dry Spell 7-8 Days
Dry Spell >9 Days Dry Spell 0nce Twice Thrice Once Twice
ASHWINI 17 0 0 7 5 14 81 BHARANI 25 0 0 23 3 18 67 KRITTIKA 27 5 1 29 3 27 48 ROHINI 28 4 3 28 3 22 49 MRIGASHIRA 30 2 2 22 5 25 55 ARDRA 29 4 1 20 3 26 57 PUNARVASU 27 6 1 22 4 21 56 PUSHYA 27 12 0 31 2 23 41 ASLESHA 22 3 2 19 3 19 56 MAKHA 27 6 1 24 2 16 46 PUBBA 28 5 1 14 2 19 52 UTTARA 32 6 3 30 2 18 30 HASTA 27 8 1 28 2 14 39 CHITTA 32 4 1 17 0 19 52 SWATHI 18 3 1 9 3 12 59 VISHAKHA 17 2 0 21 3 7 65 ANURADHA 11 1 0 15 2 18 77 JYESHTHA 6 1 0 5 2 10 85 MOOLA 2 0 0 1 0 1 98 POORVASHADHA 4 0 0 2 1 3 95 UTTARASHADHA 2 0 0 2 1 2 96 SRAVANA 3 0 0 1 2 4 94 DHANISHTHA 2 0 0 0 0 0 100 SATHABHISHA 2 0 0 1 0 2 98 POORVABHADRA 3 0 0 3 0 3 97 UTTARABHADRA 7 1 0 2 1 6 92 REVATHI 10 1 0 3 3 7 86

• This kind of information can be used by intelligent farmers in different types of decision making, even on the basis of the experience of 2-3 decades in cultivation.
• I consider next how the optimum strategies can be identified by combining the information on rainfall variability with use of crop models.

Strategies for enhancement of the yields in the face of variable climate
• Most of the farm level decisions such as enhancement of the seed rate (# of seeds per unit area) or application of fertilizers or pesticides involve additional costs.
• In rainfed regions such as this, there are high levels of risk and low levels of production and the resources available for such inputs are meagre.

• Furthermore the benefit of such investments itself depends on the rainfall , being very small for poor rainfall seasons with low yields. Hence the farmers tend to avoid such additional expenditure.
• Some of the farm-level decisions such as choice of the sowing window, involve no additional expenditure but can have a large impact on the yield.
• A sowing window, is a specific period in which farmers sow groundnut seeds when there is adequate moisture in the soil. Generally in a season, there are several sowing opportunities.

• In the package of recommendations developed by agricultural scientists sowing in May-June is recommended. It is suggested that in the absence of sowing opportunities in May-June, sowing can be done in July. However, if no opportunity occurs till the end of July, the farmers are advised not to sow groundnut at all in August.

• However, on the basis of experience of about two decades, farmers, do not sow until late June and do sow in August (if no opportunity occurred earlier), despite the recommendation to the contrary. This is based on the experience that when the sowing was delayed to August, in some of the years high yields were obtained.
• In the window 22-June-mid August farmers generally sow at the first opportunity.

Problem posed by the farmers
• Hence, the farmers of the region suggested to us that one of the most important problems is the identification of the optimum sowing window associated with maximum production in the face of the rainfall variability of the region.

Crop model used • We addressed this problem by using the
PNUTGRO model for rainfed groundnut over this region.
• Work done by Singh et. al (1994) at ICRISAT showed that this model is able to simulate the year-to year variation in the yield of the variety TMV-2 of groundnut cultivated in rainfed conditions at the Anantapur agricultural station rather well (next slide).

PEANUT-GRO
MODEL VALIDA-TION FOR ANATAPUR
Singh et al 1994

• Generally the average yield at the district level is less than the model simulated yield, primarily because of the incidence of pests and diseases. Thus the model yield can be considered as a potential/maximum yield under rainfed conditions.
• The average yield of the region is about 750kg/ha. Crop failure is said to occur when the yield is less than 500kg/ha since it is not adequate to meet the cost of cultivation.

• Hence we consider a model yield of • <500kg/ha => crop failure • between 1000-1500 kg/ha: above average • >1500kg/ha very good yield • The optimum sowing date for minimizing
risk of crop failure is thus one which corresponds to minimizing the probability of model yield of 500kg/ha and maximizing the production is one which maximizes the probability of yield above 1500 kg/ha.

Sensitivity to different meteorological inputs
• The meteorological data input required for the PNUTGRO model are the daily values of maximum and minimum temperature, radiation and rainfall. All these data were available at the Anantapur agricultural station for 1979-98 and rainfall data from 1962-79.Rainfall data at the Anantapur meteorological observatory was available for 1911-1990.

• We first studied the sensitivity of the model results for variation of the yield with sowing date to the input of rainfall vis a vis other meteorological variables.
• The variation of the model yield with sowing date based on all the meteorological data is found to be very close to that obtained by replacing the daily temperature and radiation data by the daily averages for 1979-1988 (next slide).

Rainfall is the only imp met parameter. For radiation,temp etc climat.averages can be used

• Hence the daily rainfall data for 1911-90 can be used along with the climatological averages of the daily maximum and minimum temperature and radiation for deriving the variation of the yield with sowing date.
• The different patterns of the variation of the yield with sowing dates are shown in the next slides.

Optimum sowing date is early July or even earlier
Optimum sowing date is
20-31 July

Optimum sowing date is early August
Optimum sowing date is 1-15August

Optimum sowing date is early June or late August
Yield insensitive to sowing date

• Note that in almost all the years the yield increases as the sowing date is postponed from May to late June.
• This is consistent with the experience of the farmers which led to the present sowing window of 22 June-mid-August.
• The surprising result from these figures is that the yield increases with later sowing even beyond July for many years. This is also consistent with the experience of the farmers in the region!

• Yield is greater for sowing in late June-early July only in 19 out of 87 years. Later sowing is associated with larger or at least a much yield in 80% of the years.
• Thus, as the farmers suggested to us, the recommendations about the sowing window, in the official package of recommendations for groundnut in this rainfed region are clearly wrong.

• The variation of the probability of crop failure, of above average yield and very good yield with sowing date is shown in the next slide.
• It is seen that the probability of failure is high (about 40%) for sowing in May or early June and decreases rapidly to less than 5% by early July. Also for sowing in May or early June, the probability of good yields is less than 20%. It increases rapidly with sowing date up to 6 August and then decreases slowly.
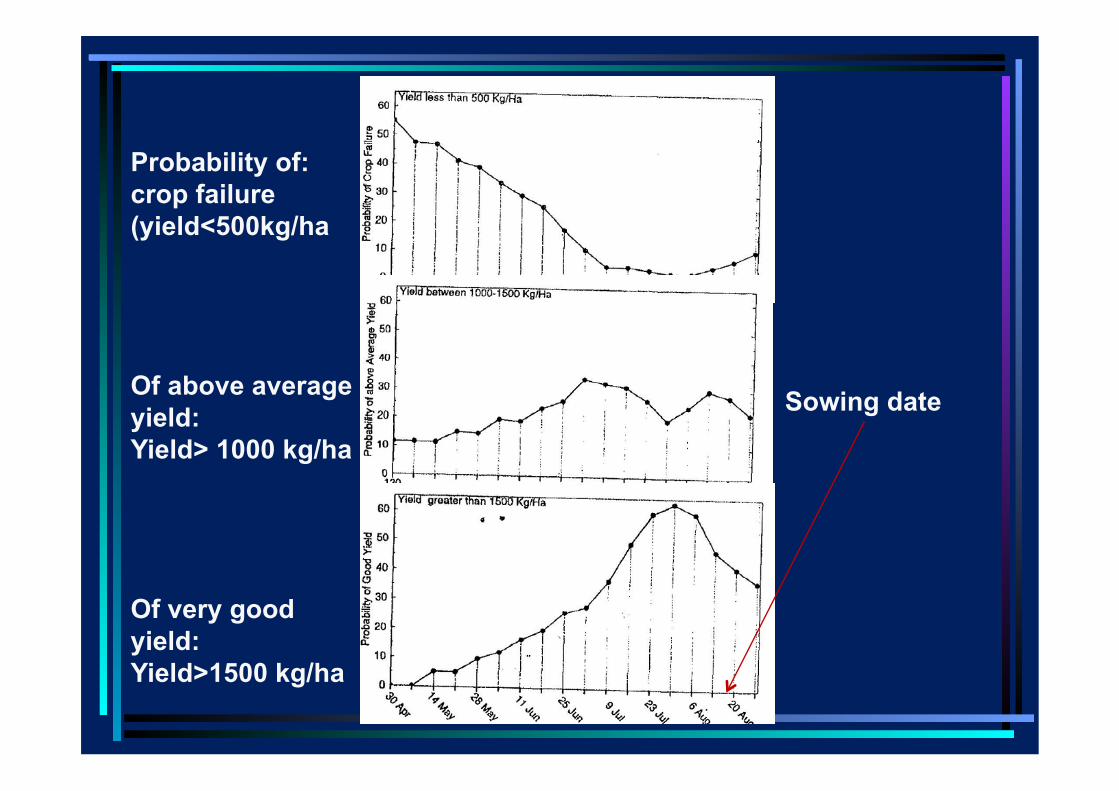
Probability of: crop failure (yield<500kg/ha
Of above average yield: Yield> 1000 kg/ha
Of very good yield: Yield>1500 kg/ha
Sowing date

• Thus the choice of the prevalent broad sowing window 22June-16 August is the appropriate one for minimizing the risk of crop failure. It also implies a 50% or higher chance of above average or good yields.

• Note that for sowing after mid-July, the probability of above average and very good yields is even higher and the chance of crop failure still very small.
• We can try and understand the reasons for this by considering the variation of moisture stress experienced by the plant during different life history stages (as data on the moisture stress experienced is available from the PNUTGRO model) for optimal as well as suboptimal sowing dates.

• Generally the need for water increases as the plant grows until the leaf development is complete at the end of about 60-65 days, and remains high thereafter.
• Hence in a region with scanty rainfall such as Anantapur, the moisture stress also generally increases to a maximum by 65 days


• However, plants for which the sowing date is optimum, do not experience moisture stress at all during 65-85 days (last slide).
• This suggests that out of the different critical stages suggested in literature, the most critical is the pod-filling stage which occurs 65-85 days after sowing.
• This is tested by experiments with the model.