lecture 22 chernobyl and fukushima -...
TRANSCRIPT

Radioactivity
Lecture 22 Chernobyl and Fukushima

Average Human Exposure to Radiation Average annual human exposure to ionizing radiation in millisieverts (mSv) per year Radiation source World US Japan Remark Inhalation of air 1.26 2.28 0.40 mainly from radon, depends on indoor accumulation Ingestion of food & water 0.29 0.28 0.40 (K-40, C-14, etc.)
Terrestrial radiation 0.48 0.21 0.40 depends on soil and building material Cosmic radiation 0.39 0.33 0.30 depends on altitude sub total (natural) 2.40 3.10 1.50 sizeable population groups receive 10–20 mSv
Medical 0.60 3.00 2.30 worldwide figure excludes radiotherapy; US figure is mostly CT scans and nuclear medicine.
Consumer items – 0.13 cigarettes, air travel, building materials, etc.
Nuclear testing 0.005 – 0.01 peak of 0.11 mSv in 1963 and declining since; higher near sites
Occupational exposure 0.005 0.005 0.01 worldwide average to workers only is 0.7 mSv, mostly due to radon in mines; US is mostly due to medical and aviation workers.
Chernobyl accident 0.002 – 0.01 peak of 0.04 mSv in 1986 and declining since; higher near site
Nuclear fuel cycle 0.0002 0.001 up to 0.02 mSv near sites; excludes occupational exposure
Other – 0.003 Industrial, security, medical, educational, and research sub total (artificial) 0.61 3.14 2.33 Total 3.01 6.24 3.83 millisieverts per year I adopted 3.5 mSv/a

Nuclear accidents There is no fool-prove technical system, or in short “Shit happens”! Accidents are not avoidable but the likely-hood or the risk should be minimized by appropriate safety features.
Fukushima Daiichi 2011 earthquake Chernobyl 1986 operator error Three Mile Island 1979 operator error Enrico Fermi Unit 1 1966 malfunction of cooling cycle SL-1 1961 operator error Sodium Reactor Experiment 1959 malfunction of cooling cycle Windscale 1957 operator error
Risk assessment
Health Risk Est. life expectancy lost
Smoking 20 cigs a day 6 years
Overweight (15%) 2 years
Alcohol (US Ave) 1 year
All Accidents 207 days
All Natural Hazards 7 days
Occupational dose (300 mrem/yr) 15 days
Occupational dose (1 rem/yr) 51 days

Possible Emission in Case of Accidents
Fission fuel elements and associated reaction products, U, Pu, Np, Ac isotopes with long half-lives:
Fission products and fission fuel can be emitted depending on the nature of reactor accident.
Emitted material will be deposited in the ‘local’ environment, depending on emission altitude and local climatic conditions, such as wind and rain.

Forms of accidental release of radioactivity
There are three possible forms of release:
1. A fireball from a nuclear explosion when the reactor becomes critical, emitting fission material, fission products and activated debris (nuclear bomb scenario)
2. Chemical explosion in a container of long-lived radioactive waste (WIPP?) causing a local distribution of lower level radioactivity (dirty bomb scenario)
3. Non-nuclear explosion in reactor environment (H gas release), burning of graphite (Chernobyl), burning of fuel elements (Windscale), collapse of cooling, melting of fuel elements by release of decay heat (Fukushima) emission of radioactive material through ground water and fumes.

Comparison of radiation release The three largest incidents prior to Fukushima in 2011 have been the Windscale accident in 1957 in the UK, the three-Mile-Island accident in the US in 1983, and the Chernobyl accident in the USSR in 1986. Comparison in the release of radioactive material in each of those incidents compared with the release of radioactivity in the nuclear test program.
in units pBq (1015 Bq)
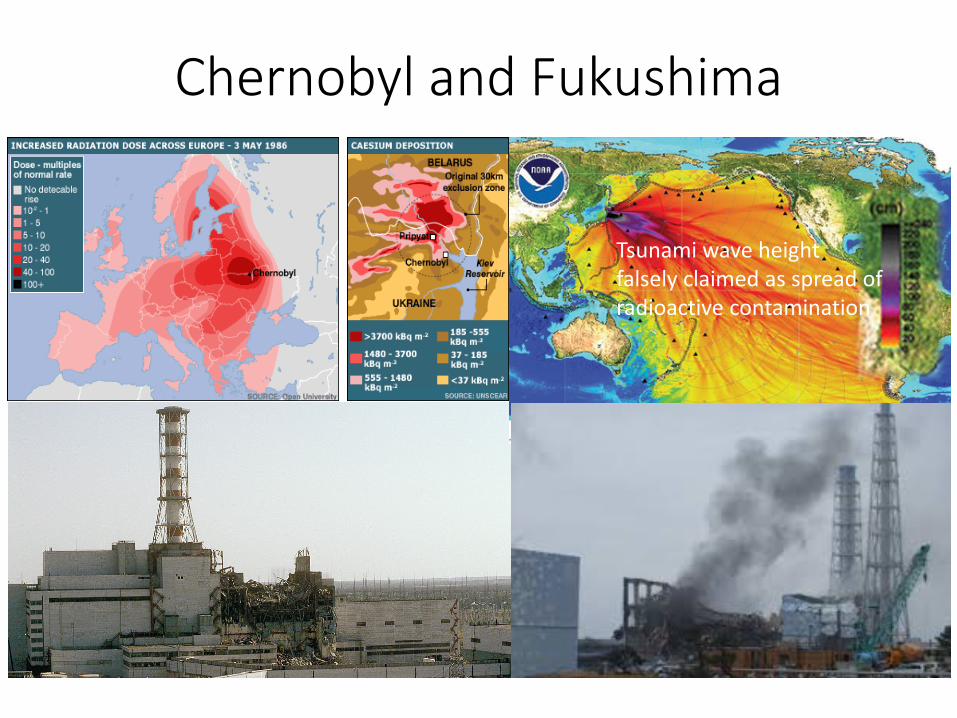
Chernobyl and Fukushima
Tsunami wave height falsely claimed as spread of radioactive contamination

Reactor Accidents strengthened the anti-nuke arguments; Windscale 1956, Three-Mile-Island 1983, Chernobyl 1986, Fukushima 2011

Internet Displays
Horrific pictures increase fear, the pictures are mostly shown on internet sites without any direct source information, while the observed deformations are well known, there is no epidemological evidence that they are correlated to Chernobyl.

Misleading Reports
For the past 25 years, anti-nuclear campaigners have been racking up the figures for deaths and diseases caused by the Chernobyl disaster, and parading deformed babies like a mediaeval circus. They now claim that 985,000 people have been killed by Chernobyl, and that it will continue to slaughter people for generations to come. These claims are false.
The journal Radiation Protection Dosimetry points out that the book achieves its figure by assuming that all increased deaths from a wide range of diseases – including many which have no known association with radiation – were caused by the accident. There is no basis for this assumption, the study makes no attempt to correlate exposure to radiation with the incidence of disease. The study also makes no effort to include official government and UN studies with the argument that these studies are false, hiding the truth from the people.
985,000 people have died as a result of the Chernobyl disaster!
This report as well as a Greenpeace report covers many non-cancer illnesses that have not been observed as radiation-induced diseases even in studies of highly exposed radiation populations but they claim that the Chernobyl accident is ‘unique’ and, therefore, illnesses for which there is no known association with radiation may be the result of the radiation exposure from Chernobyl.

Radioactive Inventory of Chernobyl Reactors at time of accident and the
fraction of released radioactive species Often subject to emotional and political debate
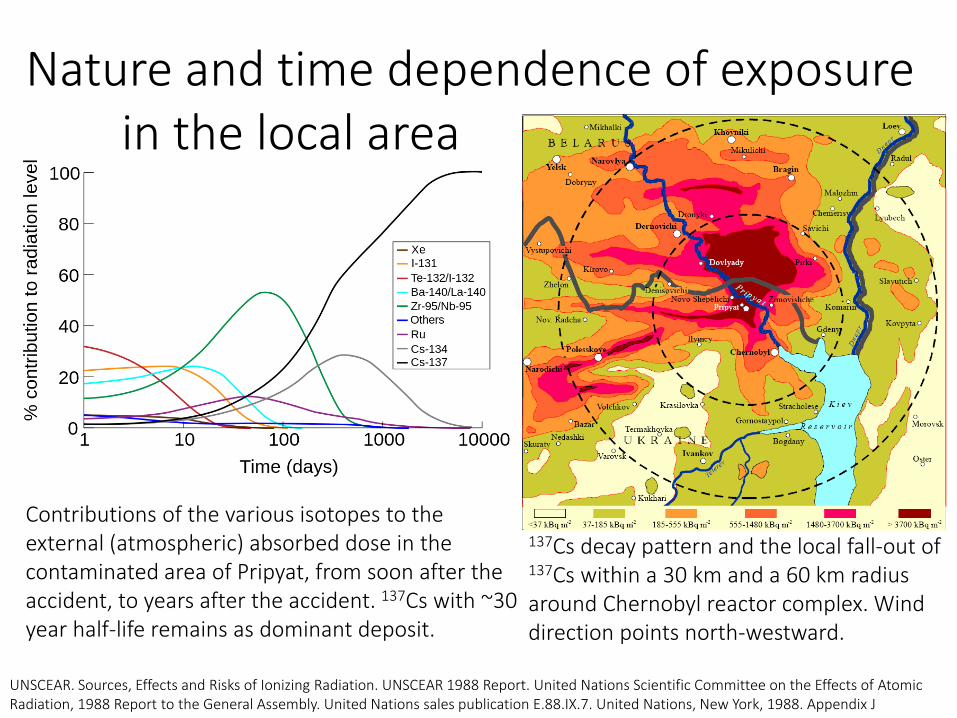
Nature and time dependence of exposure in the local area
Contributions of the various isotopes to the external (atmospheric) absorbed dose in the contaminated area of Pripyat, from soon after the accident, to years after the accident. 137Cs with ~30 year half-life remains as dominant deposit.
137Cs decay pattern and the local fall-out of 137Cs within a 30 km and a 60 km radius around Chernobyl reactor complex. Wind direction points north-westward.
UNSCEAR. Sources, Effects and Risks of Ionizing Radiation. UNSCEAR 1988 Report. United Nations Scientific Committee on the Effects of Atomic Radiation, 1988 Report to the General Assembly. United Nations sales publication E.88.IX.7. United Nations, New York, 1988. Appendix J

Closed Area and Red Forest

Recovery After initial decline of wildlife and plant population (red forest), nature has fully recovered in the forbidden zones due to lack of human interference.
“Chernobyl’s abundant and surprisingly normal-looking wildlife has shaken up how biologists think about the environmental effects of radioactivity. The idea that the world’s biggest radioactive wasteland could become Europe’s largest wildlife sanctuary is completely counterintuitive for anyone raised on nuclear dystopias.”
http://www.slate.com/articles/health_and_science/nuclear_power/2013/01/wildlife_in_chernobyl_debate_over_mutations_and_populations_of_plants_and.html
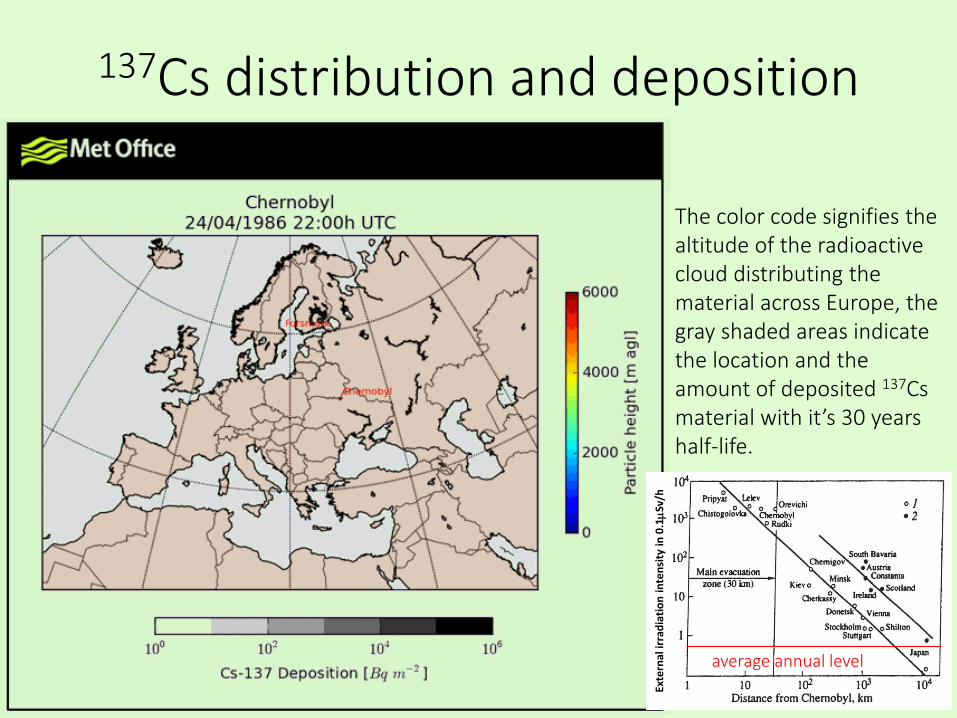
137Cs distribution and deposition
The color code signifies the altitude of the radioactive cloud distributing the material across Europe, the gray shaded areas indicate the location and the amount of deposited 137Cs material with it’s 30 years half-life.
Exte
rnal
irra
diat
ion
inte
nsity
in 0
.1µS
v/h
average annual level

kBq/m2
Ci/km2
Chernobyl
Average value: 1-100 kBq/m2
Mostly 137Cs, T1/2=30y 50% down
Ramsar water: 146 kBq/m3

Deposition in Russia, Belarus, and Ukraine
The collective dose (sum of the single doses) exposure of the population in Belarus, Russia, and Ukraine in units Sievert. 1 man Sv gives the collective dose of 1000 Persons, that were exposed to a dose of 1 mSv each, or 10 persons exposed to 100 mSv. The average single person dose is achieved by dividing the collective dose by the population, ~ 0.05-0.01 Sv. Compared to average natural annual dose of 0.0035 Sv.
0.0081 Sv
0.0068 Sv
0.0097 Sv

Estimate of average individual dose levels for world population
1 mSv/a (0.1 μSv/h avg) ICRP recommended maximum for external irradiation of the human body, excluding medical and occupational exposures.
3.5 mSv/a (0.4 μSv/h avg) Human exposure to natural background radiation, global average
24 mSv/a (2.7 μSv/h avg) Natural background radiation at airline cruise altitude
130 mSv/a (15 μSv/h avg) Ambient field inside most radioactive house in Ramsar, Iran
(800 mSv/a) 90 μSv/h Natural radiation on a monazite beach near Guarapari, Brazil.
(9 Sv/a) 1 mSv/h NRC definition of a high radiation area in a nuclear power plant, warranting a chain-link fence
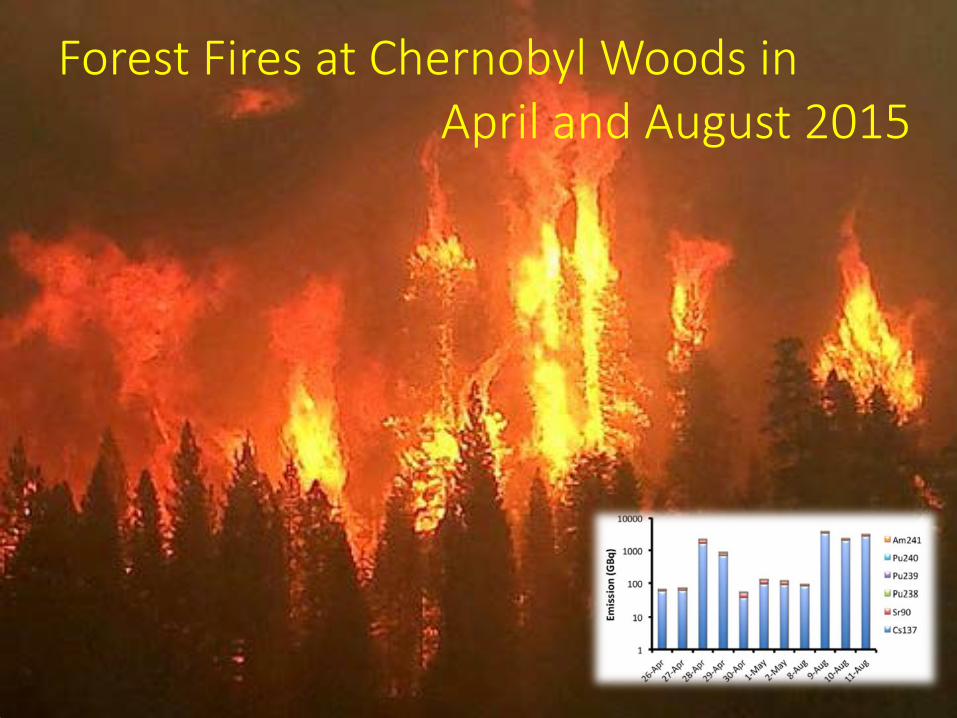
Forest Fires at Chernobyl Woods in April and August 2015
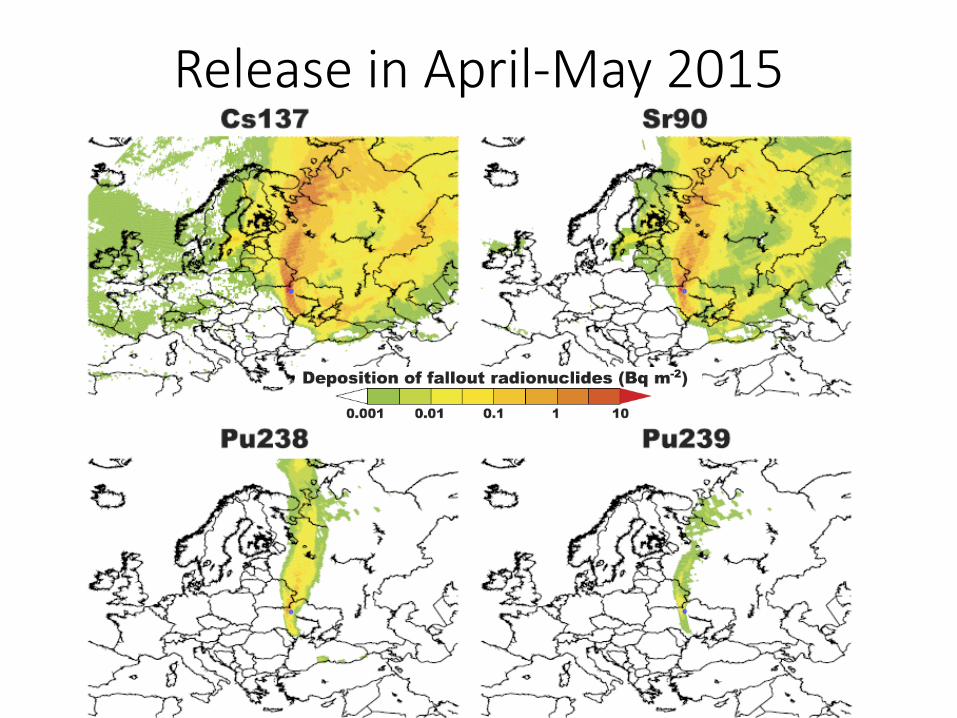
Release in April-May 2015
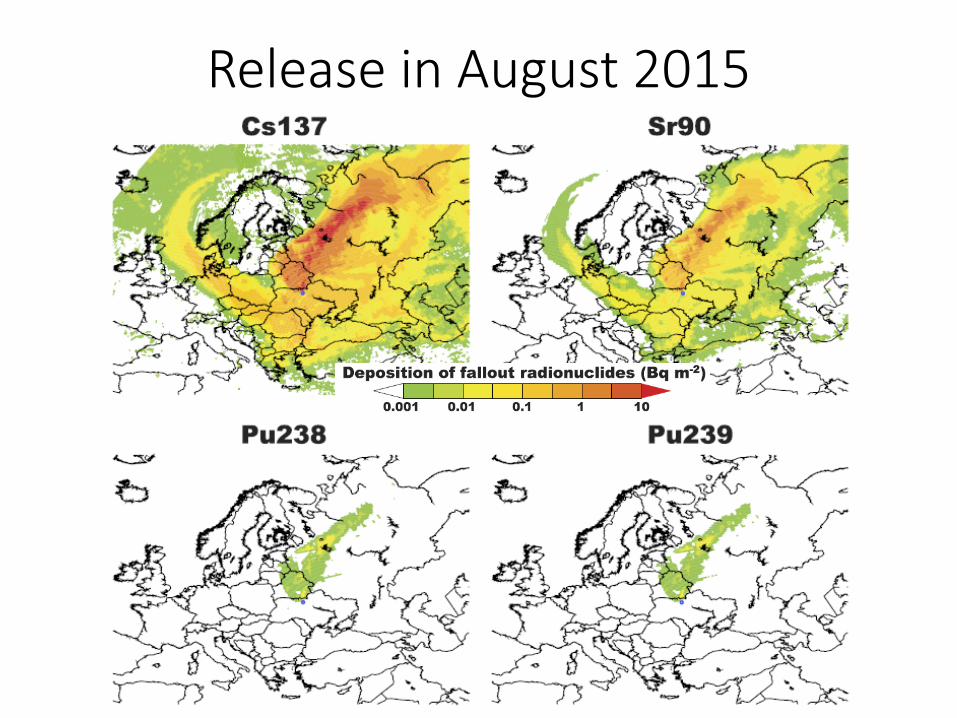
Release in August 2015
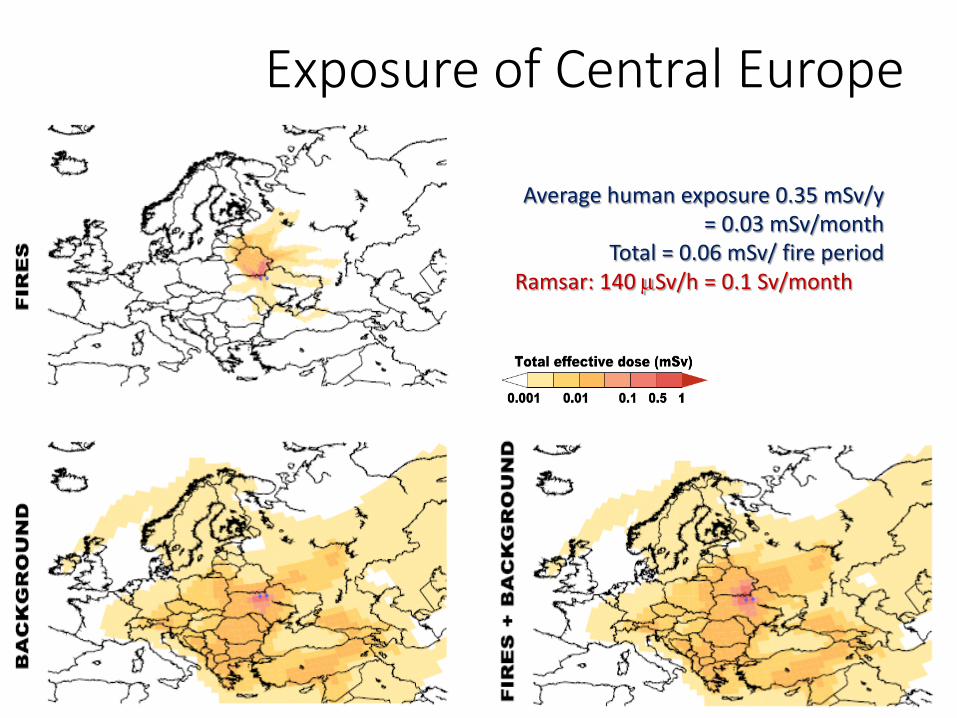
Exposure of Central Europe
Average human exposure 0.35 mSv/y = 0.03 mSv/month
Total = 0.06 mSv/ fire period Ramsar: 140 µSv/h = 0.1 Sv/month
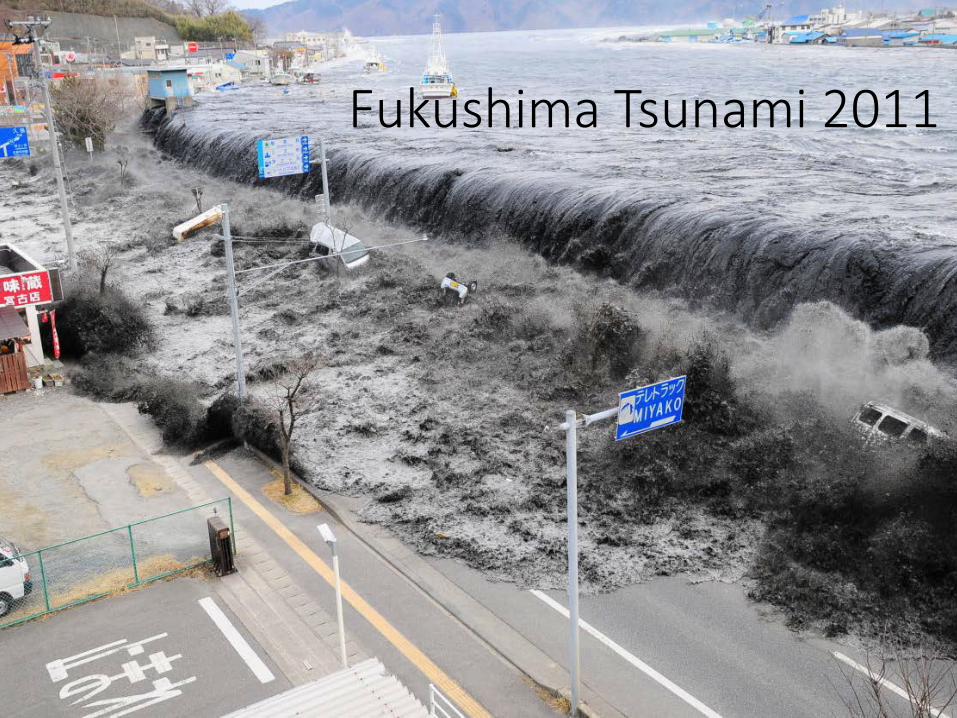
Fukushima Tsunami 2011
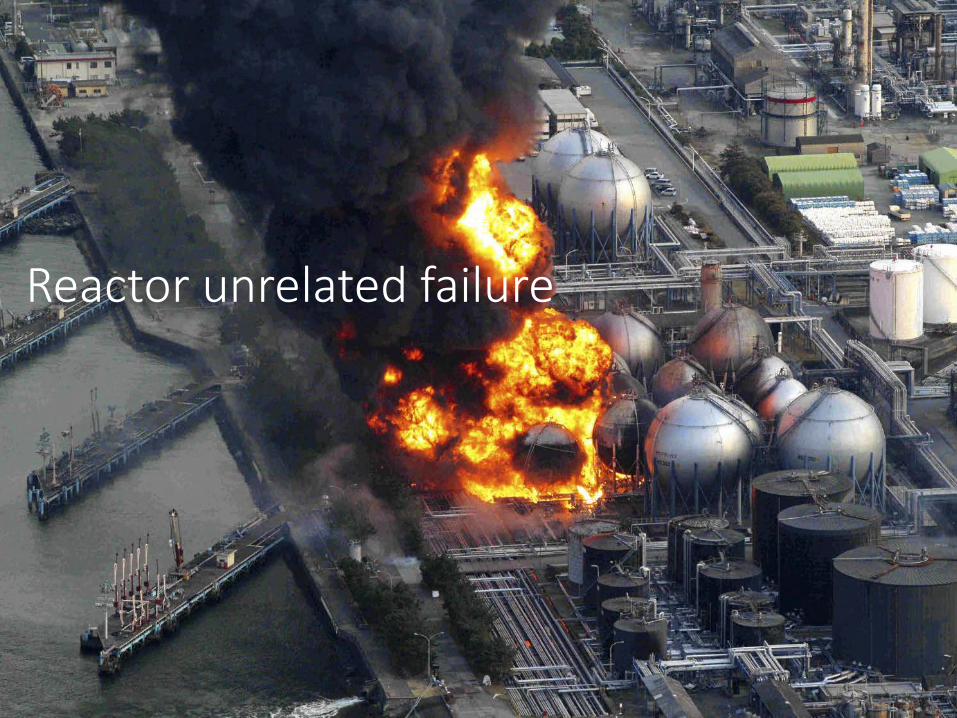
Reactor unrelated failure

Fukushima Daiichi 2011

Emitted fission products from Fukushima
Release to the Environment
Release to the Atmosphere T1/2
76h
8d
2.3h
21h
T1/2
5.3d
2y
13d
30y
134Cs down to 18%, the rest gone except 137C, down to 89%
according to the decay law: ( )y
TeNyN52ln
02/15⋅−
⋅=
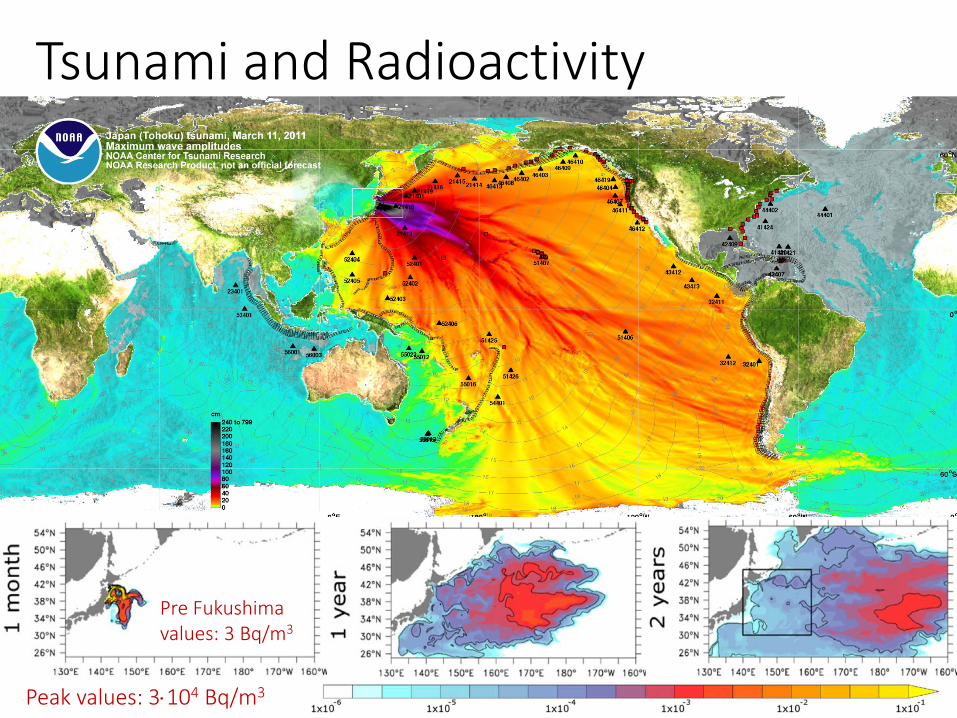
Tsunami and Radioactivity
Peak values: 3⋅104 Bq/m3
Pre Fukushima values: 3 Bq/m3
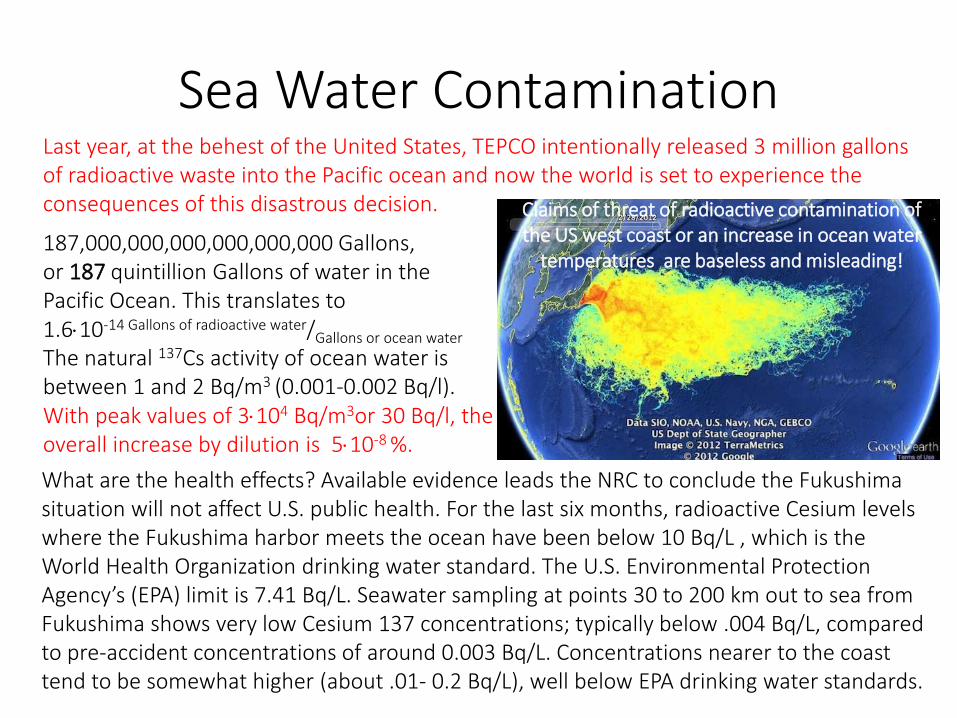
Sea Water Contamination
What are the health effects? Available evidence leads the NRC to conclude the Fukushima situation will not affect U.S. public health. For the last six months, radioactive Cesium levels where the Fukushima harbor meets the ocean have been below 10 Bq/L , which is the World Health Organization drinking water standard. The U.S. Environmental Protection Agency’s (EPA) limit is 7.41 Bq/L. Seawater sampling at points 30 to 200 km out to sea from Fukushima shows very low Cesium 137 concentrations; typically below .004 Bq/L, compared to pre-accident concentrations of around 0.003 Bq/L. Concentrations nearer to the coast tend to be somewhat higher (about .01- 0.2 Bq/L), well below EPA drinking water standards.
Last year, at the behest of the United States, TEPCO intentionally released 3 million gallons of radioactive waste into the Pacific ocean and now the world is set to experience the consequences of this disastrous decision.
187,000,000,000,000,000,000 Gallons, or 187 quintillion Gallons of water in the Pacific Ocean. This translates to 1.6⋅10-14 Gallons of radioactive water/Gallons or ocean water The natural 137Cs activity of ocean water is between 1 and 2 Bq/m3 (0.001-0.002 Bq/l). With peak values of 3⋅104 Bq/m3or 30 Bq/l, the overall increase by dilution is 5⋅10-8 %.
Claims of threat of radioactive contamination of the US west coast or an increase in ocean water
temperatures are baseless and misleading!

Average human dose: 3.5 mSv/y
=0.4 µSv/h
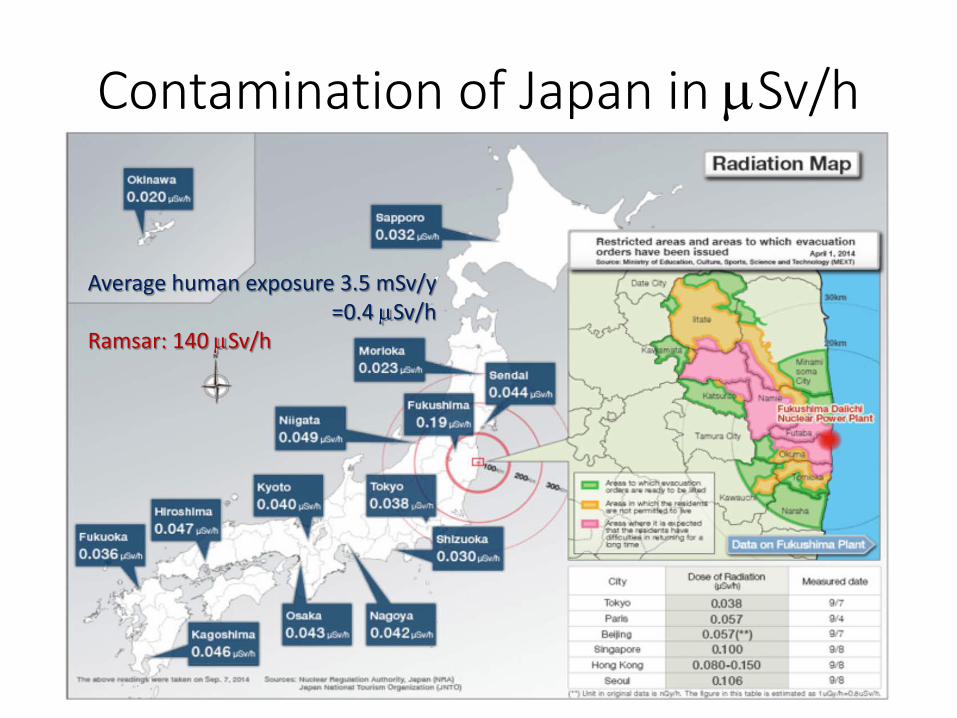
Contamination of Japan in µSv/h
Average human exposure 3.5 mSv/y =0.4 µSv/h
Ramsar: 140 µSv/h

Time evolution of 137Cs T1/2=30y
Black: western pacific Green: North America
Light blue: Hawaii Dark blue: Baja California
Red: Aleutian Islands 10 PBq peak value
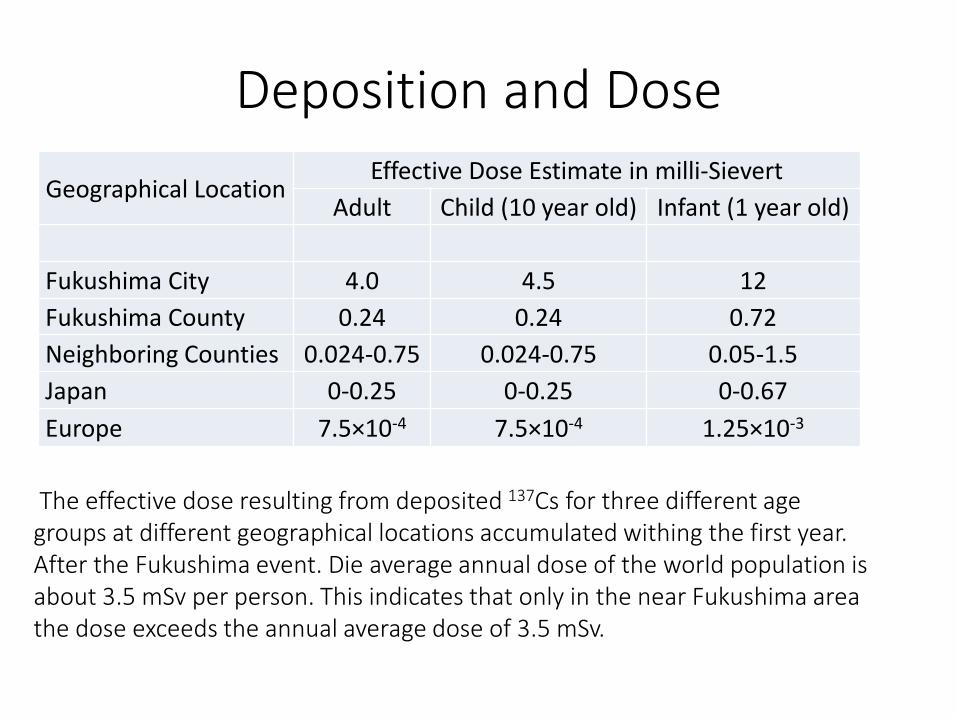
Deposition and Dose Geographical Location
Effective Dose Estimate in milli-Sievert Adult Child (10 year old) Infant (1 year old)
Fukushima City 4.0 4.5 12 Fukushima County 0.24 0.24 0.72 Neighboring Counties 0.024-0.75 0.024-0.75 0.05-1.5 Japan 0-0.25 0-0.25 0-0.67 Europe 7.5×10⁻⁴ 7.5×10⁻⁴ 1.25×10⁻³
The effective dose resulting from deposited 137Cs for three different age groups at different geographical locations accumulated withing the first year. After the Fukushima event. Die average annual dose of the world population is about 3.5 mSv per person. This indicates that only in the near Fukushima area the dose exceeds the annual average dose of 3.5 mSv.
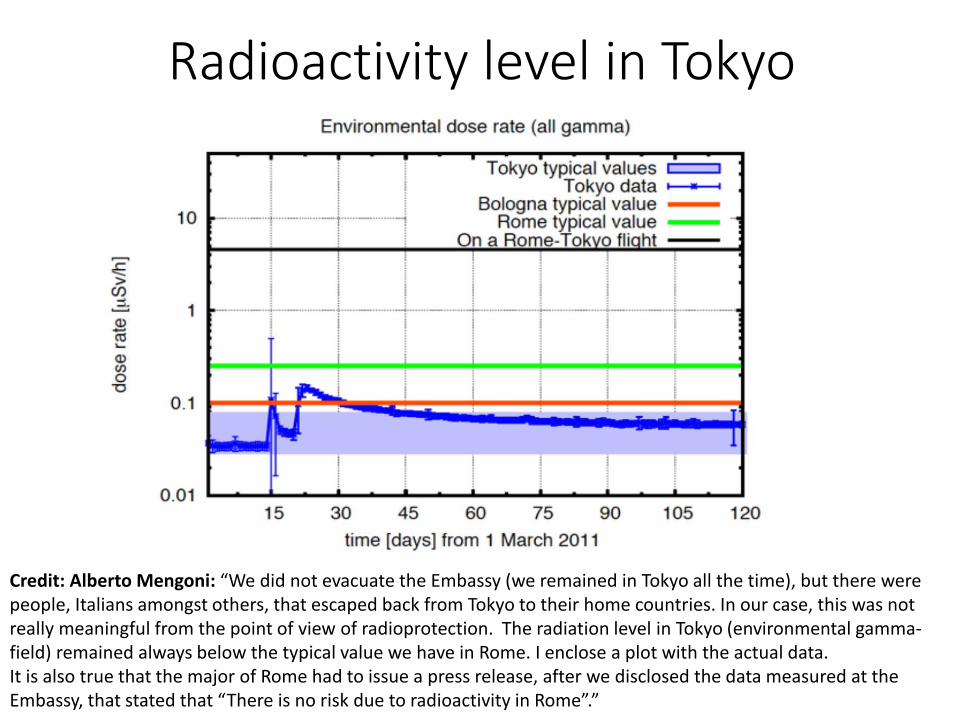
Radioactivity level in Tokyo
Credit: Alberto Mengoni: “We did not evacuate the Embassy (we remained in Tokyo all the time), but there were people, Italians amongst others, that escaped back from Tokyo to their home countries. In our case, this was not really meaningful from the point of view of radioprotection. The radiation level in Tokyo (environmental gamma-field) remained always below the typical value we have in Rome. I enclose a plot with the actual data. It is also true that the major of Rome had to issue a press release, after we disclosed the data measured at the Embassy, that stated that “There is no risk due to radioactivity in Rome”.”

Long term exposure and dose development
The distribution of exposure for the three population groups within the first year and the first decade after Fukushima and the anticipated dose estimated for a lifetime expectation of 80 years. The first year shows the highest dose, after ten tyears the first year dose is doubled and at age 80 the dose is tripled.

Agricultural effects of 137Cs fall-out

137Cs distribution (within one year after Fukushima event)

Comparison with typical human exposure values
1mSv=100mRem
Near Chernobyl
Near Fukushima 300

In Summary • Reactor Accidents are devastating, but unlike nuclear bomb
explosions they remain local events! • They lead to contamination of local area depending on accident
and weather conditions! • The contamination is typically dominated by 137Cs fall-out with a
half life of 30 years as confirmed by measurements at Chernobyl and Fukushima.
• Global environmental and health consequences of radioactive fall-out or dispersion are limited!
• Emotional and political fall-out consequences are enormous!