lecture 2-3: demand, supply analysis and applications a’lam asadov [email protected] office hrs:...
TRANSCRIPT
Lecture 2-3: Demand,
Supply Analysis and Applications
A’lam [email protected] hrs: Friday, 15.00-16.00, Room 103

2
Agenda The relationship between demand and price Demand curve Other determinants of demand The relationship between supply and price The supply curve Other determinants of supply The determination of price: equilibrium price and
output Elasticities and their types

3
DemandBuyers demand goods from the market, whereassellers supply goods to the market.Demand is the quantity of a good buyers wish andare able to purchase at ANY given price over acertain period of time.Note: demand is always backed up by purchasingpower! Merely wanting to buy is not yet demand,one should be able to afford it.Quantity demanded is the quantity of a goodbuyers wish and able to purchase at a given priceover a certain period of time.

4
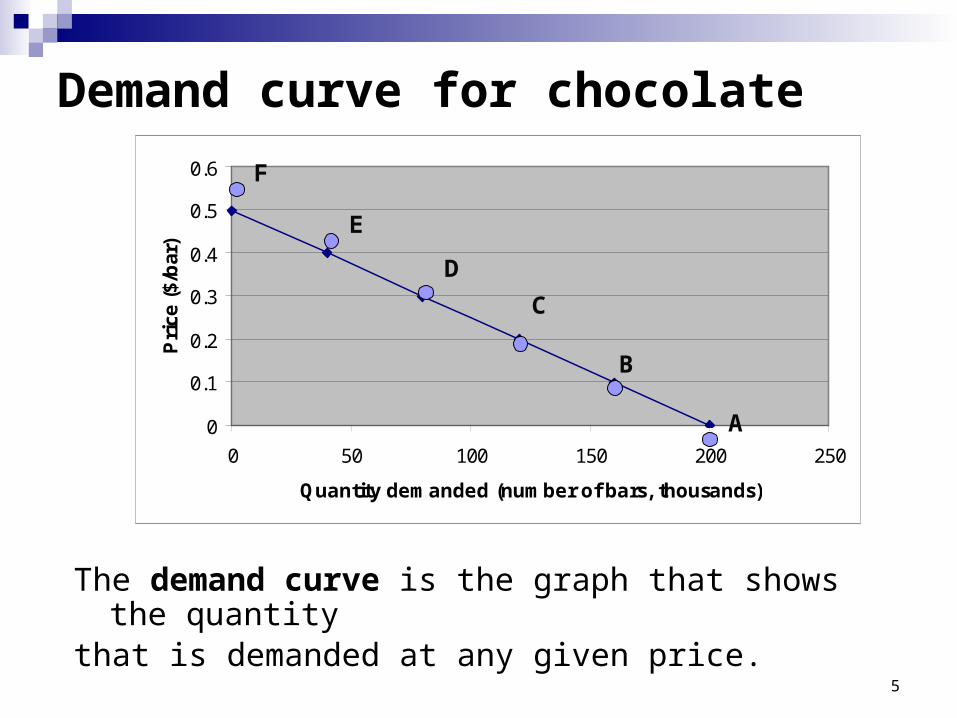
Demand curve for chocolate
Price($/bar)
Tracey’sdemand(quantity of
bars)
Darren’sdemand(quantity of
bars)
Market demand(thousands of
bars)
A 0.00 50 90 200
B 0.10 40 70 160
C 0.20 30 50 120
D 0.30 20 30 80
E 0.40 10 10 40
F 0.50 0 0 0
5
The demand curve is the graph that shows the quantitythat is demanded at any given price.
0
0.1
0.2
0.3
0.4
0.5
0.6
0 50 100 150 200 250
Quantity demanded (number of bars, thousands)
Pri
ce (
$/b
ar)
F
E
D
C
B
A
Demand curve for chocolate

6
Other determinants of demand Tastes and Preferences. The number and the price of substitute
goods. The number and the price of
complementary goods. Income level. Advertisement. Expectations of future price changes. Social and Economic conditions.

7
Movement along the demand curveChange in the quantity demanded –
a movement along the demand curve to a new
point. It occurs when there is a change in price.
B
A
P
Q
D

8
Shifts in demand curveChange in demand – a shift in the demand curve.
It occurs when a non-price determinant of demand
changes.
P
Q
D
D’
D’’
Increase
Decrease

9
Aggregation of Demand (I)

10
Aggregation of Demand (II)

11
Substitutes vs. Complements Substitute goods
Complement goods
Goods which could replace each other in consumption.
Goods which are usually consumed together.
Eg. Coca & PepsiCoffee & Tea
Eg. Car & petrolBread & Butter

12
Question 1
The price of cinema tickets rises and yet it is observed that cinema attendance increases.
Does this mean that the demand curve for cinema tickets is upward sloping?

13
SupplySupply is the quantity of a good sellers wish
and are able to sell at ANY given price over a certain period of time.
Quantity supplied is the quantity of a good sellers wish and are able to sell at a given price over a certain period of time.
When the price of a good rises the quantity supplied will also rise – law of supply.

14
Supply curvePrice($/bar)
Firm 1 supply(quantity of bars)
Market supply(thousands of bars)
a 0.00 0 0
b 0.10 0 0
c 0.20 10 40
d 0.30 20 80
e 0.40 40 120
f 0.50 50 160
The supply curve is the graph that shows the
quantity that is supplied at any given price.

15
Supply curve
0
0.1
0.2
0.3
0.4
0.5
0.6
0 50 100 150 200
Quantity supplied (number of bars, thousands)
Pri
ce (
$/b
ar)
b
c
e
f
d

16
Other determinants of supplyThe costs of production. The higher the costs of
production, the less profit will be made at any
price.
The costs may change because of: Change in input price. Change in technology. Organisational changes. Government policy.

17
Other determinants of supply (cont’) The profitability of alternative products
(substitutes in supply). Nature, “random shocks” and other
unpredictable events. The aims of producers. Expectations of future price changes. Number of suppliers.

18
Movement along the supply curve
Change in the quantity supplied – a movement
along the supply curve to a new point. It occurs
when there is a change in price.
A
B
P
Q
S

19
Shifts in supply curveChange in supply – a shift in the supply curve. It
occurs when a non-price determinant changes.
P
Q
SS’
S’’
Increase
Decrease
20
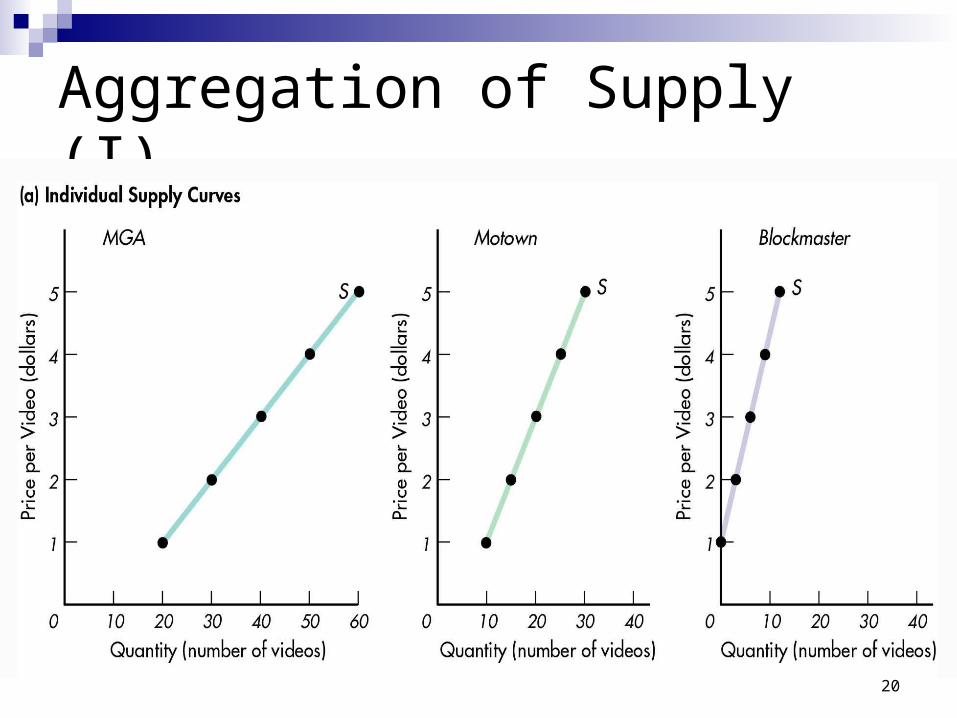
Aggregation of Supply (I)
21
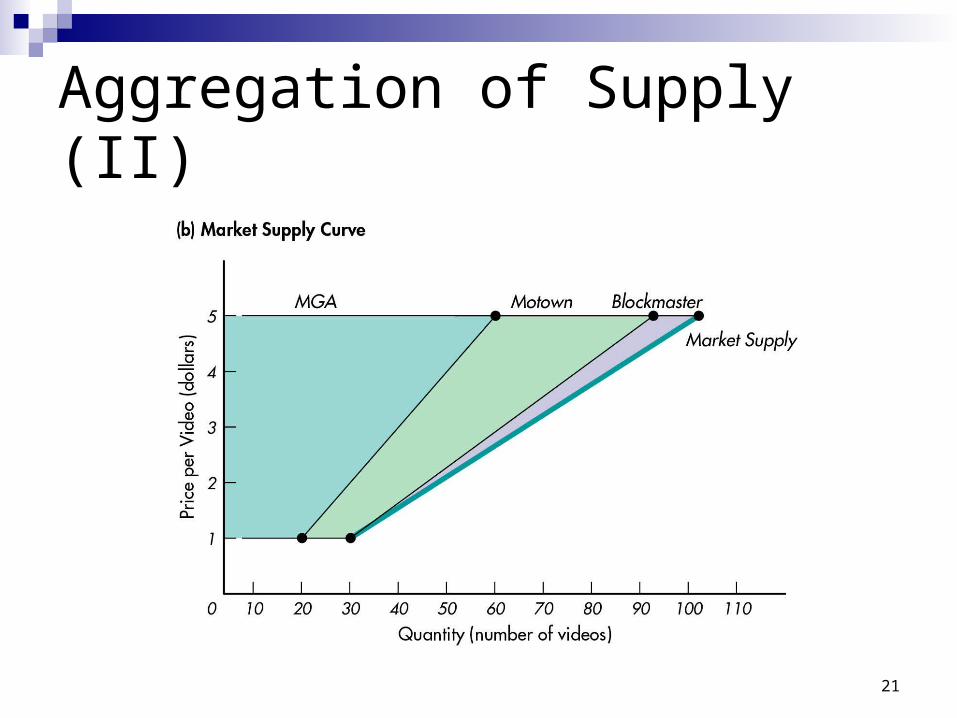
Aggregation of Supply (II)

22
Question 3Consider the case of supply curve of organicallygrown wheat. What effect would the followinghave?
a) A reduction in the cost of organic fertilizersb) An increase in the demand for organic breadc) An increase in the price of organic oats and
barleyd) The belief that the price of organic wheat will rise
substantially in the futuree) A droughtf) A government subsidy granted to farmers using
organic methods

23
Determination of pricePrice ($/bar)
Demand(number of bars,
thousands)
Supply(number of bars,
thousands)
0.00 200 (A) 0 (a)
0.10 160 (B) 0 (b)
0.20 120 (C) 40 (c)
0.30 80 (D) 80 (d)
0.40 40 (E) 120 (e)
0.50 0 (F) 160 (f)
24
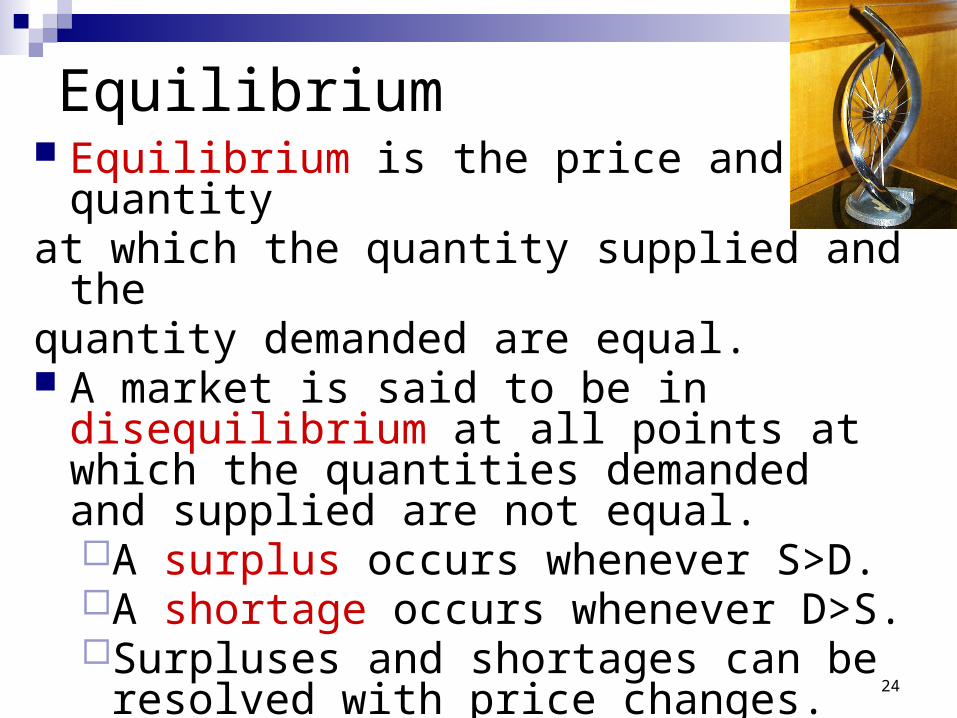
Equilibrium Equilibrium is the price and quantity at which the quantity supplied and the quantity demanded are equal. A market is said to be in disequilibrium at all
points at which the quantities demanded and supplied are not equal.A surplus occurs whenever S>D.A shortage occurs whenever D>S.Surpluses and shortages can be resolved
with price changes.

25
Equilibrium price and output
0
0,1
0,2
0,3
0,4
0,5
0,6
0 50 100 150 200 250
Quantity demanded (number of bars)
Pri
ce (
$/b
ar)
A
f
cC
E e
D
Surplus(80)
Shortage(80)
F
Bb
d

26
Movement to a new equilibriumIncrease in demand
Shortage
D2
Qe2
Pe1
Pe2
0Q
PD1 S
Qe1
27
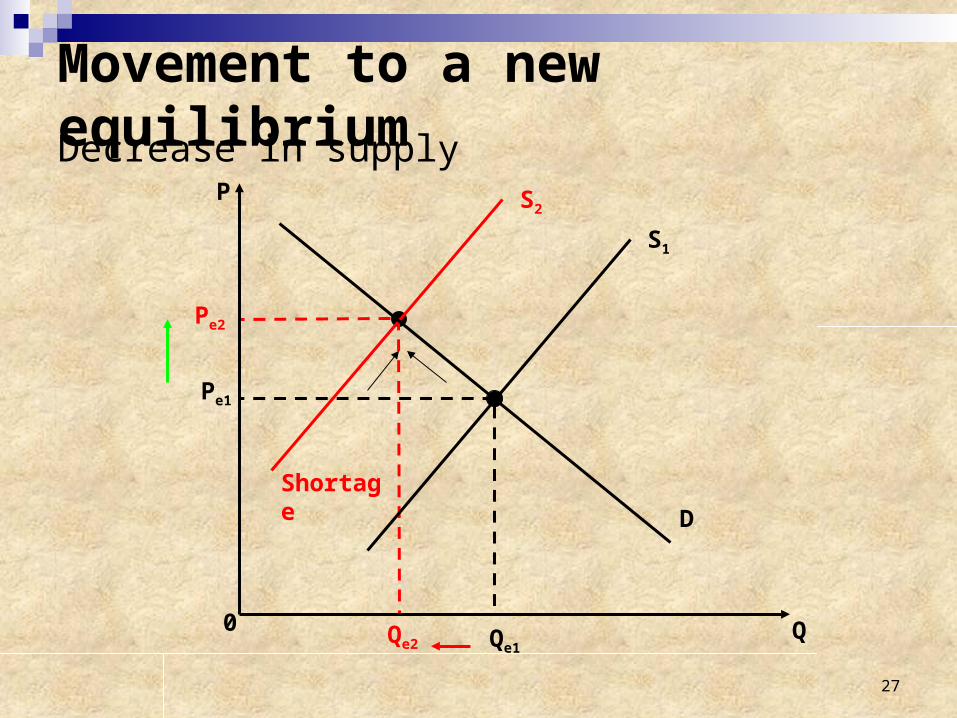
Movement to a new equilibriumDecrease in supply
Qe2
Pe1
Pe2
S2
Qe1
S1
D
0 Q
P
Shortage

28
Price Floors and Ceilings
Price Floor: price is not allowed to decrease below a certain level. Examples: minimum wage, agricultural price supports. If the floor is above the equilibrium price,
then it results in a surplus. Price Ceiling: price is not allowed to increase
above a certain level. Example: rent controls. If the ceiling is below the equilibrium price,
then it results in a shortage.

29
A Price Floor

30
A Price Ceiling
31
Review Questions:Question 1
a) Draw and Describe the shape of the demand curve.
b) Explain the reasons for the shape of the demand curve.
Question 2
a) Explain how equilibrium comes about in a market for a good such as hotel rooms.
b) Sometimes a government fixes or controls prices. Explain what is meant by price ceiling or floor and consider the advantages and disadvantages of each action.

32
Review QuestionsQuestion 3:
a) Explain the principles of economic demand and supply.
b) Sometimes a government fixes or controls prices. Explain what is meant by price control and consider the advantages and disadvantages of such action
Question 4:
a) What is meant by ‘equilibrium in the market’? Explain how equilibrium comes about.
b) Discuss how changes in taste, income and cost of production affect market equilibrium.
c) Under what circumstances would the demand curve be upward sloping? Give 3 reasons.
d) Describe and explain any 3 factors that will affect the demand for cars.