lecture 12: linkage analysis v date: 10/03/02 least squares an em algorithm simulated...
TRANSCRIPT

Lecture 12: Linkage Analysis V
Date: 10/03/02 Least squares An EM algorithm Simulated distribution Marker coverage and density

True Multi-Locus Mapping
True multi-locus mapping would use all the data to build an order and distance between loci. BUT...
Large number of unknown parameters. There are 2l-1 gamete types and the sample size is
usually not large enough to populate all of these types.
Computationally intensive as there are l!/2 possible orders.

Least Squares Method
rij is the recombination fraction between loci i and j.
Mij is the map distance between loci i and j.
srij is the standard deviation of rij.
mi is the map distance between loci i and i+1.
m1 m2 m3 m4 m5 m6
r12 r23 r34 r45 r56 r67
1 2 3 4 5 6 7
recomb.fractionmapdistance

Least Squares Method (cont)
1,0~
1
Ns
mM
ijM
j
ikkij
dr
rdFss
ijij rM

Least Squares: Haldane Map Function
Recall the map function. Find the inverse map
function F(). Take the first derivative
of F(). Plug first derivative into
approximate formula for SM.
21ln2
1
12
1 2
Fm
e m
21
1
d
dF
r
ss ij
ij
r
M 21

Least Squares: Kosambi Map Function
21
21ln
4
1Fm
Recall the inverse map function F().
Take the first derivative of F().
Plug first derivative into approximate formula for SM.

Least Squares Method (cont)
1
2 1
21
2
1exp
l
j
j
i M
j
ikkij
ijs
mML

Least Squares Method (cont)
0
log 1
2 1
1
l
j
j
i M
j
ikkij
jsis ij
s
mMI
dm
Ld

Least Squares: Data
Markers r
M
Haldane Expected
12 0.10 (0.03) 0.11 (0.038) m1
23 0.15 (0.04) 0.18 (0.057) m2
13 0.3 (0.13) 0.46 (0.325) m1+ m2

Least Squares: Calculation
2
21
2
2
2
1
325.0
46.0
057.0
18.0
038.0
11.0log
mmmm
L
0325.0
46.0
057.0
18.0
0325.0
46.0
038.0
11.0
221
21
221
21
mmm
mmm
188.0ˆ
115.0ˆ
2
1
m
m

Least Squares: Variance Estimation
1
2 12,
2
1
log
l
j
j
i Mjtijsi
ts
ijs
I
dmdm
LdI
ijji ImmCov 1,

Least Squares: Variance Calculation
25.31747.9
47.999.701
325.0057.0325.0
325.0325.0038.0222
222
I
0032.0000042.0
000042.00014.01I

Why is this Least Squares?
1
2 1
21
2
1log
l
j
j
i M
j
ikkij
ijs
mML

Alternative Weighting
Use LOD score for linkage as weight. Then the equation becomes:
1
2 1
21
2
1log
l
j
j
i
j
ikkijr mMLL
ij
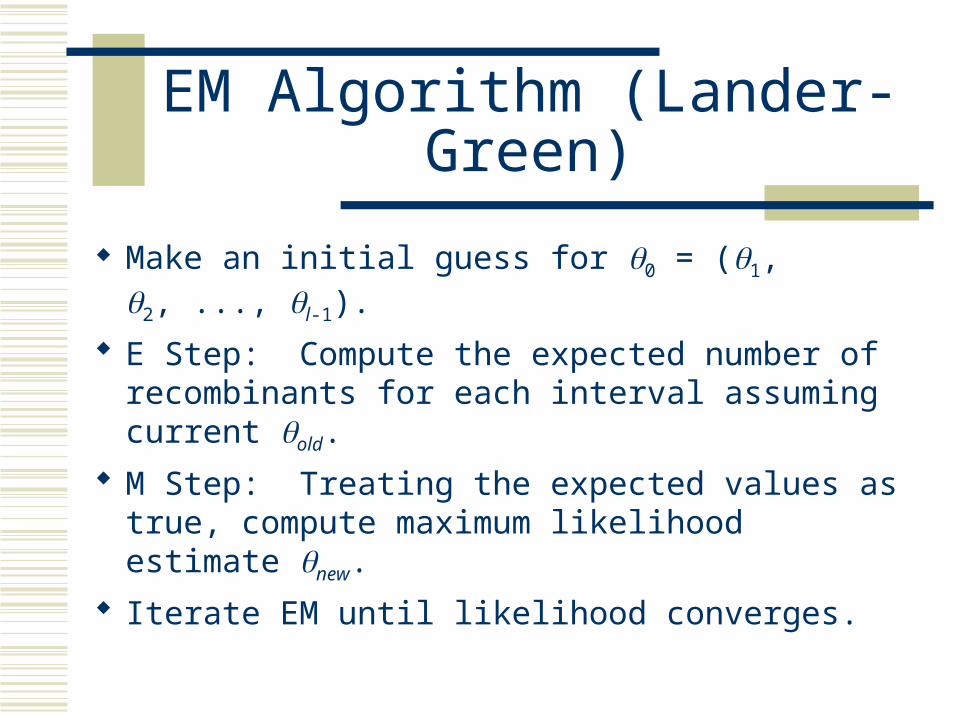
EM Algorithm (Lander-Green)
Make an initial guess for 0 = (1, 2, ..., l-1).
E Step: Compute the expected number of recombinants for each interval assuming current old.
M Step: Treating the expected values as true, compute maximum likelihood estimate new.
Iterate EM until likelihood converges.

EM Algorithm
AB BC AC
True recombination fraction 1 2
True number of recombinants t1 t2
Total observed gametes N12 N23 N13
Number observed recombinants R12 R23 R13

EM Algorithm: E Step
t1 = R12 + P(rec. in AB | rec. in AC)R13 + P(rec. in AB | no rec. in AC)(N13 – R13)
t2 = R23 + P(rec. in BC | rec. in AC)R13 + P(rec. in BC | no rec. in AC)(N13 – R13)

EM Algorithm: E Step (cont)
2121
21
1221
21
11
ACin rec. noP
BCin rec. AB,in rec.PACin rec. noABin rec.P
11
1
ACin rec.P
BCin rec. no AB,in rec.PACin rec.ABin rec.P

EM Algorithm: M Step
1323
22
1312
11
NN
t
NN
t
new
new

Simulation
Find map function which fits the data well by comparing the likelihoods of the data.
Distribution of likelihood difference is unknown, so simulation is needed to obtain it empirically.

Simulation: Evidence for Interference
Recall that if you are given pairwise recombination fractions ij and a map function, you know how to find the gametic frequencies .
Then the log likelihood is given by (m = 2l-1)
m
iiifl
1
log KosambiHaldane LL loglog2

Simulation: Implementation
To simulate under the null hypothesis of no interference, we assume the neighbor pairwise recombination fractions and simulate gametes under the assumption of no interference.
1̂ 2̂
00 1001
11

Marker Coverage and Map Density
Proportion of genome covered by markers is the marker coverage. It is simply the genomic map length divided by total genome length.
The maximum genome segment between two adjacent markers is an indicator of map density. It is the average or maximum map distance between two adjacent markers.

Random Distribution of Markers
Markers are generally assumed to be distributed randomly throughout the genome.
Nonrandom distribution will generally decrease coverage and lower density.
Unfortunately markers may be non-randomly distributed. Name some reasons.

Mapping Population
Even if you have many markers, if your sample is small you may have insufficient information to achieve high coverage and density.
Unattached genome segments are most common coverage problem.
Solutions: increase sample size or using mapping population with more information (greater polymorphism).

Data Analysis and Models
Wrong gene order can overestimate the map length thus overestimating map coverage and underestimating density.
The wrong mapping function may convert recombination fractions into the wrong map distance, causing over/underestimation.
Different grouping criteria can lead to different linkage groups. The more stringent, the more linkage groups and the lower the coverage and higher the density.

Prediction of Marker Coverage and Density
A method for predicting marker coverage and density are based on the assumption of random distribution: confidence probability P is the probability that at
least one marker is located in a 2d M genome segment.

Calculations
Suppose the genome is a total L long. P(a marker not fall on 2d segment) = 1-2d/L. P(n markers don’t fall on 2d segment) = (1-
2d/L)n.

Calculations
P(at least one marker on 2d segment) = 1-(1-2d/L)n
Ld
Pn
/21log
1log
mPLd /1112

Calculations
When 2d/L < 0.1, then
d
PL
Ld
Pn
2
1log
/21log
1log

Predicted Number of Markers Needed
0
50
100
150
200
250
300
350
400
450
500
0.01 0.02 0.03 0.04 0.05 0.06 0.07 0.08 0.09 0.1 0.11 0.12 0.13 0.14 0.15 0.16 0.17 0.18 0.19 0.2
2d M
Nu
mb
er
of
Ma
rke
rs N
ee
de
d
P=90%P=99%P=80%

Prediction when Genome Length Unknown
Use all (500) markers to estimate a genetic map and assume the genome length is the length of this map, say L500.
Randomly draw 100 markers from the dataset with replacement. Estimate the genome length for 100 makers only, say L100.
k
iiL
kLc
1100
500100
11ˆ

Advantages of the Simulation Approach
No assumptions on marker distribution needed.
No prior information about actual genome length is needed.
Approach can be used to test other factors that might affect marker coverage along as those factors can be resampled.

Summary
Least squares method for building genetic maps.
EM algorithm method for building genetic maps.
Simulated likelihood ratio statistic distribution for hypothesis tests.
Predicting marker coverage and density.