lecture 07 profitability analysis - penn engineering ... · pdf fileproduct and process design...
TRANSCRIPT

PRODUCT and PROCESS DESIGN LECTURE 07
Warren D. Seider, University of Pennsylvania 1
Profitability Analysis
Warren D. SeiderUniversity of PennsylvaniaPhiladelphia, Pennsylvania
Holger NickischConsultant
Profitability Analysis 2
Approximate Measures of Economic Goodness
TCICtax)-or After(Pretax Earnings Annual (ROI) Investment on Return =
WCTPI C C +
C - S
Cost Production Total
Usually
Assume 330 days of operation –330/365 = 0.9041 = operating factor
Project productionFirst year - 1/2 × 0.9 capacitySecond year - 3/4 × 0.9 capacityThird year - 1.0 × 0.9 capacity
Income Tax = 0.37 × Pretax Earnings
After-tax Earnings = Pretax Earnings – Income Tax = 0.63 × Pretax Earnings
For ROI

PRODUCT and PROCESS DESIGN LECTURE 07
Warren D. Seider, University of Pennsylvania 2
Profitability Analysis 3
Cost Sheet Outline – Table 17.1 (SSL, 2004)
Profitability Analysis 4
Cost Sheet Outline – Table 17.1 (SSL, 2004) – Cont’d.

PRODUCT and PROCESS DESIGN LECTURE 07
Warren D. Seider, University of Pennsylvania 3
Profitability Analysis 5
Working Capital
CWC = cash reserves + inventory + accts. receivable - accts. payable
30 days of raw materials,utilities, operation, maintenance,
.
.
.
7 days of liquid and solid products at sales price
(gases are pipelined)
30 days of products at sales price
30 days offeedstocks
CTCI = CTPI + CWC
Profitability Analysis 6
Approximate Measures – Table 17-4 (SSL, 2004)
Time value of money ignored – straight-line depreciation used
PRODUCT and PROCESS DESIGN LECTURE 07
Warren D. Seider, University of Pennsylvania 4
Profitability Analysis 7
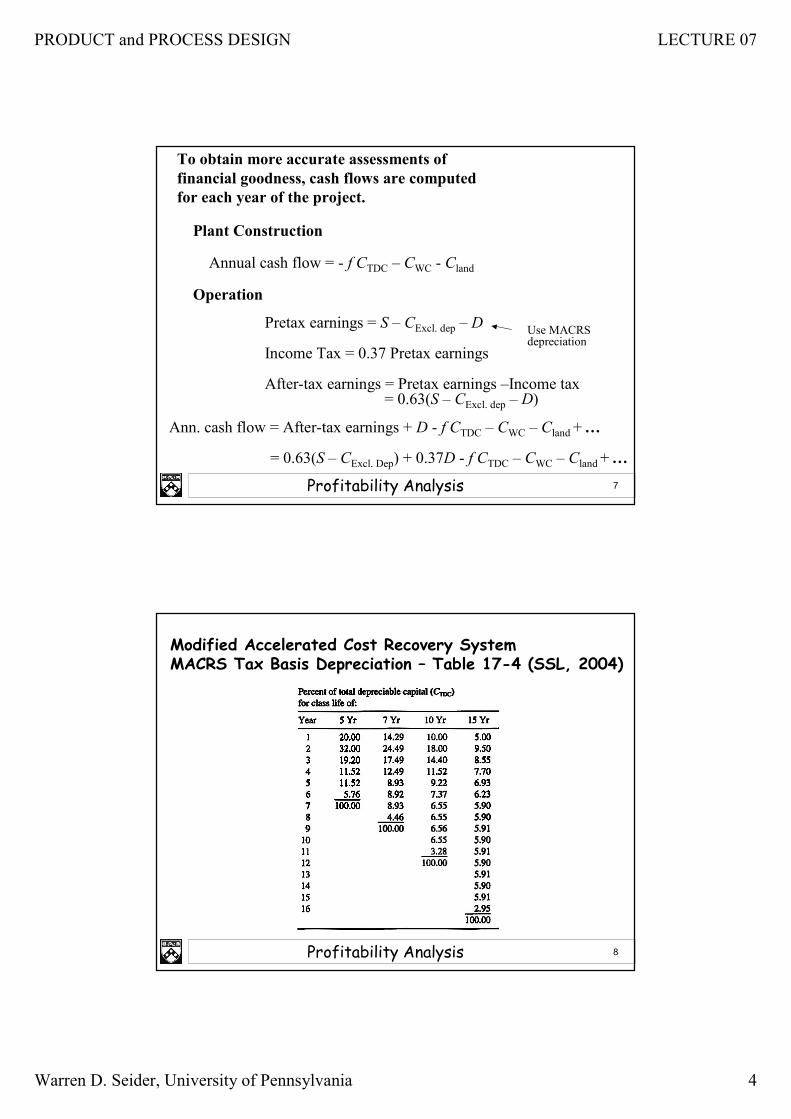
To obtain more accurate assessments of financial goodness, cash flows are computedfor each year of the project.
Plant Construction
Annual cash flow = - f CTDC – CWC - Cland
Operation
Pretax earnings = S – CExcl. dep – D
Income Tax = 0.37 Pretax earnings
After-tax earnings = Pretax earnings –Income tax= 0.63(S – CExcl. dep – D)
Use MACRSdepreciation
Ann. cash flow = After-tax earnings + D - f CTDC – CWC – Cland + …
= 0.63(S – CExcl. Dep) + 0.37D - f CTDC – CWC – Cland + …
Profitability Analysis 8
Modified Accelerated Cost Recovery SystemMACRS Tax Basis Depreciation – Table 17-4 (SSL, 2004)
PRODUCT and PROCESS DESIGN LECTURE 07
Warren D. Seider, University of Pennsylvania 5
Profitability Analysis 9
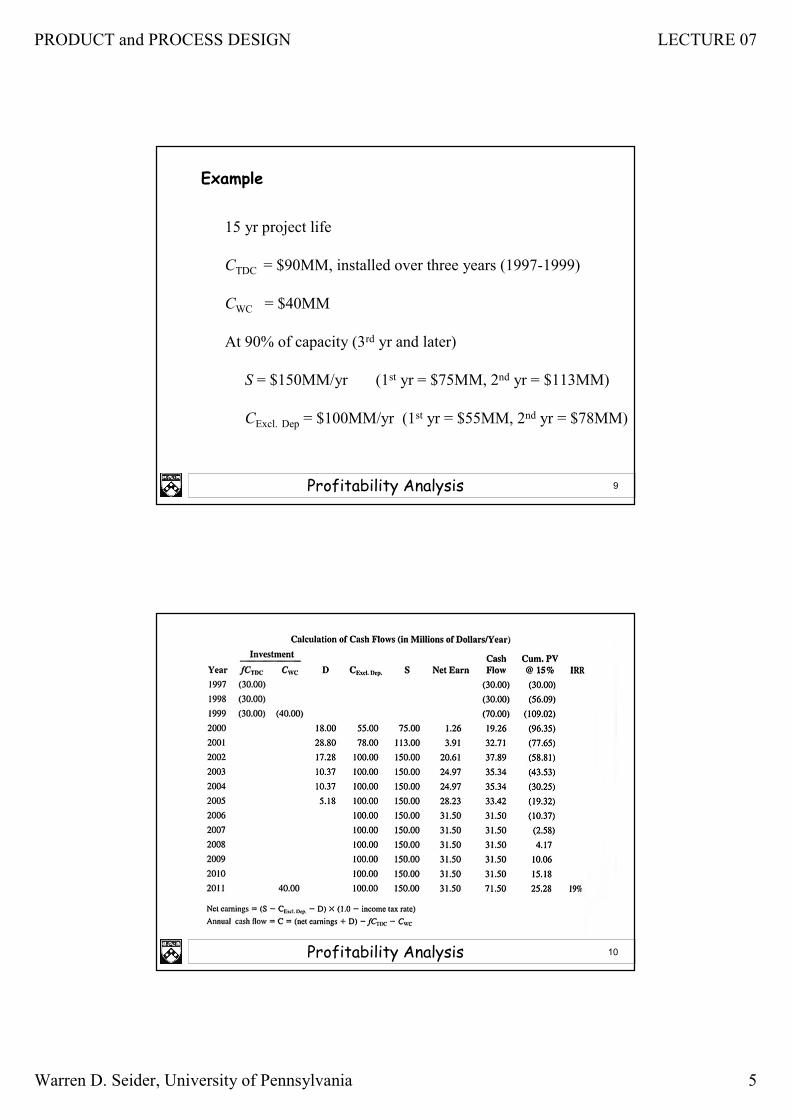
Example
15 yr project life
CTDC = $90MM, installed over three years (1997-1999)
CWC = $40MM
At 90% of capacity (3rd yr and later)
S = $150MM/yr (1st yr = $75MM, 2nd yr = $113MM)
CExcl. Dep = $100MM/yr (1st yr = $55MM, 2nd yr = $78MM)
Profitability Analysis 10

PRODUCT and PROCESS DESIGN LECTURE 07
Warren D. Seider, University of Pennsylvania 6
Profitability Analysis 11
Profitability Analysis 12
Profitability Analysis-1.1.xls by Holger NickischSee Section 17.8 (SSL, 2004)
Aligned with specifications and format of Chapters 16and 17 in SSL, 2004.
Extensive Visual BASIC (VBA) programming is used to reduce most common sources of error whensetting up a complicated spreadsheet in EXCEL. Datais entered in dialog boxes and output is formatted on presentable pages. The user need not know VBA.
Login dialog box – enter user name - ‘student’password - ‘engineer’
Start New Analysis or Load Existing Analysis
PRODUCT and PROCESS DESIGN LECTURE 07
Warren D. Seider, University of Pennsylvania 7
Profitability Analysis 13
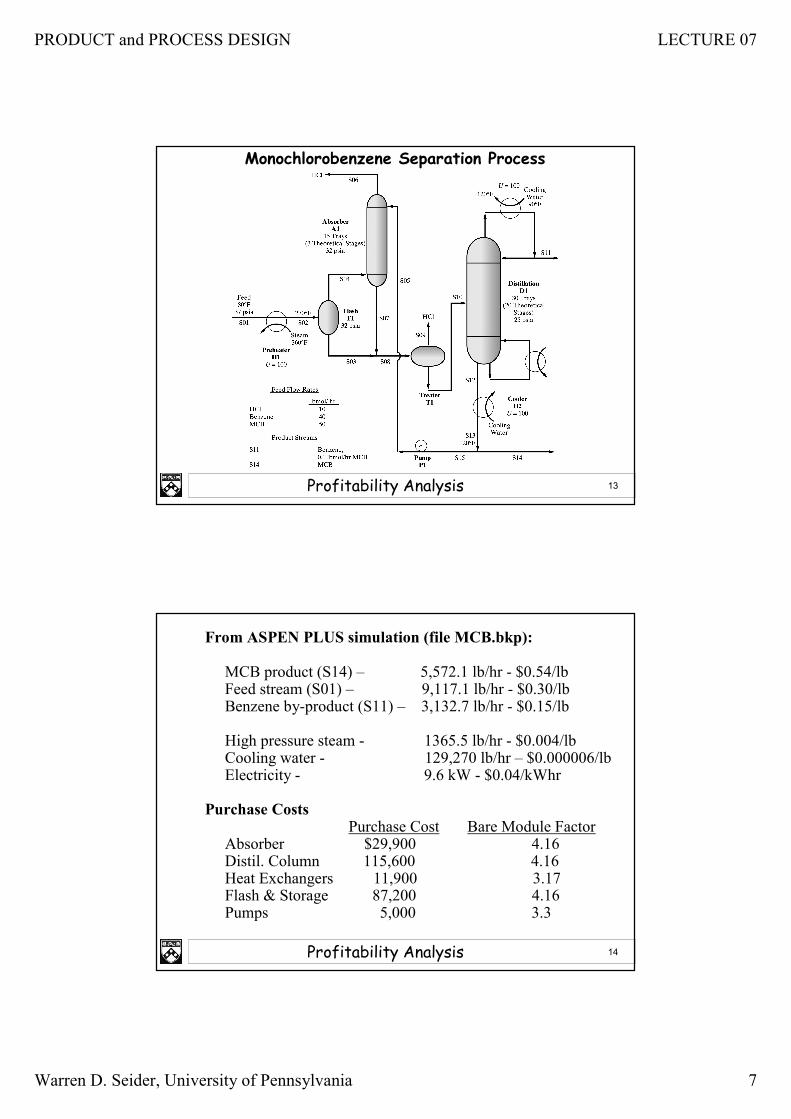
Monochlorobenzene Separation Process
Profitability Analysis 14
From ASPEN PLUS simulation (file MCB.bkp):
MCB product (S14) – 5,572.1 lb/hr - $0.54/lbFeed stream (S01) – 9,117.1 lb/hr - $0.30/lbBenzene by-product (S11) – 3,132.7 lb/hr - $0.15/lb
High pressure steam - 1365.5 lb/hr - $0.004/lbCooling water - 129,270 lb/hr – $0.000006/lbElectricity - 9.6 kW - $0.04/kWhr
Purchase CostsPurchase Cost Bare Module Factor
Absorber $29,900 4.16Distil. Column 115,600 4.16Heat Exchangers 11,900 3.17Flash & Storage 87,200 4.16Pumps 5,000 3.3

PRODUCT and PROCESS DESIGN LECTURE 07
Warren D. Seider, University of Pennsylvania 8
Profitability Analysis 15
Working Capital
Inventory
MCB product 4 daysFeed 2 days
Accounts Receivable 30 days
Note: Defaults in spreadsheet are recommended in Chapters 16 and 17 (SSL, 2004)
Solution is provided in Section 17.8
Student Assignment – Exercise 17.21 – Toluene hydrodealkylation process