learning the mapping x 7→pd x : the cost of finding the
TRANSCRIPT
Learning the mapping x 7→ ∑di=1 x2
i : the cost offinding the needle in a haystack
A Preprint
Jiefu ZhangDepartment of Mathematics,
University of California, Berkeley,Berkeley, CA 94720.
Leonardo Zepeda-NúñezDepartment of Mathematics,
University of Wisconsin-Madison,Madison, WI 53706.
Yuan YaoDepartment of Mathematics,
Hong Kong University of Science and Technology,Clear Water Bay, Kowloon, Hong Kong SAR.
Lin LinDepartment of Mathematics,
University of California, Berkeley,Computational Research Division,
Lawrence Berkeley National Laboratory,Berkeley, CA 94720.
February 26, 2020
Abstract
The task of using machine learning to approximate the mapping x 7→∑di=1 x
2i with xi ∈
[−1, 1] seems to be a trivial one. Given the knowledge of the separable structure of thefunction, one can design a sparse network to represent the function very accurately, or evenexactly. When such structural information is not available, and we may only use a denseneural network, the optimization procedure to find the sparse network embedded in thedense network is similar to finding the needle in a haystack, using a given number of samplesof the function. We demonstrate that the cost (measured by sample complexity) of findingthe needle is directly related to the Barron norm of the function. While only a small numberof samples is needed to train a sparse network, the dense network trained with the samenumber of samples exhibits large test loss and a large generalization gap. In order to controlthe size of the generalization gap, we find that the use of explicit regularization becomesincreasingly more important as d increases. The numerically observed sample complexitywith explicit regularization scales as O(d2.5), which is in fact better than the theoreticallypredicted sample complexity that scales as O(d4). Without explicit regularization (alsocalled implicit regularization), the numerically observed sample complexity is significantlyhigher and is close to O(d4.5).
Learning the mapping x 7→∑di=1 x
2i : the cost of finding the needle in a haystack A Preprint
1 Introduction
Machine learning and, in particular, deep learning methods have revolutionized numerous fields such asspeech recognition [16], computer vision [22], drug discovery [27], genomics [24], etc. The foundation ofdeep learning is the universal approximation theorem [6, 17, 19, 28], which allows neural networks (NN) toapproximate a large class of functions arbitrarily well, given a sufficient large number of degrees of freedom.In practice, however, the number of degrees of freedom is often limited by the computational power, thusthe choice of the architecture to reduce the number of degrees of freedom is of paramount importance forthe quality of the approximation [14, 15, 28]. Empirically, NN models have been shown to be surprisinglyefficient in finding good local, and sometimes global, optima when using an overparameterized model, e.g.training a sparse teacher network is less efficient than training a dense, overparametrized student network[26]. It has been argued that the energy landscape of an overparameterized model may be benign, and incertain situations all local minima become indeed global minima [13, 18, 23, 30]. Furthermore, starting froman overparameterized model, observations such as the lottery ticket hypothesis [11, 12, 25] states that withproper initializations, it is possible to identify the “winning tickets”, i.e. a sparse subnetwork with accuracycomparable to the original dense network.We point out that many of the aforementioned studies focus on image classification problems using commondata sets such as MNIST, CIFAR10 and ImageNet, with or without the presence of noise. However, inscientific computing, the setup of the problem can be very different: usually, we are interested in using NNmodels to parameterize a smooth, high-dimensional function accurately, and often without artificial noise.Within this context, the results mentioned above naturally raise the following questions:
(1) How important is it to select the optimal architecture? In other words, does it matter whether one usesan overparameterized model?
(2) If there is a sparse subnetwork that is as accurate as the overparameterized network, can the trainingprocedure automatically identify the subnetwork? In other words, what is the cost of finding the needle(sparse subnetwork) in a haystack (overparameterized network)?
(3) If (2) is possible, how does the training procedure (such as the use of regularization) play a role?
This paper presents a case study of these questions in terms of a deceivingly simple task: given x ∈ [−1, 1]ddrawn from a certain probability distribution and a target accuracy ε, learn the square of its 2-norm, i.e. thefunction
f∗(x) :=d∑i=1
x2i . (1)
More specifically, for given a neural network model f(x, θ), where θ denotes the parameters in the model,and for a given loss function, such as the quadratic loss ` (y, y′) = 1
2 (y − y′)2, our goal is to find θ such thatthe population loss
L(θ) = Ex,y[`(f(x; θ), f∗(x))] ≤ ε.Note that f∗(x) ∼ O(d), so we consider the scaled target function 1 in order to normalize the output
f∗(x) = 1df∗(x). (2)
However, as in many scientific computing applications, the magnitude of the quantity of interest indeedgrows with respect to the dimension, and our interest here is to approximate the original function f∗(x) to εaccuracy. Using a quadratic loss the population loss needed for approximating f∗ becomes ε/d2. In otherwords, if each component of x is chosen randomly, then by the law of large number f∗(x) converges to aconstant E[x2] as d→∞. So the ε/d2 target accuracy means that it is the deviation from such a mean valuethat we are interested in.If we are allowed to use the mapping x 7→ x2 as an activation function, we would apply this function to eachcomponent and sum up the results, ensuing that the representation will be exact. Therefore, we exclude suchan activation function, and only use standard activation functions such as ReLU or sigmoid, which requiresonly O(log(1/ε)) neurons to reach accuracy ε [33].On the one hand, we can build a network leveraging the separability of Eq. (1). In particular, we can usea small network to approximately represent the scalar mapping x 7→ x2, and sum up the results from all
1Correspondingly f∗ will be called the original target function, or the unscaled target function.
2
Learning the mapping x 7→∑di=1 x
2i : the cost of finding the needle in a haystack A Preprint
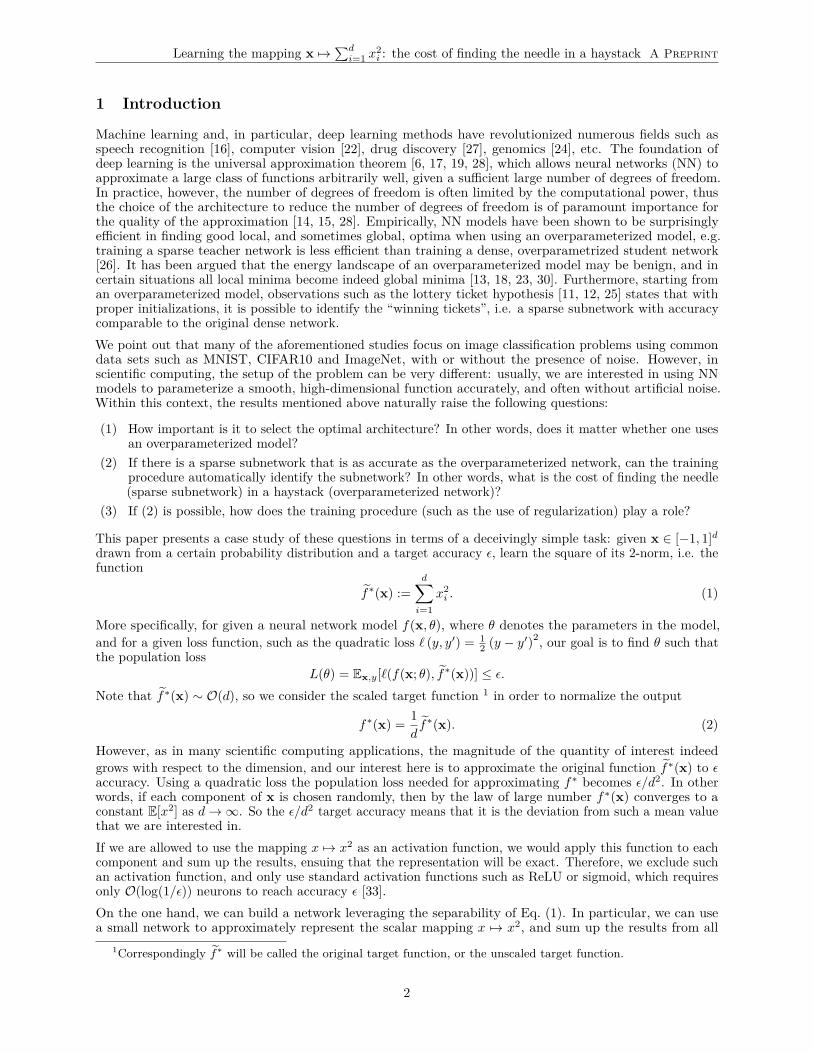
components. The weights for the neural network of each component are shared, so the number of parametersis independent of d. The network will be called the local network (LN) below. On the other hand, if we donot have the a priori structural information that the target function is separable, we need to use a dense orfully connected neural network, which is referred to as the global network (GN). Fig. 1 sketches the structureof LN and GN. Note that LN can be naturally embedded into GN as a subnetwork by deleting certain edges.Therefore the optimal performance of GN should be at least as good as that of LN.
Figure 1: The architecture of the local network is on the left, and the architecture of the global network is onthe right. Here d = 3 and the number of channels α = 3.
Throughout the paper we assume that the number of neurons in the LN is large enough so that the scalarmapping x 7→ x2 is learned very accurately (with test error less than e.g. 10−5), and the structure GN is thenobtained by connecting all the remaining edges. In addition to the architectural bias, we are also concernedwith the sample complexity about GN, i.e. the number of independent samples of f(x) as the training datato reach a certain target accuracy (i.e. generalization error). Our results can be summarized as follows.
1. Using the same number of samples, LN can perform significantly better than GN. This shows thatthe global energy landscape of GN cannot be very simple, and the desired LN subnetwork cannot beeasily identified.
2. If we embed a converged LN into a GN, add small perturbations to the weights of GN, and start thetraining procedure, LN can still outperform GN. This shows that the local energy landscape of GNmay not be simple either.
3. In order to use GN to achieve performance that is comparable to LN, we need a significantly largernumber of samples. The number of samples needed to reach certain target accuracy increases withrespect to the dimension as O(dγ) up to logarithmic factors. From a priori error analysis, we haveγ = 4.
4. The numerical scaling of the sample complexity with respect to d depends on the regularizations. Inparticular, when proper regularization (`1, `2, or path norm regularization [9]) is used, the numericallyobserves sample complexity is around O(d2.5), which behaves better than the theoretically predictedworst case complexity, which scales as O(d4) . On the other hand, when implicit regularization(i.e. early stopping [32]) is used, we observe n ∼ O(d4.5) , i.e. the sample complexity using implicitregularization is significantly larger than that with explicit regularization. The early stopping criteriawe use in this paper is that: after T (1000 in default) epochs, we find an optimal t∗ ≤ T wherethe validation error is minimized. Furthermore, the trained weight matrix obtained with explicitregularization is approximately a sparse matrix, while the weight matrix obtained with early stoppingis observed to be a dense matrix.
Related works:In order to properly describe the sample complexity to reach certain target accuracy, we need to have a priorierror estimate (a.k.a. worst-case error), and/or a posteriori error estimate (a.k.a. instance-based error) of thegeneralization error. For two-layer neural networks, such estimates have been recently established [3, 9] fora large class of functions called Barron functions [4, 21]. The estimates have also been recently extended
3
Learning the mapping x 7→∑di=1 x
2i : the cost of finding the needle in a haystack A Preprint
to deep networks based on the ResNet structure [15, 8]. We obtain our theoretical estimate of the samplecomplexity with respect to d by applying results of [9] to f(x). For a sufficiently wide two-layer neural network,[2] studied the generalization error together with the gradient descent dynamics when using a polynomialactivation function. The problem of “finding the needle in a haystack” by comparing the performance offully-connected networks (FCN) and convolutional neural networks (CNN) was also recently considered by[7] for image recognition problems. It was found that there are rare basins in the space of fully-connectednetworks associated with very small generalization errors, which can be accessed only with prior informationfrom CNN. This corroborates our finding for learning f(x) here. Note that the separable structure in thetarget function can also be viewed from the perspective of permutation symmetry. Therefore our studyalso supports the argument for recognizing the importance of preserving symmetries when designing neuralnetwork architectures, which has been observed by numerous examples in physics based machine learningapplications [34, 35]. Our result also corroborates the recent study [29], which questioned the predictionpower of theoretical generalization error bound rates for overparameterized deep networks trained withoutexplicit regularization.
1.1 Organization
In Section 2 we provide the theoretical foundations for the two-layer networks, including a priori and aposteriori bounds on the generalization gap. In Section 3 we use the theory developed in Section 2 to findthe bounds for the generalization error for the squared norm. Section 4 provides the numerical experiments,followed by discussion in Section 5.
2 Generalization error of two-layer networks
In this section, we briefly describe the concept of the Barron norm, and the generalization error for two-layerneural networks. We refer readers to [9, 10] for more details. Let the domain of interest be Ω = [−1, 1]d.We assume the magnitude of the target function is already normalized to be O(1), e.g. the scaled functionf∗(x) in Eq. (2). Then for any y′ ∼ O(1), both the magnitude and the Lipschitz constant of the square lossfunction `(·, y′) are of O(1).
2.1 Barron norm
We say that a function f : Ω→ R can be represented by a two-layer NN if
f(x; θ) =m∑k=1
akσ(w>k x
). (3)
Here wk ∈ Rd, θ := (ak,wk)mk=0 represents all the parameters in the network, and σ(·) is an scale-invariantactivation function such as ReLU. The scale invariance implies
σ(w>x) = ‖w‖1 σ(w>x), w = w/ ‖w‖1 . (4)
Therefore we may, without loss of generality, absorb the magnitude ‖w‖1 into the scalar a, and assume‖w‖1 = 1.
The training set is composed of n i.i.d. samples S = (x(i), y(i))ni=1. To distinguish the indices, we use x(i)
to denote the i-th sample of the vector (1 ≤ i ≤ n), and use x(i)j to denote the j-th component of the vector
x(i) (1 ≤ j ≤ d).Our goal is to minimize the population loss
L(θ) = Ex,y[`(f(x; θ), y)],
through the minimization of the training loss
Ln(θ) = 1n
n∑i=1
`(f(
x(i); θ), y(i)
).
For a realization of parameters θ, the generalization gap is defined as∣∣∣L(θ)− Ln(θ)
∣∣∣.4
Learning the mapping x 7→∑di=1 x
2i : the cost of finding the needle in a haystack A Preprint
A function f represented by a two-layer neural network is a special case of the Barron function, which admitsthe following integral representation
f(x) =∫Sda(w)σ(〈w,x〉) dπ(w), (5)
where π is a probability distribution over Sd := w| ‖w‖1 = 1, and a(·) is a scalar function. In particular,when we choose π(w) :=
∑mk=1 δ(w−wk) to be a discrete measure and define ak = a(wk), we recover the
standard two-layer network in Eq. (3).Definition 1 (Barron norm and Barron space). Let f be a Barron function. Denote by Θf all the possiblerepresentations of f , i.e.
Θf = (a, π)|f(x) =∫Sda(w)σ(〈w,x〉) dπ(w).
Then the Barron-p norm is defined by
γp(f) := inf(a,π)∈Θf
(∫Sd|a(w)|p dπ(w)
)1/p. (6)
We may then define the Barron space as
Bp(Ω) = f : γp(f) <∞ . (7)
Unlike the standard Lp norms, Proposition 2 shows a remarkable result, which is that all Barron norms areequivalent ([10, Proposition 2.1]).Proposition 2 (Equivalence of Barron norms). For any function f ∈ B1(Ω),
γ1(f) = γp(f), 1 ≤ p ≤ ∞. (8)
To see why this can be the case, let us consider the two-layer NN in Eq. (3), and assume ‖wk‖1 = 1 for all k.By Hölder’s inequality γp(f) ≤ γq(f) when 1 ≤ p < q ≤ ∞. In particular, γ1(f) ≤ γ∞(f), and we only needto show γ∞(f) ≤ γ1(f). Since π should be a discrete measure, let (a, π) be the minimizer for γ1 as in Eq. (6).Then (recall ak := a(wk))
γ1(f) =m∑k=1|ak| .
However, we may define a new distribution
π(w) =m∑k=1
1γ1(f) |ak| δ(w−wk),
then ∫Sda(w) dπ(w) =
m∑k=1|ak| = γ1(f)
m∑k=1
1γ1(f) |ak| = γ1(f)
∫Sd
dπ(w).
In other words, (a, π) ∈ Θf , where ak = γ1(f) is a constant. By definition of Eq. (6),
γ∞(f) ≤ γ1(f)∫Sd
dπ(w) = γ1(f).
This proves γ∞(f) = γ1(f). The same principle can be generalized to prove Proposition 2 for general Barronfunctions [10].Proposition 2 shows that the definition of the Barron space Bp(Ω) = B1(Ω) is independent of p. Therefore wemay drop the subscript p and write Bp(Ω) as B(Ω). Similarly we denote by ‖f‖B := γ1(f) as the Barronnorm.
5
Learning the mapping x 7→∑di=1 x
2i : the cost of finding the needle in a haystack A Preprint
2.2 Error bound
For a given parameter set θ defining Eq. (3), the Barron norm is closely related to the path norm
‖θ‖P :=m∑k=1|ak| . (9)
According to Eq. (6) we immediately have ‖f‖B ≤ ‖θ‖P . The path norm can be used to obtain the followinga posteriori error estimate for the generalization gap for any choice of θ.Theorem 3 (A posteriori error estimate [9]). For any choice of parameter θ, for any δ > 0, and withprobability at least 1− δ over the choice of the training set S,∣∣∣L(θ)− Ln(θ)
∣∣∣ .√ ln(d)n
(‖θ‖P + 1) +√
ln((‖θ‖P + 1)2/δ)n
.
For a given two-layer network, the path norm can be computed directly. Hence in order to reduce thegeneralization error to ε, the number of samples needed is approximately O(‖θ‖2P/ε2), which is a practicallyuseful bound. However, in order to estimate the scaling of n with respect to the dimension d for a particularfunction, we need to replace the ‖θ‖P by some measure of the complexity associated with f∗ itself, such asthe Barron norm. There indeed exists a two-layer network with a bounded path norm, so that the populationloss is small. This is given in Proposition 4 ([9, Proposition 2.1]).Proposition 4. For any f ∈ B(Ω), there exists a two layer neural network f(x; θ) of width m with ‖θ‖P ≤2 ‖f∗‖B, such that
L(θ) .‖f∗‖Bm
. (10)
Eq. (10) characterizes the approximation error due to the use of a neural network of finite width, whichdecays as m−1. Proposition 4 states that it is in principle possible to reduce the population loss while keepingthe path norm being bounded. However, numerical results (both previous works and our own results here)indicate that when minimizing with respect to the training loss directly (when early stopping is used, thisis also called the implicit regularization), the path norm associated with the optimizer can be very large.According to Theorem 3, the resulting generalization error bound can be large as well.A key result connecting the a priori and a posteriori error analysis is to impose stronger requirements of thetraining procedure. Instead of minimizing with respect to the training loss Ln(θ) directly, [9] proposes tominimize with respect to the following regularized loss function
Jλ(θ) := Ln(θ) + λ‖θ‖P , (11)where λ > 0 is a penalty parameter. The corresponding minimizer is defined as
θn,λ = arg minθ
Jλ(θ).
The benefit of minimizing with respect to Eq. (11) is that the path norm is penalized explicitly in the objectivefunction, which allows us to control both the path norm and the generalization error.Theorem 5 (A priori error estimate [9]). Assume that the target function f∗ ∈ B(Ω), and λ ≥ λn =4√
2 ln(2d)/n. Then for any δ > 0 and with probability at least 1− δ over the choice of the training set S
L(θn,λ) .‖f∗‖2Bm
+ λ(‖f∗‖B + 1) + 1√n
(‖f∗‖B +
√ln(n/δ)
). (12)
The path norm of the parameter satisfies∥∥∥θn,λ∥∥∥P.‖f∗‖2Bλm
+ ‖f∗‖B +√
ln(1/δ). (13)
For a fixed target function f∗, the contribution to the error in Eq. (12) can be interpreted as follows: the firstterm is the approximation error, determined by the width of the network. The third is determined by thesample complexity which is proportional to n− 1
2 . The second term is present due to the need of balancingthe loss and the path norm in the objective function (11). If λ is too large, then the regularized loss functionis too far away from the training loss, and the error bound becomes large. On the other hand, Theorem 5requires λ should be at least ∼ n− 1
2 . This can also be seen from Eq. (13) that if λ is too small, the path normbecomes unbounded. Therefore to balance the two factors we should choose the regularization parameter asλ ∼ n− 1
2 .
6
Learning the mapping x 7→∑di=1 x
2i : the cost of finding the needle in a haystack A Preprint
3 Generalization error for squared norm
In this section we apply the generalization error bound in Section 2 to study the scaling of the samplecomplexity with respect to the dimension d for the function in Eq. (1). The two-layer network in Eq. (3)can be viewed as a simplified model of GN (which can have multiple layers). According to Theorem 3 andTheorem 5, we need to estimate the Barron norm ‖f∗‖B.For a given function, the Barron norm is often difficult to compute due to the minimization with respect toall possible (a, π). Instead we may compute the spectral norm. For a given function f ∈ C(Ω), let F be anextension of f to Rd, denoted by F |Ω = f . Define the Fourier transform
F (k) = 12π
∫Rde−ik·xF (x) dx.
Then spectral norm of f is defined as
‖f‖s = infF |Ω=f
∫Rd‖k‖21|F (k)|dk. (14)
Note that the infimum is taken over all possible extensions F . Then the Barron norm can be bounded by thespectral norm as [10, Theorem 2]
‖f‖B ≤ 2 ‖f‖s + 2‖∇f(0)‖1 + 2|f(0)|. (15)
Therefore we may obtain an upper bound of the Barron norm via the spectral norm.Let us now consider f(x) in (2), which satisfies ‖∇f(0)‖1 = |f(0)| = 0. To evaluate the spectral norm, weconsider the one-dimensional version g(x) = x2. Consider any C2 extension of g to R, denoted by G, whichsatisfies
∫R k
2G(k) dk <∞. Then by definition γs(g) ≤∫R k
2G(k) dk <∞.
Now consider the extension F (x) = 1d
∑di=1G(xi), and F (k) = 1
d
∑di=1 G(ki)
∏j 6=i δ(kj). Here δ(·) is the
Dirac-δ function. Then ∫Rd‖k‖21|F (k)|dk = 1
d
d∑i=1
∫Rk2G(k) dk =
∫Rk2G(k) dk,
which gives
‖f‖s ≤∫Rk2G(k) dk. (16)
Combined with Eq. (15), we find that ‖f‖B ∼ O(1). Thus according to Proposition 4 we expect that the pathnorm of the regularized solution satisfies ‖θ‖P ∼ O(1). Hence the leading term of the generalization gap is
‖θ‖P
√ln(d)n∼√
ln(d)n
. (17)
This scaling seems quite favorable, as n only needs to grow as ln(d). However, recall the discussion in Section 1that the target generalization error should be ε/d2, this means that the required sample complexity (up tologarithmic factors) is
n ∼ O(d4/ε2). (18)
According to Theorem 5, the network also needs to be wide enough as m ∼ O(d2/ε). λ ∼ O(n− 12 ) = O(ε/d2).
In particular, the sample complexity increases very rapidly with respect to the dimension d in order toapproximate the unscaled function f∗(x).The analysis of the local network (LN) is essentially applying a two-layer network g(x; θ) to the scalarmapping g(x) = x2. Following the discussion above, the sample complexity is simply n ∼ O(1/ε2). Letzi = x2
i − g(xi; θ), and assume that the error from each component are of mean zero and independent, i.e.
E(zizj) = 0, i 6= j. (19)
7
Learning the mapping x 7→∑di=1 x
2i : the cost of finding the needle in a haystack A Preprint
Then the generalization error is simply
L(θ) =12E(
1d
d∑i=1
x2i −
1d
d∑i=1
g(xi; θ))2
,
= 12d2E
d∑i=1
z2i + 2
∑i 6=j
zizj
,
≈ 12dE
(z2i
)∼ 1d.
Therefore the generalization error of LN can be O(d−1) smaller than that of GN. Note that the condition(19) is crucial for the d−1 factor. In fact if the errors from all components are correlated, there may be nogain at all in terms of the asymptotic scaling with respect to d!However, our numerical results in Section 4 demonstrate that the performance of LN can be significant betterthan GN by a very large margin. Therefore there is still gap in terms of the theoretical understanding of theperformance of LN.
4 Numerical results
In this section we describe in detail the numerical experiments along with the analysis of the empirical results.Our first goal is to study the dependence of the generalization or test error with respect to the architecturalbias. In section 4.2, we showcase the superior performance of the local network, which is built using structuralinformation about the underlying problem, compared to the the global network, in which no information isused.Our second goal is to study the impact of the explicit regularization (versus implicit regularization) whentraining the global network to approximate the unscaled target function. In section 4.3, we characterize thescaling of the test loss with respect to the input dimension, and the scaling of the test loss with respect tothe number of samples with/without the explicit regularization. The explicit regularization improves bothrates according to the numerical experiments.
4.1 Data generation and loss function
For all the numerical experiments, the dimension of the input denoted by d, ranges from 4 to 60 with step size4. For each d, we generate 106 samples by first sampling 106 × d numbers uniformly from the interval [−1, 1]and then organizing the resulting data as a matrix of dimensions 106 × d. We then compute y =
∑di=1 x
2i for
each row. With this setup, the domain of the target function is restricted to Ω = [−1, 1]d.
We also generate data for the sum of quartic and the cosine terms, namely y =∑di=1 x
4i or y =
∑di=1 cosxi.
These datasets are used in section 4.2 to showcase the importance of the architectural bias for target functionsother than y =
∑di=1 x
2i .
For the sake of reproducibility, all the experiments described below use the data generated with a fixed seed.In this section we use n to denote the number of the training samples and Nsample for the number of totalsamples (training, validation, test all combined). For experiments that involve Nsample ≤ 106 samples, weextract the first Nsample rows from the total 106 rows of data.To simplify the training procedure, we enforce the permutation symmetry of the inputs by including thesorting procedure while preprocessing the input data. We point out that this permutation symmetry can bedirectly embedded in the network [34].On one hand, we have done our analysis in section 2 and 3 with respect to the scaled target function f∗(x)in Eq. (2), so the neural networks we build in this section aim to learn the scaled target function. Thus, themean squared error loss for training data when optimizing the networks are defined as
MSE = 1n
n∑i=1
(fNN (x(i), θ)− f∗(x(i))
)2(20)
8

Learning the mapping x 7→∑di=1 x
2i : the cost of finding the needle in a haystack A Preprint
Here n denotes the number of training data, fNN denotes the function represented by the network, and x(i)
represents ith row in the dataset. The test loss can be calculated in the same way using the test data insteadof the training data. On the other hand, we are interested in the performance of the models in the originalscale, so the reported training/test loss are scaled by d2 to represent the mean squared error of approximatingthe original unscaled target function:
MSEoriginial = 1n
n∑i=1
(d · fNN (x(i), θ)− f∗(x(i))
)2(21)
4.2 Architectural bias
In this section we showcase the empirical effects of the architectural bias on the test or generalization errors.To illustrate this effect, in a slightly more generality, we consider as target functions: f∗(x) :=
∑di=1 x
2i ,∑d
i=1 x4i , and
∑di=1 cosxi, respectively. We use three different network architectures to approximate each
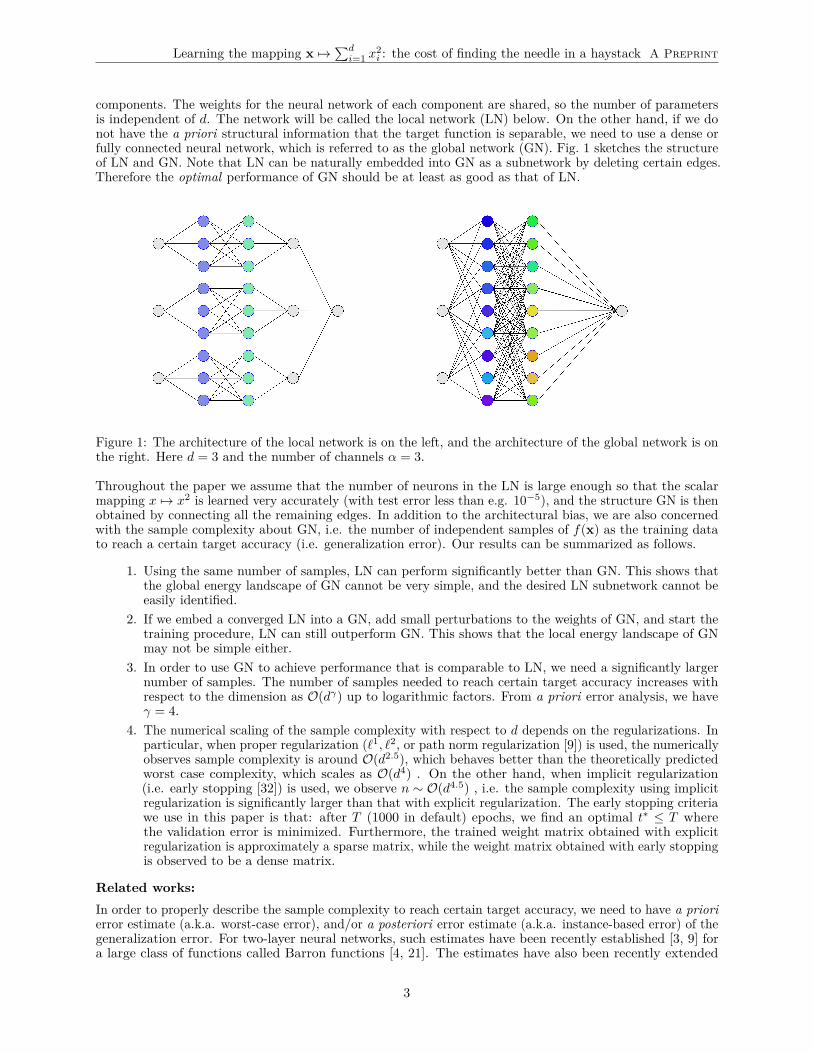
target function: global network, the local network, and the locally connected network (LCN), which is similarto the local network, but whose weights are not longer shared.These three architectures are closely related. In the global (or dense) network, each layer is represented by aweight matrix that is an arbitrary dense matrix (see Figs. 1 and 2). In the locally connected network we havethe same matrix but constrained to be block diagonal. Finally, in the local network we further constraint theweight matrix to be both block diagonal and block circulant, thus implying that the block in the diagonal arethe same (usually called weight-sharing in the machine learning community). This observation allows us toembed a local network into a locally connected one, and then into a global one. This embedding is performedby simply copying the corresponding entries of the weights matrices at each layer and filling the rest withzeros as shown in Fig. 2.Following [17] all three networks can approximate the target function to arbitrary accuracy with just onehidden layer: the result is straightforward for the global network by the universal approximation; for thelocally connected and local networks, the result stems from applying the universal approximation to eachcoordinate, thus approximating the scalar component function g : R→ R (g(x) = x2 in the square case, x4 inthe quartic case and cosx in the cosine case). In practice, however, we find that with two hidden layers thenetworks are easier to train, all the hyperparameters being equal.
Figure 2: The relation of the weight matrices after embedding weight matrices for all three networks (betweenthe first hidden layer and the second hidden layer with input dimension d = 4) into the weight matrix for theglobal network. The arrows mean that the matrices on the left hand side are subsets of the matrices on theright hand side. The blocks in the first weight matrix have the same color to illustrate the weight-sharing.Matrix elements in the white regions are zeros.
Following these considerations, for all the numerical experiments we fix the number of hidden layers to betwo. In addition, we define α as the number of nodes per input node, which for the local networks coincideswith the number of channels. Thus we have d · α nodes in the hidden layers for the global network.The networks are implemented2 with Keras [5], using Tensorflow [1] as the back-end. Within the Kerasframework, we use dense layers, locally connected layers and one-dimensional convolutional layers to implementthe global network, the locally connected network, and the local network, respectively (see Algs. 1, 2, and 3).We add a lambda layer that divides the output by d at the end of the networks to learn the scaled function
2Detailed implementation can be found at https://github.com/jfetsmas/NormSquareLearning.git
9
Learning the mapping x 7→∑di=1 x
2i : the cost of finding the needle in a haystack A Preprint
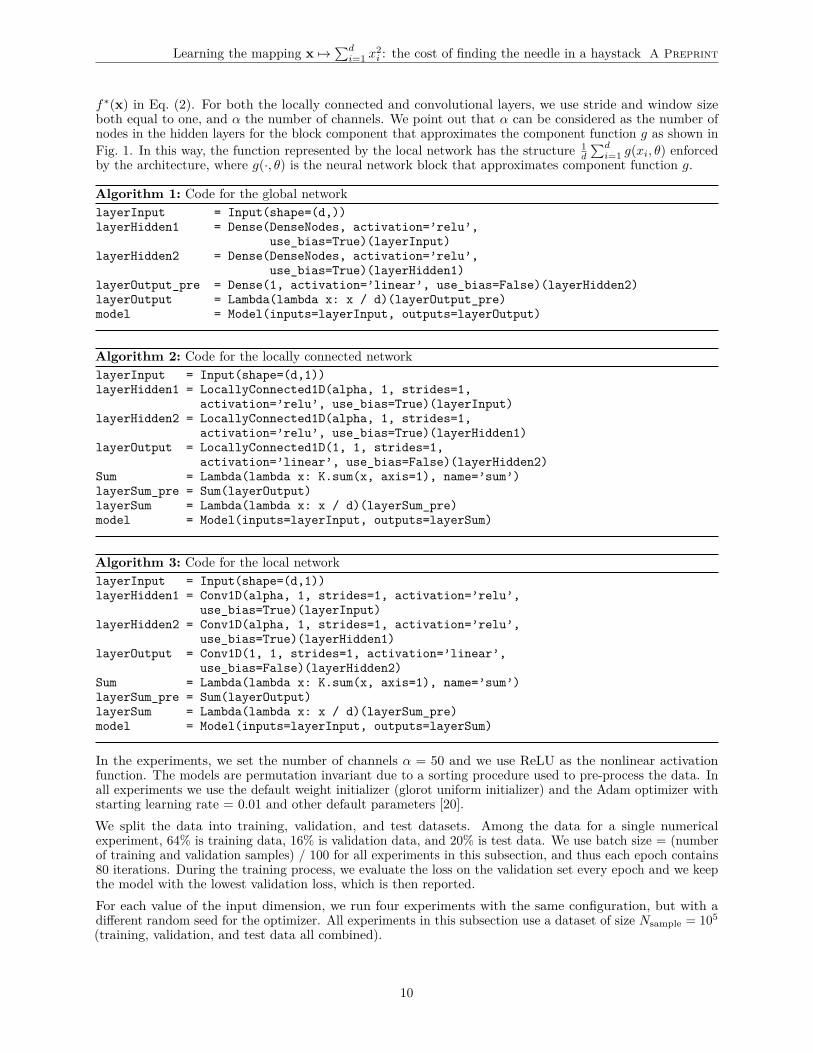
f∗(x) in Eq. (2). For both the locally connected and convolutional layers, we use stride and window sizeboth equal to one, and α the number of channels. We point out that α can be considered as the number ofnodes in the hidden layers for the block component that approximates the component function g as shown inFig. 1. In this way, the function represented by the local network has the structure 1
d
∑di=1 g(xi, θ) enforced
by the architecture, where g(·, θ) is the neural network block that approximates component function g.
Algorithm 1: Code for the global networklayerInput = Input(shape=(d,))layerHidden1 = Dense(DenseNodes, activation=’relu’,
use_bias=True)(layerInput)layerHidden2 = Dense(DenseNodes, activation=’relu’,
use_bias=True)(layerHidden1)layerOutput_pre = Dense(1, activation=’linear’, use_bias=False)(layerHidden2)layerOutput = Lambda(lambda x: x / d)(layerOutput_pre)model = Model(inputs=layerInput, outputs=layerOutput)
Algorithm 2: Code for the locally connected networklayerInput = Input(shape=(d,1))layerHidden1 = LocallyConnected1D(alpha, 1, strides=1,
activation=’relu’, use_bias=True)(layerInput)layerHidden2 = LocallyConnected1D(alpha, 1, strides=1,
activation=’relu’, use_bias=True)(layerHidden1)layerOutput = LocallyConnected1D(1, 1, strides=1,
activation=’linear’, use_bias=False)(layerHidden2)Sum = Lambda(lambda x: K.sum(x, axis=1), name=’sum’)layerSum_pre = Sum(layerOutput)layerSum = Lambda(lambda x: x / d)(layerSum_pre)model = Model(inputs=layerInput, outputs=layerSum)
Algorithm 3: Code for the local networklayerInput = Input(shape=(d,1))layerHidden1 = Conv1D(alpha, 1, strides=1, activation=’relu’,
use_bias=True)(layerInput)layerHidden2 = Conv1D(alpha, 1, strides=1, activation=’relu’,
use_bias=True)(layerHidden1)layerOutput = Conv1D(1, 1, strides=1, activation=’linear’,
use_bias=False)(layerHidden2)Sum = Lambda(lambda x: K.sum(x, axis=1), name=’sum’)layerSum_pre = Sum(layerOutput)layerSum = Lambda(lambda x: x / d)(layerSum_pre)model = Model(inputs=layerInput, outputs=layerSum)
In the experiments, we set the number of channels α = 50 and we use ReLU as the nonlinear activationfunction. The models are permutation invariant due to a sorting procedure used to pre-process the data. Inall experiments we use the default weight initializer (glorot uniform initializer) and the Adam optimizer withstarting learning rate = 0.01 and other default parameters [20].We split the data into training, validation, and test datasets. Among the data for a single numericalexperiment, 64% is training data, 16% is validation data, and 20% is test data. We use batch size = (numberof training and validation samples) / 100 for all experiments in this subsection, and thus each epoch contains80 iterations. During the training process, we evaluate the loss on the validation set every epoch and we keepthe model with the lowest validation loss, which is then reported.For each value of the input dimension, we run four experiments with the same configuration, but with adifferent random seed for the optimizer. All experiments in this subsection use a dataset of size Nsample = 105
(training, validation, and test data all combined).
10
Learning the mapping x 7→∑di=1 x
2i : the cost of finding the needle in a haystack A Preprint
(a) target function y =∑d
i=1 x2i (b) target function y =
∑d
i=1 x4i (c) target function y =
∑d
i=1 cos xi
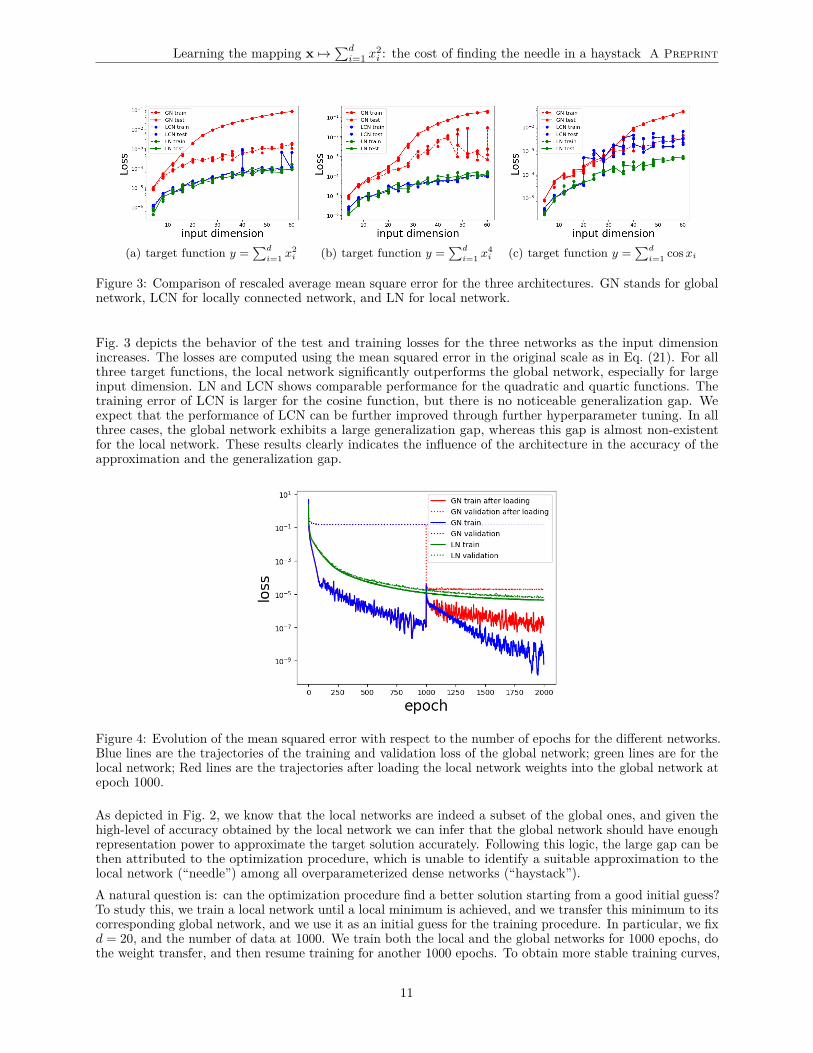
Figure 3: Comparison of rescaled average mean square error for the three architectures. GN stands for globalnetwork, LCN for locally connected network, and LN for local network.
Fig. 3 depicts the behavior of the test and training losses for the three networks as the input dimensionincreases. The losses are computed using the mean squared error in the original scale as in Eq. (21). For allthree target functions, the local network significantly outperforms the global network, especially for largeinput dimension. LN and LCN shows comparable performance for the quadratic and quartic functions. Thetraining error of LCN is larger for the cosine function, but there is no noticeable generalization gap. Weexpect that the performance of LCN can be further improved through further hyperparameter tuning. In allthree cases, the global network exhibits a large generalization gap, whereas this gap is almost non-existentfor the local network. These results clearly indicates the influence of the architecture in the accuracy of theapproximation and the generalization gap.
Figure 4: Evolution of the mean squared error with respect to the number of epochs for the different networks.Blue lines are the trajectories of the training and validation loss of the global network; green lines are for thelocal network; Red lines are the trajectories after loading the local network weights into the global network atepoch 1000.
As depicted in Fig. 2, we know that the local networks are indeed a subset of the global ones, and given thehigh-level of accuracy obtained by the local network we can infer that the global network should have enoughrepresentation power to approximate the target solution accurately. Following this logic, the large gap can bethen attributed to the optimization procedure, which is unable to identify a suitable approximation to thelocal network (“needle”) among all overparameterized dense networks (“haystack”).A natural question is: can the optimization procedure find a better solution starting from a good initial guess?To study this, we train a local network until a local minimum is achieved, and we transfer this minimum to itscorresponding global network, and we use it as an initial guess for the training procedure. In particular, we fixd = 20, and the number of data at 1000. We train both the local and the global networks for 1000 epochs, dothe weight transfer, and then resume training for another 1000 epochs. To obtain more stable training curves,
11

Learning the mapping x 7→∑di=1 x
2i : the cost of finding the needle in a haystack A Preprint
we add decay of 0.03 in the argument of the Adam optimizer. From Fig. 4 we can observe that by properlyinitializing the global network, we are able to significantly reduce the test loss, and to drastically bridge thegeneralization gap (red lines starting at epoch 1000). Although the training error of the global network isconsistently lower than that of the local network (solid blue and red lines, compared with solid green line),the generalization gap (the gap between solid and dashed for the blue and red lines, compared with the gapfor the green lines) of the global network remains noticeably larger compared with the local network.
4.3 The impact of the explicit regularization
In this subsection, we explore the relation between the test loss, the number of samples and the inputdimension. The calculations in section 3 suggests that the leading term of the generalization gap shouldsatisfy Eq. (17). For the global network, the generalization gap is sufficiently large3 that we can regard thetest loss to be approximately equal to the generalization error. Thus, we expect the test loss of the globalnetwork to be bounded by Eq. (17) (multiplied by d2 for the unscaled function). We test the tightness of thebound by conducting the following two experiments:
1. we fix the sample size and investigate the relation between the test loss and the input dimension; and2. we fix the input dimension d and obtain the rate of growth of the test loss with respect to the sample
size.
On one hand, despite numerical errors and the fact that we only use the leading term in Theorem 3, weobserve that the rate with respect to the input dimension suggested by Eq. (17) regarding the input dimensionis close to optimal when using the explicit regularization. On the other hand, the rates with respect to thenumber of samples obtained in numerical experiments are around O(N−0.8
sample) without explicit regularization,and O(N−1.0
sample) with explicit regularization. Hence the convergence rate with respect to the number ofsamples is faster than the theoretical predicted worst case rate as O(N−0.5
sample).
For the first experiment we fix the sample size to 105. For each d ranging from 4 to 60, we repeat thetraining procedure four times with the same set of hyperparameters (the default values have been discussedin section 4.2). In Fig. 5(a), we display the training loss and test loss with respect to the input dimension inlog-log scale. The losses are computed using the mean squared error in the original scale as in Eq. (21). Theslope in Fig. 5(a) indicates that the generalization error of the approximation to the original target functionf∗(x) as in Eq. (1) grows as d3.6, and thus the generalization error of the approximation to the scaled f∗(x)as in Eq. (2) grows as d1.6. The empirical rate d1.6 is a lot larger than logarithmic growth predicted in thebound in Eq. (17).In particular, Eq. (17) indicates that in order to bound the generalization error, the path norm needs to be∼ O(1). However, the boundedness of the path norm is only proven in the context of explicit regularization.Without such an explicit regularization term (also called the “implicit regularization”), there is no a prioriguarantee that the path norm can remain bounded as the input dimension increases.We remark that to compute the path norm for our three-layer network, we need to modify the formula fortwo-layer network. Let us denote the weight matrices of the three layers to be w1,w2,w3. With the width ofhidden layer for the global network being d · α as shown in section 4.2, the size of the weight matrices ared · α× d, d · α× d · α, 1× d · α respectively. In the three-layer case, the path norm can be calculated using theformula:
‖θ‖P := 1d
d∑i=1
dα∑j,k=1
|w1ij ||w2
jk||w3k| (22)
The 1d factor is due to the last layer in Alg. 1, which divides the output by d. Using the updated formula we
plot the path norm with respect to the input dimension in Fig. 5(b). From the figure we can observe that thepath norm grows as ∼ d1.1, thus violating the O(1) assumption for Eq. (17). Notice that in this scenario,although Eq. (17) does not apply, the bound in Theorem 3 provides a fairly good estimate of the growth ofthe generalization error. The leading term in the bound given by Theorem 3 grows as ‖θ‖P
√ln(d). With the
path norm ∼ d1.1, and√
ln(d) empirically behaving like a fractional power of d for small d, the product hasa rate similar to the rate of the test loss observed, which is ∼ d3.6 (after taking into account the d2 scalingfactor).
3Given that the training loss is usually one or more magnitude smaller than the test loss.
12

Learning the mapping x 7→∑di=1 x
2i : the cost of finding the needle in a haystack A Preprint
(a) the relationship between the generalization errorand the input dimension. Slope of the best fitted line(red) is 3.638
(b) the relationship between the path norm and theinput dimension. Slope of the best fitted line (red) is1.107
Figure 5: Experiments without regularization
To demonstrate that explicit regularization indeed reduces the path norm, test loss and generalization error,we implement three types of regularization schemes, and study the growth of the errors with respect to theinput dimension. Let the number of trainable parameters in the neural network be Npar. Denote the trainableparameters by θi
Npari=1 and regularization constant by λ. We can summarize the implementation of the three
regularization as
• L1 regularization, minimizing MSE+λ∑Npari=1 |θi|
• L2 regularization, minimizing MSE+λ∑Npari=1 θ2
i
• path norm regularization, minimizing MSE+λ‖θ‖P , where ‖θ‖P is calculated by Eq. (22)
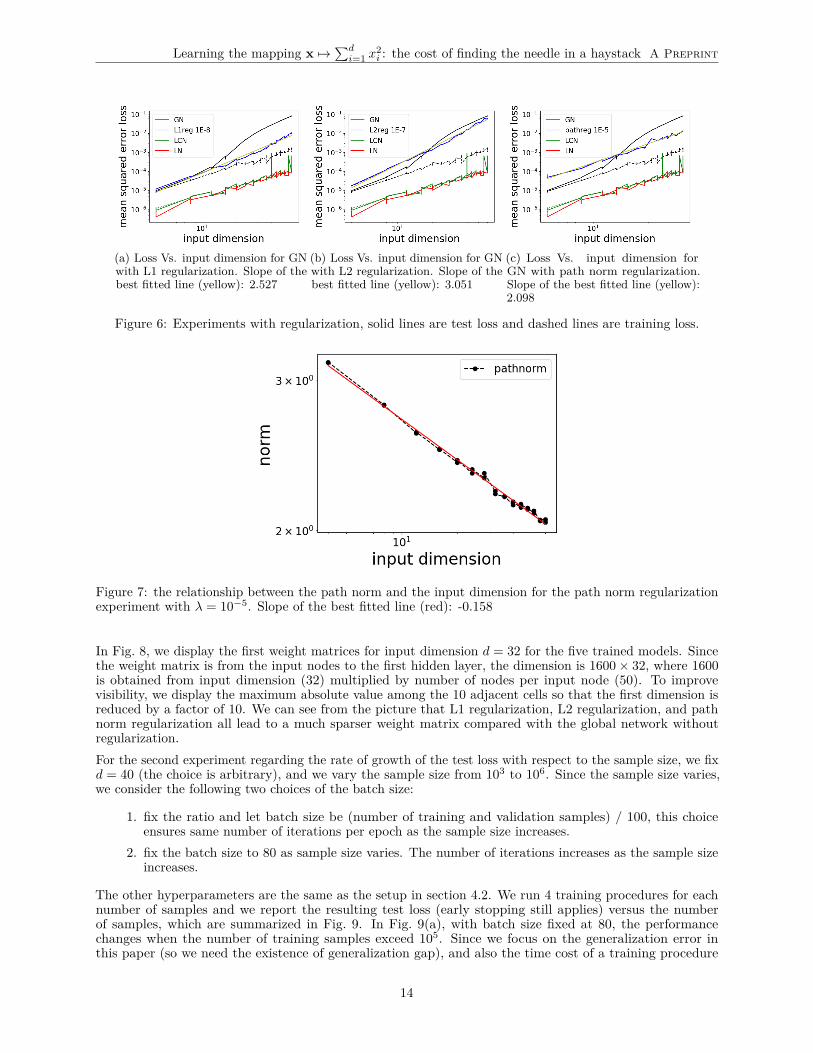
The MSE is computed as in Eq. (20). To implement the three regularization schemes, we use the kernelregularizer in Keras in tensorflow 1.7.0 for the L1 and the L2 regularization (the regularization is only on theweight matrices, but not on the bias), and we use tensorflow 2.0 to implement the path norm regularization.We choose the regularization constant λ (fixed with respect to d) empirically so that the global networkachieves the best test loss. The regularization constants we select in Fig. 6 are 10−8 for L1 regularization,10−7 for the L2 regularization, and 10−5 for the path norm regularization.In addition to the test/train loss Vs. the input dimension for the regularization experiments, we also displayour previous results for GN, LN, and LCN as a reference in Fig. 6Recall that the growth rate of the test loss for the global network without regularization (shown in Fig. 5(a))is around 3.638, all three regularization helps reduce down the rate in Fig. 6. Path norm regularization inFig. 6(c) exhibits the best growth rate, despite that the test loss for small d is slightly larger. We plot thepath norm Vs. the input dimension in Fig. 7 and we indeed observe that the path norm is O(1) as desired.As a matter of fact, the path norm even decreases slightly as d increases, and this is qualitatively differentfrom the behavior of implicit regularization. In addition, with the explicit regularization and thus boundedpath norm, Eq. (17) gives a tight estimate of the rate of growth.Since the weight matrices for the LN embedded GN are block diagonal, and hence are sparse matrices. Wewill look at the first weight matrices of the models under the following scenario:
• GN without regularization,• GN with L1 regularization,• GN with L2 regularization,• GN with path norm regularization, and• GN with optimal LN weights embedded.
13
Learning the mapping x 7→∑di=1 x
2i : the cost of finding the needle in a haystack A Preprint
(a) Loss Vs. input dimension for GNwith L1 regularization. Slope of thebest fitted line (yellow): 2.527
(b) Loss Vs. input dimension for GNwith L2 regularization. Slope of thebest fitted line (yellow): 3.051
(c) Loss Vs. input dimension forGN with path norm regularization.Slope of the best fitted line (yellow):2.098
Figure 6: Experiments with regularization, solid lines are test loss and dashed lines are training loss.
Figure 7: the relationship between the path norm and the input dimension for the path norm regularizationexperiment with λ = 10−5. Slope of the best fitted line (red): -0.158
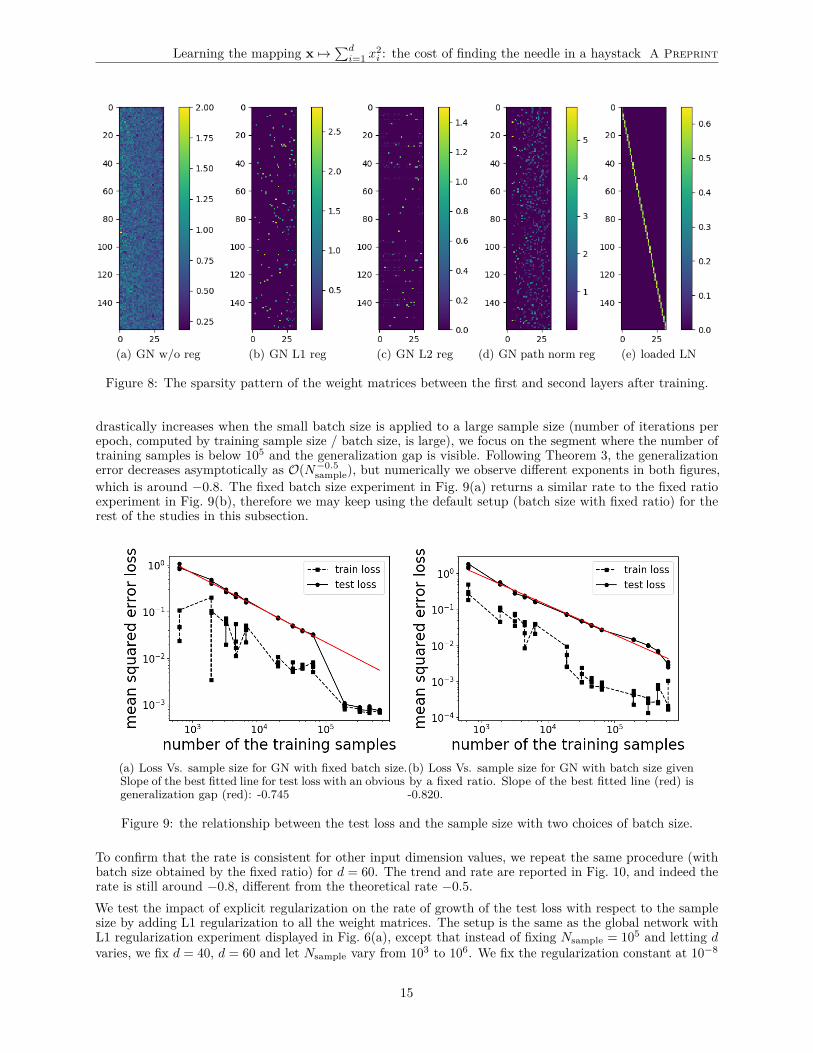
In Fig. 8, we display the first weight matrices for input dimension d = 32 for the five trained models. Sincethe weight matrix is from the input nodes to the first hidden layer, the dimension is 1600× 32, where 1600is obtained from input dimension (32) multiplied by number of nodes per input node (50). To improvevisibility, we display the maximum absolute value among the 10 adjacent cells so that the first dimension isreduced by a factor of 10. We can see from the picture that L1 regularization, L2 regularization, and pathnorm regularization all lead to a much sparser weight matrix compared with the global network withoutregularization.For the second experiment regarding the rate of growth of the test loss with respect to the sample size, we fixd = 40 (the choice is arbitrary), and we vary the sample size from 103 to 106. Since the sample size varies,we consider the following two choices of the batch size:
1. fix the ratio and let batch size be (number of training and validation samples) / 100, this choiceensures same number of iterations per epoch as the sample size increases.
2. fix the batch size to 80 as sample size varies. The number of iterations increases as the sample sizeincreases.
The other hyperparameters are the same as the setup in section 4.2. We run 4 training procedures for eachnumber of samples and we report the resulting test loss (early stopping still applies) versus the numberof samples, which are summarized in Fig. 9. In Fig. 9(a), with batch size fixed at 80, the performancechanges when the number of training samples exceed 105. Since we focus on the generalization error inthis paper (so we need the existence of generalization gap), and also the time cost of a training procedure
14
Learning the mapping x 7→∑di=1 x
2i : the cost of finding the needle in a haystack A Preprint
(a) GN w/o reg (b) GN L1 reg (c) GN L2 reg (d) GN path norm reg (e) loaded LN
Figure 8: The sparsity pattern of the weight matrices between the first and second layers after training.
drastically increases when the small batch size is applied to a large sample size (number of iterations perepoch, computed by training sample size / batch size, is large), we focus on the segment where the number oftraining samples is below 105 and the generalization gap is visible. Following Theorem 3, the generalizationerror decreases asymptotically as O(N−0.5
sample), but numerically we observe different exponents in both figures,which is around −0.8. The fixed batch size experiment in Fig. 9(a) returns a similar rate to the fixed ratioexperiment in Fig. 9(b), therefore we may keep using the default setup (batch size with fixed ratio) for therest of the studies in this subsection.
(a) Loss Vs. sample size for GN with fixed batch size.Slope of the best fitted line for test loss with an obviousgeneralization gap (red): -0.745
(b) Loss Vs. sample size for GN with batch size givenby a fixed ratio. Slope of the best fitted line (red) is-0.820.
Figure 9: the relationship between the test loss and the sample size with two choices of batch size.
To confirm that the rate is consistent for other input dimension values, we repeat the same procedure (withbatch size obtained by the fixed ratio) for d = 60. The trend and rate are reported in Fig. 10, and indeed therate is still around −0.8, different from the theoretical rate −0.5.We test the impact of explicit regularization on the rate of growth of the test loss with respect to the samplesize by adding L1 regularization to all the weight matrices. The setup is the same as the global network withL1 regularization experiment displayed in Fig. 6(a), except that instead of fixing Nsample = 105 and letting dvaries, we fix d = 40, d = 60 and let Nsample vary from 103 to 106. We fix the regularization constant at 10−8
15

Learning the mapping x 7→∑di=1 x
2i : the cost of finding the needle in a haystack A Preprint
Figure 10: Loss Vs. sample size for GN for d = 60. Slope of the best fitted line (red) is -0.756
as in Fig. 6(a). The rates of the segment where there is a visible generalization gap are shown in Fig. 11. Weobserve that as Nsample increases to certain point (around 104), the fixed regularization constant makes theregularization term more significant in the loss, resulting in nearly vanishing generalization gap. Since ourfocus is on generalization error inspired by the theory in section 2 and 3, we report the rate in the segmentwith visible generalization gap. Notice that the rate in the L1 regularization is around −1.0, and hence thedecay of the test loss with respect to the number of samples is faster than that without explicit regularization,which is around −0.8.
(a) Loss Vs. sample size for GN with L1 regularizationfor d = 40. Slope of the best fitted line for test losswith an obvious generalization gap (red): -0.943
(b) Loss Vs. sample size for GN with L1 regularizationfor d = 60. Slope of the best fitted line for test losswith an obvious generalization gap (red): -0.986
Figure 11: the relationship between the test loss and the sample size for the global network with L1regularization.
Eq. (18) gives a theoretical prediction of the scaling of growth of number of samples with respect to theinput dimension in order to maintain a predetermined level of test loss. We find this relation hard to verifydirectly because: 1) The input dimension, and the number of samples are usually chosen among finitelymany values, so the grid may not be fine enough to find the (n, d) combination that gives the predeterminedtest loss; 2) The test loss varies even with same hyperparamter setting, so it is rather difficult to make surethat the test loss stays at a constant value especially given that the loss of the scaled function can be verysmall (10−6 ∼ 10−4). However, we can compute the numerical sample complexity if we assume that thegeneralization gap is in the function form dβ1
nβ2 as in Eq.(17). Recall that theoretical prediction gives β1 = 2
16

Learning the mapping x 7→∑di=1 x
2i : the cost of finding the needle in a haystack A Preprint
because the loss for the original function needs to be scaled by d2 as noted in Eq.(20), and β2 = 0.5. Thenthe sample complexity with respect to d can be characterized by a rate γ as n ∼ O(dγ), where γ = β1
β2= 4.
The rate we obtained for the implicit regularization is β1 = 3.6 as in Fig. 5(a), and β2 = 0.8 as in Fig. 9(b), andthus the sample complexity rate is approximately γ = 4.5, i.e. n ∼ O(d4.5). This is close to the theoreticallypredicted rate, but this largely benefited from the observation that β2 = 0.8 > 0.5. The rate we obtained forthe explicit regularization (L1 with regularization constant 10−8 to be precise) is β1 = 2.5 as in Fig. 6(a), andβ2 = 1.0 as in Fig. 11, and thus the sample complexity rate is approximately γ = 2.5, i.e. n ∼ O(d2.5), whichis significantly better than the theoretically predicted rate. We do point out that this is a very rough estimatebecause of the assumed function form and the fact that the β1 rate in the L1 regularization in Fig. 6(a) is notbased on the generalization gap but the test loss (the generalization gap is very small). Overall, the explicitregularization helps improve the rate in both the test loss Vs. the input dimension, and the test loss Vs. thenumber of training samples, so the advantage of the explicit regularization is convincing.
5 Discussion
Despite the fact that an overparameterized neural network architecture can represent a large class of functions,such representation power can come at the cost of a large sample complexity. This is particularly relevant inmany scientific machine learning applications, as the required accuracy (in the form of a regression problem)is high, and the training data can be difficult to obtain. Therefore a number of recent works have focused ondomain-specific neural network architectures aiming at reducing the number of parameters, “retreating” fromthe overparameterized regime.This paper gives an unambiguous, and minimal working example illustrating why this makes sense. Even forthe seemingly simple task of computing the sum of squares of d numbers in a compact domain (i.e. learning thesquare of a 2-norm), a general purpose dense neural network struggles to find a highly accurate approximationof the function even for relatively low d (tens to hundreds). In particular, the sample complexity of anempirically optimally tuned and explicitly regularized dense network is O(d2.5). This behaves better thanthe sample complexity from a priori error bound, which is O(d4). The origin of such improvement deservesstudy in the future. The sample complexity of an empirically optimally tuned and implicitly regularizeddense network is close to O(d4.5), and hence can be prohibitively expensive as d becomes large.When we choose a proper architecture, such as the local network or the locally connected network, thegeneralization error still grows with respect to d. However, we find that the generalization gap is nearlyinvisible with explicit or implicit regularization, and the test loss is orders of magnitude smaller than that ofthe global (dense) network. Given that the sample complexity can asymptotically scale as the square of thetest loss (assuming training error is negligible), the practical savings due to the use of a local network is vitalto the success of the neural network.From a theoretical perspective, we remark that existing error analysis based on the Rademacher complexity-type cannot yet explain why the prefactor of the local network should be lower by orders of magnitudecompared to the global (dense) network. Our results illustrate that implicit regularization as early stoppingmay not give the optimal generalization error rate in practice, although in theory it can be shown to achievethe same optimal rates as L2 regularization in reproducing kernel Hilbert spaces [32, 31]. Given that implicitregularization is still a prevailing regularization method used in practical applications, better theoreticalunderstanding of the behavior of early stopping regularization in neural networks, and methods to improvethe performance of such an implicit regularization in practice are also needed.
Acknowledgments
This work was partially supported by the Department of Energy under Grant No. DE-SC0017867, theCAMERA program (L. L., J. Z., L. Z.-N.), and the Hong Kong Research Grant Council under Grant No.16303817 (Y. Y.). We thank the Berkeley Research Computing (BRC) program at the University of California,Berkeley, and the Google Cloud Platform (GCP) for the computational resources. We thank Weinan E, ChaoMa, Lei Wu for pointing out the critical role of the path norm in understanding the numerical behavior ofthe generalization error, and thank Joan Bruna, Jiequn Han, Joonho Lee, Jianfeng Lu, Tengyu Ma, LexingYing for valuable discussions.
17

Learning the mapping x 7→∑di=1 x
2i : the cost of finding the needle in a haystack A Preprint
References
[1] M. Abadi, P. Barham, J. Chen, Z. Chen, A. Davis, J. Dean, M. Devin, S. Ghemawat, G. Irving, M. Isard,et al. Tensorflow: A system for large-scale machine learning. In OSDI, volume 16, pages 265–283, 2016.
[2] S. Arora, S. S. Du, W. Hu, Z. Li, and R. Wang. Fine-grained analysis of optimization and generalizationfor overparameterized two-layer neural networks.
[3] F. Bach. Breaking the curse of dimensionality with convex neural networks. J. Mach. Learn. Res.,18(1):629–681, 2017.
[4] A. R. Barron. Universal approximation bounds for superpositions of a sigmoidal function. IEEE Trans.Inform. Theory, 39:930–945, 1993.
[5] F. Chollet et al. Keras. https://keras.io, 2015.[6] N. Cohen, O. Sharir, and A. Shashua. On the expressive power of deep learning: A tensor analysis. In
Conference on Learning Theory, pages 698–728, 2016.[7] S. d’Ascoli, L. Sagun, J. Bruna, and G. Biroli. Finding the needle in the haystack with convolutions: on
the benefits of architectural bias.[8] W. E, C. Ma, and Q. Wang. A priori estimates of the population risk for residual networks.
arXiv:1903.02154, 2019.[9] W. E, C. Ma, and L. Wu. A Priori Estimates for Two-layer Neural Networks. arXiv: 1810.06397, pages
1–14, 2018.[10] W. E, C. Ma, and L. Wu. Barron spaces and the compositional function spaces for neural network
models. arXiv:1906.08039, 2019.[11] J. Frankle and M. Carbin. The lottery ticket hypothesis: Finding sparse, trainable neural networks.
International Conference on Learning Representations (ICLR), 2019. arXiv preprint arXiv:1803.03635.[12] J. Frankle, G. K. Dziugaite, D. M. Roy, and M. Carbin. The lottery ticket hypothesis at scale. arXiv
preprint arXiv:1903.01611, 2019.[13] C. D. Freeman and J. Bruna. Topology and geometry of half-rectified network optimization. In ICLR,
2017. arXiv preprint arXiv:1611.01540.[14] K. He and J. Sun. Convolutional neural networks at constrained time cost. 2015 IEEE Conference on
Computer Vision and Pattern Recognition (CVPR), pages 5353–5360, 2015.[15] K. He, X. Zhang, S. Ren, and J. Sun. Deep residual learning for image recognition. 2016 IEEE Conference
on Computer Vision and Pattern Recognition (CVPR), pages 770–778, 2016.[16] G. Hinton, L. Deng, D. Yu, G. E. Dahl, A. r. Mohamed, N. Jaitly, A. Senior, V. Vanhoucke, P. Nguyen,
T. N. Sainath, and B. Kingsbury. Deep neural networks for acoustic modeling in speech recognition:The shared views of four research groups. IEEE Signal Processing Magazine, 29(6):82–97, 2012.
[17] K. Hornik. Approximation capabilities of multilayer feedforward networks. Neural Networks, 4(2):251–257,1991.
[18] K. Kawaguchi. Deep learning without poor local minima. In arXiv preprint arXiv:1605.07110, 2016.[19] V. Khrulkov, A. Novikov, and I. Oseledets. Expressive power of recurrent neural networks.
arXiv:1711.00811, 2017.[20] D. Kingma and J. Ba. Adam: A method for stochastic optimization. In The 3rd International Conference
for Learning Representations (ICLR), 2015. arXiv:1412.6980v8.[21] J. M. Klusowski and A. R. Barron. Risk bounds for high-dimensional ridge function combinations
including neural networks.[22] A. Krizhevsky, I. Sutskever, and G. E. Hinton. ImageNet classification with deep convolutional neural
networks. In Proceedings of the 25th International Conference on Neural Information Processing Systems- Volume 1, NIPS’12, pages 1097–1105, USA, 2012. Curran Associates Inc.
[23] R. Kuditipudi, X. Wang, H. Lee, Y. Zhang, Z. Li, W. Hu, S. Arora, and R. Ge. Explaining landscapeconnectivity of low-cost solutions for multilayer net. In NeurIPS, 2019. arXiv preprint arXiv:161.
[24] M. K. K. Leung, H. Y. Xiong, L. J. Lee, and B. J. Frey. Deep learning of the tissue-regulated splicingcode. Bioinformatics, 30(12):i121–i129, 2014.
18

Learning the mapping x 7→∑di=1 x
2i : the cost of finding the needle in a haystack A Preprint
[25] Z. Liu, M. Sun, T. Zhou, G. Huang, and T. Darrell. Rethinking the value of network pruning. In ICLR,2019. arXiv preprint arXiv:1810.05270.
[26] R. Livni, S. Shalev-Shwartz, and O. Shamir. On the computational efficiency of training neural networks.Advances in Neural Information Processing Systems, 2014. arXiv preprint arXiv:1410.1141.
[27] J. Ma, R. P. Sheridan, A. Liaw, G. E. Dahl, and V. Svetnik. Deep neural nets as a method for quantitativestructure-activity relationships. Journal of Chemical Information and Modeling, 55(2):263–274, 2015.
[28] H. Mhaskar, Q. Liao, and T. Poggio. Learning functions: When is deep better than shallow. arXivpreprint arXiv:1603.00988, 2016.
[29] V. Nagarajan and J. Z. Kolter. Uniform convergence may be unable to explain generalization in deeplearning. In Advances in Neural Information Processing Systems, pages 11611–11622, 2019.
[30] L. Venturi, A. S. Bandeira, and J. Bruna. Spurious valleys in two-layer neural network optimizationlandscapes. In arXiv preprint arXiv:1802.06384, 2018.
[31] Y. Wei, F. Yang, and M. J. Wainwright. Early stopping for kernel boosting algorithms: A generalanalysis with localized complexities. In NIPS, 2017. arXiv preprint arXiv:1707.01543.
[32] Y. Yao, L. Rosasco, and A. Caponnetto. On early stopping in gradient descent learning. ConstructiveApproximation, 26:289–315, 08 2007.
[33] D. Yarotsky. Error bounds for approximations with deep relu networks. Neural Networks, 94:103–114,2017.
[34] M. Zaheer, S. Kottur, S. Ravanbakhsh, B. Poczos, R. R. Salakhutdinov, and A. J. Smola. Deep sets.pages 3391–3401, 2017.
[35] L. Zhang, J. Han, H. Wang, R. Car, and W. E. DeePCG: constructing coarse-grained models via deepneural networks. arXiv preprint arXiv:1802.08549, 2018.
19