learning & success in algebra research summary · pdf filelearning & success in...
TRANSCRIPT

L e a r n i n g & S u c c e s s i n A l g e b r a R e s e a r c h S u m m a r y
N o v e m b e r 2 0 1 5
Chris Quarles に Everett, WA
Mickey Davis に Berkeley, CA
CONTEXT Over half of community college students are required to take pre-college math. Students placed
into remediation are less likely to complete a degree or certificate. Many never attempt a college-level
mathematics course. As part of a broader effort to increase student success, many colleges have begun to rethink
their remediation programs.
These efforts have created a growing body of research using standard measures of success such as
grades, pass rates, retention, and completion. However, higher education is intended to prepare students for
work and life. Thus, student success includes more than staying in college or completion. There is insufficient
research on the skills that students learn and scant reflection on how remediation prepares them for their
intended paths. This study aims to partially fill that gap. It examines the relationship between traditional student
success measures and students' mathematical knowledge. A clearer understanding of the relationship between
learning and course success will support continued efforts at reform.
This study follows a cohort of students at a community college implementing developmental math
reforms. The math department had created an innovative two-quarter remedial sequence as an alternative to the
pre-existing three-quarter algebra sequence (the same learning outcomes). In addition, they created an
alternative intermediate algebra course that was concept-based and contextualized.
DESIGN In Winter 2012, all intermediate algebra students were given an assessment of algebra skills at
the beginning of the quarter. An identical assessment was given at the beginning of the following quarter in all
college level math classes with intermediate algebra as a prerequisite. The students' long-term outcomes were
followed for three and a half years. The assessment consisted of three parts: (i) a set of mostly procedural
;ノェWHヴ; キデWマゲ ┘エキIエ ;ゲニWS ゲデ┌SWミデゲ デラ さゲラノ┗Wざ ラヴ さゲキマヮノキa┞ざ from the college's final exams for intermediate
algebra, (ii) a set of items from the MARS Balanced Assessment in Mathematics which focuses on conceptual
problem solving and explanation, and (iii) a survey of student attitudes and personal characteristics.
RESULTS
Taking a quarter off of math was associated
with much lower procedural math scores, but
not conceptual/contextualized math scores.
There was no consistent relationship between
student grades in intermediate algebra and
their algebra skills as measured by the
assessment.
“デ┌SWミデゲげ procedural algebra skills as
measured by the procedural items did not
predict performance in college level classes
after controlling for previous grades.
Students who were able to more successfully
do algebra problems were no more likely to
graduate than other students.
CONCLUSIONS These finding suggest that remedial math sequences should be focused on conceptual
understanding & contextualized skills in order to help students retain mathematical knowledge. It seems that
students forget procedural algebra within a few months. They also suggest that taking intermediate algebra is
not necessary for students who do not plan on taking college algebra. In addition, these results cast doubt on
the assumption that grades reflect the amount that student learn. As this relationship is likely influenced by local
factors, more research should be done at individual colleges to ensure that grades are strongly tied to student
learning.

Learning from Research on Learning Christopher Quarles Mickey Davis
November 2015 [email protected] [email protected]
Record Your Thoughts: What policy changes and shifts in teaching and learning practices would you want to see
on your campus based on these findings (assuming that the findings are accurate and generalizable across all
student populations).
Take Action: What action (if any) will you take based on what ┞ラ┌げ┗W ノW;ヴミWSい

“Learning from Research” – Your Hypotheses Christopher Quarles Mickey Davis
November 2015 [email protected] [email protected]
1) Does decreasing the number of required developmental classes (acceleration) affect the amount students
learn?
2) Is conceptual/contextual math retained longer than procedural algebra?
3) Which predicts success in college level math better:
· A student's procedural math skills on the first day of class, or
· Their conceptual/contextual math skills on the first day of class?
4) How much does a student's grade in intermediate algebra reflect:
· The skills learned during the course,
· The skills they knew at the end of the course, or
· Their demographics and personal characteristics?

“Learning from Research” Cheat Sheet Christopher Quarles Mickey Davis
November 2015 [email protected] [email protected]
Math 81/82/99 - 3-quarter traditional procedural algebra sequence
Math 91/92 - Same as 81/82/99, without direct repetition
Math 98 - Integrated communication, data, and real-world applications with procedural algebra topics
Everett Community College
Developmental Math, circa 2011
Phase 1 - First day of intermediate algebra
Phase 2 - Not used
Phase 3 - First day of intro college-level math the next quarter
Variables Relating to Algebra Skills Possible Values
ph3_EvCCaverage Score on Phase 3 EvCC items 0 to 1
evccgains Improvement from Phase 1 to Phase 3 on EvCC items 0 to 1
contextscores1XX Score on conceptual/contextual items 0 to 1
algoscores1XX Score on procedural algebra items 0 to 1
ph3_92score Score on a subscale of items corresponding to Math 92
content
0 to 1
gains92 Improvement from Phase 1 to Phase 3 on the Math 92
subscale
0 to 1
Grades
ph3_D8r Self-reported grade in previous 2-3 math classes 4 = A, 3 = B, etc
gradesin9X Grade in intermediate algebra during the quarter of Phase 1 4 = A, 3 = B, etc
gradesin1XX Grade in intro college math during the quarter of Phase 3 4 = A, 3 = B, etc
Demographic Variables
age 15 to 65
math_last_qtr1XX Did the student take a math class in the past 3 months 1 = yes, 0 = no
PELL_ELIG Eligibility for Pell Grant – a measure of poverty 1 = yes, 0 = no
SEX 1 = male, 0 = female
white 1 = white, 0 = nonwhite

“Learning from Research” Research Results Christopher Quarles Mickey Davis
November 2015 [email protected] [email protected]
Page 1 of 4
Q1: Does decreasing the number of required
developmental classes (acceleration) affect the
amount students learn?
Technique: Two-sample t-test comparing:
· Phase 3 score on EvCC items for students
coming out of the 2-quarter sequence
· Phase 3 score on EvCC items for students
coming out of the 3-quarter sequence
茎待┺ 航態槌痛追 噺 航戴槌痛追 茎凋┺ 航態槌痛追 塙 航戴槌痛追
Welch Two Sample t-test data: prepost92data$ph3_EvCCaverage and prepost3qtrdata$ph3_EvCCaverage t = 1.9437, df = 52.785, p-value = 0.05727 alternative hypothesis: true difference in means is not equal to 0 95 percent confidence interval: -0.002652935 0.168464900 sample estimates: mean of x mean of y 0.5760684 0.4931624

“Learning from Research” Research Results Christopher Quarles Mickey Davis
November 2015 [email protected] [email protected]
Page 2 of 4
Q2: Is conceptual/contextual math retained longer
than procedural algebra?
Technique: Two sets of multiple regression
Predict: Score on Phase 3 conceptual/
contextualized items
Based on independent variables:
· Whether a student had taken math the
previous quarter (self-reported)
· Age
Call: lm(formula = contextscores1XX ~ math_last_qtr1XX + age, data = phase3data) Residuals: Min 1Q Median 3Q Max -0.51848 -0.16024 0.01475 0.17584 0.63250 Coefficients: Estimate Std. Error t value Pr(>|t|) (Intercept) 0.623273 0.036855 16.911 < 2e-16 *** math_last_qtr1XX 0.018006 0.021701 0.830 0.407 age -0.005745 0.001423 -4.038 6.48e-05 *** --- Signif. codes: 0 ‘***’ 0.001 ‘**’ 0.01 ‘*’ 0.05 ‘.’ 0.1 ‘ ’ 1 Residual standard error: 0.2159 on 400 degrees of freedom (23 observations deleted due to missingness) Multiple R-squared: 0.0435, Adjusted R-squared: 0.03871 F-statistic: 9.095 on 2 and 400 DF, p-value: 0.0001372
Predict: Score on Phase 3 procedural items
Based on independent variables:
· Whether a student had taken math the
previous quarter (self-reported)
· Age
Call: lm(formula = algoscores1XX ~ math_last_qtr1XX + age, data = phase3data) Residuals: Min 1Q Median 3Q Max -0.53735 -0.15431 -0.01686 0.12821 0.72390 Coefficients: Estimate Std. Error t value Pr(>|t|) (Intercept) 0.365459 0.035045 10.428 <2e-16 *** math_last_qtr1XX 0.223701 0.020635 10.841 <2e-16 *** age -0.002886 0.001353 -2.133 0.0335 * --- Signif. codes: 0 ‘***’ 0.001 ‘**’ 0.01 ‘*’ 0.05 ‘.’ 0.1 ‘ ’ 1 Residual standard error: 0.2053 on 400 degrees of freedom (23 observations deleted due to missingness) Multiple R-squared: 0.2459, Adjusted R-squared: 0.2421 F-statistic: 65.22 on 2 and 400 DF, p-value: < 2.2e-16

“Learning from Research” Research Results Christopher Quarles Mickey Davis
November 2015 [email protected] [email protected]
Page 3 of 4
Q3: How well do each of the following predict
grades in college level classes:
· A student's procedural math skills on the
first day of class, or
· Their conceptual/contextual math skills on
the first day of class
· Demographic & personal characteristics
Technique: Multiple regression
Predict: Grades in college-level math
Based on independent variables:
· Score on Phase 3 procedural items
· Score on Phase 3 contextual/conceptual
items
· Self-reported grade in last 2-3 math
courses (ph3_D8r)
· Demographic variables
Call: lm(formula = gradesin1XX ~ algoscores1XX + contextscores1XX + ph3_D8r + age + white + SEX + PELL_ELIG, data = phase3day10data) Residuals: Min 1Q Median 3Q Max -3.1235 -0.6858 0.3012 0.9000 3.2998 Coefficients: Estimate Std. Error t value Pr(>|t|) (Intercept) 0.384319 0.413426 0.930 0.35329 algoscores1XX 0.186192 0.342635 0.543 0.58723 contextscores1XX 1.032067 0.337294 3.060 0.00241 ** ph3_D8r 0.523189 0.098379 5.318 2e-07 *** age -0.006728 0.010392 -0.647 0.51785 white -0.154775 0.150598 -1.028 0.30487 SEX 0.076562 0.143142 0.535 0.59312 PELL_ELIG 0.009604 0.157803 0.061 0.95151 --- Signif. codes: 0 ‘***’ 0.001 ‘**’ 0.01 ‘*’ 0.05 ‘.’ 0.1 ‘ ’ 1 Residual standard error: 1.25 on 314 degrees of freedom (63 observations deleted due to missingness) Multiple R-squared: 0.1488, Adjusted R-squared: 0.1298 F-statistic: 7.843 on 7 and 314 DF, p-value: 9.217e-09
A follow-up regression was done only on students in precalculus, where more algebra might be
required. Call: lm(formula = gradesin1XX ~ algoscores1XX + contextscores1XX + ph3_D8r + age + white + SEX + PELL_ELIG, data = phase3classprecalc) Residuals: Min 1Q Median 3Q Max -3.3463 -0.8284 0.1986 0.9487 3.2225 Coefficients: Estimate Std. Error t value Pr(>|t|) (Intercept) 0.91671 0.58041 1.579 0.116418 algoscores1XX 0.57371 0.47466 1.209 0.228760 contextscores1XX 0.88570 0.49385 1.793 0.074985 . ph3_D8r 0.51885 0.13963 3.716 0.000289 *** age -0.03161 0.01584 -1.995 0.047904 * white -0.45104 0.21038 -2.144 0.033705 * SEX -0.08223 0.20309 -0.405 0.686153 PELL_ELIG 0.15690 0.22268 0.705 0.482180 --- Signif. codes: 0 ‘***’ 0.001 ‘**’ 0.01 ‘*’ 0.05 ‘.’ 0.1 ‘ ’ 1 Residual standard error: 1.241 on 145 degrees of freedom (29 observations deleted due to missingness) Multiple R-squared: 0.2116, Adjusted R-squared: 0.1735 F-statistic: 5.56 on 7 and 145 DF, p-value: 1.093e-05

“Learning from Research” Research Results Christopher Quarles Mickey Davis
November 2015 [email protected] [email protected]
Page 4 of 4
Call: lm(formula = gradesin9X ~ gains99 + ph3_99score, data = prepost99) Coefficients: Estimate Pr(>|t|) (Intercept) 1.9605 7.03e-12 *** gains99 0.3017 0.61643 ph3_99score 1.6413 0.00374 ** --- Residual standard error: 0.6662 on 59 degrees of freedom Multiple R-squared: 0.3043, Adjusted R-squared: 0.2807 F-statistic: 12.9 on 2 and 59 DF, p-value: 2.245e-05
Q4: How will do the following predict a student's
grade in intermediate algebra:
· How much their math skills improved from
day 1 to the start of the next class,
· Their math skills at the start of the next
class, or
· Demographic & personal characteristics
Technique: Multiple regression
Predict: Intermediate algebra grade
Based on independent variables:
· Gains on EvCC items (learning in int. alg.)
· Score on Phase 3 EvCC items (skills at start
of next quarter)
· Demographic Variables (for control)
Call: lm(formula = gradesin9X ~ evccgains + ph3_EvCCaverage + SEX + PELL_ELIG + white, data = prepostdata) Residuals: Min 1Q Median 3Q Max -2.09684 -0.58167 0.01417 0.62912 1.45540 Coefficients: Estimate Std. Error t value Pr(>|t|) (Intercept) 2.52001 0.28658 8.793 4.34e-14 *** evccgains 0.70895 0.60380 1.174 0.2431 ph3_EvCCaverage 0.96293 0.56889 1.693 0.0936 . SEX -0.07616 0.15796 -0.482 0.6307 PELL_ELIG 0.04592 0.16494 0.278 0.7813 white -0.28127 0.17393 -1.617 0.1090 --- Signif. codes: 0 ‘***’ 0.001 ‘**’ 0.01 ‘*’ 0.05 ‘.’ 0.1 ‘ ’ 1 Residual standard error: 0.7927 on 100 degrees of freedom (168 observations deleted due to missingness) Multiple R-squared: 0.1268, Adjusted R-squared: 0.08312 F-statistic: 2.904 on 5 and 100 DF, p-value: 0.01723
Follow-up: Three regressions, split up by course
Predict: Grade in 92, 98, 99
Based on independent variables:
· Gains on a weighted subscale corresponding to
the skills taught in each course (learning in int.
alg.)
· Scores on Phase 3 items of that subscale (skills at
start of next quarter)
Call: lm(formula = gradesin9X ~ gains92 + ph3_92score, data = prepost92) Coefficients: Estimate Pr(>|t|) (Intercept) 2.61257 4.64e-08 *** gains92 0.85367 0.458 ph3_92score 0.05195 0.967 --- Residual standard error: 0.9073 on 42 degrees of freedom Multiple R-squared: 0.04318, Adjusted R-squared: -0.00238 F-statistic: 0.9478 on 2 and 42 DF, p-value: 0.3957
Call: lm(formula = gradesin9X ~ gains98 + ph3_98score, data = prepost98) Coefficients: Estimate Pr(>|t|) (Intercept) 3.0802 0.000415 *** gains98 4.4089 0.000992 *** ph3_98score -2.0058 0.168664 --- Residual standard error: 0.3899 on 9 degrees of freedom Multiple R-squared: 0.7758, Adjusted R-squared: 0.726 F-statistic: 15.57 on 2 and 9 DF, p-value: 0.001196

P a g e | 1
Math Skills Assessment
Please carefully answer each of the following questions to the best of your ability. The following data
will be used in aggregate to analyze the test results and will not be stored on your record or shared with
outside entities. This information will only be used for research purposes.
1. Name:_____________________________________________
2. Student ID number (should start with 804): ___ ___ ___ - ___ ___ - ___ ___ ___ ___
3. Current Math Class: ____________________ (107, 138, 141, 146)
4. What was the last math class you took before this one? (Circle one)
Math 92 at EvCC Math 98 at EvCC Math 99 at EvCC
Other (List, including where):_________________________________________________
Based on the last math class you took rate how much you agree with the following statements.
a) I entered this class with the math skills needed to succeed in the class.
1 2 3 4 5
Strongly Disagree Neutral Strongly Agree
b) The class went too fast for me.
1 2 3 4 5
Strongly Disagree Neutral Strongly Agree
c) The class went too slow for me.
1 2 3 4 5
Strongly Disagree Neutral Strongly Agree
d) The textbook in the class was important for my learning
1 2 3 4 5
Strongly Disagree Neutral Strongly Agree
e) The homework assignments in the class helped me learn.
1 2 3 4 5
Strongly Disagree Neutral Strongly Agree
f) The class positively influenced my attitude toward math.
1 2 3 4 5
Strongly Disagree Neutral Strongly Agree
g) I would recommend this class to others.
1 2 3 4 5
Strongly Disagree Neutral Strongly Agree
h) How long has it been since you took your last math class:
Last quarter/term 4 months – 1 year 1-2 years More than 2 years

P a g e | 2
Math Skills Assessment
5. How much do you agree with the statement: “I am pretty good at math.”
1 2 3 4 5
Strongly Disagree Neutral Strongly Agree
6. How much do you agree with the statement: “I enjoy learning math.”
1 2 3 4 5
Strongly Disagree Neutral Strongly Agree
7. With regards to the last two math classes you’ve taken, how much do you agree with the following
statement: “The amount of work I put in has had a large effect on my performance in the class.”
1 2 3 4 5
Strongly Disagree Neutral Strongly Agree
8. What have your math grades averaged over the last two or three math courses you’ve taken? (Give
your best estimate.)
A B C D F
9a) Have you decided on a major? Yes No
9b) What is your most likely major?______________________________
9c) How confident are you that this will be your final major?
1 2 3 4 5
Not confident Very Confident
10. The math learning process often requires mastering one skill and then progressing onto the next step
and the next. Some students move from one step to the next relatively easily while others find it more
challenging. Thinking about all your recent math courses, how would you rate yourself on this?
a. I almost always have problems with this.
b. I often have problems with this.
c. I'm kind of in the middle on this.
d. I don’t often have problems with this.
e. I almost never have problems with this.
11. Are you the first person in your immediate family to go to college? Yes No

P a g e | 3
Math Skills Assessment
Do all your work in the test booklet. Please write your answer on the line provided.
1. Simplify the expression. Make sure that all like terms are combined.
_______________________
2. Solve for y.
_______________________
3. Simplify the given expression. This includes making sure there are no parentheses, reducing all
fractions, and writing any numbers as simply as possible.
_______________________
4. Factor completely.
_______________________

P a g e | 4
Math Skills Assessment
5. Polonium-218 decays exponentially. It has a half-life of 8 days. In other words, every 8 days half of
the polonium that you had at the beginning of that 8 days has decayed and is gone. You have a sample of
48 grams of Polonium-218 at , where is given in days.
(a) Complete the table of values which gives the amount of polonium-218 you have remaining.
(b) The data fits an exponential equation of the form where
is the amount of Polonium-218 you have on day . What should A and B be in the equation in order for
the equation to fit the data?
A = __________ B = __________
(c) Sketch a graph which gives the amount of
polonium-218 after days. Make your axis go
from to .
0
8
16
24
32
40

P a g e | 5
Math Skills Assessment
6. Find the value of the expression. Write your answer as an integer or reduced fraction.
_______________________
7. Solve for x.
_______________________
8. Find all values of y that satisfy the inequality.
_______________________

P a g e | 6
Math Skills Assessment
9. Write as a single logarithm. Make sure there is nothing outside the argument of the log and that all
fractions are reduced.
_______________________
10. Simplify the expression. Make sure all like factors are combined and that everything possible is
pulled out of the radical.
_______________________
11. Simplify the given expression. Make sure that everything is combined in one fraction and that all like
terms are combined.
\
_______________________

P a g e | 7
Math Skills Assessment
Please rewrite your name and Student ID number below.
(The number should start with 804.)
Name:_______________________________
Student ID Number: ___ ___ ___ - ___ ___ - ___ ___ ___ ___

P a g e | 8
Math Skills Assessment
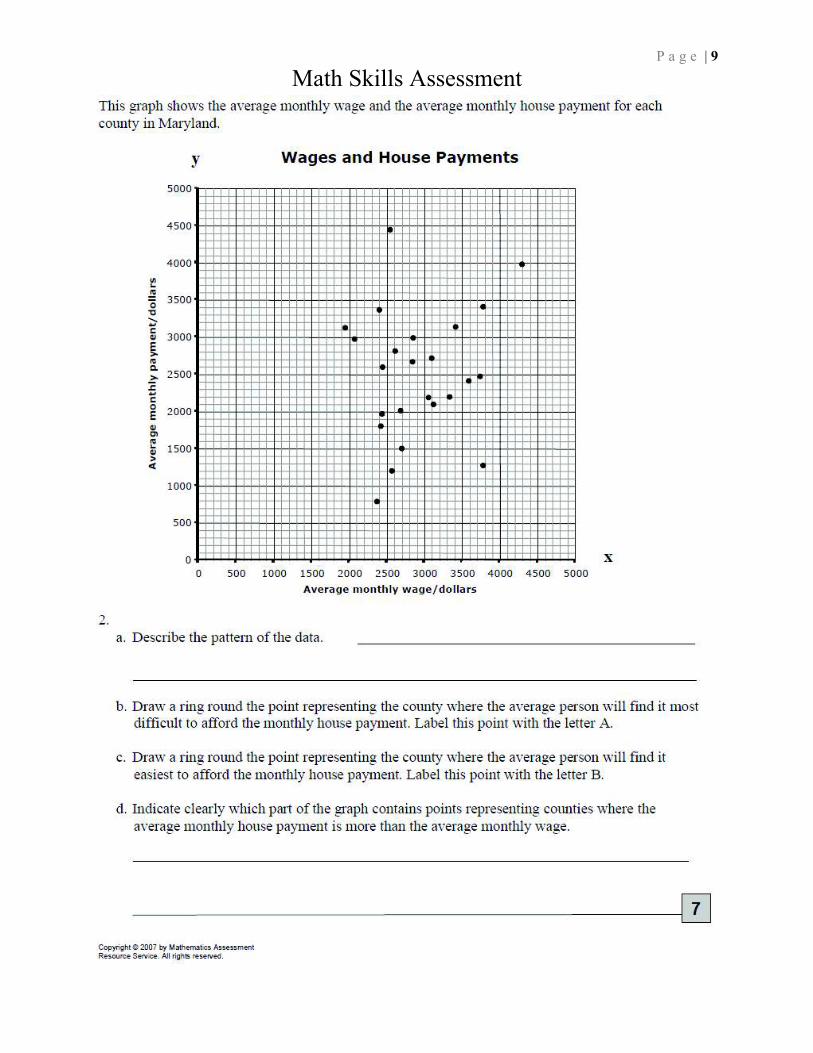
P a g e | 9
Math Skills Assessment

P a g e | 10
Math Skills Assessment

P a g e | 11
Math Skills Assessment

P a g e | 12
Math Skills Assessment

P a g e | 13
Math Skills Assessment
Each graph will match one equation, one table, and one rule. Matching parts won’t necessarily be next to
each other.
Graphs Equations Tables Rules