learning motion discrimination with suppressed and un-suppressed mt
TRANSCRIPT

www.elsevier.com/locate/visres
Vision Research 46 (2006) 2110–2121
Learning motion discrimination with suppressed and un-suppressed MT
Benjamin Thompson, Zili Liu *
Department of Psychology, University of California, Los Angeles, CA 90095, USA
Received 2 September 2005; received in revised form 15 November 2005
Abstract
Perceptual learning of motion direction discrimination is generally thought to rely on the middle temporal area of the brain (MT/V5).A recent study investigating learning of motion discrimination when MT was psychophysically suppressed found that learning was pos-sible with suppressed MT, but only when the task was sufficiently easy [Lu, H., Qian, N., Liu, Z. (2004). Learning motion discriminationwith suppressed MT. Vision Research 44, 1817–1825]. We investigated whether this effect was indeed due to MT suppression or whether itcould be explained by task difficulty alone. By comparing learning of motion discrimination when MT was suppressed vs. un-suppressed,at different task difficulties, we found that task difficulty alone could not explain the effects. At the highest difficulty, learning was notpossible with suppressed MT, confirming [Lu, H., Qian, N., Liu, Z. (2004). Learning motion discrimination with suppressed MT. Vision
Research 44, 1817–1825]. In comparison, learning was possible with un-suppressed MT at the same difficulty level. At the intermediatetask difficulty, there was a clear learning disadvantage when MT was suppressed. Only for the easiest level of difficulty, did learningbecome equally possible for both suppressed and un-suppressed conditions. These findings suggest that MT plays an important rolein learning to discriminate relatively fine differences in motion direction.� 2006 Elsevier Ltd. All rights reserved.
Keywords: Perceptual learning; MT/V5; Motion discrimination; Paired-dots; Suppression
1. Introduction
Practice can often improve performance on a visualperceptual task. This improvement is termed perceptuallearning (Epstein, 1967; Gibson, 1967). Understandingthe mechanisms of perceptual learning is importantbecause the characteristics of learning can reveal the nat-ure of underlying perceptual representations. Learningmechanisms can also provide insight into the neural plas-ticity and functional mechanisms within the visual system.So far, learning has been found in almost all visual per-ceptual tasks (Ball & Sekuler, 1982; Dosher & Lu, 1998;Fiorentini & Berardi, 1980; Gilbert, 1994; Karni & Sagi,1991; McKee & Westheimer, 1978; Ramachandran,1976; Vaina, Belliveau, Des Roziers, & Zeffiro, 1998;Watanabe, Nanez, & Sasaki, 2001) (see Fine & Jacobs(2002) & Fahle & Poggio (2002), for reviews). In this
0042-6989/$ - see front matter � 2006 Elsevier Ltd. All rights reserved.doi:10.1016/j.visres.2006.01.005
* Corresponding author. Fax: +1 310 206 5895.E-mail address: [email protected] (Z. Liu).
context, a recent finding reported by Lu, Qian, and Liu(2004) is an exception in that, although task performancewas well above chance, no learning was possible even afterprolonged training at a motion discrimination task. Thisfinding was significant because it provided an importantnew constraint on the role of the brain’s middle temporalarea (MT/V5) in motion perceptual learning.
MT was first implicated as a potential locus of motionperceptual learning by Ball and Sekuler (1982, 1987). Inthis classic study, participants were shown two sequentialrandom-dot motion stimuli whose directions were eitherthe same or differed by 3�. Over training, participantslearnt to better discriminate between trials of the samevs. different directions. This improvement was directionspecific, i.e., learning could not transfer to non-traineddirections that were more than 90� away from the traineddirections. Learning did, however, show a large amountof binocular transfer. Based on this pattern of specificityand transfer, Ball and Sekuler (1982, 1987) proposed thatthe learning may have taken place in MT, where neurons

B. Thompson, Z. Liu / Vision Research 46 (2006) 2110–2121 2111
are binocular and tuned to motion direction (Maunsell &Van Essen, 1983). Further evidence that motion discrimi-nation learning was due, at least in part, to changes inMT, rather than other potential candidate areas such asV1 was provided by Zohary, Celebrini, Britten, and New-some (1994), who showed that behavioral improvementin motion direction discrimination was accompanied byan increase in neuronal sensitivity at MT. Additional sup-port for the role of MT in motion direction discriminationand learning was provided by Rudolph and Pasternak(1999), who found that after lesion of MT and MST, finemotion discrimination was impaired even after intensivebehavioral training.
The approach of impairing MT to investigate its role inlearning to discriminate motion directions was also used byLu et al. (2004). However, rather than using a physicallesion, Lu et al. (2004) used a specially constructed stimulusto psychophysically suppress MT. Using this approach, Luet al. (2004) found that a difficult, fine motion discrimina-tion task could not be learnt when MT was functionallysuppressed, a result complementary to Rudolph and Pas-ternak’s findings (1999).
The stimulus adapted by Lu et al. (2004) to suppress MTwas originally designed by Qian, Andersen, and Adelson(1994) to take advantage of the direction selectivity andmotion opponency of MT neurons (Levinson & Sekuler,1975; Mather & Moulden, 1983). MT neurons are excitedby a preferred motion direction and inhibited by the oppo-site direction. To exploit this property of MT neurons,Qian et al. (1994) used a field of moving dots within whichthe dots were arranged into pairs. Within a pair, the twodots oscillated back and forth toward and away from eachother (counter-phase motion) within a limited range. Themotion trajectory will be referred to as motion axis orien-tation. By pairing the dots, a dot field can be created thatmaintains a locally balanced motion directional signal(zero on average). Fig. 1 depicts a group of counter-phasedot pairs.
To allow for psychophysical assessment of task perfor-mance, Lu et al. (2004) presented two of these dot fieldssequentially with a certain change in motion axis orienta-tion from the first stimulus to the second. Participantsreported whether this change was clockwise or counter-clockwise. Task difficulty was manipulated by controllingthe size of the orientational change (angular difference).
Fig. 1. A schematic and exaggerated example of the motion of a group ofcounter-phase paired-dots. The (horizontal) orientation along which thedots oscillate is called the motion axis orientation.
Lu et al. (2004) found that no learning was possiblewhen participants were trained to discriminate small angu-lar differences, even though performance was well abovechance (�75% correct). Learning was enabled only whenthe angular difference became sufficiently large, i.e., whenthe task was easier.
Lu et al. (2004) attributed the lack of learning found forsmaller angular differences to the fact that MT responseswere impaired by the local balancing of motion signals inthe stimulus. This conclusion was based on previous neuro-physiological findings from Qian and Andersen (1994) whodemonstrated that counter-phase paired-dots elicited, onaverage, no more activation in MT neurons than did flickernoise. This suggests that MT as a whole was ‘‘suppressed’’by the paired-dots stimulus and could not carry a usefulmotion directional signal. No such suppression wasobserved when dots were unpaired. The ability of paired-dots to suppress MT relative to unpaired-dots was furtherconfirmed by Heeger, Boynton, Demb, Seidemann, andNewsome (1999) using human functional magnetic reso-nance imaging (fMRI).
The result from Lu et al. (2004) showing that learning ofcounter-phase paired-dots could take place only for an easytask opens up a number of possible explanations. The firstis that MT was fully suppressed by the counter-phasepaired-dots and was therefore uninvolved in the perceptuallearning that took place. In this scenario, the learning thatoccurred when the orientational change of the motion axiswas sufficiently large has to be attributed to other brainareas such as V1. The second possibility is that when theorientational change of the motion axis was sufficientlylarge, MT was able to overcome its initial suppressionthrough repeated training and as a result, learning wasenabled. Whilst these two possibilities both assume sup-pression of MT by the counter-phase paired-dots, a thirdpossibility is that task difficulty alone dictated whetherlearning was possible. In other words, the lack of learningdemonstrated by Lu et al. (2004) could have been entirelydue to the difficulty of the task and therefore unrelatedto whether the dots were counter-phase or not. This thirdpossible explanation is addressed in this paper.
To address this possibility, we designed an experiment todirectly compare learning of counter-phase paired-dots(when MT was presumably suppressed) with learning whenMT was un-suppressed. To test learning when MT was un-suppressed, we changed the phase of within-pair dotmotion from 180� (counter-phase) to 0� (in-phase) whilstkeeping all other parameters the same. Therefore, withineach pair the dots now oscillated along the same trajectoryas before, but moved in the same direction a certain dis-tance apart. This manipulation resulted in a stimulus whichwould not suppress MT and which, we believe, allowed fora closer comparison with the counter-phase paired-dotsthan the unpaired-dots used by Qian and Andersen(1994) and Heeger et al. (1999). Learning for counter-phaseand in-phase dots was then directly compared at differenttask difficulties in a parametric manner. We found that,

2112 B. Thompson, Z. Liu / Vision Research 46 (2006) 2110–2121
for the hardest task, learning was not possible with count-er-phase paired-dots, confirming previous results from Luet al. (2004). In contrast, learning was possible for in-phasepaired-dots at the same task difficulty, though the learningwas not pronounced. When the task difficulty was interme-diate, the advantage of learning for in-phase over counter-phase paired-dots became apparent. Finally, only when thetask became easier still, did the difference in amount oflearning between the two conditions diminish. We conclud-ed that task difficulty was not the only determining factorin whether learning motion axis orientation discriminationwas possible. Counter-phase paired-dots were indeed moredifficult to learn, a finding that can be explained by MTbeing suppressed. To further characterize the learning thattook place we tested different potential decision criteria.We found that participants learnt to make motion axis ori-entation discriminations relative to an orientation thatbisected the two orientations they had been trained todiscriminate.
2. Methods
2.1. Stimuli
The same stimuli used by Lu et al. (2004) to suppress MT and modifiedfrom the original by Qian et al. (1994), were used in this study. Each stim-ulus display was made up of 50 ‘twin pairs’ of counter-phase (180�) dotsthat moved along a common motion axis (Fig. 2A). Each twin pair consist-ed of two identical pairs of dots positioned 0.06�–0.15� apart from eachother to form a parallelogram. This manipulation masked the Glass pat-tern (1969) otherwise present in the display, since dots could no longerbe consistently grouped over time along the global motion axis orientation.As in the original stimuli of Qian et al. (1994) the two dots making up eachpair moved across each other at a speed of 2�/sec. The minimum distancebetween the two dots in a pair was 0.06� and the maximum was 0.30�. Eachdot subtended 0.06�. Dots never overlapped so that the dot densityremained constant. The dots were dark (0.01 cd/m2) and presented on alight background (8.01 cd/m2) within a 7.8� circular aperture. Each twinpair had a lifetime of 120 ms. When one twin pair disappeared, a new twinpair appeared at a random location within the display aperture. The life-time and phase of twin pairs were randomly asynchronized using a flat dis-tribution of ±10% around the half lifetime and ±10% of half maximumdistance between two dots in a pair, respectively. To ensure that partici-pants viewed the whole display rather then just small subsets of dots, a cer-tain percentage of the twin pairs presented were noise pairs and accordinglyeach had a randomly oriented motion axis from trial to trial.
A B
Fig. 2. A schematic representation of the twin pairs making up the stimuliused in this experiment. (A) The two movement patterns that definedcounter-phase (180�) dots. (B) The two movement patterns that defined in-phase (0�) dots. In both (A) and (B) twin pairs have a 45� motion axisorientation. The full stimuli consisted of 50 twin pairs of dots (200 dots intotal).
For the un-suppressed MT condition, the stimuli were identical exceptthat the dots no longer moved counter-phase to one another, but movedin-phase (0�) (all dots in a twin pair moved in the same direction at timet, Fig. 2B). In-phase dots provided a motion signal able to activate MTwithout changing the overall motion statistics of the stimulus. We assumedthat task difficulty was unchanged when the dot phase was changed from180� to 0�. The motion directions presented remained globally balancedsince at any time half of the signal twin pairs on average moved in onedirection along the global motion axis and the other half moved in theopposite direction. The local balancing, however, was removed.
We employed a 2AFC (two alternative forced choice) design wherebyeach trial was made up of two sequential presentations of the stimulus.From the first presentation to the second the motion axis orientationwould rotate either clockwise or counter-clockwise by a certain angle.The task was to discriminate whether the motion axis rotation was clock-wise or counter-clockwise. The size of the angular difference of this rota-tion was manipulated to make the discrimination easy or hard. Duringtraining, feedback was provided per trial with a beep indicating an incor-rect response. Fig. 3 shows the sequence of a single trial. A fixation crosswas presented for 500 ms. The first stimulus was then presented for200 ms, a duration short enough to prevent eye movements. After a500 ms inter-stimulus-interval (ISI), included to prevent any apparentmotion cues to the motion axis rotation, the second stimulus was present-ed for 200 ms and was then replaced by a fixation cross until the partici-pant responded. When the stimuli were presented and during the ISI,the fixation cross became a red disk to avoid any extraneous orientationcues.
3. Experiment 1 (pilot study)
Lu et al. (2004) found that when trained on a counter-phase stimulus with high difficulty (the angular differencegave rise to 60% correct performance pre-training), noneof the three participants were able to improve at the task,even after 15 daily training sessions of 400 trials per sessionwith trial-wise feedback. This lack of learning was not dueto an inability to perform the task, since all participantsperformed well above chance (d 0 � 1). Presumably thiseffect was due to MT being suppressed by the counter-phase paired-dots.
We brought back two of the three participants (one ofwhom, ZL, was co-author of this paper), switched thephase difference from 180� to 0�, and kept all other param-eters the same. Fig. 4 shows the two participants’ perfor-mance over seven and nine daily sessions, respectively.For comparison, Fig. 4 also shows the same participants’performance with the counter-phase stimulus from Luet al. (2004). Apparently, when the stimulus was switchedto 0�, not only was learning enabled, but performancewas also immediately elevated. This indicated that the 0�stimulus was indeed easier to learn than its 180�counterpart.
Caution should be taken, however, when drawing con-clusions from this result since both participants hadalready been trained for 15 daily sessions before the180� dots were changed to 0�. Although learning wasnot manifested over these 15 days, it is not possible torule out that this training influenced subsequent perfor-mance for the in-phase stimulus. A fully controlled exper-iment using a between-participants design was thereforeconducted.

Fig. 3. A schematic of a single trial. The participant reported whether the motion axis orientation changed clockwise or counter-clockwise from the firststimulus presentation to the second. This figure depicts a counter-clockwise trial about a bisecting orientation of 45�.
ZL
65
75
85
1 5 10 15 20
Training Session
Per
cen
t C
orr
ect
Counter phaseIn phase
HL
65
75
85
1 5 10 15 20
Training Session
Fig. 4. Learning performance for participants ZL and HL in motion axis orientation discrimination of 5� angular difference. The participants were firsttrained with counter-phase (180�) dots for 15 sessions [data from Lu et al. (2004)], with no learning. They were then trained with in-phase (0�) dots (sevenand nine training sessions, respectively), with all other parameters kept the same. Learning became possible.
1 For two participants in the hard condition, 65% correct performancecould not be achieved by only manipulating angular difference, due tomonitor resolution and viewing distance restrictions. The noise density ofthe stimulus was thus increased from 20% to 40%. Psychometric functionswere then re-measured to ascertain the correct angular difference to elicit65% correct performance. This procedure assured that task difficultyremained constant within this group.
B. Thompson, Z. Liu / Vision Research 46 (2006) 2110–2121 2113
4. Experiment 2
4.1. Procedure
This experiment was made up of four components: prac-tice, psychometric curve measurements, training, and afinal series of psychometric curve measurements.
4.1.1. Practice and pre-training psychometric curve
measurement
Participants were introduced to the stimulus and thetask. For the practice and psychometric curve measure-ment sessions, only 180� dots were used. This ensured that,if the 180� condition were to give rise to worse performancethan the 0� condition, this could not be due to less familiar-ity and practice with the 180� dots. Participants practicedthe task with an angular difference of 30�, with trial-wisefeedback, until 95% correct performance was achieved.Practice sessions were conducted at an bisecting motionaxis orientation of either 45� or 135�. As an example, 45�was the bisecting orientation between the two possiblemotion axis orientations in a practice trial: 30� and 60�.For each individual participant the motion axis orientationused for practice was also used for all subsequent pre-train-
ing psychometric curve measurements and then rotated by90� for training. Therefore, a participant with a practiceorientation of 45� would complete the psychometric curvemeasurements with this 45� orientation, and then completethe training at 135�.
After practice, psychometric curves were measured foreach participant. Performance was assessed at five angulardifferences: 4�, 8�, 14�, 20�, and 30�. These angular differ-ences were presented in a blocked design without feedback.There were 40 trials per block and each block was present-ed twice. Block order was randomized for the first presen-tation and counter balanced for the second in an ABCDEEDCBA manner. Measurements were made with 20% ofthe twin pairs presented as noise.1 Each participant com-pleted at least two psychometric curve measurements.Angular difference thresholds for 65%, 70%, and 75%

2114 B. Thompson, Z. Liu / Vision Research 46 (2006) 2110–2121
correct were acquired by fitting a Weibul function to thefinal curve measurement.
4.1.2. Training
Participants were paired based on their psychometriccurve performance. One member of each pair was random-ly chosen to be trained on 180� dots whilst the other wastrained on 0� dots. Training consisted of 15 daily sessionsof 400 trials with trial-wise feedback. The method of con-stant stimuli was used. Two pairs of participants wereassigned to hard, medium, and easy difficulty conditions,respectively. Task difficulty was equated within a difficultygroup by using for training the angular difference that gaverise to 65% correct (hard), 70% (medium), or 75% (easy)2
for each individual participant.
4.1.3. Post-training psychometric curve measurements
After training, a series of psychometric measurementswere made to better characterize the learning, if any, thathad taken place. The following three measurements weretaken for each participant (in this order):
(1) A Psychometric function was again measured alongthe orientation 90� away from the trained orientationto test for transfer of leaning. This measurement wasthe same as the pre-training measurements. For thismeasurement motion axis orientation was kept con-stant and angular difference was varied.
(2) Psychometric functions were measured along thetrained bisecting motion axis orientation. Motionaxis orientation was kept constant and angular differ-ence was varied. Two types of psychometric functionwere measured, one using a blocked presentation ofangular differences and the other using a randomlyinterleaved presentation. All measurements weremade using the participant’s trained dot phase.
The five angular differences used for these measurementswere customized for each participant so as to include theirtrained angular difference. The two measurements, blocked(B) and interleaved (I), were repeated over two daily ses-sions. In each session, two sets of blocked measurementsand two sets of interleaved measurements were taken ineither the order BIIB or IBBI. If the order BIIB was takenfirst, for instance, the order for the next day’s session wouldbe counter balanced as IBBI. The order of the sequencewas also counter balanced between participants. Each setof blocked measurements consisted of 10 blocks with 10 tri-als each. The order of the first five blocks was randomizedand was counter balanced by the last five blocks. Inter-leaved measurements used the same trials as in the blockedmeasurements except that the order of the trials wasrandomized.
2 One pair of participants was initially assigned to a threshold of 60%correct. However, after six training sessions, they were not able to learn.This pair was then assigned to the threshold of 75% correct (see Fig. 5).
(3) A psychometric function was measured by keepingangular difference constant at the same value usedduring training and varying bisecting motion axis ori-entation. All measurements were made using the par-ticipant’s trained dot phase.
Six bisecting motion axis orientations were used for thismeasurement, including the 45� and 135� orientations, oneof which was the trained orientation. The other four bisect-ing orientations were chosen under the condition that themotion axis of an actual stimulus must be at least 15� awayfrom any cardinal orientations (0�, 90�, and 180�). Forexample, a participant trained with an angular differenceof 10� would have stimuli of (15�, 25�), (40�, 50�), (65�,75�), (105�, 115�), (130�, 140�), and (155�, 165�). This tech-nique provided six bisecting motion axis orientations asdispersed as possible whilst avoiding close proximity toany cardinal axis. Trials were presented in a randomlyinterleaved manner, with 80 trials for each of the six bisect-ing orientations.
4.2. Apparatus
Participants binocularly viewed the stimuli from a dis-tance of 120 cm (maintained by a chin rest) in a dark room.A viewing tube running from the chin rest to the monitorwas used to exclude any extraneous orientation referencecues. Stimuli were presented on an NEC MultiSyncFE771SB monitor with a vertical refresh rate of 60 Hzand a resolution of 800 · 600 pixels. Stimuli were generatedand presented using MatLab (MathWorks, Inc.) with thepsychophysics toolbox (Brainard, 1997; Pelli, 1997).
4.3. Participants
Twelve University of California Los Angeles (UCLA)undergraduate students, unaware of the purpose of theexperiment, participated. Table 1 in Appendix A showsthe details of the parameters used for each participant.
4.4. Results and discussion
4.4.1. Learning with MT suppressed vs. un-suppressed
The presence or absence of learning was contingent onboth task difficulty and the dot phase. Fig. 5 shows thelearning curves for each pair of participants. A linearregression was performed on each participant’s data.Table 1 in the Appendix A shows the linear regressionresults. For the four participants trained on the hardesttask, only the learning curves of the two in-phase (0�) par-ticipants showed slopes significantly greater than zero.Learning slopes for the medium and easiest tasks wereall significantly above zero (except for participant VRwho was trained on counter-phase paired-dots in the eas-iest condition).
The influence of 0� vs. 180� phase difference can be clear-ly seen in Fig. 5. For the hardest task (starting threshold at

405060708090
100 MK (7˚, 40% noise)
TW (16˚, 40% noise)
SY (8˚, 20% noise)MN (5˚, 20% noise)
405060708090
100 AE (18˚,20% noise)
TM (17.5˚, 20% noise)
AM (17.5˚, 20% noise)
LD (17˚,20% noise)
405060708090
100
1 5 10 15Session
% C
orr
ect
% C
orr
ect
% C
orr
ect
ES (4.5˚, 20% noise)
BH (17˚, 20% noise)
1 5 10 15Session
VW (14˚, 20% noise)VR (17˚, 20% noise)
In-phase dot training (MT un-suppressed)
Counter-phase dot training (MT suppressed)
Fig. 5. Percent correct as a function of training session for each pair of participants. The horizontal dashed lines at 50% correct show chance performance.In the hard condition (top row),1 only the ‘‘in-phase’’ participants could learn, but learning was modest; the ‘‘counter-phase’’ participants could not learn,confirming Lu et al. (2004). In the medium condition (middle row), ‘‘in-phase’’ participants showed a clear advantage in learning over ‘‘counter-phase’’participants. Only in the easy condition (bottom row), did the difference between ‘‘in-phase’’ and ‘‘counter-phase’’ diminish. [VW and VR (bottom right)were trained at an angular difference corresponding to 60% for the first six sessions (shown left of the vertical dotted line). After the participants werediscouraged due to low accuracy (53.21% and 58.54% correct, respectively) and little learning, they were then trained at 75% for the remaining sessions(shown right of the vertical dotted line)].
3 Due to MN’s low accuracy (52.55%), it is reasonable to be cautiousand regard the performance as being at chance. In this regard, MN’sperformance did not confirm results in Lu et al. (2004) where performancewas well above chance (�75% correct) even without learning. The exactcause of this discrepancy is unclear, we list the following possibilities. (1)In Lu et al. (2004), the threshold was at 60% correct; here the thresholdwas at 65% correct. (2) In Lu et al. (2004), the psychometric function wasmeasured in a randomly interleaved manner to obtain the threshold; hereit was blocked and counter balanced. (3) In Lu et al. (2004), theparticipants were experienced; here they were inexperienced. (4) In Luet al. (2004), after the psychometric measurement and before training,orientation discrimination with lines was measured along the trainingorientation; here no such measurement was made.
B. Thompson, Z. Liu / Vision Research 46 (2006) 2110–2121 2115
65% correct), only participants trained with in-phase dotsshowed statistically significant positive slopes. Learningwith counter-phase dots was not possible at this difficultylevel, confirming results in Lu et al. (2004). Specifically,for Pair 1 (top left in Fig. 5),2 only the in-phase participant(MK) showed a positive slope that was statistically signifi-cant, and slightly greater than the counter-phase slope. Acloser inspection showed that the in-phase participantMK dropped performance on the first training session,possibly biasing the slope of the learning curve. We there-fore, removed the first datum point of MK and recalculat-ed the slope. The learning slope was still significantlygreater than zero (F (1, 12) = 4.27, p = 0.03, one tailed).For Pair 2 (top right in Fig. 5), the in-phase participantSY showed learning, whereas the counter-phase participantMN showed flat performance. MN dropped to 54% correctperformance on the first session of training even thoughMN’s psychometric measurements showed that this angu-lar difference elicited 65% correct performance at the orien-
tation 90� away. MN’s performance did not improve above55.5% correct for the entire training period.3
For the medium difficulty task (Pairs 3 and 4, startingthreshold at 70% correct, middle row, Fig. 5), the in-phaseparticipants showed a clear advantage in both the learningrate and amount of learning.

2116 B. Thompson, Z. Liu / Vision Research 46 (2006) 2110–2121
Finally, for the easy task (Pairs 5 and 6, starting thresh-old at 75% correct, bottom row Fig. 5), it can be seen thatwhilst performance improved, there was little difference inthe rate and amount of learning between in-phase andcounter-phase conditions.
We conducted a further analysis designed to provide amore stringent comparison between 180� and 0� learningso that the initial drop in performance during trainingwould not in itself disadvantage the 180� condition (giventhat more 180� participants dropped in initial performancerelative to 0� participants). Performance on the final ses-sion of training was used to assess the difference in theamount of learning between participants trained on 0�phase and those trained on 180� phase. A Wilcoxon testshowed that participants trained on the 0� stimuli hadhigher final accuracies than those trained on 180� stimuli(Z (6) = �1.782, p = 0.038, one tailed).
4.4.2. Characterization of the learning
A series of post-training measurements were made sothat the learning, when it occurred, could be better under-stood. These measurements addressed the following issues:(1) transfer of learning to an untrained orientation, (2)changes in response bias associated with learning, and (3)characterization of the decision criterion underlying anyimproved performance.
4.4.2.1. Orientation specificity. To investigate the issue oftransfer,4 we directly tested whether learning transferredback to the old orientation that was 90� away from thetrained orientation. We compared psychometric functionsfor the untrained orientation pre and post-training(Fig. 6). A two-way, repeated measures ANOVA yieldedthe expected significant main effect of angular difference(F (4, 44) = 33.21, p < 0.001), but showed no significantmain effect of training (pre vs. post) (F (1,11) = 0.19 < 1)and no significant interaction (F (4,44) = 0.51 < 1). There-fore no transfer occurred.
4.4.2.2. Response bias b. It has been argued that perceptuallearning can be accounted for by changes in response biasrather than in perceptual sensitivity (Rasche & Wenger,2004). To address this question, the response bias b was cal-culated for each participant for each training session. A one-
4 In the first sessions of training, several participants showed a drop inperformance (Wilcoxon test, Z (12) = �2.353, p = 0.019) relative to theirrespective thresholds (65%, 70%, and 75% correct) that were establishedduring the pre-training psychometric curve measurements along theorientation 90� away from the training orientation. This statisticallysignificant drop indicated that the practice and two psychometricmeasurements induced learning that was orientation specific. No reliabledifference was found between the two groups of participants (0� and 180�phase-difference) however. This drop in performance was no longerevident after the second training session (Wilcoxon test Z (12) = �1.38,p = 0.19). Performance on the first training session therefore demonstratedthat practice and pre-training psychometric measurements were orienta-tion specific and did not transfer to the training orientation.
way repeated measure ANOVA showed no significant maineffect of training session (F (14,112) = 1.18, p = 0.34). Thisanalysis was further repeated with data only from partici-pants who learnt. Once again there was no significant maineffect of training session, (F (14,84) = 0.99 < 1), showingthat there were no systematic changes in response bias thatcould account for participants’ learning.
4.4.2.3. Testing for a decision criterion. Given that responsebias could not account for the learning, it is reasonable toassume that the participants who did learn were makingincreasingly accurate orientation discriminations relativeto a fixed decision criterion. For this task one reliable cri-terion was the orientation (45� or 135�) that bisected thetwo possible motion axis orientations presented during atrial. A previous study has shown that in a contrast dis-crimination task, if trials with different decision criteria(different pedestal contrasts) were randomly interleaved,then performance was worse than when trials were present-ed in blocks with a fixed criterion (single pedestal) (Adini,Wilkonsky, Haspel, Tsodyks, & Sagi, 2004). In otherwords, varying the decision criterion of a task in an unpre-dictable manner by interleaving trials impairs trained per-formance. We extrapolated this use of stimulusuncertainty (random interleaving) as a probe to identifythe decision criterion in our task. If the decision criterionwas indeed the bisecting orientation, then creating uncer-tainty by varying angular difference alone should not influ-ence task performance since the bisecting orientationremained unchanged from trial to trial. Conversely, ifuncertainty of bisecting orientation were to be introducedwhilst angular difference was kept at the same values asused during training, performance should diminish. Fur-thermore, if a different criterion, such as template matchingwas the underlying mechanism of the learning then a differ-ent pattern of results would be anticipated. If training hadallowed for the development of two specific templates (oneper stimulus) then both angular and motion axis uncertain-ty should impair task performance since changes in eitherof these variables away from the precise trained parameterswould invalidate the templates.
4.4.2.4. Angular difference uncertainty with constant bisect-
ing orientation. Psychometric curves were measured usingboth randomly interleaved (stimulus uncertainty) andblocked (baseline) designs along each participant’s trainedorientation using their trained dot phase (0� or 180�) (seeTable 2, Appendix A). A 2 · 5 · 3 · 2 ANOVA with mea-surement type (interleaved vs. blocked), angular difference,training difficulty (hard vs. medium vs. easy), and phase(180� vs. 0�) was performed on the accuracy data. Thisanalysis yielded a significant main effect of measurementtype (F (1,6) = 17.96, p = 0.005, blocked 78.15% vs. inter-leaved 80.04% correct), a significant main effect of angulardifference (F (4,24) = 97.58, p < 0.001), and a significantinteraction between measurement and angular difference(F (4,24) = 48.19, p = 0.039). No other main effects or

MK
30
50
70
90
Before Training
After Training
MN TW SY
AE
30
50
70
90 TM AM LD
ES
30
50
70
90
4 8 14 20 30Angle (degrees) Angle (degrees) Angle (degrees) Angle (degrees)
% C
orr
ect
% C
orr
ect
% C
orr
ect
BH
4 8 14 20 30
VR
4 8 14 20 30
VW
4 8 14 20 30
Fig. 6. Psychometric measurements of motion axis orientation discrimination for counter-phase dots before (empty symbols) and after (filled symbols)training. Orientations used for psychometric curve measurements were 90� away from training orientations.
B. Thompson, Z. Liu / Vision Research 46 (2006) 2110–2121 2117
interactions reached significance (p > 0.05). Therefore, per-formance was not impaired by generating stimulus uncer-tainty in the angular difference variable. In factperformance was slightly better for the interleaved, moreuncertain condition.
Fig. 7 shows that the main effect of measurement typeand the measurement type · angular difference interactionwas characterized by an increasing advantage for inter-leaved measurements with decreasing angular size. These
50
70
90
1 2 3 4 5
Angle Difference (rank order, smallest to largest)
% C
orr
ect
Blocked Trials
Randomly InterleavedTrials
Fig. 7. Accuracy scores across participants for the blocked and randomlyinterleaved psychometric curve measurements as a function of angulardifference. Motion axis orientation was kept constant. Angular differencesare shown in rank order from the smallest to the largest since the actualvalues used for each participant were tailored to include their trainedangles (see Appendix A). Error bars show standard error of the mean.
results suggested that interleaved presentation facilitatedtask performance, particularly for the smallest angle tested(Ahissar & Hochstein, 1997; Liu, 1995; Rubin, Nakayama,& Shapley, 1997). A series of post hoc pair-wise compari-sons between blocked and interleaved performance at eachangular size further confirmed this effect. For the smallestangle there was a significant difference between the inter-leaved (64.79% correct) and blocked (59.79%) conditions(t (11) = 3.43, p = 0.006, two tailed, corrected for multiplecomparisons). No other comparisons showed significantdifferences.
One possible explanation for the facilitation effectobserved within the interleaved condition is as follows.As the bisecting orientation was constant from trial to trial,a trial with a large angular size that preceded a trial of thesmallest angle may have provided a clearer signal of thebisecting orientation that could then aid performance forthe subsequent smallest angle trial. It is unclear, however,why only the smallest angle was benefited and not otherangles. It is also unclear which preceding trials were mostfacilitatory. We analyzed the trial sequence to identify theangular sizes that immediately preceded the smallest angletrials, but did not find a reliable difference in facilitationwhen the preceding trial had a larger angle as comparedto a smaller angle. Nor did we find a reliable advantagefor when the immediately preceding trial was correct ratherthan incorrect.
4.4.2.5. Motion axis orientation uncertainty, constant angu-
lar difference. Discrimination performance was measuredalong six bisecting orientations in a randomly interleavedmanner whilst angular difference and dot phase were keptconstant at the values used during training (see Section4.1.3 for details). Fig. 8 shows the results. To establish a

100
50
10
% C
orre
ct
90°
45°
0°
MK
0°
45°
90°
% C
orre
ct
100
50
10
TW
0°
45°
90°SY
135°
180°
AE
180°
135°
90°
45°
0°
MN
180°
135°
90°
45°
0°
TM
180°
135°
90°
45°
0°
AM
180°
135°
90°
45°
0°
ES
180°
135°
90°
45°
0°
LD
180°
135°
90°
45°
0°
VW
180°
135°
90°
45°
0°
BH
180°
135°
90°
45°
0°
VR
180°
135°
90°
45°
0°
100
50
10
% C
orre
ct
90°
45°
0°
MK
0°
45°
90°
% C
orre
ct
100
50
10
TW
0°
45°
90°SY
135°
180°
AE
180°
135°
90°
45°
0°
MN
180°
135°
90°
45°
0°
TM
180°
135°
90°
45°
0°
AM
180°
135°
90°
45°
0°
ES
180°
135°
90°
45°
0°
LD
180°
135°
90°
45°
0°
VW
180°
135°
90°
45°
0°
BH
180°
135°
90°
45°
0°
VR
180°
135°
90°
45°
0°
Interleaved OrientationsLinear Estimation of Final Performance
Fig. 8. Performance along each of the six interleaved motion axis orientations tested for each participant. The top row shows participants trained at the45� orientation ordered from hard to easy. The bottom row shows 135� trained participants. Filled circles show performance for each motion axisorientation tested. Unfilled circles show the last training session performance approximated by linear fitting.
2118 B. Thompson, Z. Liu / Vision Research 46 (2006) 2110–2121
baseline with which to assess the effect of motion orienta-tion uncertainty on trained performance, we compared per-formance along the trained orientation in the uncertaintycondition with performance at the end of training. Toachieve this we used linear fitting of each participant’s per-formance throughout training (Table 1, Appendix A) toapproximate their performance in the last training session.5
We found that, along the trained orientation, performancein the interleaved measurement was reliably lower thanthat approximated by the linear fitting at the end of train-ing (Wilcoxon test, Z (11) = 1.96, p = 0.05, two tailed).
The reduction in performance for the trained orientationwhen measured using the interleaved orientation techniquedid not, however, show a drop all the way back to pre-training levels. We measured the size of the drop by com-paring the interleaved measurement performance alongthe trained orientation with its mirror counterpart thatwas 90� away (45� vs. 135�). There was a significant differ-ence between the two (Wilcoxon test Z (11) = 2.94,p = 0.003, two tailed), showing that superior performancewas maintained along the trained orientation (74.42% vs.53.85% correct). We note that a psychometric functionwas measured along the mirror orientation both beforeand after training and that the mirror orientation wastherefore relatively well practiced. In this sense, our mea-sure of performance retention along the trained orientationwas conservative. We also note that performance along themirror orientation was well below chance for some partic-ipants (e.g., 12% correct for VR). Nevertheless, after weremoved the cases (three in total) of below-chance perfor-mance along the mirror orientation, the difference betweenthe trained orientation and its mirror counterpart was stillreliable (Z (8) = 2.32, p = 0.02, two tailed). This means that
5 Data from participant MN, who was trained with the hardest counter-phase condition and exhibited no learning, were excluded because thelinear slope of learning was negative, and because the average perfor-mance was at chance (52.55% correct). The other two participants who didnot show reliable learning were included because, even though they didnot learn, their performance was above chance, making it possible fortheir performance to drop in the interleaved measurement. Removing oneor both of them only increased the significance of the statistical Wilcoxontest.
the partial retention along the trained orientation, evenwith the randomly interleaved measurement, was robust.
An alternative measure of learning retention along thetrained orientation, independent of performance alongthe mirror orientation, was to compute the following reten-tion index r:
r ¼ pI � p0L
pL � p0L
;
where pI is interleaved performance along the trained orien-tation, p0
L is the first training session performance approxi-mated by linear fitting, and pL is the last training sessionperformance approximated by linear fitting,. To illustrate,if interleaving fully retained the training, retention = 100%.At the other extreme, if interleaving made it impossible toretain any learning, retention = 0%. We computed thismeasure across the 11 participants (excluding MN5), andobtained a mean of 61.92% ± 16.84%, the latter being thestandard error. This again indicated how robust the reten-tion of learning was for the interleaved measurement.
5. General discussion
Our experimental results demonstrate that at an equiva-lent task difficulty, motion direction discrimination wasmore difficult to learn for counter-phase (180�) paired-dotsthan for their in-phase (0�) counterparts. Furthermore, atthe hardest difficulty, learning was not possible for 180�phase dots whereas 0� phase dots allowed for a modestimprovement in performance. As task difficulty was careful-ly controlled, dot phase was isolated as the factor influenc-ing learning. Given the previous evidence that 180� phasedots suppressed average MT activity whereas unpaired-dotsdid not, combined with the nature of our task that forcedthe observer to rely solely on motion signals to providethe motion axis orientation from trial to trial, we concludethat psychophysically impairing MT function impacteddirectly on the ability to learn fine motion axis orientationdiscrimination. It is important to note that our assertionof equal task difficulty for both 180� and 0� phase condi-tions was based on the assumption that the ‘‘signal’’ in eachstimulus was the estimated angular difference derived from

B. Thompson, Z. Liu / Vision Research 46 (2006) 2110–2121 2119
the trajectories of the dots; and that the ‘noise’ was theuncertainty associated with this estimation, plus the contri-bution from the noise dot pairs whose motion axes wererandomized. Therefore, we assumed that the orientationestimation of a dot’s trajectory determined the signal-noisenature of the stimulus and hence the task difficulty, regard-less of the phase difference of the dot pairs.
Although our results demonstrate that suppressing MTfunction has a detrimental effect on the perceptual learningof motion discrimination, we cannot ascertain whether,when 180� phase paired-dots were viewed, MT was com-pletely suppressed to the extent that it could not providea useful motion directional signal or whether a subset ofMT neurons still functioned to allow discrimination whenthe angular size was small, and to enable learning whenthe angular size was relatively large.
Evidence for the above possibilities can be found in theoriginal recordings of MT neurons made by Qian andAndersen (1994). Although on average the response ofMT neurons to 180� paired-dots was less than the responseto unpaired-dots and about the same as the response toflicker noise, there were neurons that did respond to the180� phase paired-dots, in some cases more than tounpaired-dots. Therefore, it is possible that it was this pop-ulation of MT neurons that allowed perceptual learning totake place for the easier condition here and in Lu et al.(2004). Indeed, the idea that motion discrimination(though not necessarily learning) is carried out by a subsetof MT neurons, but not by the whole population, is sug-gested by a recent study by Purushothaman and Bradley(2005). These authors investigated how the responses ofMT neurons were related to behavioral performance in amotion direction discrimination task. They found thatmonkeys’ behavioral decisions were significantly correlatedwith the activity of those neurons showing the highest-pre-cision for direction discrimination. Furthermore, the neu-ral performance of the highest-precision MT neuronsmatched the monkeys’ behavioral performance, whereasthe correlation between behavior and the entire active pop-ulation of neurons was poor (see also Salzman, Britten, &Newsome (1990)). Consequently, if a subset of the highest-precision neurons preferentially respond to 180� phasepaired-dots, then these neurons could potentially allowfor learning to take place. The fact that learning wasenabled with larger angular differences here and in Luet al. (2004) is consistent with this hypothesis, as anenlarged angular difference may have allowed more MTneurons to contribute to the discrimination.
However, even if a subset of MT neurons were respond-ing to the 180� phase dots, this active population did notallow for the same amount of learning as the pool of MTneurons that presumably responded to the 0� phase dots.Consequently, we can assume that this subset providedimpoverished information. Therefore, even if 180� phasemotion did not completely suppress the response of MTneurons to our stimulus we can say that, at the very least,using the 180� phase paired-dots either reduced the effective
number of the neurons responding to the stimulus or madethe neurons less effective.
Assuming MT was suppressed by 180� phase paired-dots, we acknowledge the following. When task difficultywas sufficiently easy, our behavioral results of learning can-not distinguish whether MT remained suppressed in thecourse of learning, or became un-suppressed as a resultof as the reason for the learning. We are exploring brainimaging techniques to tease apart these two possibilities.
In addition to the effect of MT suppression on learning,we were also interested in characterizing the nature of thelearning that took place during training. One possibilitywas that participants had learnt to discriminate about a fixedcriterion, namely the bisecting orientation (45� or 135�)between the two motion axis orientations within a trial.Another alternative was that learning had taken a differentform such as the development of templates for the two pre-sented orientations. Adini et al. (2004) found that in a con-trast discrimination task, if performance of the trained taskwas measured when trials of different decision criteria wererandomly interleaved, performance on the trained task wasreduced. Using this same approach, we measured trainedtask performance under conditions when the angular differ-ence was uncertain from trial to trial whilst the bisecting ori-entation remained constant, and also when the bisectingorientation was uncertain from trial to trial whilst angulardifference remained constant. Relative to baseline trainedperformance, angular difference uncertainty did not decreasetrained task performance whereas bisecting motion axisuncertainty did. This suggests that bisecting motion axis ori-entation was the decision criterion used by the participants.These results also rule out a template matching explanationfor the task performance as both bisecting motion axisuncertainty and angular difference uncertainty would per-turb the stimuli sufficiently away from the exact trainedparameters to render any learnt templates invalid.
An additional finding was that interleaving trials of thesame bisecting motion axis orientation but varying angulardifference actually improved performance for the hardesttrials (smallest angular difference between motion axis ori-entations) relative to blocked measurements. Our analysisrevealed that this effect was due to easier trials aiding per-formance on harder trials, an effect supported by previousstudies (Ahissar & Hochstein, 1997; Liu, 1995; Rubin et al.,1997). It would appear therefore, that when trials with thesame decision criterion but with varying difficulties wereinterleaved, easier trials may facilitate performance onharder trials.
Acknowledgment
We thank Hongjing Lu for her technical advice and hercomputer codes that this research was based on.
Appendix A
See Tables 1 and 2.
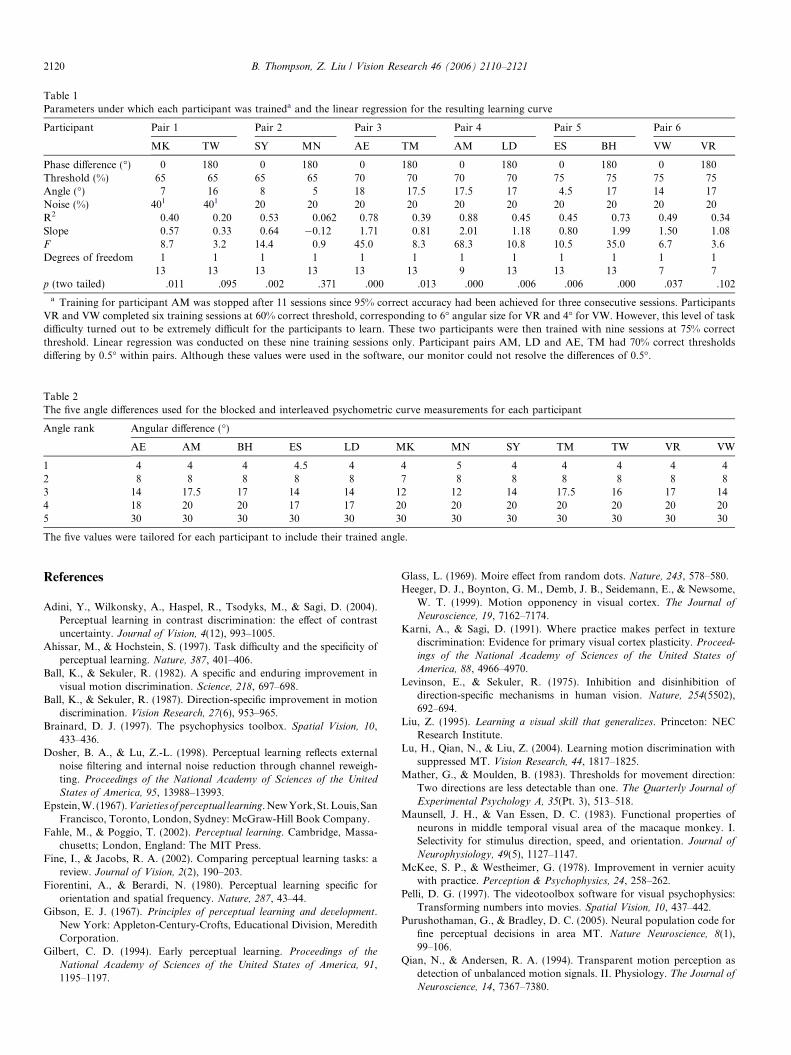
Table 1Parameters under which each participant was traineda and the linear regression for the resulting learning curve
Participant Pair 1 Pair 2 Pair 3 Pair 4 Pair 5 Pair 6
MK TW SY MN AE TM AM LD ES BH VW VR
Phase difference (�) 0 180 0 180 0 180 0 180 0 180 0 180Threshold (%) 65 65 65 65 70 70 70 70 75 75 75 75Angle (�) 7 16 8 5 18 17.5 17.5 17 4.5 17 14 17Noise (%) 401 401 20 20 20 20 20 20 20 20 20 20R2 0.40 0.20 0.53 0.062 0.78 0.39 0.88 0.45 0.45 0.73 0.49 0.34Slope 0.57 0.33 0.64 �0.12 1.71 0.81 2.01 1.18 0.80 1.99 1.50 1.08F 8.7 3.2 14.4 0.9 45.0 8.3 68.3 10.8 10.5 35.0 6.7 3.6Degrees of freedom 1 1 1 1 1 1 1 1 1 1 1 1
13 13 13 13 13 13 9 13 13 13 7 7p (two tailed) .011 .095 .002 .371 .000 .013 .000 .006 .006 .000 .037 .102
a Training for participant AM was stopped after 11 sessions since 95% correct accuracy had been achieved for three consecutive sessions. ParticipantsVR and VW completed six training sessions at 60% correct threshold, corresponding to 6� angular size for VR and 4� for VW. However, this level of taskdifficulty turned out to be extremely difficult for the participants to learn. These two participants were then trained with nine sessions at 75% correctthreshold. Linear regression was conducted on these nine training sessions only. Participant pairs AM, LD and AE, TM had 70% correct thresholdsdiffering by 0.5� within pairs. Although these values were used in the software, our monitor could not resolve the differences of 0.5�.
Table 2The five angle differences used for the blocked and interleaved psychometric curve measurements for each participant
Angle rank Angular difference (�)
AE AM BH ES LD MK MN SY TM TW VR VW
1 4 4 4 4.5 4 4 5 4 4 4 4 42 8 8 8 8 8 7 8 8 8 8 8 83 14 17.5 17 14 14 12 12 14 17.5 16 17 144 18 20 20 17 17 20 20 20 20 20 20 205 30 30 30 30 30 30 30 30 30 30 30 30
The five values were tailored for each participant to include their trained angle.
2120 B. Thompson, Z. Liu / Vision Research 46 (2006) 2110–2121
References
Adini, Y., Wilkonsky, A., Haspel, R., Tsodyks, M., & Sagi, D. (2004).Perceptual learning in contrast discrimination: the effect of contrastuncertainty. Journal of Vision, 4(12), 993–1005.
Ahissar, M., & Hochstein, S. (1997). Task difficulty and the specificity ofperceptual learning. Nature, 387, 401–406.
Ball, K., & Sekuler, R. (1982). A specific and enduring improvement invisual motion discrimination. Science, 218, 697–698.
Ball, K., & Sekuler, R. (1987). Direction-specific improvement in motiondiscrimination. Vision Research, 27(6), 953–965.
Brainard, D. J. (1997). The psychophysics toolbox. Spatial Vision, 10,433–436.
Dosher, B. A., & Lu, Z.-L. (1998). Perceptual learning reflects externalnoise filtering and internal noise reduction through channel reweigh-ting. Proceedings of the National Academy of Sciences of the United
States of America, 95, 13988–13993.Epstein, W. (1967).Varietiesof perceptual learning. New York,St. Louis,San
Francisco, Toronto, London, Sydney: McGraw-Hill Book Company.Fahle, M., & Poggio, T. (2002). Perceptual learning. Cambridge, Massa-
chusetts; London, England: The MIT Press.Fine, I., & Jacobs, R. A. (2002). Comparing perceptual learning tasks: a
review. Journal of Vision, 2(2), 190–203.Fiorentini, A., & Berardi, N. (1980). Perceptual learning specific for
orientation and spatial frequency. Nature, 287, 43–44.Gibson, E. J. (1967). Principles of perceptual learning and development.
New York: Appleton-Century-Crofts, Educational Division, MeredithCorporation.
Gilbert, C. D. (1994). Early perceptual learning. Proceedings of the
National Academy of Sciences of the United States of America, 91,1195–1197.
Glass, L. (1969). Moire effect from random dots. Nature, 243, 578–580.Heeger, D. J., Boynton, G. M., Demb, J. B., Seidemann, E., & Newsome,
W. T. (1999). Motion opponency in visual cortex. The Journal of
Neuroscience, 19, 7162–7174.Karni, A., & Sagi, D. (1991). Where practice makes perfect in texture
discrimination: Evidence for primary visual cortex plasticity. Proceed-
ings of the National Academy of Sciences of the United States of
America, 88, 4966–4970.Levinson, E., & Sekuler, R. (1975). Inhibition and disinhibition of
direction-specific mechanisms in human vision. Nature, 254(5502),692–694.
Liu, Z. (1995). Learning a visual skill that generalizes. Princeton: NECResearch Institute.
Lu, H., Qian, N., & Liu, Z. (2004). Learning motion discrimination withsuppressed MT. Vision Research, 44, 1817–1825.
Mather, G., & Moulden, B. (1983). Thresholds for movement direction:Two directions are less detectable than one. The Quarterly Journal of
Experimental Psychology A, 35(Pt. 3), 513–518.Maunsell, J. H., & Van Essen, D. C. (1983). Functional properties of
neurons in middle temporal visual area of the macaque monkey. I.Selectivity for stimulus direction, speed, and orientation. Journal of
Neurophysiology, 49(5), 1127–1147.McKee, S. P., & Westheimer, G. (1978). Improvement in vernier acuity
with practice. Perception & Psychophysics, 24, 258–262.Pelli, D. G. (1997). The videotoolbox software for visual psychophysics:
Transforming numbers into movies. Spatial Vision, 10, 437–442.Purushothaman, G., & Bradley, D. C. (2005). Neural population code for
fine perceptual decisions in area MT. Nature Neuroscience, 8(1),99–106.
Qian, N., & Andersen, R. A. (1994). Transparent motion perception asdetection of unbalanced motion signals. II. Physiology. The Journal of
Neuroscience, 14, 7367–7380.

B. Thompson, Z. Liu / Vision Research 46 (2006) 2110–2121 2121
Qian, N., Andersen, R. A., & Adelson, E. H. (1994). Transparent motionperception as detection of unbalanced motion signals. I. Psychophys-ics.. The Journal of Neuroscience, 14(2), 7357–7366.
Ramachandran, V. S. (1976). Learning-like phenomena in stereopsis.Nature, 262, 382–384.
Rasche, C., & Wenger, M. J. (2004). Changes in decisional criteria and biasduring perceptual learning. Journal of Vision, 4(8), 307a [Abstract].
Rubin, N., Nakayama, K., & Shapley, R. (1997). Abrupt learning andretinal size specificity in illusory-contour perception. Current Biology, 7,461–467.
Rudolph, K. K., & Pasternak, T. (1999). Transient and permanent deficitsin motion perception after lesions of cortical areas MT and MST in themacaque monkey. Cerebral Cortex, 9, 90–100.
Salzman, C. D., Britten, K. H., & Newsome, W. T. (1990). Corticalmicrostimulation influences perceptual judgments of motion direction.Nature, 346(6280), 174–177.
Vaina, L. M., Belliveau, J. W., Des Roziers, E. B., & Zeffiro,T. A. (1998). Neural systems underlying learning and repre-sentation of global motion. Proceedings of the National
Academy of Sciences of the United States of America, 95,12657–12662.
Watanabe, T., Nanez, J. E., & Sasaki, Y. (2001). Perceptual learningwithout perception. Nature, 413, 844–848.
Zohary, E., Celebrini, S., Britten, K. H., & Newsome, W. T. (1994).Neuronal plasticity that underlies improvement in perceptual perfor-mance. Science, 1289–1292.