learning gis with game of thrones gvsig...
TRANSCRIPT

LEARNING GIS WITH GAME OFTHRONES
GVSIG DESKTOP

Learning GIS with Game of Thrones
www.gvSIG.com
Menéndez y Pelayo 5, bajo 3
460010 Valencia, Spain
e-mail: [email protected]
Distribution List:
There are different distribution list in order to facilitate communication with all thepeople who are interested in gvSIG project, both users and developers
http://www.gvSIG.com/en/community/mailing-lists
All proper names of software, operating systems, hardware equipment, etc., of thiscourse are trademarks of their respective companies or organizations.
This document is distributed under license Attribution-ShareAlike 3.0 Unported (CC BY-SA 3.0)
Game of Thrones is an American fantasy drama television series created by David Benioff and D. B. Weiss. It is an adaptation of A Song of Ice and Fire, George R. R. Martin's series of fantasy novels, the first of which is A Game of Thrones.
Source: Wikipedia
© 2017 gvSIG Page 2 of 62

Learning GIS with Game of Thrones
Index
1. INTRODUCTION....................................................................4
1.1. Objective and needed material............................................................4
2. INSTALLATION......................................................................5
2.1. Adding data to a project.......................................................................5
2.2. Attribute table......................................................................................7
2.3. Navigation tools...................................................................................9
2.4. Selecting tools.....................................................................................13
2.5. Editing tables.......................................................................................17
2.6. Hyperlink and other information tools..................................................21
2.7. Adding coordinates to a Table..............................................................26
2.8. Field calculator.....................................................................................27
2.9. Exporting View to image......................................................................32
2.10. Legends.............................................................................................33
2.11. Labelling............................................................................................36
2.12. Graphic editing tools..........................................................................42
2.13. Geoprocessing...................................................................................47
2.14. Layouts..............................................................................................52
2.15. Add-ons installing..............................................................................57
3. EXTRA...............................................................................61
3.1. For users…...........................................................................................61
3.2. For developers…..................................................................................62
3.1. Geostatistics….....................................................................................62
© 2017 gvSIG Page 3 of 62
Learning GIS with Game of Thrones
1. INTRODUCTION
1.1. Objective and needed material
This book compiles a series of post with practical exercises that have beenpublished in the gvSIG project blog previously.
This series of exercises will try to show how to learn to use a GIS without previousknowledge and through several practical exercises. To make learningentertaining we are going to use a series of layers related to Game of Thronesfiction world. And we will use gvSIG Desktop as software, an open source GIS usedin more than 160 countries. They will be very easy exercises where we will delveinto the basic tools of a Geographic Information System little by little. We are goingto start with something basic, adding files with cartographic data.
You can download installable version as well as portable one for the differentoperating systems from the gvSIG Association website. If you have any problemwith the installation or using the software you can use the users mailing list tocomment it with the community and for supporting.
Data to be used in this series of exercises can be downloaded from here.You candownload the shields used in hiperlink exercise from this zip file.
© 2017 gvSIG Page 4 of 62

Learning GIS with Game of Thrones
2. INSTALLATION
2.1. Adding data to a project
Firstly we will open our gvSIG. We will see the interface with these components:
1. Menu bar.
2. Buttons bar
3. Project manager. It allows to manage all the documents which make aproject.
4. Work area. In this space we will be able to have the different projectdocumentsopened and work with them.
5. Status bar. The status bar provides information about coordinates, distances,etc.to the user.
The document that we are interested in is the document called “View”. It allows towork with cartographic data. In a View, the geographic information is representedas a dataset.
As the “View” document is selected by default (it’s highlighted) we only have topress “New” button and a new View will appear. We will maximize the window.
© 2017 gvSIG Page 5 of 62

Learning GIS with Game of Thrones
Now we are going to add layers in our View. For that we only have to press the“Add layer” button, that we can find at the “View” menu, or at this button:
…a window with several tabs is opened. They are the different cartographicinformation sources that we can load (we will focus on the the first one, “File”).
We are going to press “Add” button to load our first layer. For that we are going tosearch it in our data folder, selecting “Land.shp” file. This file goes with another onecalled “Land.gvsleg” (you can check it in your browser), that includes a predefinedlegend. Therefore the layer will be loaded in green colour and without background(in another exercise we will see how to change a legend). It represents the knownearth area in Game of Thrones. At the left side (called table of contents) of theView you will see the name of the layer and its legend.
Pressing on the name of the layer with the secondary button of the mouse, acontextual menu will appear, that includes the “Add to locator” option. We select itand we will be able to see that the same layer appears in the bottom left-hand box.The locator will show the visible area of the View in a red rectangle.
Now that we know how toadd layers we are going to add Islands, Landscape, Lakes,and Rivers layers. Dragging each layer at the table of contents we can change theirorder of visualization. With that we would have a physical map of Game ofThrones.
Finally we are going to change the background colour of the View from whitecolour to a light blue one, that will allow us to identify it as sea. At the “View” menuwe will select the “Properties” option. In the new window we will se the option tochange the background colour.
The final results will be similar to this one:
© 2017 gvSIG Page 6 of 62

Learning GIS with Game of Thrones
2.2. Attribute table
We follow with this mini-course about the introduction to Geographic InformationSystems with Game of Thrones. We are going to see how to open the attributetable of a layer.
Firstly we are going to open our project, that we saved when finishing the firstexercise. Then we are going to add a new layer (such as we saw in that firstexercise), called “Political”, that has the different kingdoms of the “Westeros”continent, known as “Seven kingdoms” too. The new layer has a legend that showsit without fill and with a border line in black colour and thicker.
To see the alphanumeric information that is contained in this layer we press thename of the layer with the secondary button at the Table of Contents. A menu willbe opened where we have to select the “Attribute table” option.
© 2017 gvSIG Page 7 of 62

Learning GIS with Game of Thrones
The attribute table shows us the information about the political division of thecontinent, with the name of the different territories and their governing houses:
The regions are Dorne, Stormlands, The Reach, Crownsland, The Westerlands, TheVale and Riverlands. They are completed with: The Iron Islands, The North, New Giftand Bran’s Gift and the area beyond the wall, called Wildlings. In another exercisewe will see how to edit this table and add more information.
© 2017 gvSIG Page 8 of 62

Learning GIS with Game of Thrones
Something important that we have to know is that the attribute table and thelayer with graphical elements are two different ways to see the sameinformation. Each row of the table is a different geometry (line, point or polygondepending on the layer). A very graphical way to see it is selecting an element in theattribute table; for that we have to press the row that we want to select. Thecorresponding geometry will be selected automatically.
For example if I select the row of The North region, I will get this graphicalselection:
You can select the different rows of the Table and see its correspondence in thecartography. And if you want to remove any selection you have to use the “Clear”option of the “Selection” menu or its corresponding button:
2.3. Navigation tools
When we speak about navigation tools we are referring to all of those that allowus to go over the cartography, and here we can find from the typical zooms to zoomin and zoom out (that means, to change the visualization scale) to other tools moreelaborated.
At this exercise we are going to see these tools, explaining the less known onesbetter, that are very useful.
Navigation tools are grouped at the View menu, Navigation sub-menu, being alsoavailable as buttons.
© 2017 gvSIG Page 9 of 62

Learning GIS with Game of Thrones
We are not going to explain basic tools working in detail because they are veryintuitive and its use is similar to other applications. In order of appearance at thetoolbar we have the basic navigation tools: Pan, zoom in and zoom out buttons,zoom to the whole extension of the cartography, return to a previous zoom, zoomto selected elements, and three advanced tools or not as much used ones: framemanager, centre view to coordinates or locator by attribute. Learning to use thebasic tools is very easy, we only press them and interact with the view, so we aregoing to explain the other tools directly.
Before starting, we are going to open the previous project saved at the lastexercise.
Firstly we are going to add two new layers (review the first exercise in case youhave any doubt): “Wall” and “Locations”.
We have the wall and important locations already (cities, castles…) in our project.
If we press on the “Wall” layer with secondary button of the mouse ans we select“Zoom to layer” the zoom will change to the maximum extension of the wall.
© 2017 gvSIG Page 10 of 62

Learning GIS with Game of Thrones
If you have noticed it, “Locations” layer has changed its symbology at that level ofzoom; gvSIG allows to change the symbology depending on the scale.
Now we are going to use “Locate by attribute” tool, that you can find at the“View/Navigation/Locator by attribute” menu or its corresponding button.
This tool allows to centre the View to the elements of a layer that have a specificattribute. In our case we are going to use it to visit some outstanding locations ofGame of Thrones. Selecting this tool, a new window will be opened where we canselect the layer, field and value that we want to locate in different pull-downmenus.
© 2017 gvSIG Page 11 of 62

Learning GIS with Game of Thrones
We can locate, for example, “Winterfell”.
Another tool that is not as much known but it’s very useful is the “Frame manager”,that allow us to save a zoom of a specific area of the View. It allows us to return tothat zoom in any moment.
This tool is available from the “View/Navigation/Frame manager“ menu or from itscorresponding button.
A new window will be opened where we can name the frame that we want and saveit. It will save it at the favourite frame list. As we are in “Winterfell”, we are going tosave that frame. We repeat the “Zoom to layer” action on the “Wall” layer and wesave a new frame. You can save as many frames as you want. If you have folloewdthe steps correctly you will have something like that:
Now, every time that you want to go to any of these frames you only have to openthe “Frame manager” to open that window, and select the frame that you want.
With this tool we finish this quick viewing to the navigation tools. Now you canmove on your Game of Thrones map and explore it.
© 2017 gvSIG Page 12 of 62

Learning GIS with Game of Thrones
2.4. Selecting tools
Selecting tools are very important in all the GIS because, among other things,there are a lot of tools that are executed on selected elements. Besides they can beuseful to locate elements with specified characteristics easily.
Before starting we remember that, as we saw in the exercise about Tables, wherewe select elements of a layer they are selected on its attribute table too (and viceversa).
Selecting tools can be found at the “Selection” menu or in the correspondingbutton:
Most of the selecting tools are graphical and their working is similar (and very easy).We are going to explain this working and we encourage you to test the differentgraphical selection tools.
To apply most of the graphical selection tools we have to press the main button ofthe mouse on the origin point of the selection, then drag and drop to finishselecting. In the selection by polygon case, for example, we have to click on eachvertex of it and double click to finish it. And in simple selection option, we only haveto click on the element to be selected.
To add entities to an existing selection, we have to keep “Control” key pressedwhile we select the elements. If we want to add or remove an element of a group ofselected geometries, we have to press “Control” key and click on them. The selectedelements are shown in yellow colour.
Have you tested it already?
Well, we’re going to see the non graphical selection tools in detail. Before startingopen your “Game of Thrones”project…
Selection by attributes
This tool is in the “Selection/Select by attributes” menu or from the corrrespondingbutton:
It allows to select elements through an enquiry of attributes.
The interface is this one:
© 2017 gvSIG Page 13 of 62

Learning GIS with Game of Thrones
1. Fields. List of attribute fields of the layer. When double clicking on a field it’sadded to the enquiry of the selection.
2. Logical operators. It allows to add a logical expression to the enquirypressing on them.
3. Known values. It shows a list with the different values of the selected field.When double clicking on it, it’s added to the enquiry.
4. Enquiry. Space where the enquiry is being represented. It allows to bewritten directly.
5. Selection options.
• New set. It creates a new selection.
• Add to set. The results of the new enquiry is added to the existingselection.
• Select from set. It creates a selection from the existing one. Theenquiry is done on the elements selected previously and not on thewhole layer.
Now we are going to apply “Select by attribute” tool to select all the castles of ourgeography. For that we are going to put “Locations” layer active (clicking on itsname the name will change to bold). We run “Select by attribute” tool and make thisenquiry: “type” = ‘Castle’
© 2017 gvSIG Page 14 of 62

Learning GIS with Game of Thrones
When we press “New set” all the castles of the layer will be selected. Now we canconsult the attribute table of the layer to check it (as we saw at the “Tables”exercise) or navigate on the Wiew to see the castles location (as we saw at the“Navigation tools” exercise).
Select by layer
This tool is available from the “Selection/Select by layer” menu and from itscorresponding button:
It allows to select elements from a layer according to its spatial relationship withelements from another layer.
The interface is this one:
© 2017 gvSIG Page 15 of 62

Learning GIS with Game of Thrones
1. Select items from active layer that are… Pull-down menu that allows us toindicate the selection method.
2. Selected items of a layer. It allows us to select the layer for the spatialrelationship through a pull-down menu. The elements that we want to takeinto account have to be selected at that layer. If we want a relationship of thewhole layer we would have to select all the elements of that layer.
3. Selection options. Similar to the “Select by attribute” ones.
Now we are going to do an exercise where we will select all the elements of the“Locations” layer that are located in “The Westerlands”. For that we are going toactivate “Political” layer, that includes the different kingdoms of Game of Thrones,and using “Select by attribute” tool we are going to do this query: name = ‘TheWesterlands’
We also would be able to select the polygon graphically, but at this way we reviewthe tool that we have just known. Results will be:
© 2017 gvSIG Page 16 of 62

Learning GIS with Game of Thrones
We have the element selected in our reference layer already. Now we activate the“Locations” layer and we press “Select by layer” tool. In the new window we indicatethese options:
We press “New set” and we will get all the locations contained in “TheWesterlands”:
2.5. Editing tables
We are going to continue with the course about introduction to GIS with Game ofThrones. At this exercise we are going to review the alphanumeric editing tools.Using the “Political” layer, that contains the kingdoms of the continent called“Westeros”, we are going to complete the original alphanumeric informationwith the sentence of the reigning house and two fields that will allow us to see (in anext exercise) how the “Hyperlink” tool works.
Are you ready?
Once we have opened our project, we put the “Political” layer active and we openits attribute table, such as we saw in the “Tables” exercise. This table contains 3
© 2017 gvSIG Page 17 of 62

Learning GIS with Game of Thrones
fields: id, name (name of the kingdom) and ClaimedBy. We are going to start editingnow and add three additional fields.
To start editing we are going to access to the “Table/Start editing” menu or wepress the corresponding button:
If you have the View visible, you will see that the name of the layer (“Political”) is inred colour now, that indicates that the layer is in editing mode.
We are going to add the three columns, one by one. There are several ways to do it,and we are going to see the easiest one, using the tool of the “Table/Add column”menu or from its corresponding button:
When we press the button a new window will appear where we can define: fieldname, type, length (maximum number of characters), precision, (only for numericfields) and value by default (this is optional, cells will be empty if we don’t writeanything here).
The values of the new three fields to create will be:
© 2017 gvSIG Page 18 of 62

Learning GIS with Game of Thrones
• Name: Words, Type: String, Length: 50
• Name: Shield, Type: String, Length: 100
• Name: Web, Type: String, Length: 100
Once the three fields are added our table will be like this one:
Now we can start to fill in the cells with the data of each one. For that we onlyhave to double-click on the corresponding cell and start to write. We will fill in thecells then.
For “Words” field we will add the next sentences for each of the reigning houses:
• Tully: “Family, Duty, Honor”
• Stark: “Winter is Coming”
• Greyhoy: “What Is Dead May Never Die”
• Martell: “Unbowed, Unbent, Unbroken”
• Baratheon: “Ours is the Fury”
• Arryn: “As High as Honor”
• Lannister: “A Lannister Always Pays His Debts”
• Targaryen: “Fire and Blood”
• Tyrell: “Growing Strong”
Results will be similar to these ones:
© 2017 gvSIG Page 19 of 62
Learning GIS with Game of Thrones
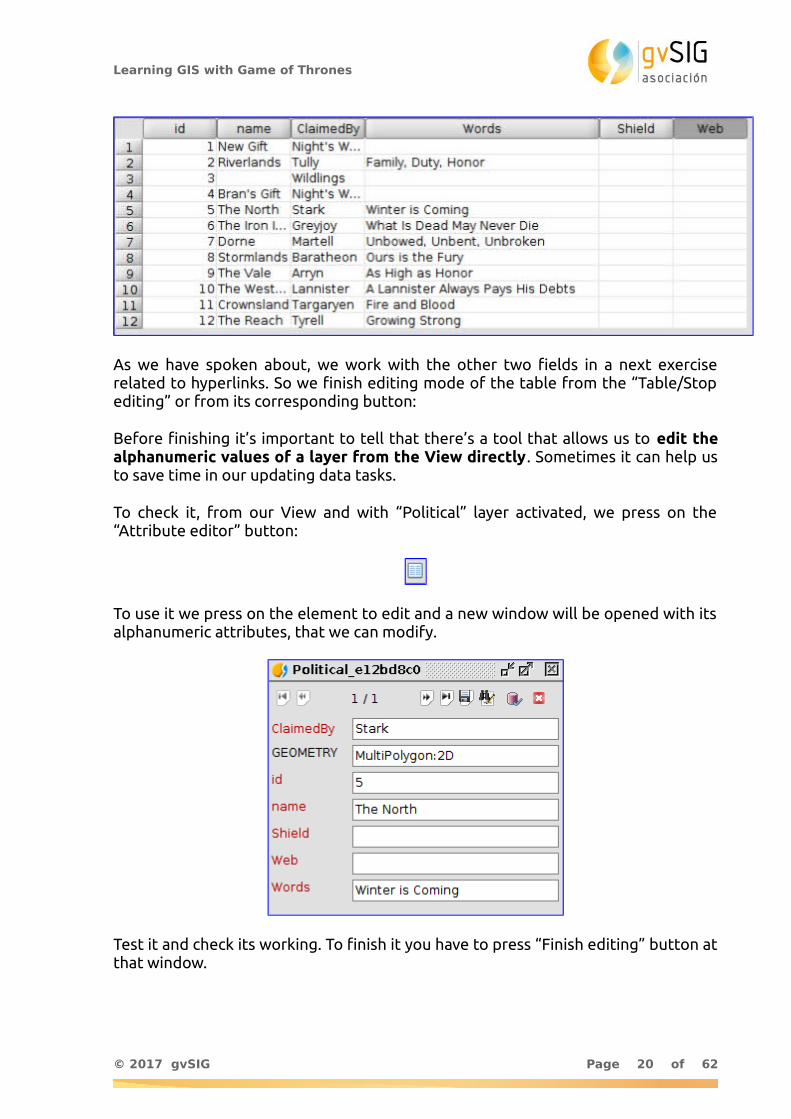
As we have spoken about, we work with the other two fields in a next exerciserelated to hyperlinks. So we finish editing mode of the table from the “Table/Stopediting” or from its corresponding button:
Before finishing it’s important to tell that there’s a tool that allows us to edit thealphanumeric values of a layer from the View directly. Sometimes it can help usto save time in our updating data tasks.
To check it, from our View and with “Political” layer activated, we press on the“Attribute editor” button:
To use it we press on the element to edit and a new window will be opened with itsalphanumeric attributes, that we can modify.
Test it and check its working. To finish it you have to press “Finish editing” button atthat window.
© 2017 gvSIG Page 20 of 62

Learning GIS with Game of Thrones
2.6. Hyperlink and other information tools
We are going to see information tools, focusing on learning to use the “Hyperlink”tool.
There are 4 main information tools: information by point, consulting area,consulting distance and hyperlink. We would be able to add other ones like “GoogleStreet View” that allows us to consult the images of this Google service… besidesin this case there aren’t Google cars riding in the Game of Thrones landscape yet.
These 4 tools are available from the toolbar:
The first three tools are very intuitive and you can test them just only explainingtheir working.
Information by point: it gives us information about the element that we click on,having its layer active. It will show a window with the values of that element fromthe attribute table. For example, if we have “Locations” layer selected and we presson the point that represents “King’s Landing”, the next window will be opened:
Consulting area and distance tools work in a similar way. Once the tool is selected,we click on the View, and we will see the information about area and perimeter inone case, and about partial and total distance in the other case. This information isshown in the lower part of the screen, at the state bar (where we can see anotherinformation like scale, coordinates or units).
© 2017 gvSIG Page 21 of 62

Learning GIS with Game of Thrones
The hyperlink is more complex because the settings have to be configuredpreviously at the layer “Properties”. We are going to see a practical example:
Reviewing the previous exercise, “Editing Tables”, we are going to add a series oflinks to websites about houses of Game of Thrones. They will be added to the“Web” field of the attribute table of “Political” layer:
• Tully: http://gameofthrones.wikia.com/wiki/House_Tully
• Wildlings: http://gameofthrones.wikia.com/wiki/Wildlings
• Night’s Watch: http://gameofthrones.wikia.com/wiki/Night’s_Watch
• Stark: http://gameofthrones.wikia.com/wiki/House_Stark
• Greyhoy: http://gameofthrones.wikia.com/wiki/Greyjoy
• Martell: http://gameofthrones.wikia.com/wiki/House_Martell
• Baratheon: http://gameofthrones.wikia.com/wiki/House_Baratheon
• Arryn: “http://gameofthrones.wikia.com/wiki/Arryn
• Lannister: http://gameofthrones.wikia.com/wiki/House_Lannister
• Targaryen: http://gameofthrones.wikia.com/wiki/Targaryen
• Tyrell: http://gameofthrones.wikia.com/wiki/House_Tyrell
Results will be similar to these ones:
Now we are going to indicate to the layer that the “Web” field contains links towebsites.
To open the Layer properties window we click on the layer name with thesecondary button of the mouse at the Table of Contents, or we access from the“Layer/Properties” menu, having the layer active.
© 2017 gvSIG Page 22 of 62

Learning GIS with Game of Thrones
At the new window we go to “Hyperlink” tab, the tab that we are interested innow.
We press “Enable hyperlink”, and we select the “Web” field and the “Link to textand HTML files” action.
Now we can close this window already, clicking on the “Accept” button and we canstart to use the hyperlink button on the “Political” layer.
What happens when we click on an element? …a browser is opened (that by theway it will be improved in the next version) with information about the web pageindicated at the attribute table. In this case we will get the information about each
© 2017 gvSIG Page 23 of 62

Learning GIS with Game of Thrones
house. For example, when we click on “The North” kingdom it will link to theinformation of the House Stark:
Now we are going to create another type of hyperlink, that will open an image thatwe have in our computer. In our case, we will see the shield of every house, that youcan download from this zip file.
For that, firstly we are going to start editing mode at the “Political” layer and weare going to add the information about the path to the images in your computer, inthe “Shield” field. For example:
• /home/alvaro/Escritorio/Shields/Arryn.PNG
• /home/alvaro/Escritorio/Shields/Baratheon.PNG
• /home/alvaro/Escritorio/Shields/Greyjoy.PNG
• /home/alvaro/Escritorio/Shields/Martell.PNG
• /home/alvaro/Escritorio/Shields/NightsWatch.PNG
• /home/alvaro/Escritorio/Shields/Stark.PNG
• /home/alvaro/Escritorio/Shields/Tully.PNG
© 2017 gvSIG Page 24 of 62

Learning GIS with Game of Thrones
• /home/alvaro/Escritorio/Shields/Lannister.PNG
• /home/alvaro/Escritorio/Shields/Targaryen.PNG
• /home/alvaro/Escritorio/Shields/Tyrell.PNG
Table will be like this one:
Such as we’ve done previously, we define the hyperlink settings, indicating that thefield will be “Shield” and the action will be “Link to image files”:
If we check the “Hyperlink” tool, each time that we link on an element of the“Political” layer, an image will appear on a new window with the shield of thecorresponding House. At that way, if we press on “The Westerlands” we will see theLannister shield:
© 2017 gvSIG Page 25 of 62

Learning GIS with Game of Thrones
2.7. Adding coordinates to a Table
Now we are going to see a very easy and useful tool. It allows to add X and Ycoordinates (or Latitude/Longitude) to a point layer in an automatic way. In ourcase, with fictitious cartography on EPSG 4326 projection system (the system usedby GPS), we will get the coordinates that represent latitude and longitude.
We have “Locations” point layer, and we are going to check the “Add X and Y” tool.
Firstly we are going to put “Locations” layer active, and we open its attribute table(as we saw in the “Tables” exercise).
Then we run the tool, from the “Table/Add measure/Add X and Y”, or from itscorresponding button:
© 2017 gvSIG Page 26 of 62

Learning GIS with Game of Thrones
We will see that two new columns will be added to the attribute table, with theinformation of the coordinates.
And now we can send our dragons to the exact coordinates…
2.8. Field calculator
The “field calculator” is one of the most used tools by users when editing theattributes of a layer. This is because its versatility, and it saves time when editingseveral registers at the same time.
It allows to make different type of calculations on the table fields. This tool can beexecuted on every register of a table or only on the selected ones.
We are going to see how it works with simple exercises, using our Game ofThrones data. But firstly we are going to see its interface.
© 2017 gvSIG Page 27 of 62

Learning GIS with Game of Thrones
1. Information. It shows the information about the selected “Field” or“Commands”.
2. Field. List of fields of the Table. Double-clicking on a field it’s added to theexpression to apply.
3. Type. The list of “Commands” available is updated depending on the selectedtype.
4. Commands. List of commands available depending on the selected “Type”.Double-clicking on a command it’s added to the expression.
5. Expression. Operation to be applied on the selected field. The expression canbe written directly.
After viewing the theoretical part we are going to start our practical exercise.
Firstly we are going to open the attribute table of the “Locations” layer, that willhave 7 columns after the last exercises. One of the existing fields is “type”, thatcontains the types of location (city, castle, ruin, town, other).
Now, for example, we want to add a new column where we will add the type oflocation in Spanish language. We would be able to do it manually, such as we saw atthe “Editing table” exercise, but thanks to the “Field calculator” we can do thisexercise in a faster way.
Following the steps that we learned in the “Editing table” exercise, we put the tablein editing mode, and we add a column, with “String” type, and keeping thecharacters by default (50). We will call it “Tipo”. We would be able to keep the“Value by default” empty, but to save time when filling it out we are going to write“Otro” (without quotation marks). At this way all the registers will be filled out withthis value. Now we only have to fill out the rest of the values
© 2017 gvSIG Page 28 of 62

Learning GIS with Game of Thrones
.
At this moment the table will be like this one:
Now we are going to use the “Select by attribute” tool to select the different valuesof the “Type” field, and the field calculator to fill in the rows selected with thecorresponding value in an automatic way.
At this point, if you don’t know how to use the “Select by attribute” tool you canreview the exercise where we explained its working.
© 2017 gvSIG Page 29 of 62
Learning GIS with Game of Thrones
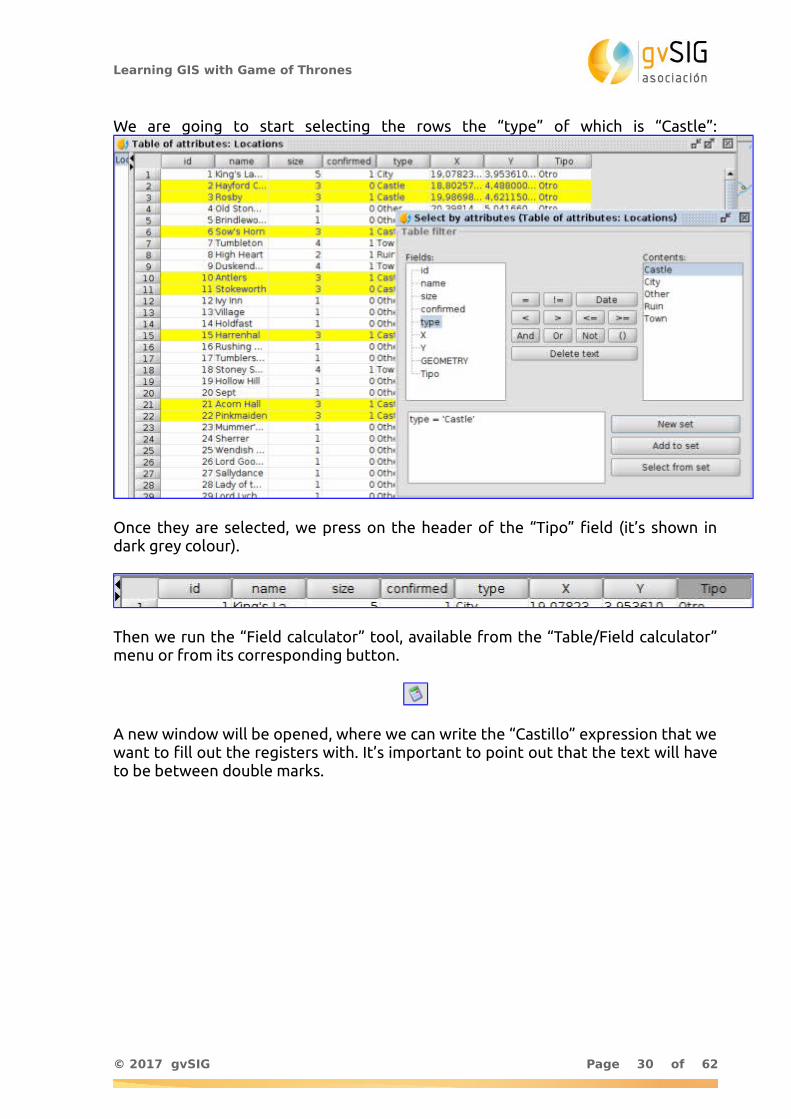
We are going to start selecting the rows the “type” of which is “Castle”:
Once they are selected, we press on the header of the “Tipo” field (it’s shown indark grey colour).
Then we run the “Field calculator” tool, available from the “Table/Field calculator”menu or from its corresponding button.
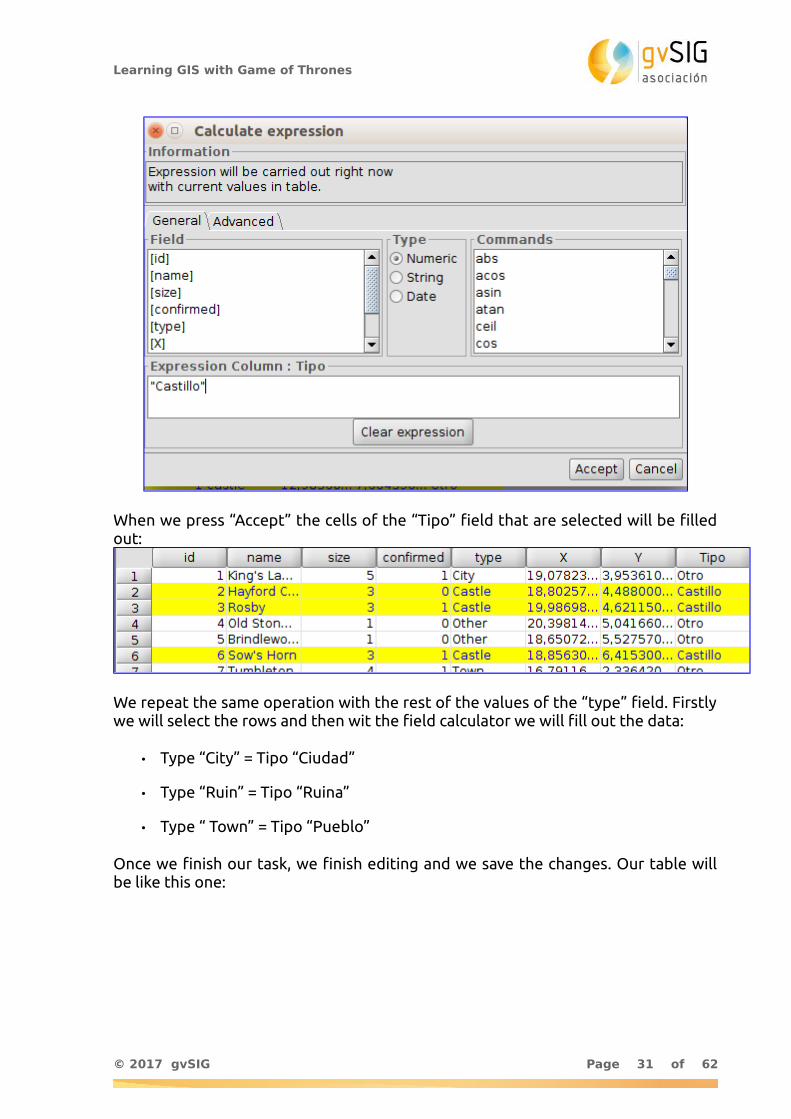
A new window will be opened, where we can write the “Castillo” expression that wewant to fill out the registers with. It’s important to point out that the text will haveto be between double marks.
© 2017 gvSIG Page 30 of 62
Learning GIS with Game of Thrones
When we press “Accept” the cells of the “Tipo” field that are selected will be filledout:
We repeat the same operation with the rest of the values of the “type” field. Firstlywe will select the rows and then wit the field calculator we will fill out the data:
• Type “City” = Tipo “Ciudad”
• Type “Ruin” = Tipo “Ruina”
• Type “ Town” = Tipo “Pueblo”
Once we finish our task, we finish editing and we save the changes. Our table willbe like this one:
© 2017 gvSIG Page 31 of 62

Learning GIS with Game of Thrones
The “Field calculator” is very powerful and it allows to use complex expressions. Werecommend you to test it and learn all its functionalities.
2.9. Exporting View to image
In gvSIG there are tools to design more or less complex maps, but there are manycases where we need to have an image of the frame of our View in gvSIG to be usedin a presentation or document that we are writing.
We are going to see a very easy and useful tool when we want to have animmediate image from our View.
To run it we have to access to the “View/Export/Export view to image”. A newwindow will appear where we only have to indicate where we want to save theimage file and its format (jpg, png, bmp or tiff).
© 2017 gvSIG Page 32 of 62

Learning GIS with Game of Thrones
An easy and useful tool, that is sometimes unknown by gvSIG users…
2.10. Legends
We are going to learn about how to change the symbology of a layer, reviewingdifferent types of legends that are available in gvSIG Desktop.
The symbology is one of the most important properties of a layer. gvSIG includes agreat variety of options to represent layers with symbols, graphs and colours.Excepting unique symbol option, the rest of legends are assigned to each elementdepending on their attribute values and the properties of the type of legendselected.
By default, when a layer is added to a View, it’s represented with a unique symbolwith random colour, that means, all the elements of the layer are represented withthe same symbol. To modify the symbology of a layer we have to access to its“Properties” window and select “Symbology” tab. We are going to open our “Gameof Thrones” project and we will start to explore this part of gvSIG Desktop.
If we want to change a symbol, the easiest way is double-clicking on it at the ToC(Table of Contents with the list of layers). A new window will be opened to selectthe new symbol. For example we are going to double-click on the symbol of the“Rivers” layer.
At the new window we can change the colour and the width of the line, press onany of the symbol libraries installed (“gvSIG Basic” by default, although we caninstall a lot of libraries from the Add-ons Manager). In this case we are going tochange width to 3 and select a dark blue colour. We press “Accept” to applychanges.
© 2017 gvSIG Page 33 of 62

Learning GIS with Game of Thrones
Now we are going to see the type of legends that are available and we willselect a legend by the different types of locations, attribute that we have used inthe previous exercises. There are a lot of possibilities for symbology, and you cansee this additional documentation.
Firstly we will have to open the “Properties” window of the layer. Activating thelayer we will find this option at the “Layer/Properties” menu, or directly using thesecondary button of the mouse on it.
Now we access to the “Symbology” tab and a window is shown with the symbologyapplied. At the left side we can find all the types of symbols than we can use.Warning: Depending on the type of layer (point, line or polygon) we can finddifferent legends available.
© 2017 gvSIG Page 34 of 62

Learning GIS with Game of Thrones
In this case we are going to select a legend about “Categories/Unique values”. Thistype of legend is used to assign a symbol to each unique value specified at theattribute table of the layer. Each element is drawn depending on the value of anattribute that identifies the category. In our case we will select “Type” forclassification field; we press “Add all” and it will show the legend created by default:
The Labels (at the right side) can be modified. You can change the texts here.
© 2017 gvSIG Page 35 of 62

Learning GIS with Game of Thrones
Now, double-clicking on every symbol a new window will be opened where we canmodify them or select new symbols from our symbol libraries with “Select symbol”option. Once they are selected we press “Apply” and we will see the results in ourView.
The best way to learn different type of legends is testing… We also recommendyou to install and check the different symbol libraries that are available in gvSIG(hundreds of symbols of all types!!).
2.11. Labelling
A label is the text which describes one or more attributes. The labels are locatedover or close to the elements of one layer, according to the labelling characteristicsdefined by the user, as well to the changes of the View. Note that labels cannot bemodified by users directly.
There are two different ways of labelling in gvSIG, one basic and quick, andanother one, a little bit more complex, with multiple options that allows to set upthe characteristics of the labels.
Like for symbology, gvSIG has a wide range of tools to manage the label variables.To learn more about labelling, please check the “Labelling” section in the user guide.
Let’s do now an exercise, using the basic labeling command to place the labels overthe “Political” layer. We will begin by opening the layer “Properties” window. To dothat, we can select Layer > Properties with the layer active, in the menu, or right-click on the layer name, in the Table of Contents.
© 2017 gvSIG Page 36 of 62

Learning GIS with Game of Thrones
In the “Layer Properties” dialog box, click on the “Labelling” tab. Then, click on the“Enable labelling” check box to enable all the basic labelling options.
Here, we should choose the field in the attribute table will be shown in the maps aslabels. In the case of our exercise we select the field “name”, which stores the nameof each kingdom. We will set “12” as the size font, and leave the others settings bydefault. Click “Apply” and /or “OK” and the result will be as shown below.
© 2017 gvSIG Page 37 of 62

Learning GIS with Game of Thrones
If we want to hide (or show again) labels, we should click on the “Labelling” tab inthe “Layer Properties” dialog box, and then, we uncheck or check the “Enablelabelling” box.
If we want to have more control over the labels, we should pick the option “Userdefined label“ in the “General” drop-down menu, instead of the “Label attributesdefined in table” that is shown by default. Then, in the “Classes” drop-down menu,we pick the option “Label features in the same way” in the “Method” option. Thewindow changes as shown below:
As we said before, labelling tab is plenty of options. You can learn more about thisin the gvSIG user guide. In our example, we will use some of these options to learnhow labels might change.
© 2017 gvSIG Page 38 of 62

Learning GIS with Game of Thrones
If we click on the “Properties” button, the “Label class properties” window isopened:
We will begin by defining the field we want to use to label features. To do this, clickon the button “…” in the “Labelling Expression”.
A new window is opened, as shown below. Here, select the field to label features -inour case is “name”- and then click on the “Add field” button.
© 2017 gvSIG Page 39 of 62

Learning GIS with Game of Thrones
The labelling expression could be more complex if we create SQL queries but in thisexample we will just use the field “name” like in the basic label, explained before.
By clicking on the button “OK”, the selected field appears in the “Labellingexpression” box.
When you label a layer, you might want to modify the visualization of the labels.gvSIG, allows you to change some label properties, such as font, color, or size. Thisoption is not available in the basic labelling options but only in the advancedoptions by checking the box “Use halo”. This enables you to choose the format andthe font settings.
Once the label properties are defined, click on “OK” to close the “Label classproperties” window. Now, back in the “Layer properties/Labelling” window, click onthe “Placement” button to open the “Placement properties” window shown below:
© 2017 gvSIG Page 40 of 62

Learning GIS with Game of Thrones
Here, click the “Remove duplicate labels” radio button and then “OK”. You mightwant to try out other options and note the differences.
Finally, click on “Apply” in the labelling tab of the “Layer Properties” window andthe labels are placed.
© 2017 gvSIG Page 41 of 62

Learning GIS with Game of Thrones
Here is this exercise. We also recommend you to explore other options like the onewhich allows you to label features considering the scale of the printed map. By theway, the labelling options may change depending on the layer features (points,lines, and polygons).
2.12. Graphic editing tools
As a complement of a previous exercise in which we talked about the table editiontools, we will show you the tools for graphic edition. These tools will allow you tocreate and edit vector data. We must keep in mind that certain data formats areread-only and do not allow editing.
In order to add or modify elements of a layer, it must be necessary that the layer isactivated and in editing mode. Depending on the type of layer to be edited (points,lines and / or polygons ), some tools will be available.
These tools are available from the “Layer” menu in the “Remove”, “Insert” and“Modify” submenus, from the “Edit” menu and from the corresponding button bars.
© 2017 gvSIG Page 42 of 62

Learning GIS with Game of Thrones
We remind you that this is a basic introduction course to GIS. Anyhow, in order toknow in detail all editing tools we strongly recommend you to check out the gvSIGDesktop user manual:
• Graphic editing tools .
• Element-editing tools .
• Element-adding tools .
• Drawing support tools .From this section it is especially interesting the“snapping” tool that allows to create entities that are connected to eachother.
• Edition tools .
After this introduction, we are going to do a practical exercise using informationfrom the famous TV series Game of Thrones.
This exercise consists of creating a new layer in which we will add the routes or tripsthat follow each of the protagonists of the saga. In this case, we will draw Greyjoybrothers´ travel from Pyke to Meereen, passing through Volantis.
First of all, we have to create a new layer (in shapefile format). This tool is availablein the menu, where we select the order “Layer/New Layer”.
An assistant will pop up. It will show the steps needed for creating a new layer :
We must select “Create a new Shape layer” and then, click the“Next” button.
In the next step, we will create an “Output File”; we have to indicate the name andthe path route where the new layer will be saved (for example we can call it“Routes”). Once defined, we click the “Next” button.
© 2017 gvSIG Page 43 of 62

Learning GIS with Game of Thrones
It is possible to define the geometry type of layer: Point, Curve, Surface orMultipoint. As we want to represent a route, we have to draw a layer consisting oflines. Therefore we select in the interface the “Curve” type of geometry.
It is possible to add attribute fields to the new layer using the “Add Field” button.We want to add a “Name” attribute, therefore we select “String” type (text string).It will serve us to identify by name each of the routes.
In this step we can add any kind of field needed to improve the classification. Whenthe attribute table is defined, then click “Next”.
Finally we select the option “add the new layer to the view”. In order to end, pressthe “Finish” button. We have already the new, empty layer, with no elementsincluded in. In order to continue the exercise we have to start filling with content.
To make easier the drawing of the route, (check out our previous exercise about inthis page) “Labelling”,we will label the “Locations” layer, which will allow us toidentify easily the route through the places we want to: Pyke, Volantis AndMeereen. You can also use the “selection tools” or the “locator by attribute” toidentify these locations.
First of all we are going to turn our layer in “edit mode”. When activated, there aretwo possible ways to do it: by selecting “Menu/layer/Start editing” o by clicking inthe context menu of the Table of contents (TOC).
© 2017 gvSIG Page 44 of 62

Learning GIS with Game of Thrones
When in editing mode, the name of the layer turns red:
You will also see the new toolbars that have appeared in the interface. These willallow you to draw new elements as well as edit existing ones:
The last change of interface is located at the bottom of the View, where we canexpand or contract a command bar:
Before starting the drawing of the route it is interesting to keep in mind two basicsupporting tools to drawing. We can change the display scale by using the mousewheel, moving forward and back. When we press the wheel, we can scroll throughthe map.
To start drawing the route, select the “Draw polyline” tool:
We are located near Pyke and we click with the mouse, in order to have the firstpoint of our route. Then we will use the mouse wheel to navigate through themap eand then add intermediate points until arriving first in Volantis, and later inMeereen. Once the last point is drawn, we click in the right mouse button and in thecontext menu we select the option “Finish”.
As previously shown at the “Editing Tables” exercise, now we could edit itsattributes and write, e.g., “Greyjoy brothers” in order to identify this travel.
We could add new routes, each of which would be a new element of the layer. Weare going to stop here, so we go to the menu and select “Layer / Finish Edition”.
© 2017 gvSIG Page 45 of 62

Learning GIS with Game of Thrones
The resulting route should be similar to one drawn in the following image:
Now you are ready to practice and get to know the rest of the editing tools! you canalso practice the tools we have seen previously, e.g. by adding as hyperlink to animage identifying each route.
© 2017 gvSIG Page 46 of 62

Learning GIS with Game of Thrones
2.13. Geoprocessing
Geoprocessing is the execution of analytical and modelling operations ofgeographic data for creating new information. Creating a new layer with theoverlapped areas from two different layers, a layer that creates buffers around thegeometries of vector features, or a point density map are examples ofgeoprocessing.
gvSIG Desktop has more than 350 geoprocessing operations. There are manyalgorithms ready for use that would help us to analyze the spatial information.
For more information about geoprocessing, open Help in gvSIG using the followinglinks:
• Geoprocessing
• Toolbox
• gvSIG geoprocesses. Vector layers .
• gvSIG geoprocesses. Raster layers .
• gvSIG geoprocesses. Multispectral layers .
• Sextante
• Models
The geoprocessing tools can be find by clicking on the menu “Tools >Geoprocessing > Toolbox” or by using its shortkey.
The toolbox menu allows to execute any of the geoprocesses available in gvSIG.Here, we will perform two different ones.
We will begin by performing a spatial join between the two layers “Locations” and“Political”. As it is said in the Help for this geoprocess, this tool joins attributes from
one feature to another based on a common spatial relationship.
© 2017 gvSIG Page 47 of 62

Learning GIS with Game of Thrones
In the picture shown above, “Political” is the polygon layer while “Location“ is thepoint layer. If we perform a spatial join, the result would be a new point layer withthe attributes of the “Political” layer. Let’s perform the spatial join, then.
In the “Toolbox”, select the “Spatial Join”. To find this geoprocessing operation, wecan type “join” in the search box located at the bottom of the window- as shown inthe picture below.
We will use the first of the filtered geoprocessing operations. To do this, double-click on it or right-click in the frame, and then choose “Launch”. A new window isopened (see the picture shown below).
© 2017 gvSIG Page 48 of 62

Learning GIS with Game of Thrones
Choose “Locations” as the input coverages and “Political” as de the overlay layers.Learn more about geoprocessing operations work in the Help. Additionally, the userguide can be found by clicking on the information button at the bottom of thegeoproccesing window.
When using this option, a temporary layer will be created. To save it, select thisoption or export the temporary one to a new layer.
Finally, click the OK button to complete the operation and a new layer is added tothe View. If the “attribute table” is opened, we will see that the fields “Locations”and “Political” are added:
Let’s perform another geoproccesing operation now, over some of the itemspreviously selected in the layer we just created, to analyze if the “Riverlands”kingdom dimension is logical in relation to the locations within it.
We will begin by selecting the records with “Riverlands” in the field “name_1” fromthe “Spatial Join” layer. Check out the exercise “Selecting Tools” in case you needmore help. The result of the selection is shown in the picture below:
© 2017 gvSIG Page 49 of 62

Learning GIS with Game of Thrones
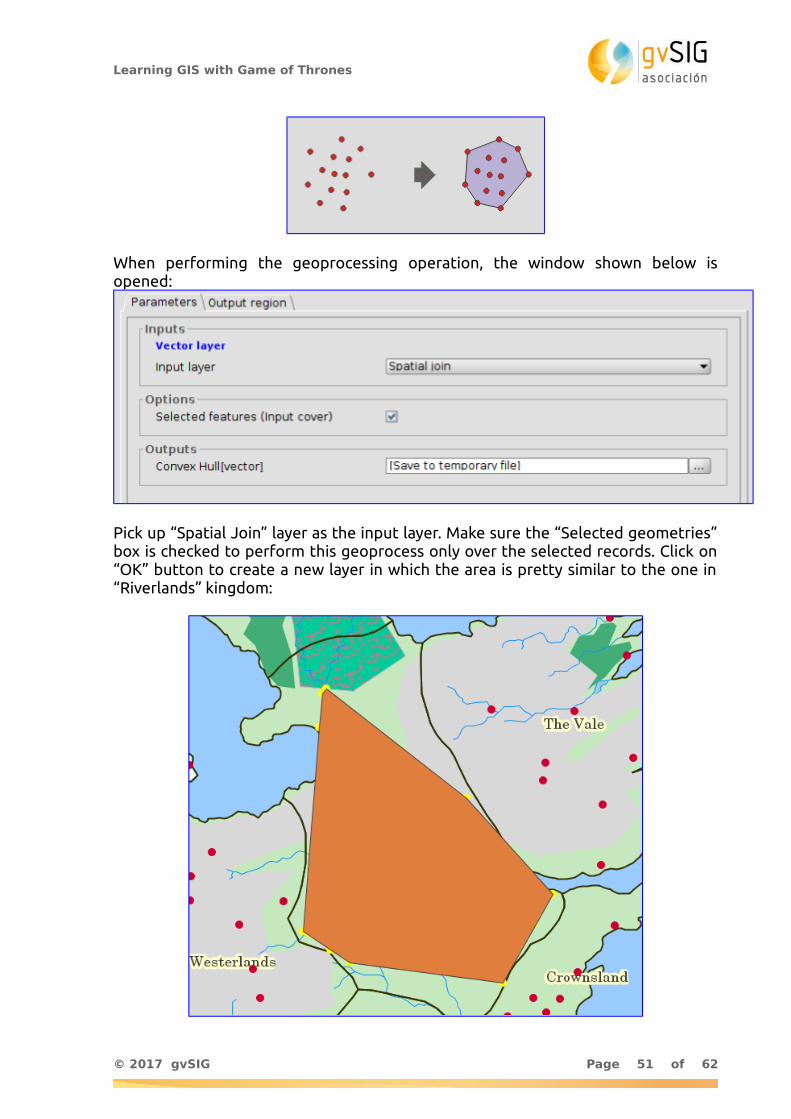
Let’s open now the “Toolbox” again to execute the geoprocess “Convex Hull”:
According to the Help, this geoprocess calculates the “Convex Hull” or the convexpolygon with the smaller area that hulls all the vector elements of an “input layer”.
© 2017 gvSIG Page 50 of 62
Learning GIS with Game of Thrones
When performing the geoprocessing operation, the window shown below isopened:
Pick up “Spatial Join” layer as the input layer. Make sure the “Selected geometries”box is checked to perform this geoprocess only over the selected records. Click on“OK” button to create a new layer in which the area is pretty similar to the one in“Riverlands” kingdom:
© 2017 gvSIG Page 51 of 62

Learning GIS with Game of Thrones
Once you have learnt how geoprocessing operations work… you just need to trythem out…
2.14. Layouts
At this second-to-last exercise of the course to learn the base of the GeographicInformation Systems through practical exercises with Game of Thrones data we aregoing to work with the “Map” document.
A Layout document is a set of design elements of a map, organized in a virtual page,the objective of which is its graphical output (printing or exporting to PDF file).The elements that we see in the design are the elements that are printed orexported to the PDF file, being in the same paper size that we have selected on thescreen. We can add two different type of elements in a Layout: Cartographicelements and design ones.
In our case we are going to create a map with the path followed by Greyjoybrothers, that we drew in the exercise about “Graphical editing“.
Once we have our project open in gvSIG, firstly we are going to open the “Projectmanager” window. A fast way to do it is through the “Show/Project manager” menu.We select the “Map” type of document and we press “New”. A new window will beopened, where we can define the characteristics of the Map page.
In our case we are going to select “A4” for the page size, then “Horizontal”, and wewill select the View where we had our layers loaded instead of “Create new View”option. If you have more than one View in your project you will see a list with all ofthem.
You will see that a new map is created where the indicated View is added with a fullextent at the page:
© 2017 gvSIG Page 52 of 62

Learning GIS with Game of Thrones
Pressing on the “black squares” that appear in the borders and medium points ofthe rectangle that defines the View extension we can change its size. At this way we
are defining the design of our map. Clicking on the View element inserted anddragging it we can move it. In our case we resize the View inserted and we move it,
and now we will insert other cartographic elements.
© 2017 gvSIG Page 53 of 62

Learning GIS with Game of Thrones
Most of the cartographic elements are closely linked to a View document, so thatwhen making changes to the View, they can be reflected in the map (changes ofzoom, displacements, legend changes, organization of layers, etc.). These tools areavailable from the “Map / Insert” menu and the corresponding button bar.
Let’s start by inserting the legend. This tool is available from the menu “Map / Insert/ Legend” or from its button:
The legend is always associated with a View inserted in the Map and allows torepresent the symbology of the different layers of that View. Once the tool isselected, we will indicate the first end of the rectangle defining the space to befilled by the legend. It will be indicated by clicking on the Map area at the desiredlocation, and dragging until released at the opposite end. A dialog box will appearwhere you can define the graphic properties of the inserted legend:
In this window we can mark which layers (its symbology) we want to show in thelegend.
© 2017 gvSIG Page 54 of 62

Learning GIS with Game of Thrones
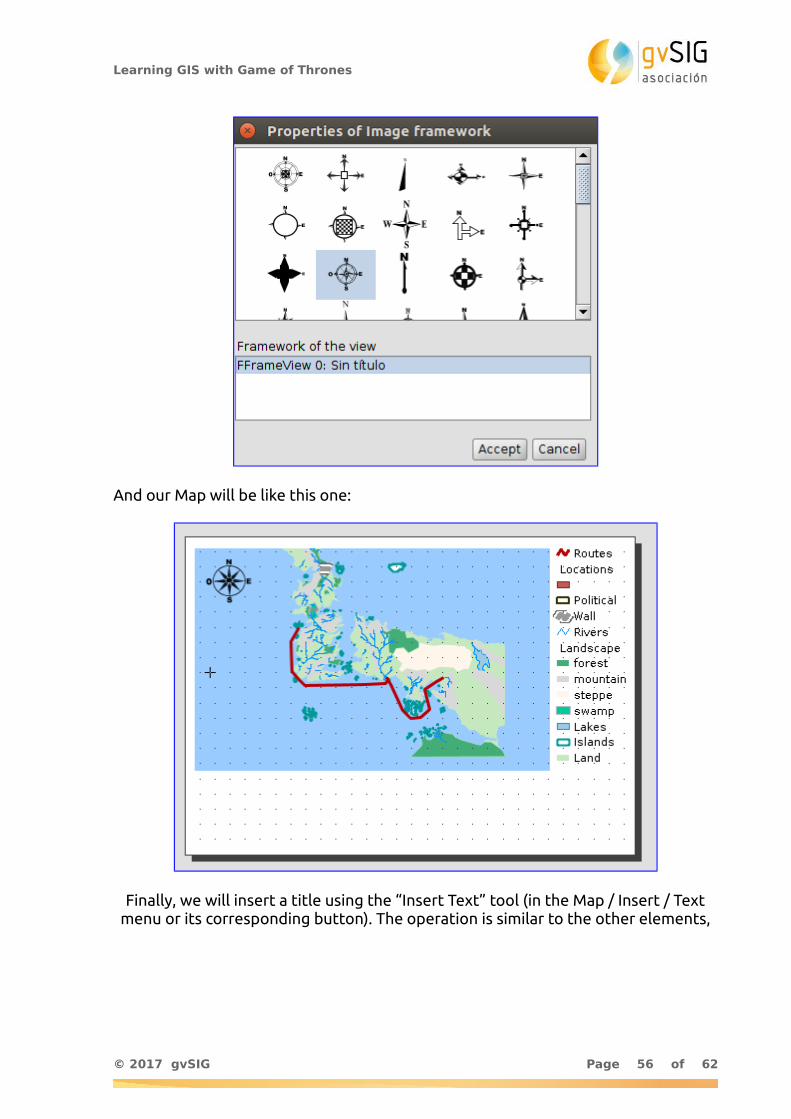
Next we insert a North symbol. This tool is available from the “Map / Insert / North”menu and from its corresponding button:
Once the tool is selected, the first end of the rectangle that defines the space to beoccupied by the north symbol will be indicated by clicking on the Map area at thedesired location, and dragging until released at the opposite end. A dialog box willappear where you can define the graphic properties of the inserted north:
© 2017 gvSIG Page 55 of 62
Learning GIS with Game of Thrones
And our Map will be like this one:
Finally, we will insert a title using the “Insert Text” tool (in the Map / Insert / Textmenu or its corresponding button). The operation is similar to the other elements,
© 2017 gvSIG Page 56 of 62

Learning GIS with Game of Thrones
and in this case we will indicate the text that we want to write: “Greyjoy Brothers”.
From here, to avoid extending this exercise, we recommend you to review thedocumentation related to the Map document where you will be able to see how toadd graphic scales, boxes, etc. With practice you can create really well designedmaps.
Once you have your map you can export it to a PDF file from this button:
You can send your PDF file to all your contacts already.
As it’s said, practice makes perfect.
2.15. Add-ons installing
We are going to dedicate this last exercise to the “Add-ons manager”, a tool thatevery gvSIG Desktop user should know.
The add-ons manager is a tool that allows to customize gvSIG, installing newextensions, functional ones as well as other types (symbol libraries). It can be runfrom the “Tools/Add-ons manager” menu, although it can be accessed during theinstalling process.
Thanks to the “Add-ons manager” you can access to the plugins not installed bydefault as well as to the new tools that are published after a final version.
At the window that appears firstly you have to select the add-ons installationsource:
© 2017 gvSIG Page 57 of 62

Learning GIS with Game of Thrones
The add-ons can have 3 sources:
• The own installation binary. The file that we have downloaded has a lot ofplugins and add-ons, and some of them are not installed by default, but theyare available to install. It allows to customize gvSIG without an internetconnection.
• Installation from file. We can have a file with a set of extensions to beinstalled on gvSIG.
• From URL. Through an internet connection we can access to all the add-onsavailable at the gvSIG server and install those that we need. It’s therecommended option when we want to consult all the add-ons available.
Once the installation source is selected you have to press “Next”, and it will showthe list of plugins available.
The add-ons manager interface is divided in 4 parts:
© 2017 gvSIG Page 58 of 62
Learning GIS with Game of Thrones
1. List of available add-ons. The plug-in name, version, and type are indicated.The verifcation check boxes allow to distiguish between available (white) oralready installed add-ons (green). You also can see the meaning of the icons.
2. Information area concerning the plug-in selected in “1”.
3. Area that shows the “Categories” and “Types” in which the plug-in isclassified. When we choose a category or type from the list, a filter that runson “1” shows only the plug-ins related to this category or type.
4. Fast filter. Enables a filter from a text string entered by the user.
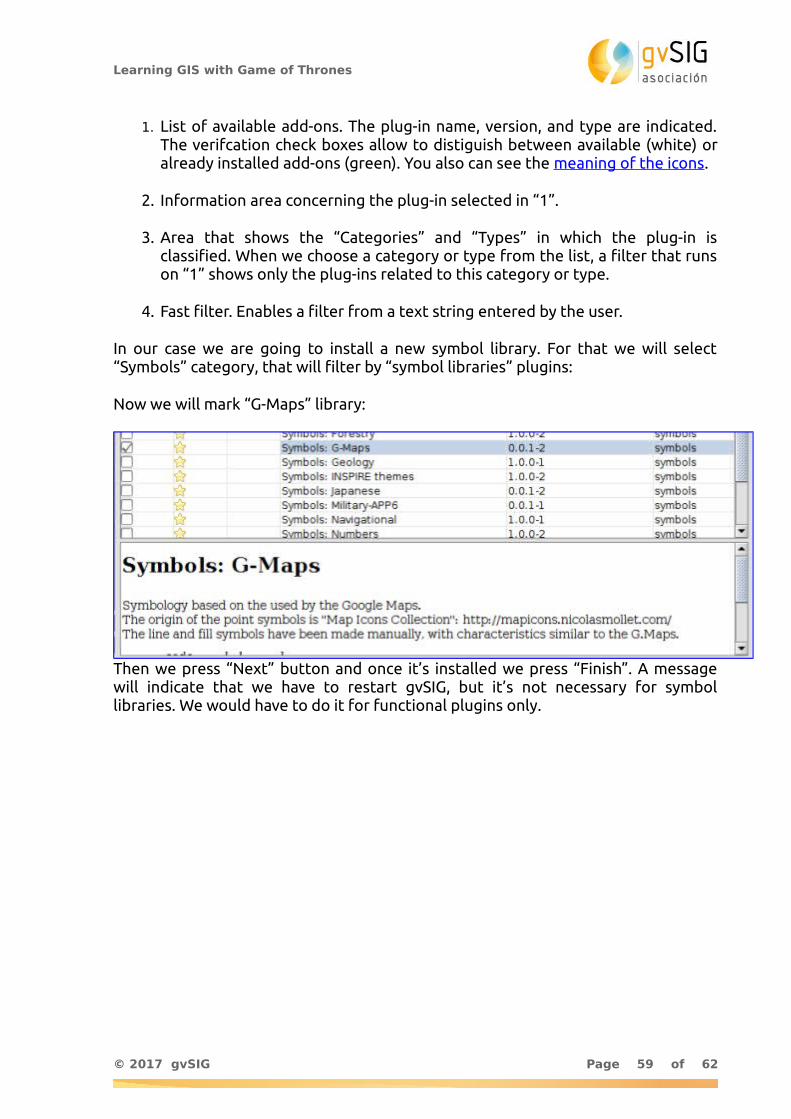
In our case we are going to install a new symbol library. For that we will select“Symbols” category, that will filter by “symbol libraries” plugins:
Now we will mark “G-Maps” library:
Then we press “Next” button and once it’s installed we press “Finish”. A messagewill indicate that we have to restart gvSIG, but it’s not necessary for symbollibraries. We would have to do it for functional plugins only.
© 2017 gvSIG Page 59 of 62

Learning GIS with Game of Thrones
Now, if we are going to change the symbology of any of our layers, for example“Locations”, we will see that we have the new symbols available:
You can see the symbol libraries available in the gvSIG documentation.
And with this last exercise we finish this atypical course about introduction toGIS. We expect that you have learnt, and besides it has been as much funny as forus to do it.
From this point you are prepared to go more deeply into the application anddiscover all its power.
And a last advice… you can use the mailing lists to consult any doubt or tell us anyproblem that you find:
http://www.gvsig.com/en/community/mailing-lists
© 2017 gvSIG Page 60 of 62

Learning GIS with Game of Thrones
3. EXTRA
Once you have finished the course it's probably that you want to continue delvinginto the use of gvSIG Desktop. Here you will find a series of links that will help youto become an expert in the use of GIS.
3.1. For users…
• Learning gvSIG in 30 minutes: https://blog.gvsig.org/2017/05/23/learning-gvsig-in-30-minutes/
• Learn GIS for free course:
◦ Introduction to GIS: https://blog.gvsig.org/2017/06/16/learn-gis-for-free/
◦ Working with Views: https://blog.gvsig.org/2017/06/21/learn-gis-for-free-module-2-working-with-views/
◦ Working with Tables: https://blog.gvsig.org/2017/06/27/learn-gis-for-free-module-3-working-with-tables/
◦ Working with Maps: https://blog.gvsig.org/2017/06/30/module-4-working-with-maps/
◦ Creating and Editing vectorial layers: https://blog.gvsig.org/2017/07/03/learn-gis-for-free-module-5-create-and-editing-vectorial-layers/
◦ Geoprocessing: https://blog.gvsig.org/2017/07/05/learn-gis-for-free-module-6-geoprocessing/
◦ Raster GIS. Working with Raster Data: https://blog.gvsig.org/2017/07/07/learn-gis-for-free-module-7-raster-gis-working-with-raster-data/
◦ Vegetation index and unsupervised classification: https://blog.gvsig.org/2017/07/10/learn-gis-for-free-module-8-vegetation-index-and-unsupervised-classification/
◦ Raster reclassification and raster calculator: https://blog.gvsig.org/2017/07/12/learn-gis-for-free-module-9-raster-reclassification-and-raster-calculator/
• Analyzing skatepark location in New York city in relation with graffiti cleaning complaints using gvSIG: https://blog.gvsig.org/2016/09/09/free-gvsig-tutorial-in-english-analyzing-skatepark-location-in-new-york-city-in-relation-with-graffiti-cleaning-complaints-using-gvsig/
© 2017 gvSIG Page 61 of 62

Learning GIS with Game of Thrones
3.2. For developers…
• Scripting: https://blog.gvsig.org/2016/12/05/course-about-geographic-scripting-with-gvsig-desktop-documentation-released/
3.1. Geostatistics…
• Geostatistics: R integration in gvSIG: https://blog.gvsig.org/2017/05/24/video-of-the-geostatistics-r-integration-in-gvsig-webinar-is-now-available/
© 2017 gvSIG Page 62 of 62