learning geographic information from a map and text: learning
TRANSCRIPT

Learning Geographic Information from a Map and Text:Learning Environment and Individual Differences
Robert Earl Lloyd and Rick L. BunchDepartment of Geography / University of North Carolina / Greensboro / NC / USA
Abstract
A map is frequently combined with a text to provide spatial and non-spatial information for learners. How a map anda text are combined and the characteristics of learners are keys for understanding successful learning. This study useda cognitive experiment to investigate spatial learning by explaining performance on a test of acquired knowledge withvariables related to the learning environment and to individual differences of learners. Results indicate that havingparticipants read a text beside a map produced the best performance. Participants were more successful at learningthe information in the text and less successful at learning the information on the map. Performance was measured byaccuracy, reaction time, and confidence measures; a standardized index for overall efficiency combined these measures.Performance was significantly related to individual difference variables measuring experience, verbal and spatial workingmemory capacity, 2D/4D digit ratio, and cognitive style. Sex and gender variables were not significantly related to varia-tions in performance. In complex learning situations, as in processing a combined map and text, the expected verbal andspatial processing advantages of female and male learners may both produce positive results. In more complex cases,variables related to brain asymmetry, memory capacity, and cognitive style may provide more useful explanations ofperformance.
Keywords: spatial learning, map, text, individual differences, memory capacity, digit ratio, cognitive style
Resume
On associe souvent du texte a une carte pour fournir des renseignements spatiaux et non spatiaux aux apprenants. Lamaniere dont la carte et le texte sont associes et les caracteristiques des apprenants sont des elements cles pour expliquercet apprentissage. Dans l’etude, on se sert d’une experience cognitive pour evaluer un apprentissage spatial et expliquerle rendement obtenu a un test sur les connaissances acquises en tenant compte des variables relatives au milieud’apprentissage et aux differences individuelles d’un apprenant a l’autre. D’apres les resultats, les meilleurs rendementssont obtenus quand les participants lisent le texte a cote de la carte. Les participants apprenaient mieux les renseigne-ments contenus dans le texte et moins ceux de la carte. Le rendement a ete mesure en fonction de la precision, du tempsde reaction et des mesures de confiance; un indice normalise de l’efficacite globale combinait ces mesures. Le rende-ment etait etroitement lie aux variables de la difference individuelle qui mesurait l’experience, la capacite de la memoireoperationnelle verbale et spatiale, le rapport numerique 2D/4D et le style cognitif. Les variables du sexe et du genren’etaient pas liees de pres aux variations du rendement. Dans des situations d’apprentissage complexe, comme lorsdu traitement d’une carte avec du texte, les avantages prevus relativement au traitement verbal et spatial pourraientproduire des resultats positifs tant pour les apprenants que pour les apprenantes. Dans des cas plus complexes, lesvariables liees a l’asymetrie du cerveau, a la capacite de la memoire et au style cognitif pourraient fournir une meilleureexplication du rendement obtenu.
Mots cles : apprentissage spatial, carte, texte, differences individuelles, capacite de la memoire, rapport numerique, style cognitif
Cartographica (volume 45, issue 3), pp. 169–184 doi: 10.3138/carto.45.3.169 169

Introduction
The interaction between a map and text has been studied
using different assumptions about the dominant source of
information. Some studies have focused on reading com-
prehension and whether the map can aid learning with
text (Kulhavy, Stock, and Kealy 1993). Michael Verdi and
Raymond Kulhavy (2002) argue that when sequentially
learned, the two are partners that work together to aid
the learning process. Others have suggested that the
combination can impede learning when they compete for
attention (Bunch and Lloyd 2006). Research on map–text
combinations needs to place basic questions on learning
performance within contexts that consider the effects of
the learning environment and the characteristics of map
learners.
Maps express spatial information in a variety of ways. A
reference map, for example, uses map symbols to illus-
trate spatial relationships and meaning. Narrative texts
provide additional descriptions of map features and their
relationships. This study uses a hypothetical map of an
island and three experimental methods for presenting
narrative text. The purpose is to identify which method
produces the most efficient performance when a novel
map and text are simultaneously available. The methods
used to present geographic information represent experi-
ences one might encounter when learning about an un-
familiar place in a book or on a Web page. In this study,
an efficient performance is defined as task scores indicating
high accuracy, high confidence, and fast response time.
Task scores that indicate low accuracy, slow response
time, and low confidence reflect a negative performance.
Memory for Objects and Locations
Cognitive scientists make a distinction between object
memory and location memory (Bellgowan and others
2009). Verbal processes in the left hemisphere encode
categorical spatial information, and visual processes in the
right hemisphere encode coordinate spatial information
(Kosslyn and others 1998). Categorical spatial informa-
tion is easier to learn but less exact; coordinate spatial
information is more accurate but also more difficult to
learn. Coordinate spatial information for a city indicates
its horizontal and vertical locations on a map, while cate-
gorical spatial information for the same city would relate
to its location in a specific region or along a particular
river. Both types of information indicate where the city is
on a map. Functional magnetic resonance imaging (fMRI)
can identify regions of the brain associated with cate-
gorical and coordinate visual memory (Slotnick and Moo
2006; van der Lubbe and others 2006). Although there are
separate systems for processing spatial and non-spatial
information, these types of information are associated
with one another in memory (Sommer, Schoell, and
Buchel 2008).
Although the typical learner is capable of encoding verbal
information using left-hemisphere processes and visual–
spatial information using right-hemisphere processes,
individuals may have these resources asymmetrically dis-
tributed within regions of the brain (Fenner, Heathcote,
and Jerrams-Smith 2000). Evidence suggests that a com-
plex mix of biological and environmental factors affects
an individual’s spatial abilities (Casey 1996). Individual
differences such as brain structure, gender, memory capaci-
ties, and cognitive styles are likely to affect performance in
learning and recalling geographic information. Individual
learners who favour verbal processing may be more effi-
cient when reading text, while individual learners who
favour visual-spatial processing may be more efficient
when reading a map.
Asymmetrical Spatial Learning
Asymmetrical brains provide an advantage for map readers
by representing characteristics of mapped objects and rela-
tionships among these objects simultaneously as category
and coordinate information (Jager and Postma 2003).
David Patton and Robert Lloyd (2009) found evidence
supporting asymmetrical differences between participants
who searched a small-scale map for well-known cities
and those who searched for novel cities. Their results
suggest that participants who searched for known cities
encoded coordinate information, while those who searched
for the novel cities encoded categorical information, and
demonstrated a sex-related bias in encoding tendencies
between female participants (categorical) and male parti-
cipants (coordinate). The current study further examines
asymmetrical learning using more complex map and text
combinations that present opportunities to learn both
spatial and non-spatial information.
Individual Differences of Map Learnersand Performance
Any study involving map use needs to take into con-
sideration the differences among the individuals who use
the map. In this section, we review evidence that gender,
working memory capacity, hand-digit ratios, and cogni-
tive styles are likely to influence spatial learning.
gender identity or sex?
Numerous cognition studies have used sex as a measure
of individual differences among participants (Halpern
2000; Kimura 2000). Some researchers have argued that
a classification based on sex is limiting and that gender
identification provides a more meaningful perspective for
cognition studies (Hardwick and others 2000; Lloyd and
Bunch 2008). Studies considering gender have demon-
strated that female participants who score high on the
Robert Earl Lloyd and Rick L. Bunch
170 cartographica (volume 45, issue 3)

masculinity scale also score higher on a variety of spatial
performance tasks (Signorella and Jamison 1986). It is also
true that extended practice on spatial tasks can enhance
overall performance and that female gender identity can
guide interests that lead to such practice (Lloyd, Hodgson,
and Stokes 2002; Casey 1996; Patton and Lloyd 2009).
Deborah Saucier and others (2002) found that gender-
role socialization mediates sex differences in spatial tasks
requiring mental rotation. Lloyd and Bunch (2008) used
the Bem Sex Role Inventory (Bem 1974) to measure
masculinity and femininity scales for participants viewing
a map of the US states; that study reported better per-
formance for participants who scored high on both the
masculinity and femininity scales, and higher accuracy
for those who scored lower on both the masculinity and
femininity scales. The current research considers the
influence of gender identity on spatial learning involving
map and text combinations.
working memory capacity
Alan Baddeley’s (2003) multi-component model of work-
ing memory contains a component for processing visual
information (the ‘‘visuospatial sketchpad’’) and a separate
component for processing verbal information (the ‘‘pho-
nological loop’’) that have a limited storage capacity.
Cognitive load theory (CLT) explains how people use
both visual-spatial and verbal information during learning
and problem solving (Sweller 1988; Bunch and Lloyd
2006). A key proposition of CLT is that working memory
has a limited capacity but connects to unlimited long-
term memory (Sweller 1988; Baddeley 1998). Tests of
working memory span partially explain variations in
performance on real-world cognitive tasks (Fischer 2001;
Cowan and Morey 2006). Lloyd and Bunch (2008) report
a significant relationship between performance accuracy
on a search task and the results of verbal- and spatial-
memory-span tests. The current study uses working-
memory-span tests to explore spatial learning with a map
and text.
hand-digit ratios and asymmetrical brains
Cognitive abilities affected by sex hormones have both
lifelong organizational and short-term activational effects
on behaviour (Kimura 1989; Falter, Arroyo, and Davis
2006). Scott Bell and Deborah Saucier (2004), based on
their study of activational effects, suggest that optimal
performance on a spatial task occurs with moderate levels
of testosterone; this moderate level is relatively low for
men and relatively high for women. Catherine Gouchie
and Doreen Kimura (1991) report the same pattern, with
higher-testosterone women and lower-testosterone men
exhibiting better spatial abilities.
Exposure to prenatal sex hormones affects asymmetries in
the human body, including how the brain is structured
(Manning and others 1998; Janowsky 2006). Researchers
consider the ratio of the second digit to the fourth digit
on the hand (the 2D/4D ratio) as a biomarker to identify
brain asymmetry. Prenatal testosterone slows the growth
rate of the left side of the brain while enhancing growth of
the right side (Brosnan 2006); the length of the fourth digit
(ring finger) is an index of prenatal testosterone exposure,
and the length of the second digit (index finger) is an index
of prenatal oestrogen exposure. The 2D/4D ratio, therefore,
provides an index of asymmetrical development of the
brain hemispheres. Men generally have a significantly
lower mean 2D/4D ratio than women (Loehlin and others
2006). Studies have also linked the 2D/4D ratio to the
variation of spatial abilities (Coolican and Peters 2003;
Csatho and others 2003; Falter and others 2006). Lloyd
and Bunch (2008) report results indicating that the 2D/4D
ratio interacted with both gender and working memory
capacity to explain reaction time and accuracy in a search
for target states on a US map.
cognitive styles—empathizing and systemizing
Another promising way of looking at individual differ-
ences has been termed ‘‘cognitive style.’’1 In broader
terms, cognitive style might be thought of as the way in
which a person approaches the world and solves prob-
lems. The origin of the ‘‘empathizing–systemizing’’ theory
of psychological sex differences is in autism-disorder studies
presented by Simon Baron-Cohen and colleagues. Em-
pathizing and systemizing are two different dimensions
measured by an empathy quotient (EQ) and a systemiz-
ing quotient (SQ) respectively (Baron-Cohen and others
2003; Baron-Cohen and Wheelwright 2004). People who
score high on the EQ have a cognitive style that drives
them to identify another person’s emotions and thoughts,
while people who score high on the SQ have a cognitive
style that drives them to analyse or construct systematic
relationships in non-social domains. Both women and
men show a range of variation on both EQ and SQ dimen-
sions, but women score on average higher than men in
empathizing and men higher than women in systemizing
(Nettle 2007). Other studies (Billington, Baron-Cohen,
and Wheelwright 2007; Focquaert and others 2007) have
reported that, on average, those interested in the humani-
ties favour an empathizing style while those interested in
sciences favour a systemizing style, regardless of sex.
Studies on cognitive style that connect spatial learning
with maps are rare. One exception (Billington, Baron-
Cohen, and Bor 2008) considered participants with a
range of scores on the SQ using an experimental task
that elicited a conflict by having participants search for a
target found at a global or local level (i.e., large letters
made from small letters). They expected that an indi-
vidual with a high systemizing style would be proficient
in analysing the rules of a system. They report that par-
ticipants with higher SQ scores appeared to focus their
Learning Geographic Information from a Map and Text: Learning Environment and Individual Differences
Cartographica (volume 45, issue 3) 171
attention on local details and performed the search task
with more success when the target was at the local level.
Map learners with high SQ scores may have more interest
in and experience with information displayed on maps
than map learners with high EQ scores do. The current
research considers the potentially interesting relationships
between cognitive styles and spatial learning using map
and text combinations.
Research Design
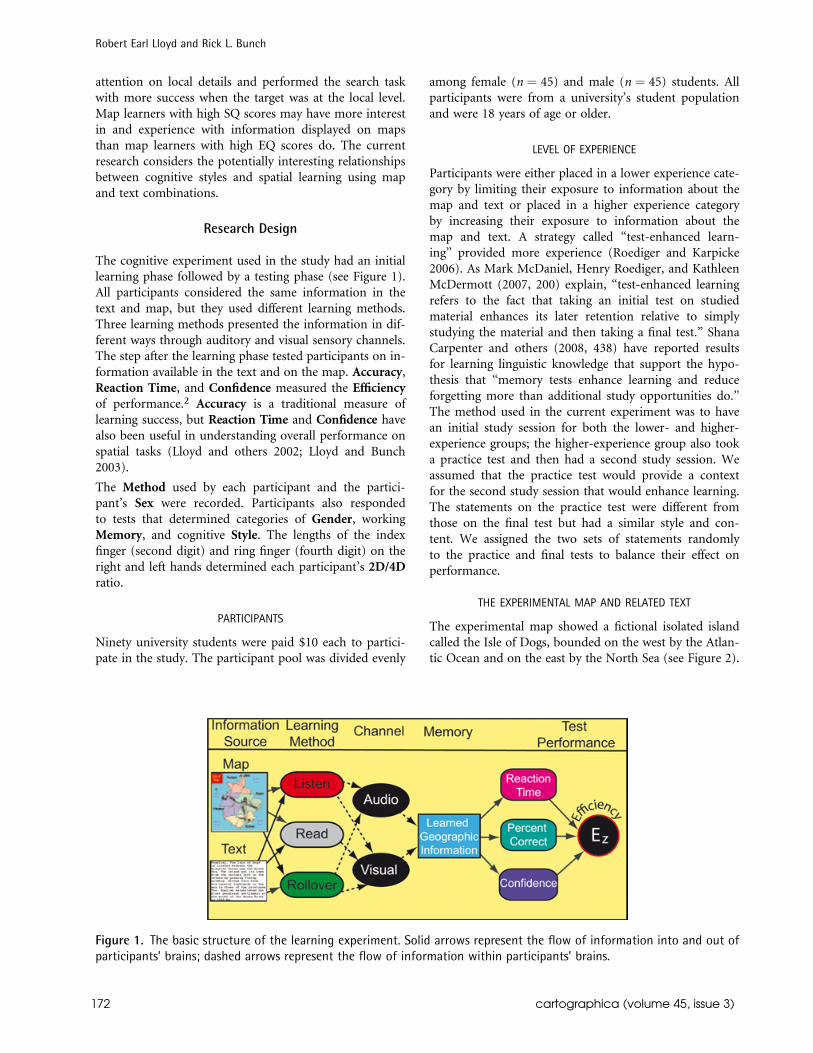
The cognitive experiment used in the study had an initial
learning phase followed by a testing phase (see Figure 1).
All participants considered the same information in the
text and map, but they used different learning methods.
Three learning methods presented the information in dif-
ferent ways through auditory and visual sensory channels.
The step after the learning phase tested participants on in-
formation available in the text and on the map. Accuracy,
Reaction Time, and Confidence measured the Efficiency
of performance.2 Accuracy is a traditional measure of
learning success, but Reaction Time and Confidence have
also been useful in understanding overall performance on
spatial tasks (Lloyd and others 2002; Lloyd and Bunch
2003).
The Method used by each participant and the partici-
pant’s Sex were recorded. Participants also responded
to tests that determined categories of Gender, working
Memory, and cognitive Style. The lengths of the index
finger (second digit) and ring finger (fourth digit) on the
right and left hands determined each participant’s 2D/4D
ratio.
participants
Ninety university students were paid $10 each to partici-
pate in the study. The participant pool was divided evenly
among female (n ¼ 45) and male (n ¼ 45) students. All
participants were from a university’s student population
and were 18 years of age or older.
level of experience
Participants were either placed in a lower experience cate-
gory by limiting their exposure to information about the
map and text or placed in a higher experience category
by increasing their exposure to information about the
map and text. A strategy called ‘‘test-enhanced learn-
ing’’ provided more experience (Roediger and Karpicke
2006). As Mark McDaniel, Henry Roediger, and Kathleen
McDermott (2007, 200) explain, ‘‘test-enhanced learning
refers to the fact that taking an initial test on studied
material enhances its later retention relative to simply
studying the material and then taking a final test.’’ Shana
Carpenter and others (2008, 438) have reported results
for learning linguistic knowledge that support the hypo-
thesis that ‘‘memory tests enhance learning and reduce
forgetting more than additional study opportunities do.’’
The method used in the current experiment was to have
an initial study session for both the lower- and higher-
experience groups; the higher-experience group also took
a practice test and then had a second study session. We
assumed that the practice test would provide a context
for the second study session that would enhance learning.
The statements on the practice test were different from
those on the final test but had a similar style and con-
tent. We assigned the two sets of statements randomly
to the practice and final tests to balance their effect on
performance.
the experimental map and related text
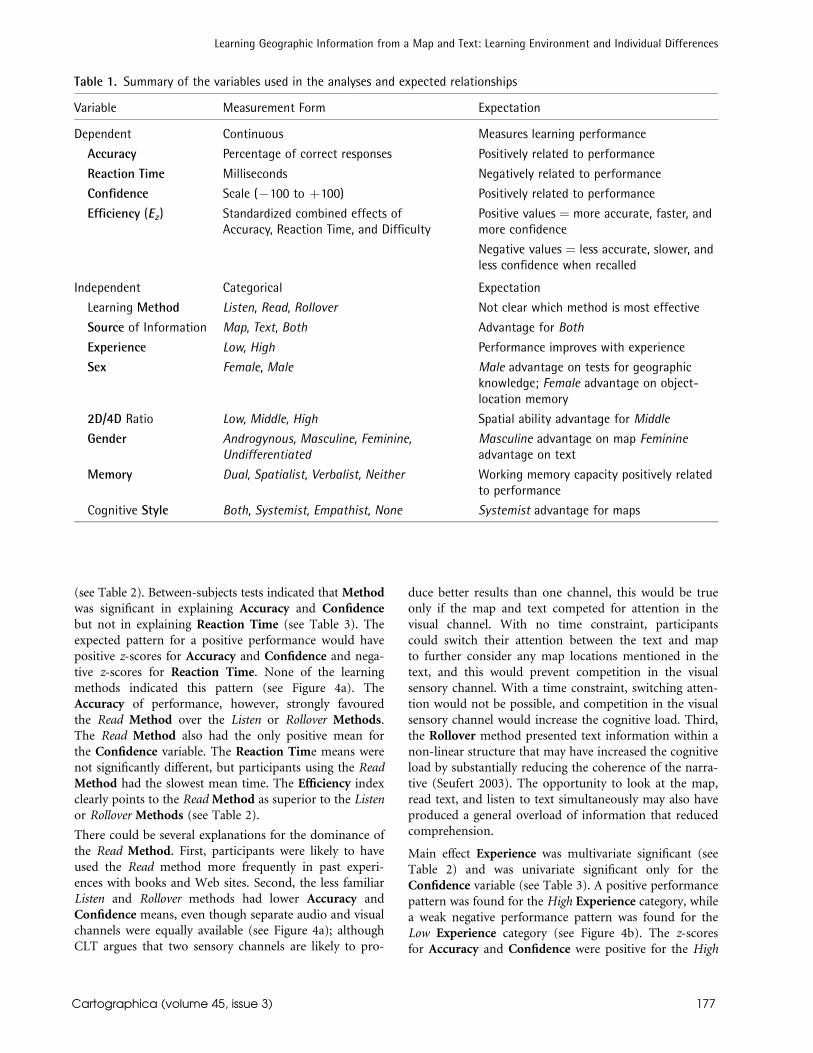
The experimental map showed a fictional isolated island
called the Isle of Dogs, bounded on the west by the Atlan-
tic Ocean and on the east by the North Sea (see Figure 2).
Figure 1. The basic structure of the learning experiment. Solid arrows represent the flow of information into and out ofparticipants’ brains; dashed arrows represent the flow of information within participants’ brains.
Robert Earl Lloyd and Rick L. Bunch
172 cartographica (volume 45, issue 3)

Other areas on the island were four named provinces,
shown in different hues. Each province was subdivided
into a number of unnamed counties, with named larger
cities and unnamed smaller cities. Other point symbols
for several cities represented economic activities. Linear
features on the map represented an unnamed highway
system and named rivers.
The narrative text with the accompanying map discussed
physical, cultural, and travel information associated with
the Isle of Dogs (see Appendix). The text supplied both
spatial and non-spatial information that in some cases
was also available on the map and in other cases was
novel information.
learning methods
Three learning methods exposed the participants to both
the map and the text, but in different ways. Study sessions
had no time limits and proceeded at a pace set by the par-
ticipant. Participants using the reading method had the
map (Figure 2) available on the left of the screen and the
text information on the right. Each study session pre-
sented the physical, cultural, and travel information in a
random sequence controlled by the participant. Partici-
pants using the reading method were constrained to read-
ing the physical, cultural, and travel information in only
two random sequences representing one study session.
Participants would use the visual channel to process infor-
mation from the map and the text (see Figure 1). CLT
argues that learning may be constrained if two sources of
information compete for a single channel under time con-
straints (Bunch and Lloyd 2006; Harrower 2007). Since
participants using the reading method were not under a
time constraint, they could visually and consciously attend
to either the map or the text.
Participants using the listening method had the map
(Figure 2) available on the left of the screen without any
visible text information on the screen. Instead, the phy-
sical, cultural, and travel text played through audio in a
random sequence controlled by selecting a ‘‘next’’ button.
Since each individual recording continued playing when
started by a participant, the information was available in
fixed blocks of time. As in the reading method, partici-
pants using the listening method could hear the recording
in only two random sequences per study session. The
Figure 2. Experimental map learned by participants using all learning methods
Learning Geographic Information from a Map and Text: Learning Environment and Individual Differences
Cartographica (volume 45, issue 3) 173

listening method represented a less traditional method,
but one that made the spatial and non-spatial information
available in two separate channels (see Figure 1). CLT
argues learning can be enhanced if information coming
from two sources can be provided in separate audio and
visual channels (Mayer and Moreno 2003; Bunch and
Lloyd 2006; Harrower 2007). The ability to focus visual
attention on the map and audio attention on the recorded
text simultaneously could potentially enhance learning.
Participants using the rollover method initially viewed
a map without text (Figure 2). The map, however, con-
tained rollover buttons that revealed text information
describing the physical, cultural, and travel characteristics
of particular locations. At the same time, a recording of
the displayed text played through audio. Participants could
control access by rolling over buttons in any sequence,
but they were limited to two sequences per button. The
rollover method created an interactive map whereby
participants could connect map locations with text infor-
mation provided separately through visual and audio
channels.
It has been reported that ‘‘difficulty in learning new con-
cepts can be alleviated by making text more cohesive which
makes readers less dependent on pre-existing knowledge’’
(Ozuru, Dempsey, and McNamara 2009, 239). Some re-
searchers have also suggested that non-linear text presen-
tations increase the cognitive load for audiences without
prior knowledge (Amadieu and others 2009; Calisir and
Gurel 2009). Since participants in this study had no prior
knowledge of the target content, the less cohesive rollover
method may have increased the cognitive load.
testing for knowledge learned
Participants evaluated statements presented on both the
practice and final tests as true or false. The knowledge
required to evaluate the statement was available with
equal frequency from the text only, from the map only,
or from both text and map. Some statements featured
non-spatial information, and some featured spatial infor-
mation. For example, the statement ‘‘The Isle of Dogs
was uninhabited before 1022 AD’’ features non-spatial
information that was only available from the text; the
statement ‘‘The city of Kenly is west of the Lundy River’’
features spatial information that was available only from
the map; and the statement ‘‘The Isle of Dogs has four
provinces’’ is based on information both on the map and
in the text. The initial statements had important featured
information missing. For example, ‘‘The Atlantic Ocean
is of the Isle of Dogs’’ would initially appear; the
participant clicked on the statement after reading it, and
the featured information ‘‘east’’ would then complete the
statement, allowing the participant to determine the true/
false evaluation. The reaction time clock started when
the featured information appeared and stopped when the
evaluation was completed. This procedure did not count
the time required to read the initial statement as part of
the response time.
Variables
performance variables
Accuracy, Reaction Times, and Confidence collectively
measured performance on the final test (see Table 1).
Figure 3. Percentage of participants in Female and Malecategories for the variables 2D/4D (a), Gender (b), Memory(c), and Style (d)
Robert Earl Lloyd and Rick L. Bunch
174 cartographica (volume 45, issue 3)

These variables previously have measured different dimen-
sions of performance with success (Lloyd and others 2002;
Lloyd and Bunch 2003, 2005; Bunch and Lloyd 2006).
We expected a positive performance to be accurate, fast,
and confident. We expected a negative performance to be
inaccurate, slow, and unconfident.
The experiment measured Reaction Time in milliseconds,
Accuracy as percent correct, and Confidence as ratings on
a scale of �100 to 100. These three variables combined
to compute a standardized measure of learning Efficiency
(E z). Fred Paas and Jeroen van Merrienboer (1993) provide
a method for computing and visualizing the relationship
between two measurements – mental effort and perfor-
mance. Their method computes z-scores for performance
and mental effort, which are used to derive an instruc-
tional efficiency score (E). E is the perpendicular distance
between the x, y coordinate locations of the z-scores and a
diagonal line representing where E is equal to 0.
We have adapted this method to include the computation
of z-scores for the three measurements of Accuracy (Az),
Reaction Time (RTz), and Confidence (Cz):
Ez ¼Az � RTz þ Cz
ffiffiffi
3p (1)
In this study, Ez was measured as the perpendicular dis-
tance between the data point for an observation and the
neutral line where Ez ¼ 0 along the x, y, and z axes. Effi-
cient learning increases as Ez becomes more positive and
decreases as it becomes more negative. The Ez score can
be used as a final measure of overall learning success by
combining and analysing Accuracy, Reaction Time, and
Confidence (see Figure 1 and Table 1).
variables related to the learning environment
The research design imposed three learning environment
variable on the participants (see Table 1) and assigned
each participant to a Method category. The variable
Experience represents the level of experience acquired
by each participant, and the Source of the information
indicates the origin of information.
individual difference variables
We measured individual differences among the parti-
cipants in categorical form to serve as main effects in a
statistical model (see Table 1). We recorded the Sex of
participants and also measured each participant’s response
to questions for the Bem Sex Role Inventory (Bem 1974)
to measure Gender identity (see Table 1). Performance
also relates to working memory capacity (Baddeley 2003).
We used span tests to measure verbal and spatial work-
ing memory capacities and assigned each participant to a
working Memory capacity category. Previous research has
related asymmetrical brain structure and a preference for
using verbal or spatial processes in problem solving to
the ratio of the second and fourth digits of the hand
(Manning 2002). We measured the lengths of the second
and fourth digits on both hands and computed the
average ratio for each participant; participants were then
Figure 4. Performance variable means for learningenvironment variables: learning Method (a), level ofExperience (b), and Source of information (c).
Learning Geographic Information from a Map and Text: Learning Environment and Individual Differences
Cartographica (volume 45, issue 3) 175

assigned to Low, Middle, or High categories based on their
2D/4D ratios (see Table 1). Simon Baron-Cohen (2002,
2003) has suggested connections among cognitive styles
related to empathy and systemizing, sex differences, and
task performance. We measured both the Empathy Quo-
tient (EQ) and the Systemizing Quotient (SQ) for each
participant and used the EQ and SQ scores to determine
a cognitive Style category for each participant (see Table 1).
Analyses
The first set of analyses considered the relationship between
Sex and the other individual difference variables: 2D/4D
ratio, Gender, working Memory capacity, and cognitive
Style. A multivariate analysis of variance (MANOVA) using
three performance measurements as the dependent varia-
bles and the learning environment and individual differ-
ence variables as main effects was the final analysis.
sex and other individual differences
Figure 3 illustrates associations between categories of Sex
(Female and Male) and categories for individual difference
variables. The association between Sex and 2D/4D cate-
gories was significant (w2 ¼ 9.6, p ¼ 0.008), and the dis-
tribution of Female and Male participants within the three
2D/4D categories suggests a meaningful pattern: Female
participants have High 2D/4D ratios, while Male partici-
pants have Low 2D/4D ratios (see Figure 3a), a pattern
supported by the findings of previous research (Loehlin
and others 2006). The relationship between the 2D/4D ratio
and spatial abilities, however, appears to be non-linear
when considering Sex. It has been hypothesized that men
and women in the Middle 2D/4D category would have
better performance scores on spatial tasks (Sanders, Sjodin,
and Chastelaine 2002; Falter and others 2006).
As one might expect, there was a significant relation-
ship between the Sex and Gender categories (w2 ¼ 15.2,
p ¼ 0.002). Although Female individuals were most fre-
quently associated with the Feminine category and Male
participants with the Masculine category, both sexes
appeared in all four Gender categories (see Figure 3b).
These results indicate a significant overlap between the
Sex and Gender categories.
Male and Female participants were distributed in a simi-
lar fashion within the working Memory categories (see
Figure 3c). The data do not support a Female advantage
for verbal working memory or a Male advantage for
spatial working memory (w2 ¼ 1.5, p ¼ 0.670).
Sex and cognitive Style were significantly related (w2 ¼14.8, p ¼ 0.002). Female participants were more fre-
quently represented in the Empathist and None categories,
while Male participants were more frequently represented
in the Systemist and Both categories (see Figure 3d). The
Systemist category had fewer Female participants, and the
Empathist category had fewer Male participants.
manova results
The learning Method used by participants was found to
be multivariate significant in explaining test performance
Figure 5. Performance variable means for individualdifference variables: 2D/4D ratio (a), working Memorycapacity (b), and cognitive Style (c).
Robert Earl Lloyd and Rick L. Bunch
176 cartographica (volume 45, issue 3)
(see Table 2). Between-subjects tests indicated that Method
was significant in explaining Accuracy and Confidence
but not in explaining Reaction Time (see Table 3). The
expected pattern for a positive performance would have
positive z-scores for Accuracy and Confidence and nega-
tive z-scores for Reaction Time. None of the learning
methods indicated this pattern (see Figure 4a). The
Accuracy of performance, however, strongly favoured
the Read Method over the Listen or Rollover Methods.
The Read Method also had the only positive mean for
the Confidence variable. The Reaction Time means were
not significantly different, but participants using the Read
Method had the slowest mean time. The Efficiency index
clearly points to the Read Method as superior to the Listen
or Rollover Methods (see Table 2).
There could be several explanations for the dominance of
the Read Method. First, participants were likely to have
used the Read method more frequently in past experi-
ences with books and Web sites. Second, the less familiar
Listen and Rollover methods had lower Accuracy and
Confidence means, even though separate audio and visual
channels were equally available (see Figure 4a); although
CLT argues that two sensory channels are likely to pro-
duce better results than one channel, this would be true
only if the map and text competed for attention in the
visual channel. With no time constraint, participants
could switch their attention between the text and map
to further consider any map locations mentioned in the
text, and this would prevent competition in the visual
sensory channel. With a time constraint, switching atten-
tion would not be possible, and competition in the visual
sensory channel would increase the cognitive load. Third,
the Rollover method presented text information within a
non-linear structure that may have increased the cognitive
load by substantially reducing the coherence of the narra-
tive (Seufert 2003). The opportunity to look at the map,
read text, and listen to text simultaneously may also have
produced a general overload of information that reduced
comprehension.
Main effect Experience was multivariate significant (see
Table 2) and was univariate significant only for the
Confidence variable (see Table 3). A positive performance
pattern was found for the High Experience category, while
a weak negative performance pattern was found for the
Low Experience category (see Figure 4b). The z-scores
for Accuracy and Confidence were positive for the High
Table 1. Summary of the variables used in the analyses and expected relationships
Variable Measurement Form Expectation
Dependent Continuous Measures learning performance
Accuracy Percentage of correct responses Positively related to performance
Reaction Time Milliseconds Negatively related to performance
Confidence Scale (�100 to þ100) Positively related to performance
Efficiency (Ez) Standardized combined effects ofAccuracy, Reaction Time, and Difficulty
Positive values ¼ more accurate, faster, andmore confidence
Negative values ¼ less accurate, slower, andless confidence when recalled
Independent Categorical Expectation
Learning Method Listen, Read, Rollover Not clear which method is most effective
Source of Information Map, Text, Both Advantage for Both
Experience Low, High Performance improves with experience
Sex Female, Male Male advantage on tests for geographicknowledge; Female advantage on object-location memory
2D/4D Ratio Low, Middle, High Spatial ability advantage for Middle
Gender Androgynous, Masculine, Feminine,Undifferentiated
Masculine advantage on map Feminineadvantage on text
Memory Dual, Spatialist, Verbalist, Neither Working memory capacity positively relatedto performance
Cognitive Style Both, Systemist, Empathist, None Systemist advantage for maps
Learning Geographic Information from a Map and Text: Learning Environment and Individual Differences
Cartographica (volume 45, issue 3) 177

category and negative for the Low category, but Reaction
Time means were virtually zero for both Low and High
Experience categories. The Efficiency index indicated a
relatively small advantage of High over Low Experience
(see Table 2). It is no surprise to find that added Experi-
ence resulted in elevated levels of performance, especially
since other studies have also found that practice tests
enhance learning (McDaniel and others 2007).
Main effect Source was marginally multivariate significant
(see Table 2). Between-subjects tests indicated a univariate
significant difference only for the Accuracy variable (see
Table 3). A positive performance pattern was found for
the Text category, while the Map category showed a nega-
tive performance pattern (see Figure 4c). The Both cate-
gory means had a positive z-score for Confidence and a
negative z-score for Reaction Time, but the Accuracy
mean had the wrong sign for a positive performance. The
Efficiency index indicates Text as the best Source for
information and the Map as the worst Source (see Table 2).
Learners appear to have been able to glean information
from the Text more successfully than from the Map. The
salience of the information in the Text and on the Map
may explain this pattern. Participants may have con-
sidered specific information in the text important to learn
simply because it was stated explicitly. For example, the
text explicitly states that the first settlement on the island
was in AD 1022 (1022 CE). The relative importance of
specific information on the map may be less obvious. For
example, none of the rivers flow through Nussex; this
information is on the map, but not in the text, and a
participant may not even notice this fact or consider it
important.
Individual difference effects are 2D/4D ratio, working
Memory capacity, cognitive Style, Sex, and Gender. The
main effect 2D/4D ratio was multivariate significant (see
Table 2). Between-subjects tests indicated a univariate
significant difference only for the Confidence variable
(see Table 3). None of the 2D/4D ratio categories indi-
Table 2. Multivariate significance test for significant differences using standardized Accuracy, Reaction Time, andConfidence as simultaneous dependent variables
Effect Pillai’s TraceF Statistic
Probability>F
Efficiency*Ez
Learning Method 14.1 0.000 Listen ¼ �0.261Read ¼ 0.536Rollover ¼ �0.262
Level of Experience 3.3 0.020 Low ¼ �0.186High ¼ 0.199
Source of information 2.1 0.051 Map ¼ �0.265Text ¼ 0.180Both ¼ 0.085
Sex 0.9 0.455 Female ¼ �0.162Male ¼ 0.166
2D/4D Ratio 2.2 0.042 Low ¼ 0.031Middle ¼ �0.227High ¼ 0.219
Working Memory capacity 5.3 0.000 Dual ¼ 0.231Spatialist ¼ 0.058Verbalist ¼ �0.552Neither ¼ 0.117
Gender 1.8 0.064 Androgynous ¼ 0.043Masculine ¼ 0.093Feminine ¼ �0.199Undifferentiated ¼ 0.233
Cognitive Style 3.0 0.002 Both ¼ 0.137Systemist ¼ 0.276Empathist ¼ �0.217None ¼ �0.152
* The highest positive Efficiency value for each category relating to each effect is highlighted in boldface type.
Robert Earl Lloyd and Rick L. Bunch
178 cartographica (volume 45, issue 3)

cated a positive or negative performance pattern (see
Figure 5a). The best Efficiency score was associated with
the High 2D/4D category (see Table 2).
The significance of the 2D/4D ratio effect produced an
unexpected result (see Table 2): the best overall perfor-
mance on the final test was associated with the High
category. The 2D/4D ratio correlates with an asymmetri-
cal development of the processes in the right and left
hemispheres of the brain through exposure to prenatal
hormones. Earlier studies have suggested a non-linear
relationship between the 2D/4D ratio and spatial abilities,
leading to the expectation that the Middle category might
be associated with superior task performance. The current
experimental task involved learning information rather
than performing a perceptual task; the association of the
High 2D/4D ratio category with higher levels of perfor-
mance would appear to indicate that verbal processes in
the left hemisphere were more useful for the experimental
task.
The main effect for working Memory capacity was multi-
variate significant in explaining Accuracy, Reaction Time,
and Confidence (see Table 2). Between-subjects tests in-
dicated a univariate significant difference for the Reaction
Time and Confidence variables (see Table 3). None of the
working Memory capacity categories indicated an ideal
positive or negative performance pattern (see Figure 5b).
The Efficiency scores produced an interesting pattern for
the working Memory capacity categories (see Table 2):
the Verbalist category had the only negative value.
Working Memory capacity was independent of Sex and
had the strongest effect on performance (see Figure 3 and
Table 2). The Dual category was associated with the most
positive overall performance on the final test. Since parti-
cipants had better-than-median Spatial and Verbal work-
ing Memory capacity, this might be expected. The very
negative performance associated with the Verbalist cate-
gory connected to a very slow mean Reaction Time and
a very low mean Confidence (see Figure 4). It is possible
that a higher capacity for working with verbal information
and a lower capacity for working with spatial informa-
tion resulted in a tendency for these participants to focus
their attention on processing verbal information, which
may have been a disadvantage in a learning task involving
a map and large amounts of spatial information.
The main effect cognitive Style was also multivariate sig-
nificant (see Table 2). Between-subjects tests indicated a
univariate significant difference only for the Confidence
variable (see Table 3). The Systemist Style indicated the
pattern for a positive performance, and the Empathist
Style a pattern for a negative performance (see Figure
Table 3. Univariate significance between-participants test for significant differences using standardized Accuracy,Reaction Time, and Confidence individually as dependent variables.
Effect Accuracy FStatistic(Probability > F )
Reaction Time FStatistic(Probability > F )
Confidence FStatistic(Probability > F )
Learning Method(Listen, Read, Rollover )
49.0 (0.000) 0.327 (0.721) 4.7 (0.010)
Level of Experience(Low, High )
2.4 (0.125) 0.001 (0.978) 9.3 (0.003)
Source of information(Map, Text, Both )
3.8 (0.023) 2.3 (0.101) 1.2 (0.289)
Sex(Female, Male )
0.114 (0.736) 0.141 (0.708) 2.6 (0.109)
2D/4D Ratio(Low, Middle, High )
0.8 (0.464) 0.054 (0.947) 6.6 (0.002)
Working Memory capacity(Dual, Spatialist, Verbalist, Neither )
0.84 (0.472) 8.9 (0.000) 8.1 (0.000)
Gender(Androgynous, Masculine, Feminine,Undifferentiated )
1.2 (0.315) 2.3 (0.076) 1.6 (0.186)
Cognitive Style(Both, Systemist, Empathist, None )
1.5 (0.227) 1.2 (0.300) 5.6 (0.001)
Learning Geographic Information from a Map and Text: Learning Environment and Individual Differences
Cartographica (volume 45, issue 3) 179

5c). These two categories were also associated with the
most positive and negative Efficiency scores (see Table 2).
Cognitive Style was a significant effect, and, as expected,
the Spatialist category was associated with the best positive
performance (see Table 2). The means for the Spatialist
category also showed a pattern of high Accuracy, fast
Reaction Time, and high Confidence (see Figure 5c).
This result supports the argument that cognitive style
may play an important role in models explaining spatial
learning.
The remaining individual difference effects, Sex and
Gender, were not multivariate significant (see Table 2).
Between-subjects tests also indicated no univariate signifi-
cant differences for Sex or Gender categories (see Table 3).
The nature of the learning task is one possible explanation
for this lack of significance: several studies have shown a
male advantage for naming places on world maps and a
female advantage for tasks involving the recall of object
locations in a spatial array (Dabbs and others 1998; Voyer
and others 2007). The tasks for this experiment required
learning both spatial and non-spatial information, very
different from the previous studies, which have focused
on isolating cognitive processes by task and sex. Other
studies have also demonstrated a male advantage on visual
tasks and a female advantage on verbal tasks (Halpern
2000; Kimura 2000). In this study, participants needed to
use both visual and verbal processes to acquire informa-
tion from the text and map. The expected advantages for
female and male learners may ultimately have balanced
out in considerations of overall performance because
each group was required to consider both types of infor-
mation. Gender was marginally significant (see Table 2).
It is interesting to find that the Gender category Undiffer-
entiated showed the most positive Efficiency score and the
best overall performance.
Conclusions
Both learning-environment and individual-difference varia-
bles affected map learning. We assumed that the ideal
positive performance would be accurate, fast, and confi-
dent; for the eight ‘‘winning’’ categories having the highest
Efficiency for each effect (see Table 2), only half had col-
lective ideal z-score mean patterns (i.e., positive values for
Accuracy, negative values for Reaction Time, and positive
values for Confidence). Three of the four that did not
show the ideal pattern (Read Method, High 2D/4D ratio,
and Undifferentiated Gender) had relatively slow Reaction
Time means. Although it seems reasonable to consider
an accurate, fast, and confident performance as the ideal
positive pattern, accurate and confident performances
also occur with slower reaction times. This might be the
case if the information needed to evaluate a statement
as true or false is voluminous, not well organized in
memory, or not completely coded. Reaction times for
simple tasks such as searching visual displays or for com-
plex athletic performances are known to decrease with
practice (Wilson, MacLeod, and Muroi 2008; Yarrow,
Brown, and Krakauer 2009). The time needed to search
one’s memory for the information learned from the
experimental map and text is also likely to decrease with
more experience.
There was no clear expectation as to which learning
Method would produce the best performance on the
final test. The more traditional method of acquiring new
information (i.e., reading a text with a map) clearly pro-
duced the best performance (see Table 2 and Figure 4a).
A familiarity advantage over other methods may partially
explain the success of the traditional method, but its suc-
cess may also be related to constraint differences between
the Read and Listen Methods and coherence differences
between the Read and Rollover Methods.
Experience and test performance should be positively
related. This common-sense expectation was verified (see
Table 2 and Figure 4b). The significant difference between
the two Experience categories also supports the use of a
practice test to boost learning when study time is limited.
It was expected that the Both category would be the
Source of information associated with the best perfor-
mance. This expectation stemmed from the idea that
redundant information in the text and on the map would
increase the likelihood of successful learning. The Both
category did have a positive Efficiency value, so this
expectation may be correct; however, the Text Source
had the highest Efficiency value. A simple explanation for
this advantage relates to the nature of information in the
Text-only category. Information available in the Text and
on the Map was spatial information, while information
available only in the Text was non-spatial informa-
tion. Learning non-spatial information is apparently easier
than learning redundant spatial information. The diffi-
culty of learning spatial information may also explain the
low Accuracy, low Confidence, and slow Reaction Time
means for the Map Source category (see Figure 4c).
Finally, participants may have found it easier to judge
what was worth learning from the text than to decide
what was worth learning from the map.
In general, women have an advantage in processing verbal
information while men have advantage in processing
visual-spatial information. Men also tend to score higher
on tests of geographic knowledge, while women are better
at learning the locations of objects in a space (Zinser,
Palmer, and Miller 2004; Voyer and others 2007). Sex,
however, was not a multivariate significant effect explain-
ing performance in the present study (see Table 2).
Because the information to learn was both on a map
and in a text, the reported female and male advantages
on previous isolated tasks may have been neutralized.
Robert Earl Lloyd and Rick L. Bunch
180 cartographica (volume 45, issue 3)

The literature indicates that men with higher-than-
average 2D/4D ratios and women with lower-than-
average 2D/4D ratios perform better on some spatial
tasks, such as mental rotation and navigation (Coolican
and Peters 2003; Csatho and others 2003). An expectation
that participants in the Middle of the 2D/4D ratio distri-
bution would also perform better on the current experi-
mental learning task proved not to be correct. Individuals
with High 2D/4D ratio have asymmetrical brains favour-
ing systems in the left hemisphere. This provided a clear
advantage in learning the map and text. Systems pro-
cessing verbal and categorical spatial information were
more important for the current learning task than right-
hemisphere systems that support perceptual tasks. This
finding indicates that asymmetrical brains may have an
advantage for a range of spatial tasks, but not always in
the same way.
Gender was not a multivariate significant effect in con-
sidering performance variables (see Table 2). The same
argument as to why Sex was not significant may also
apply to Gender: if participants in the Masculine cate-
gory had better spatial abilities while participants in the
Feminine category had better verbal abilities, the separate
advantages may have cancelled each other out for the
complete task. The fact that the Undifferentiated Gender
category showed the highest Accuracy mean also supports
this notion.
Larger working Memory capacity should aid performance.
This hypothesis was generally supported for the current
task, as the Dual category had the highest Efficiency score
(see Table 2). Given that both spatial and non-spatial ver-
bal information were available to learn, it seems reason-
able that additional verbal and spatial working Memory
capacity would be beneficial.
The nature of the experimental task suggested that a cog-
nitive Style that focuses on understanding how systems
work would be superior to a cognitive Style that focuses
on other people’s emotions and thoughts. The multi-
variate significance of the cognitive Style effect and the
high Efficiency score for the Systemist category support
this expectation (see Table 2).
Experimental research that considers environments that
reflect real situations faced by map users should be
interesting to those interested in how people learn with
maps. Future studies should consider a range of learning
methods and how such methods interact with various
individual-difference variables and spatial tasks. For ex-
ample, tracking eye movements could supply data on
what type of information attracts attention and for how
long (Holsanova, Holmberg, and Holmqvist 2009). The
current study focused on examining explicit map-learning
tasks that closely resemble the learning environment
found in most typical classrooms. Future studies might
expand this contribution to include an examination of
how the individual differences of learners and map tasks
influence implicit learning.
Experimental research should also interest those con-
cerned with the design of maps for use by map readers
with special needs (e.g., tactile maps). It should also be
possible to design maps for map readers with special
advantages. Considering the effects of individual differ-
ences on performance will help in identifying less obvious
needs and advantages for particular map types. In the
future, it may be possible to systematically design maps
tailored specifically to meet the needs of targeted age
groups, map-reading levels, or cognitive styles. Maps
designed to fit the cognitive profiles of users could pro-
vide more certainty about their effectiveness. The cycle of
experimentation, exploration of instructional methods,
assessment of performance, and modification of map
designs would eventually lead to improved instruction,
map learning, and map-design protocols.
Author Information
Robert Earl Lloyd, Adjunct Professor, Department of
Geography, University of North Carolina, Greensboro,
NC 27412 USA. E-mail: [email protected].
Rick L. Bunch, Associate Professor, Department of Geo-
graphy, University of North Carolina, Greensboro, NC
27412 USA. E-mail: [email protected].
Notes
1. The term ‘‘style’’ is used in other contexts – for example,learning style based on a preference for using visual orverbal information (Graf, Lin, and, Kinshuk 2008).
2. Names of variables in the text appear in bold type;categories of these variables appear in italics. For exam-ple, Female and Male are categories of the variable Sex.
References
Amadieu, F., T. van Gog, F. Paas, A. Tricot, and C. Marine.2009. ‘‘Effects of Prior Knowledge and Concept-Map Struc-ture on Disorientation, Cognitive Load, and Learning.’’Learning and Instruction 19: 376–86.doi:10.1016/j.learninstruc.2009.02.005
Baddeley, A. 1998. Human Memory. Boston: Allyn & Bacon.
———. 2003. ‘‘Working Memory: Looking Back and LookingForward.’’ Nature Reviews Neuroscience 4: 829–39.doi:10.1038/nrn1201
Baron-Cohen, S. 2002. ‘‘The Extreme Male Brain Theoryof Autism.’’ Trends in Cognitive Sciences 6/6: 248–54.doi:10.1016/S1364-6613(02)01904-6
———. 2003. The Essential Difference: Men, Women and theExtreme Male Brain. London: Penguin.
Baron-Cohen, S., J. Richler, D. Bisarya, N. Gurunathan, andS. Wheelwright. 2003. ‘‘The Systemizing Quotient: AnInvestigation of Adults with Asperger Syndrome or High-Functioning Autism, and Normal Sex Differences.’’ Philo-sophical Transactions of the Royal Society of London,Series B: Biological Sciences 358: 361–74. doi:10.1098/rstb.2002.1206
Learning Geographic Information from a Map and Text: Learning Environment and Individual Differences
Cartographica (volume 45, issue 3) 181

Baron-Cohen, S., and S. Wheelwright. 2004. ‘‘The EmpathyQuotient: An Investigation of Adults with Asperger Syn-drome or High Functioning Autism, and Normal Sex Differ-ences.’’ Journal of Autism and Developmental Disorders 34:164–75. doi:10.1023/B:JADD.0000022607.19833.00
Bell, S., and D. Saucier. 2004. ‘‘Relationship among Envi-ronmental Pointing Accuracy, Mental Rotation, Sex, andHormones.’’ Environment and Behavior 36: 251–65.doi:10.1177/0013916503251470
Bellgowan, P., A. Buffalo, J. Bodurka, and A. Martin. 2009.‘‘Lateralized Spatial and Object Memory Encoding in Ento-rhinal and Perirhinal Cortices.’’ Learning and Memory 16:433–38. doi:10.1101/lm.1357309
Bem, S. 1974. ‘‘The Measurement of Psychological Androgyny.’’Journal of Consulting and Clinical Psychology B 42: 155–62. doi:10.1037/h0036215
Billington, J., S. Baron-Cohen, and D. Bor. 2008. ‘‘Systemiz-ing Influences Attentional Processes During the NavonTask: An fMRI Study.’’ Neuropsychologia 46: 511–20.doi:10.1016/j.neuropsychologia.2007.09.003
Billington, J., S. Baron-Cohen, and S. Wheelwright. 2007.‘‘Cognitive Style Predicts Entry into Physical Sciences andHumanities: Questionnaire and Performance Tests of Em-pathy and Systemizing.’’ Learning and Individual Differences17: 260–68. doi:10.1016/j.lindif.2007.02.004
Brosnan, M. 2006. ‘‘Digit Ratio and Faculty Membership:Implications for the Relationship between Prenatal Testos-terone and Academia.’’ British Journal of Psychology 97:455–66. doi:10.1348/000712605X85808
Bunch, R.L., and R.E. Lloyd. 2006. ‘‘The Cognitive Load ofGeographic Information.’’ Professional Geographer 58: 209–20. doi:10.1111/j.1467-9272.2006.00527.x
Calisir, F., and Z. Gurel. 2009. ‘‘Influence of Text Structureand Prior Knowledge of the Learner on Reading Compre-hension, Browsing and Perceived Control.’’ Computers inHuman Behavior 19: 135–45.doi:10.1016/S0747-5632(02)00058-4
Carpenter, S., H. Pashler, J. Wixted, and E. Vul. 2008. ‘‘TheEffects of Tests on Learning and Forgetting.’’ Memory andCognition 36: 438–48. doi:10.3758/MC.36.2.438
Casey, M.B. 1996. ‘‘Understanding Individual Differences inSpatial Ability within Females: A Nature/Nurture Interac-tionist Framework.’’ Developmental Review 16: 241–60.doi:10.1006/drev.1996.0009
Coolican, J., and M. Peters. 2003. ‘‘Sexual Dimorphism inthe 2D/4D Ratio and Its Relation to Mental Rotation Per-formance.’’ Evolution and Human Behavior 24: 179–83.doi:10.1016/S1090-5138(03)00010-2
Cowan, N., and C.C. Morey. 2006. ‘‘Visual Working MemoryDepends on Attentional Filtering.’’ Trends in CognitiveSciences 10/4: 139–41. doi:10.1016/j.tics.2006.02.001
Csatho, A., A. Osvath, K. Karadi, E. Bicsak, J. Manning, andJ. Kallai. 2003. ‘‘Spatial Navigation Related to the Ratioof Second to Fourth Digit Length in Women.’’ Learning andIndividual Differences 13: 239–49.doi:10.1016/S1041-6080(02)00093-6
Dabbs, J.M., Jr., E. Chang, R.A. Strong, and R. Milun. 1998.‘‘Spatial Ability, Navigation Strategy, and GeographicKnowledge among Men and Women.’’ Evolution and HumanBehavior 19: 89–98. doi:10.1016/S1090-5138(97)00107-4
Falter, C., M. Arroyo, and G. Davis. 2006. ‘‘Testosterone:Activation or Organization of Spatial Cognition?’’ BiologicalPsychology 73: 132–40.doi:10.1016/j.biopsycho.2006.01.011
Fenner, J., D. Heathcote, and J. Jerrams-Smith. 2000. ‘‘TheDevelopment of Wayfinding Competency: AsymmetricalEffects of Visuo-spatial and Verbal Ability.’’ Journal of Envi-ronmental Psychology 20: 165–75.
Fischer, M.H. 2001. ‘‘Probing Spatial Working Memory withthe Corsi Blocks Task.’’ Brain and Cognition 45: 143–54.doi:10.1006/brcg.2000.1221
Focquaert, F., M.S. Steven, G.L. Wolford, A. Colden, and M.S.Gazzaniga. 2007. ‘‘Empathizing and Systemizing CognitiveTraits in the Sciences and Humanities.’’ Personality andIndividual Differences 43: 619–25.doi:10.1016/j.paid.2007.01.004
Gouchie, C., and D. Kimura. 1991. ‘‘The Relationship betweenTestosterone Levels and Cognitive Ability Patterns.’’ Psycho-neuroendocrinology 16: 323–34.doi:10.1016/0306-4530(91)90018-O
Graf, S., T. Lin, and Kinshuk. 2008. ‘‘The Relationshipbetween Learning Styles and Cognitive Traits – GettingAdditional Information for Improving Student Modelling.’’Computers in Human Behavior 24: 122–37.doi:10.1016/j.chb.2007.01.004
Halpern, D.F. 2000. Sex Differences in Cognitive Abilities.Mahwah, NJ: Lawrence Erlbaum.
Harrower, M. 2007. ‘‘The Cognitive Limits of AnimatedMaps.’’ Cartographica 42: 349–57.doi:10.3138/carto.42.4.349
Hardwick, S.W., L.L. Bean, K.A. Alexander, and F.M. Shelley.2000. ‘‘Gender vs. Sex Differences: Factors Affecting Perfor-mance in Geographic Education.’’ Journal of Geography 99/6: 238–44. doi:10.1080/00221340008978974
Holsanova, J., N. Holmberg, and K. Holmqvist. 2009. ‘‘Read-ing Information Graphics: The Role of Spatial Contiguityand Dual Attentional Guidance.’’ Applied Cognitive Psychol-ogy 23: 1215–26. doi:10.1002/acp.1525
Jager, G., and A. Postma. 2003. ‘‘On the Hemispheric Spe-cialization for Categorical and Coordinate Spatial Relations:A Review of the Current Evidence.’’ Neuropsychologia 41:504–15. doi:10.1016/S0028-3932(02)00086-6
Janowsky, J. 2006. ‘‘Thinking with Your Gonads: Testosteroneand Cognition.’’ Trends in Cognitive Sciences 10: 77–82.doi:10.1016/j.tics.2005.12.010
Kimura, D. 1989. ‘‘How Sex Hormones Boost or Cut Intellec-tual Ability.’’ Psychology Today 23: 62–66.
———. 2000. Sex and Cognition. Cambridge, MA: MIT Press.
Kosslyn, S.M., W.L. Thompson, D.R. Gitelman, and N.M.Alpert. 1998. ‘‘Neural Systems That Encode Categoricalversus Coordinate Spatial Relations: PET Investigations.’’Psychobiology 26: 333–47.
Kulhavy, R.W., W.A. Stock, and W.A. Kealy. 1993. ‘‘HowGeographic Maps Increase Recall of Instructional Text.’’ Edu-cational Technology Research and Development 41: 47–62.doi:10.1007/BF02297511
Lloyd, R.E., and R.L. Bunch. 2003. ‘‘Technology and Map-Learning: Users, Methods, and Symbols.’’ Annals of the
Robert Earl Lloyd and Rick L. Bunch
182 cartographica (volume 45, issue 3)

Association of American Geographers 93: 828–50.doi:10.1111/j.1467-8306.2003.09304004.x
———. 2005. ‘‘Individual Differences in Map Reading SpatialAbilities Using Perceptual and Memory Processes.’’ Carto-graphy and Geographic Information Science 32: 33–46.doi:10.1559/1523040053270774
———. 2008. ‘‘Explaining Map-Reading Performance Effi-ciency: Gender, Memory, and Geographic Information.’’Cartography and Geographic Information Science 35: 171–202. doi:10.1559/152304008784864677
Lloyd, R.E., M.E. Hodgson, and A. Stokes. 2002. ‘‘Visual Cate-gorization with Aerial Photographs.’’ Annals of the Associa-tion of American Geographers 92: 241–66. doi:10.1111/1467-8306.00289
Loehlin, J.C., D. McFadden, S.E. Medland, and N.G. Martin.2006. ‘‘Population Differences in Finger-Length Ratios: Ethnic-ity or Latitude?’’ Archives of Sexual Behavior 35: 739–42.doi:10.1007/s10508-006-9039-1
Manning, J. 2002. Digit Ratio: A Pointer to Fertility, Behaviorand Health. New Brunswick, NJ: Rutgers University Press.
Manning, J., D. Scutt, J. Wilson, and D. Lewis-Jones. 1998.‘‘The Ratio of 2nd to 4th Digit Length: A Predictor of SpermNumber and Concentrations of Testosterone, LuteinizingHormone, and Oestrogen.’’ Human Reproduction 13: 3000–3004. doi:10.1093/humrep/13.11.3000
Mayer, R., and R. Moreno. 2003. ‘‘Nine Ways to Reduce Cog-nitive Load in Multimedia Learning.’’ Educational Psycholo-gists 38: 43–52. doi:10.1207/S15326985EP3801_6
McDaniel, M., H. Roediger, and K. McDermott. 2007. ‘‘Gen-eralizing Test-Enhanced Learning from the Laboratory tothe Classroom.’’ Psychonomic Bulletin and Review 14: 200–206.
Nettle, D. 2007. ‘‘Empathizing and Systemizing: What AreThey, and What Do They Contribute to Our Understandingof Psychological Sex Differences?’’ British Journal of Psy-chology 98: 237–55. doi:10.1348/000712606X117612
Ozuru, Y., K. Dempsey, and D. McNamara. 2009. ‘‘PriorKnowledge, Reading Skill, and Text Cohesion in the Com-prehension of Science Texts.’’ Learning and Instruction 19:228–42. doi:10.1016/j.learninstruc.2008.04.003
Paas, F., and J. van Merrienboer. 1993. ‘‘The Efficiency ofInstructional Conditions: An Approach to Combine Mental-Effort and Performance Measures.’’ Human Factors 35: 737–43.
Patton, D.K., and Lloyd, R.E. 2009. ‘‘Asymmetrical Learning ofLocations on Maps: Implicit Learning, Prior Knowledge andSex Differences.’’ Cartographic Perspectives 63: 4–34.
Roediger, H., and J. Karpicke, J. 2006. ‘‘Test-Enhanced Learn-ing: Taking Memory Tests Improves Long-Term Retention.’’Psychological Science 17: 249–55.doi:10.1111/j.1467-9280.2006.01693.x
Sanders, G., M. Sjodin, and M. Chastelaine. 2002. ‘‘On theElusive Nature of Sex Differences in Cognition: HormonalInfluences Contributing to Within-Sex Variation.’’ Archivesof Sexual Behavior 31: 145–52.
Saucier, D., S. Green, J. Leason, A. MacFadden, S. Bell, andL. Elias. 2002. ‘‘Are Sex Differences in Navigation Causedby Sexually Dimorphic Strategies or by Differences in theAbility to Use the Strategies?’’ Behavioral Neuroscience116: 403–10. doi:10.1037/0735-7044.116.3.403
Seufert, T. 2003. ‘‘Supporting Coherence Formation in Learn-ing from Multiple Representations.’’ Learning and Instruc-tion 13: 227–37. doi:10.1016/S0959-4752(02)00022-1
Signorella, M., and W. Jamison. 1986. ‘‘Masculinity, Femi-ninity, Androgyny, and Cognitive Performance: A Meta-analysis.’’ Psychological Bulletin 100: 207–28. doi:10.1037/0033-2909.100.2.207
Slotnick, S., and L. Moo. 2006. ‘‘Prefrontal Cortex Hemi-spheric Specialization for Categorical and Coordinate VisualSpatial Memory.’’ Neuropsychologia 44: 1560–68.doi:10.1016/j.neuropsychologia.2006.01.018
Sommer, T., E. Schoell, and C. Buchel. 2008. ‘‘AssociativeSymmetry of the Memory for Object-Location Associationsas Revealed by the Testing Effect.’’ Acta Psychologica 128:238–48. doi:10.1016/j.actpsy.2008.01.003
Sweller, J. 1988. ‘‘Cognitive Load during Problem Solving:Effects on Learning.’’ Cognitive Science 12: 257–85.doi:10.1207/s15516709cog1202_4
van der Lubbe, R., M. Scholvinck, J. Kenemans, and A.Postma. 2006. ‘‘Divergence of Categorical and CoordinateSpatial Processing Assessed with ERPs.’’ Neuropsychologia44: 1547–59. doi:10.1016/j.neuropsychologia.2006.01.019
Verdi, M.P., and R.W. Kulhavy. 2002. ‘‘Learning with Mapsand Texts: An Overview.’’ Educational Psychology Review14: 27–46.
Voyer, D., A. Postma, B. Brake, and J. Imperato-McGinley.2007. ‘‘Gender Differences in Object Location Memory: AMetaanalysis.’’ Psychonomic Bulletin and Review 14: 23–38.
Wilson, D.E., C.M. MacLeod, and M. Muroi. 2008. ‘‘Practice inVisual Search Produces Decreased Capacity Demands ButIncreased Distraction.’’ Perception and Psychophysics 70:1130–37. doi:10.3758/PP.70.6.1130
Yarrow, K., P. Brown, and J.W. Krakauer. 2009. ‘‘Inside theBrain of an Elite Athlete: The Neural Processes That SupportHigh Achievement in Sports.’’ Nature Reviews Neuroscience10: 585–96. doi:10.1038/nrn2672
Zinser, O., D.L. Palmer, and C.R. Miller. 2004. ‘‘Site Distance,Gender, and Knowledge of Geographic Sites.’’ Sex Roles 51:661–86. doi:10.1007/s11199-004-0717-y
(Continued)
Learning Geographic Information from a Map and Text: Learning Environment and Individual Differences
Cartographica (volume 45, issue 3) 183

Appendix: The Text Supplying Physical, Cultural, andTravel Information about the Isle of Dogs
Physical. The Isle of Dogs is located between the Atlantic
Ocean and the North Sea. The island got its name from
the canines left on the island by passing Viking raiders.
Rivers flow from the central highlands to the sea in three
of the provinces. The English established the first perma-
nent settlement at the mouth of the Annan River in 1022
AD. The climate is warm in the summer and cold in the
winter. Storms from the Atlantic Ocean provide frequent
and high levels of precipitation.
Cultural. The modern island has four provinces. Nussex
has the smallest population and 3 counties and Essex has
the largest population and 5 counties. Trent, the capital
city, is centrally located in Essex and is the main seat of
government. Other major cities are Kenly in Sussex that
supports a thriving fishing industry, Wells in Wessex that
excels in manufacturing and Alban in Nussex, that is the
home of a growing recreation trade.
Travel. The island has a simple highway system that
connects the towns and cities. There is an excellent and
inexpensive bus system serving the entire island. Cars can
only be rented at the airport. Travelers coming by ship
generally come through the port of Wells while those
arriving by air land at the airport near Trent. Travelers
from outside of Europe will need to show a passport.
Hotel rates are highest in Trent and less expensive in
other locations.
Robert Earl Lloyd and Rick L. Bunch
184 cartographica (volume 45, issue 3)

Copyright of Cartographica is the property of University of Toronto Press and its content may not be copied or
emailed to multiple sites or posted to a listserv without the copyright holder's express written permission.
However, users may print, download, or email articles for individual use.