learner differences in the online context: introducing a
TRANSCRIPT
HAL Id: hal-01342714https://hal.inria.fr/hal-01342714
Submitted on 6 Jul 2016
HAL is a multi-disciplinary open accessarchive for the deposit and dissemination of sci-entific research documents, whether they are pub-lished or not. The documents may come fromteaching and research institutions in France orabroad, or from public or private research centers.
L’archive ouverte pluridisciplinaire HAL, estdestinée au dépôt et à la diffusion de documentsscientifiques de niveau recherche, publiés ou non,émanant des établissements d’enseignement et derecherche français ou étrangers, des laboratoirespublics ou privés.
Distributed under a Creative Commons Attribution| 4.0 International License
Learner Differences in the Online Context: Introducinga New Method
Arne Schulz, Debora Jeske
To cite this version:Arne Schulz, Debora Jeske. Learner Differences in the Online Context: Introducing a New Method.IFIP Conference on Information Technology in Educational Management (ITEM) and IFIP Conferenceon Key Competencies for Educating ICT Professionals (KCICTP), Jul 2014, Potsdam, Germany.pp.306-317, �10.1007/978-3-662-45770-2_26�. �hal-01342714�

298
Learner Differences in the Online Context: Introducing a
New Method
Arne Hendrik Schulz1 and Debora Jeske2
1Institute for Information Management Bremen, University of Bremen, Germany
2Psychology and Communication Technology (PaCT) Lab, Department of Psychology,
Northumbria University, UK [email protected]
Abstract. The paper introduces an alternative method to analyze different learning styles among students. This method was developed as an alternative to more traditional methods such as hierarchical cluster analysis. The method was tested using a large data set (n = 868) which included participants completing a small e-module in addition to a small number of measures to assess learner
characteristics. The resulting log files were analyzed using the method. Results were similar to those observed using traditional methods. The method provides a new starting point for subsequent analysis and identification of learner differences using other information such as log files from e-learning and Massive Online Open Courses (MOOCs).
Keywords: E-learning, log file analysis, cluster analysis, learner group differences, learning strategies
1. Introduction
The research about learners in e-learning environments is a very broad research
theme. A lot of research addresses pedagogic questions like acceptance of tests and
materials or the extent to which learners benefit from using digital systems like
Learning Management Systems [1, 2, 3]. Determining the needs of different users and
learner groups plays a significant role in education as this allows educators, practitioners and designers to respond to and adapt tutor instructions to various
learning characteristics exhibited by these groups. This has generated numerous
studies on adaptive hypermedia, personalized design and e-learning [4, 5].
The use of trace and log file information to identify different groups of learners and
users using various algorithms and analyses allows researchers to examine different
behaviors. This approach of identifying different user groups is very helpful by
combining it with additional behavioral data gathered during online activities. In
addition, when we try to understand learning processes, many more variables may
come into play. The pace at which we learn and how we navigate is often influenced
by various different learner characteristics ranging from prior knowledge, age,
motivation, learning preferences and strategies [6]. This means that when we create clusters using log files, we can use these new clusters in combination with additional

299
learner characteristics to better understand cluster differences. These independent
variables might inform research in the area of digital competencies which e-learners
may lack and hence impact the efficiency with which e-learning tools can support
their learning.
1.1 Previous research
There has been a lot of research on the topic of learner analytics in digital
environments, recently summarized under the term learning analytics [7], a
subcategory of educational data mining [8, 9, 10]. Chen et al. [11] create a framework
for analyzing students’ online learning portfolios. They include logon times, logon
days, general activity within the system (clicks, duration of studying) and course
results (midterm and final) of 162 undergraduate students. Results show that higher
online learning activity and more intensive work with online materials leads to
significantly better course results and grades. Del Valle and Duffy [12] clustered 59
learners of an “online teacher professional development curriculum”. Based on the
online behavior (total time online, course duration, average inter-session interval, proportion of time on learning resources, proportion of learning resources accessed,
exploration, proportion of time in messenger) the authors extracted 3 user clusters
named mastery orientated, task focused and minimal approach. The former two
groups can be characterized as being more active within the course; the last group is
more inactive, but has the highest self-reported prior knowledge. The more active
groups (mastery orientated and task focused) had a higher satisfaction and higher
learning effect (self-reported). Lee [13] asked 116 students of a general education
course at a Taiwan university to fill out a questionnaire about their online learning
perception and styles. Three clusters were extracted and described. One cluster
represented students that are highly motivated and adopted deep learning strategies,
the second cluster had students that were also highly motivated and tended to adopt deep learning strategies. The last cluster had students with the lowest motivation and
adoption of deep strategies. Quinell et al. [14] also found significant differences in the
learner styles of first year university degree biology students. There are several other
studies researching students’ performances and clustering them using self-reported
measures [15, 16, 17]. Nevertheless, most of these studies rely only on questionnaires
and sometimes on examination and term results or grades. They do not take students’
online behavior into account.
1.2 Goals of this research
In order to capture the learner characteristics of more diverse and broader learners, it
will be essential to utilize new tools to analyze patterns and optimize what we learn
about our learners. The aims of this paper are therefore to: (1) describe a new method
to cluster learners and (2) demonstrate the utility of this method in a large data set of
e-learners for which both log files and self-reported learner characteristics had been
collected. We focused on variables that had also been included in the examination of

300
learner differences in previous research. We provide evidence demonstrating that the
new method performs similarly and as well as traditional cluster analysis.
2 Introduction to the New Clustering Method
All user actions within our developed e-learning model (including content and
questions) are logged. This information is used to extract separate user groups based
on their systems’ usage. We cluster the user using hierarchical clustering technique
[18, 19, 20] with Ward’s [21] linkage algorithm. The distance between two users is
measured via two measures developed by Xiao et al. [22] and Xiao and Zhang [23],
named frequency based measure and viewing-time based measure. Both measures are
based on the cosine angle [24] and are widely used in the areas of information
retrieval [25]. Xiao et al. define a webpage that consists of k different pages P = { p1,
p2, p3, … pk } accessed by n different users U = { u1, u2, u3, … un }. Frequency based
measure takes into account how often pages are visited by the users, while the viewing-time based measure considers the amount of time each user is spending on
different pages. Therefore, let acc(pk,ui) be the number of times user ui is accessing
page pk and let t(pk,ui) be the time t the user ui spends viewing page pk. If a user is not
accessing a page (and is not spending any time on that page) each measure will be 0.
The similarity of two users, according to the frequency based measure, is
calculated using the following formula:
( ) ∑ ) ( ))
√∑ )) ∑ ( ))
∑ ))
is the squared sum of the access times of all accessed pages by
user ui/j and ∑ ) ( )) is the product of all accesses done by both
users. If both users access the same pages and have identical accesses on all visited
pages, their similarity will be 1. If they do not visit any common pages at all, their
similarity will be 0.
The viewing-time based similarity of two users is calculated using the following
formula:
( ) ∑ ) ( ))
√∑ )) ∑ ( ))
∑ ))
is the sum of the squared viewing times of all visited pages by user
ui and ∑ ) ( )) is the product of all viewing times visited by both
compared users. The interpretation of the results is straightforward. We combine both
algorithms and weight them. Weighting is needed as the frequency based measure
may not bring up the best results, due to the fact that many users visited each page of
the e-module once only: the users had a mean of 19.4 page visits (sd = 4.1).
Compared to the 18 pages the e-module consisted of, there seems to be not a big

301
variety among the users. Therefore, we weight the viewing-time based measure with
.85 and the frequency based measure with .15. The final measure has the following
formula and will be referred to as cosine similarity:
( ) ( ) )
The idea of both algorithms is that users with similar interests have a common
“footprint” in the log files. Using the frequency based measure, this means that they
will have the same numbers of accesses of common pages [cf. 26]). Using the
viewing-time based measure assumes that the same interests are reflecting in the same
viewing times. Furthermore, this measure is indirectly taking into account more
hidden variables like literacy (affecting the viewing time). Both algorithms do not
measure sequence of the pages. The e-learning modules are linear which does not need such a feature.
3 Application of the New Method
In the next step, we wanted to apply the new method to a data set of e-learners for
which we also had log file information. As shown above, we took the number of page
visits for the frequency based measure and the visiting time per page for the viewing-time based measure. If a user had multiple page visits, the viewing times were
summed up.
The test material was a small e-module featuring five short chapters on team
development. Participants had to complete a number of short test questions.
Following this, participants completed a set of items to assess their learning
characteristics.
3.1 Self-reported variables
The questions included demographics, prior knowledge about the topic and about e-
learning in general, as well as questions about the self-reported measures (discussed
further below). These were accessed via a questionnaire that had to be answered
before the module itself.
Deep and surface learning strategy: deep versus surface processing refers to
learning styles that capture how learners utilize diverse learning strategies to come to
a specific goal [27]. Deep and surface strategies were identified using three items
which were inspired by subscales produced by Biggs et al. [27]. An example item for
deep strategy is: “When I am interested in a topic, I spend additional time on trying to
learn more information about it”. An example item for surface strategy is: “I tend to
learn more than is necessary” (reverse-coded). So this learning difference helps to detect the amount of effort that individuals invest into learning about a topic, that is,
either in-depth or superficially. The response options ranging from (1) “never or only
rarely true of me” to (5) “always or almost always true of me”.
Serialist learning preference: serialists can be labeled "operation learners" with a
more pronounced bottom-up approach [6, 28]. These individuals tend to focus on the
immediate or local aspects. They have a narrower focus, oftentimes emphasizing the

302
details and the way to success rather than trying to achieve a larger overview.
Serialists learn in a linear and sequential fashion which goes hand in hand with an
emphasis on memorizing facts for reproduction, emphasizing product in order to
construe logical arguments and simple hypotheses [29]. Serialist processing is often
contrasted with holist processing. Holists tend have a more global strategy and wider
focus on several aspects [28]. This also means they like to focus on numerous topics
simultaneously, emphasizing the use of numerous sources in order to elaborate on
information and seek patterns amongst facts. These aspects lead to more generalized descriptions and higher level comprehension, but potentially at the expense of
individual detail. In all three datasets, serialist preference was measured using 7 items.
An example here is: “I deal with a new topic as thoroughly as I can first time around”.
The response options ranged from (1) “strongly disagree” to (5) “strongly agree”. Prior knowledge: we also asked participants one item each about their prior
knowledge with e-learning modules and the topic of the e-module. Knowledge about
e-learning was assessed using four answering options: (1) I have a lot of experience
with e-learning; (2) I have some experience with e-learning; (3) I have very little
experience with e-learning; and (4) I have no prior experience with e-learning. The
four answering options asked about topic familiarity as follows: (1) I was very
knowledgeable; (2) I was quite knowledgeable; (3) I knew a little; and (4) I didn’t
know anything about it. All answers were reverse-coded, so that more knowledge corresponded with higher scores.
All items measuring learning strategies and preferences were summarized to
provide a mean-centered composite for each scale. All scales featured a reliability
coefficient above .7.
3.2 Participants and procedure
Participants were students at a distance-learning institution in Germany. They were offered opportunity to participate in exchange for obtaining research credit (N=686).
We collected information about participant sex and age. Participants were between 17
and 63 years old (M=32.62, SD=9.27), the most frequent age (mode) indicated was 28
with a mean of 32.6 years (SD = 9.2). About one fifth were female (n = 145). Male
participants were slightly younger (M = 32.3 vs. M = 33.6). A t-test provides no
significant difference (t-value = 1.402, degrees of freedom = 218.441, p-value <
0.16).
Data collection took place in spring 2013. In total, 686 participants completed both
the test and the questionnaire. Missing and incomplete information reduced the
number to 669 participants.
4 Results of the Analysis
We first examined the given cluster solutions. Scree plots and dendrograms led us to a
four cluster solution. In the next step, we conducted descriptive statistics and correlations of the measures (Table 1). Finally, we examined user clusters based on
303
log file information obtained from all learners during the e-module. In the final step,
we examined how the clusters we identified using log files, and how they differed in
terms of their learner characteristics.
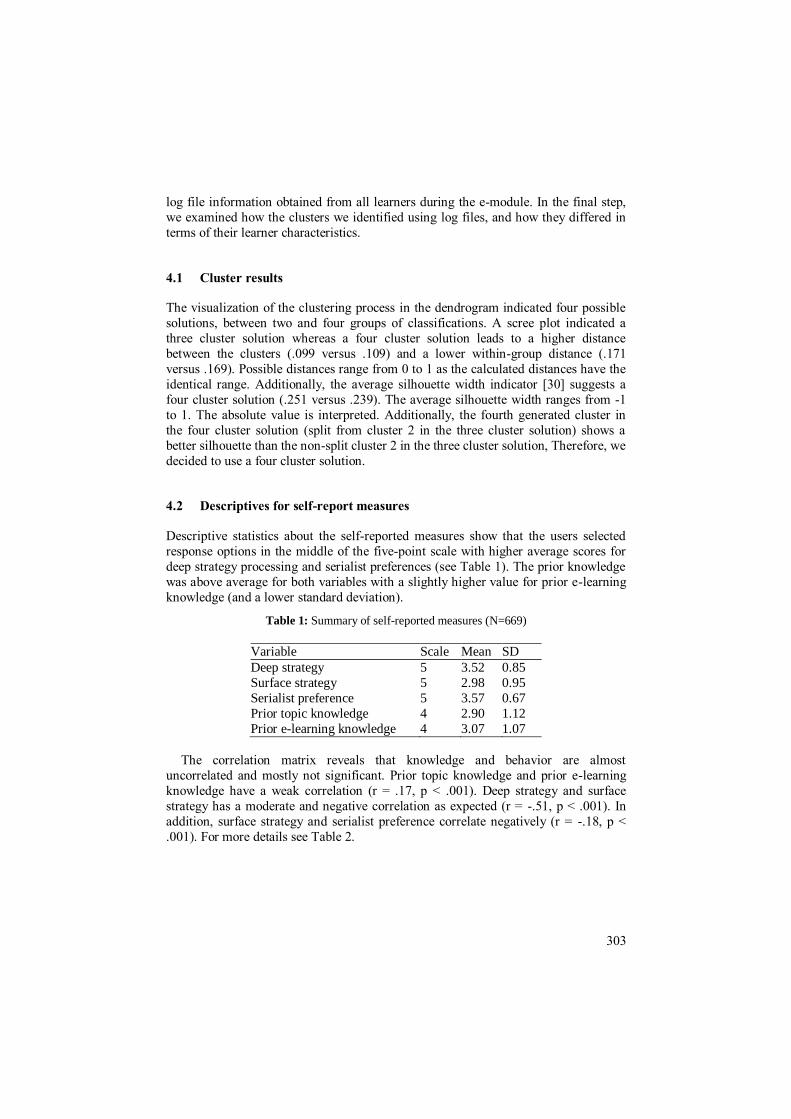
4.1 Cluster results
The visualization of the clustering process in the dendrogram indicated four possible
solutions, between two and four groups of classifications. A scree plot indicated a
three cluster solution whereas a four cluster solution leads to a higher distance
between the clusters (.099 versus .109) and a lower within-group distance (.171
versus .169). Possible distances range from 0 to 1 as the calculated distances have the
identical range. Additionally, the average silhouette width indicator [30] suggests a
four cluster solution (.251 versus .239). The average silhouette width ranges from -1
to 1. The absolute value is interpreted. Additionally, the fourth generated cluster in
the four cluster solution (split from cluster 2 in the three cluster solution) shows a
better silhouette than the non-split cluster 2 in the three cluster solution, Therefore, we
decided to use a four cluster solution.
4.2 Descriptives for self-report measures
Descriptive statistics about the self-reported measures show that the users selected
response options in the middle of the five-point scale with higher average scores for
deep strategy processing and serialist preferences (see Table 1). The prior knowledge
was above average for both variables with a slightly higher value for prior e-learning
knowledge (and a lower standard deviation).
Table 1: Summary of self-reported measures (N=669)
Variable Scale Mean SD
Deep strategy 5 3.52 0.85
Surface strategy 5 2.98 0.95
Serialist preference 5 3.57 0.67
Prior topic knowledge 4 2.90 1.12
Prior e-learning knowledge 4 3.07 1.07
The correlation matrix reveals that knowledge and behavior are almost
uncorrelated and mostly not significant. Prior topic knowledge and prior e-learning
knowledge have a weak correlation (r = .17, p < .001). Deep strategy and surface
strategy has a moderate and negative correlation as expected (r = -.51, p < .001). In
addition, surface strategy and serialist preference correlate negatively (r = -.18, p <
.001). For more details see Table 2.

304
Table 2: Correlation of self-reported measures
Deep
Strategy
Surface
Strategy
Serialist
preference
Prior topic
knowledge
Prior e-
learning
knowledge
Deep strategy 1
Surface strategy -0.51*** 1
Serialist
preference
0.02 -0.18*** 1
Prior topic
knowledge
0.03 -0.02 0.07 1
Prior e-learning
knowledge
0.06 -0.08 0.06 0.17*** 1
Note: Pearson Correlation - p < 0.05 = *; p < 0.01 = **; p< 0.001 = ***
4.3 Learner differences
The cluster sizes were big enough to test them for significant differences related to the
following characteristics: age, surface strategy, deep strategy, prior knowledge
(according to the e-module topic and e-learning in general) and serialist learning
preference. Additionally, we included the time used in the e-module and the number
of page visits in the analysis. Covariates were gender and age (where age was not a dependent variable).
The results of the analysis of variance suggest significant group differences in
relation to the prior e-learning knowledge of the participants in the different clusters,
their level of serialist learning preferences and the amount of time used (see Table 3).
A number of other differences appear relevant as a means to differentiate the clusters
from one another. The findings are summarized in Table 3.
Table 3: Analysis of cluster differences
Cluster
1
Mean
Cluster
2
Mean
Cluster
3
Mean
Cluster
4
Mean ANCOVA
Age 33.03 31.10 33.72 31.06 F(3.663)=1.103, p=.347
Deep strategy 3.53 3.49 3.48 3.88 F(3.663)=1.949, p=.120 Surface strategy 2.99 2.98 2.90 3.01 F(3.663)=.194, p=.900
Serialist
preference 3.49 3.62 3.60 3.78 F(3.663)=2.954, p=.032
Prior topic
knowledge 3.22 3.27 3.35 2.97 F(3.561)=5.383, p=.001
Prior e-learning
knowledge 3.01 2.77 2.66 2.47 F(3.632)=2.218, p=.085
Page visits 19.36 19.47 19.05 19.00 F(3.662)=.306, p=.821
Total time 374.77 460.98 349.49 514.16
F(3.662)=16.088,
p<.001

305
Figure 1 also visualizes how the four clusters compare in terms of the learning-
relevant characteristics (deep strategy, surface strategy, serialist preferences, and prior
learning.
Fig. 1: Visualized cluster differences
In order to label the three clusters of e-learners coherently, we decided to label the
clusters first and foremost based on their level of prior knowledge as e-learning
experts (those with the highest prior knowledge), e-learning users (with average prior
knowledge) or e-learning novices (with low prior knowledge). All clusters featuring
high serialist learning preferences were labeled as sequential, as in very orderly, and
those with low values on this variable as superficial e-learners. All clusters featuring
high scores in terms of their surface strategy approach were considered as surface e-
learners. We focused on the significant differences only.
We consider Cluster 1 as disengaged but knowledgeable e-learning experts. The
assigned users have the highest e-learning knowledge (3.01 out of 4), but only average knowledge about the topic compared to other clusters (3.22 out of 4). They
also exhibit the lowest serialist preference compared to other clusters (3.49 out of 5)
and appear to be more disengaged (superficial in their approach). They spend a
relatively low amount of time in the small e-module overall compared to other
groups. High e-learning experience might have led to greater disengagement with the
e-module. In addition, their tendency to work in a less sequential and detail-oriented
manner led to less time spent in the module.
Individuals in Cluster 2 are engaged and knowledgeable e-learning users. They
appear to have average topic knowledge (3.27 out of 5) and e-learning experience
(2.77 out of 5, hence users, not experts). They show a more pronounced serialist
preference (3.62 out of 5). They have, however, invested quite a lot in learning as they
also spend more time in the e-module than two out of the four clusters. This suggests that average experience and greater orientation to detail also increases learning time.
2
2.5
3
3.5
4
Deep
Strategy
Surface
Strategy
Serialist
preference
Prior topic
knowledge
Prior e-
learning
knowledge
Cluster 1
Cluster 2
Cluster 3
Cluster 4
306
Cluster 3 seems to include disengaged but very knowledge e-learning users. They
have the highest familiarity with the topic (3.35 out of 4), but average familiarity with
e-learning (2.66 out of 4). They have serialist preferences similar to those of Cluster 2
(3.60 out of 5). At the same time, this cluster spends the least amount of time on the e-
module. This suggests that while they are detail-oriented, higher familiarity with the
topic may lead to a more disengaged learning process.
Cluster 4 includes the engaged but not very knowledgeable e-learning novices.
This group has very limited e-learning experience (2.47 out of 4) and limited topic knowledge (2.97 out of 4). At the same time, this group includes the individuals with
the strongest serialist preference. They will diligently study the materials, and take
longer than individuals from other clusters. The novelty of the topic and e-learning in
addition to their detail-orientation (via serialist preference) may explain why they are
more engaged with the materials.
Our clusters suggest that prior knowledge can help to explain cluster difference in
terms of time dedicated to the e-module they are studying. Learning characteristics
such as serialist preferences (detail orientation and sequential processing) may play an
additional role when trying to explain cluster differences, especially in relation to the
amount of time that individuals will invest in a task.
4.4 Performance of the cosine similarity
We also examined the type of clusters obtained using the Euclidean distance [31]
instead of the cosine angle, again applying Ward’s linkage method in the hierarchical
cluster analysis. The results are largely identical, resulting in four clusters that showed
similar learning differences. An analysis of variance using four clusters revealed
several significant differences, in relation to prior knowledge (e-learning and topic),
serialist learning preference and age.
Whereas the results were quite comparable, we observed two differences. First, the clusters computed with the Euclidean distance were more equally distributed,
resulting in two clusters with about 210 cases each and two further clusters including
116 and 132 cases, respectively. The generated clusters using the cosine similarity are
significantly unequally distributed, resulting in two big clusters (281 and 291 cases)
and two small clusters (65 and 32 cases). Secondly, and more importantly, the
goodness of fit between the two dissimilarity measures is significantly different. We
computed the Average Silhouette Width [32] for both solutions. The Silhouette Width
compares the dissimilarity between within-cluster cases and without-cluster cases for
each case. The value has a range from -1 to 1, where 1 stands for a perfect fit of that
case into its designated cluster. The Average Silhouette Width is the grand mean over
all cases. Kaufman and Rousseeuw [30] define all values below 0.25 as not suitable
(“no structure found”). Values between 0.26 and 0.5 are being considered as having a weak structure, values between 0.51 and 0.7 are seen that a reasonable structure has
been found and values above 0.7 stand for a strong structure.
The Average Silhouette Width of the solution defined by the Euclidean distance
was 0.04. This solution indicates that the solution did not result in a meaningful
structure. One bigger and one smaller cluster also had Average Silhouette Widths
values below 0. The two remaining clusters showed a weak structure (0.27 and 0.37).

307
The clusters generated by the cosine similarity led to a better detection of the
underlying structure. The Average Silhouette Width value was 0.26, which means that
the cosine similarity helped to detect evidence of a weak structure. One big cluster
had an Average Silhouette Width value of 0.53 (“reasonable structure found”) while
one small cluster had a width of 0.32. The values of the two remaining clusters ranged
from -0.05 up to 0.04. This means that the structure still cannot be regarded as being
good, but the algorithm shows a better solution than the Euclidean distance.
5 Discussion
The results of the new method suggest that we can obtain differentiated cluster profiles by considering both log files and self-report data together. The new method
presents an alternative to hierarchical clustering, which resulted in similar results. The
advantages of the new method are as follows: first, the algorithms we used were
developed for the application in web-based digital systems; additionally, we
combined two measures to include both the time spent on every page and the number
of single page accessed by each user; and finally, our analyses showed that the cosine
similarity had a better detection of the underlying structure than the Euclidean
distance. Xiao et al. [22], Xiao and Zhang [23], and Kumar et al. [33] developed more
algorithms to compare users. Some of these algorithms include the users’ path and
can lead to better cluster solutions. In fact, due to the linear structure of the e-module,
these algorithms were not needed, but could be implemented easily if needed.
In conclusion, we believe that the combination of new methods and more data can aid future learning analyses aimed at detecting digital competencies and
personalization opportunities. Most of the research tends to focus on the needs of
younger learners. However, given the importance of lifelong learning, future users are
likely to show increased demographic and skill diversity. As learners become more
differentiated in terms of their past learning (prior knowledge), age and various
related skills (digital competence), it becomes more appropriate to include these
variables in order to consider their influence. This development also suggests that
learners will start from different baselines. New methods such as the one we
introduced will provide the means to consider such differences and characteristics and
address these potentially in personalized and different tutoring - so as to improve
performance for all users across the board and to increase user satisfaction and optimize the learning experience [34, 35].
References
1. Concannon, F., Flynn, A., Campbell, M.: What campus-based students think about the quality and benefits of e-learning. British Journal of Educational Technology, 36, 501–512
(2005) 2. Garrison, D.R.: E-Learning in the 21st Century: A Framework for Research and Practice.
Routledge, New York, NY (2011)

308
3. Selim, H.M.: Critical success factors for e-learning acceptance: Confirmatory factor models. Computers & Education, 49, 396–413 (2007)
4. Brusilovsky, P.: Adaptive Hypermedia. User Modeling and User-Adapted Interaction, 11,
87–110 (2001) 5. Hsiao, I.-H., Brusilovsky, P.: Motivational Social Visualizations for Personalized E-
Learning. In: Ravenscroft, A., Lindstaedt, S., Kloos, C.D., Hernández-Leo, D. (eds.) 21st Century Learning for 21st Century Skills. pp. 153–165. Springer, Berlin, Germany (2012)
6. Jeske, D., Backhaus, J., Stamov Roßnagel, C.: Evaluation and revision of the Study Preference Questionnaire: Creating a user-friendly tool for nontraditional learners and learning environments. Learning and Individual Differences, 30, 133-139 (2013)
7. Greller, W., Drachsler, H.: Translating Learning into Numbers: A Generic Framework for
Learning Analytics. Educational Technology & Society, 15, 42–57 (2012) 8. Baker, R., Yacef, K.: The state of educational data mining in 2009: A review and future
visions. Journal of Educational Data Mining, 1, 3–17 (2009) 9. Dyckhoff, A.L., Zielke, D., Bültmann, M., Chatti, M.A., Schroeder, U.: Design and
Implementation of a Learning Analytics Toolkit for Teachers. Educational Technology & Society, 15, 58–76 (2012)
10. Romero, C., Ventura, S.: Educational Data Mining: A Review of the State of the Art. IEEE Transactions on Systems, Man, and Cybernetics, Part C (Applications and Reviews), 40, 601–618 (2010)
11. Chen, C.-M., Li, C.-Y., Chan, T.-Y., Jong, B.-S., Lin, T.-W.: Diagnosis of students’ online learning portfolios. Frontiers In Education Conference-Global Engineering: Knowledge Without Borders, Opportunities Without Passports, 2007. FIE’07. 37th Annual. p. T3D–17. IEEE (2007)
12. Valle, R. del, Duffy, T.M.: Online learning: Learner characteristics and their approaches to managing learning. Instructional Science, 37, 129–149 (2009)
13. Lee, S.W.-Y.: Investigating students’ learning approaches, perceptions of online discussions, and students’ online and academic performance. Computers & Education, 68,
345–352 (2013) 14. Quinnell, R., May, E., Peat, M.: Conceptions of Biology and Approaches to Learning of
First Year Biology Students: Introducing a technique for tracking changes in learner profiles over time. International Journal of Science Education, 34, 1053–1074 (2012)
15. Richardson, J.T.E.: Mental models of learning in distance education. British Journal of Educational Psychology, 77, 253–270 (2007)
16. Sparks, R.L., Patton, J., Ganschow, L.: Profiles of more and less successful L2 learners: A cluster analysis study. Learning and Individual Differences, 22, 463–472 (2012)
17. Wade, S.E., Trathen, W., Schraw, G.: An Analysis of Spontaneous Study Strategies. Reading Research Quarterly, 25, 147–166 (1990)
18. Everitt, B.S., Landau, S., Leese, M., Stahl, D.: Cluster analysis. Wiley, Chichester (2011) 19. Hastie, T., Tibshirani, R., Friedman, J.: The Elements of Statistical Learning: Data Mining,
Inference, and Prediction. Springer, New York, NY (2011) 20. Liu, B.: Web data mining: exploring hyperlinks, contents, and usage data. Springer, Berlin,
Germany (2011) 21. Ward, J.H.: Hierarchical Grouping to Optimize an Objective Function. Journal of the
American Statistical Association, 58, 236–244 (1963) 22. Xiao, J., Zhang, Y., Jia, X., Li, T.: Measuring similarity of interests for clustering web-
users. Proceedings of the 12th Australasian Database Conference. pp. 107–114. IEEE Computer Society, Washington, DC (2001)
23. Xiao, J., Zhang, Y.: Clustering of web users using session-based similarity measures. Proceedings of the 2001 International Conference on Computer Networks and Mobile Computing, 223–228 (2001)

309
24. Tan, P.-N., Steinbach, M., Kumar, V.: Introduction to data mining. Pearson/Addison-Wesley, Boston, MA (2010)
25. Grossman, D.A., Frieder, O.: Information Retrieval: Algorithms and Heuristics. Springer,
Dordrecht, The Netherlands (2004) 26. Xu, B., Recker, M.: Teaching Analytics: A Clustering and Triangulation Study of Digital
Library User Data. Educational Technology & Society, 15, 103–115 (2012) 27. Biggs, J., Kember, D., Leung, D.Y.P.: The revised two-factor Study Process Questionnaire:
R-SPQ-2F. British Journal of Educational Psychology, 71, 133–149 (2001) 28. Ford, N.: Learning Styles and Strategies of Postgraduate Students. British Journal of
Educational Technology, 16, 65–77 (1985) 29. Ford, N.: Cognitive styles and virtual environments. Journal of the American Society for
Information Science, 51, 543–557 (2000) 30. Kaufman, L., Rousseeuw, P.J.: Finding Groups in Data. An Introduction to Cluster
Analysis. Wiley, Hoboken, NJ (2005) 31. Deza, M.M., Deza, E.: Encyclopedia of Distances. Springer, Dordrecht, The Netherlands
(2013) 32. Rousseeuw, P.J.: Silhouettes: A graphical aid to the interpretation and validation of cluster
analysis. Journal of Computational and Applied Mathematics, 20, 53–65 (1987) 33. Kumar, P., Krishna, P.R., Bapi, R.S., De, S.K.: Rough clustering of sequential data. Data &
Knowledge Engineering, 63, 183–199 (2007)
34. Facca, F.M., Lanzi, P.L.: Mining interesting knowledge from weblogs: a survey. Data & Knowledge Engineering, 53, 225–241 (2005)
35. Mobasher, B., Cooley, R., Srivastava, J.: Automatic personalization based on Web usage mining. Communications of the ACM, 43, 142–151 (2000)