lean six-sigma applications in aircraft assembly - soar - wichita
TRANSCRIPT

LEAN SIX-SIGMA APPLICATIONS IN AIRCRAFT ASSEMBLY
A Thesis by
Siddhartan Ramamoorthy B.E, Mechanical Engineering, University of Madras, India, 2003
Submitted to the Department of Industrial & Manufacturing Engineering Wichita State University
in partial fulfillment of the requirements for the degree of
Master of Science
MAY - 2007

ii
© Copyright 2007 by Siddhartan Ramamoorthy
All Rights Reserved

iii
LEAN SIX-SIGMA APPLICATIONS IN AIRCRAFT ASSEMBLY
I have examined the final copy of this Thesis for form and content and recommend that
it be accepted in partial fulfillment of the requirement for the degree of Master of
Science with a major in Industrial & Manufacturing Engineering.
__________________________________
Dr. Gamal Weheba, Committee Chair
We have read this Thesis
and recommend its acceptance:
__________________________________
Dr. Krishna K. Krishnan, Committee Member
__________________________________
Dr. Hamid Lankarani, Committee Member

iv
DEDICATION
To my Family and Friends

v
ACKNOWLEDGEMENTS
I would like to thank Dr. Weheba, my advisor, for his guidance and support
throughout the course of the thesis. I would also like to extend my thanks to Bombardier
Aerospace, Learjet for giving me an opportunity to work on a case study to support my
thesis. In particular I would like to thank Mr. Said Khalidi, Mr. Doug Wood, and Mr.
Mansour Mardini for providing valuable suggestions and resources, at times of need,
that played a vital part in my case study. I would also like to extend my gratitude to the
thesis committee members, Dr. Krishnan and Dr. Lankarani. I’m also thankful to my
family and friends for their motivation and moral support in successful completion of this
work.
vi
ABSTRACT
To improve the performance of a process and ensure on time delivery there are
numerous different approaches available nowadays. Lean offers a unique method that
helps identify possible improvement areas on a production line. Also Six-Sigma offers a
unique approach that is widely used in industries in order to improve the process and
thereby reduce the number of defects.
The lean approach can be used to reduce or even eliminate waste and thereby
ensure on time delivery of products. A Value Stream Map (VSM) is one of the main
tools of lean manufacturing that can be used to represent the flow of material and
information in a production line. It can be utilized to identify areas where improvements
can be incorporated for a smooth flow of products. DMAIC (Define-Measure-Analyze-
Improve-control) is a five-step approach that utilizes different Six-Sigma tools to
generate ideas, collect and measure data, analyze and come up with improvement
plans to improve the process under study.
Lean manufacturing concepts can be used to identify waste from the customer
point of view and eliminate them. Lean cannot bring a process under statistical control.
On the other hand, six-sigma cannot dramatically improve process speed or reduce
cost. The integrated lean six-sigma approach maximizes shareholder value by
achieving the fastest rate of improvement in customer satisfaction, cost, quality, process
speed, and invested capital. In aircraft industries, the phenomenal increase in demand
has pushed the manufacturers to look for new concepts to stay in business amidst
strong competition.

vii
A new methodology of lean six sigma integration was proposed and tested in an
aircraft industry. The study involves the assembly of the upper main entry door of a
business jet. Improvement opportunities were identified from a high-level value stream
map. The DMAIC approach was utilized to address the identified opportunities for
improvement. The results indicate that the lead-time was reduced from 26 to 10 days.
Using appropriate statistical tools and by incorporating standard engineering changes
the occurrence of non-conformance was reduced by 30%. This resulted in a reduction
of rework time by 3 hours per aircraft and accounted for close to $6000 of savings.

viii
TABLE OF CONTENTS CHAPTER PAGE 1 INTRODUCTION .............................................................................................1 2 LITERATURE REVIEW ...................................................................................3
2.1 Six-Sigma Evolution ................................................................................3 2.1.1 What is Six-Sigma?.......................................................................4 2.1.2 Motorola’s Six-Sigma Journey.......................................................6 2.1.3 General Electric’s Six-Sigma journey ............................................7 2.1.4 Misapprehensions about Six-Sigma..............................................8
2.2 Evolution of Lean ....................................................................................8
2.2.1 Misconceptions of Lean ..............................................................12
2.3 Lean Six-Sigma Integration ..................................................................13 2.3.1 Lean Six-Sigma at Lockheed Martin ...........................................14 2.3.2 Lean Six-Sigma at Bank One......................................................15 2.3.3 Tools used in Lean Six-Sigma.....................................................16
2.4 Applications in aircraft industries ...........................................................18
3 CASE STUDY ...............................................................................................23
3.1 Company Overview................................................................................23 3.2 Objectives ..............................................................................................24 3.3 Problem Statement ................................................................................25 3.4 Proposed Methodology ..........................................................................25 3.5 High Level Value Stream Map ...............................................................26 3.6 Phase I: Lead-Time Reduction ..............................................................28
3.7 Phase II: Non-Conformance Reduction .................................................36
4 RESULTS AND CONCLUSION.....................................................................47 LIST OF REFERENCES .....................................................................................50

ix
LIST OF TABLES
1. Initial Shortage List ........................................................................................30 2. Shortage List After Improvement ...................................................................34

x
LIST OF FIGURES
1. Supplier-Input-Process-Output-Customer......................................................18 2. Cause and Effect Diagram.............................................................................19 3. Pareto Chart ..................................................................................................20 4. Schematic Representation of Methodology ...................................................26 5. High Level Value Stream Map .......................................................................27 6. Current State Value Stream Map...................................................................29 7. Shortage List By Part Number and Number of Occurrences .........................32 8. Distribution of Part Shortages ........................................................................33 9. Value Stream Map After Improvement...........................................................35 10. Sample Defect Concentration Chart ..............................................................37 11. Causes for Deviation in Contour ....................................................................38 12. Faro Arm – G0 – 02 .......................................................................................40 13. Sample Output From IMAGE WARE .............................................................41 14. Mean Deviation on Sample............................................................................42 15. Force Measurements on Sample ...................................................................43 16. Bell Crank Assembly......................................................................................44 17. Force Measurements After Design Changes .................................................45 18. Bell Crank Assembly After Design Changes..................................................46
1
CHAPTER 1
INTRODUCTION
In the contemporary world of manufacturing, due to enormous competition,
different companies have started to look for different approaches and practices to
improve the quality level of the product at a reduced cost, create a safe and rewarding
workplace and eventually achieve higher customer satisfaction. During the early ages
of manufacturing, US manufacturers mainly relied on mass production and final stage
inspection. The product would be inspected only at the final stages. These practices
resulted in increased inventory level, increase in rework and the consequence was loss
of time and money. The Japanese counterparts started introducing low cost products
with higher quality. Faced with a global competition, the US manufacturers had to
change their manufacturing strategies to maintain market share. In the 1980’s Motorola
launched a process improvement methodology and named it six-sigma. After launching
six-sigma initiatives Motorola enjoyed increased customer experience, increased sales,
increased stock rate and more profit. Later General Electrics and Allied Signals followed
the footsteps of Motorola and they also improved their business [9]. On the other hand,
the Japanese were practicing Lean Manufacturing, which has been in use for more than
20 years. They were concentrating on delivering a high quality product in a reduced
lead-time. They believed that this would directly affect and improve customer
satisfaction. Though General Electrics enjoyed higher Quality product at reduced cost,
they were not able to meet their target delivery dates. Their lead-time in delivering the
finished goods was much higher. So, General Electrics started using lean
manufacturing concepts to overcome lead-time related problems [9]. The integrated
2
approach of lean and six-sigma explains the connection between shareholder value
establishment and precise advancement in the business. Lean six-sigma gives more
edge than that could have been attained individually by Lean or Six-Sigma [12].
The following chapter contains a review of literature pertinent to the evolution of
lean and six-sigma concepts, their individual approaches towards process improvement
and their integration. Chapter 4 represents a case study that was deployed for process
improvement using the integrated lean six-sigma approach. Chapter 4 contains the
results and conclusions obtained from the case study.

3
CHAPTER 2
LITERATURE REVIEW
This Literature review will give a basic idea about the evolution of Six-
Sigma, what it is about and its methodology. Some case studies to highlight its
importance are also discussed in this literature review. While explaining the concept of
Lean, case studies of successful Lean implementation are also elucidated. It will also
brief about Lean manufacturing’s integration with Six-Sigma and how it has helped in
process improvement.
2.1 Six-Sigma evolution:
Though Fredrick Taylor, Walter Shewhart and Henry Ford played a great role in
the evolution of Six-Sigma in the early twentieth century, it is Bill Smith, Vice President
of Motorola Corporation, who is considered as the father of Six-Sigma [22]. Fredrick
Taylor came up with the methodology of breaking systems into sub systems in order to
increase the efficiency of the manufacturing process [4]. Henry Ford followed his four
principles, namely continuous flow, interchangeable parts, division of labor and
reduction of wasted effort, in order to end up in an affordable priced automobile [4]. The
development of control charts by Walter Shewhart laid the base for statistical methods
to measure the variability and quality of various processes [4].
Later during the 1950s, the Japanese manufacturing sector revolutionized their
quality and competitiveness in the world based on the works of Dr. W. Edwards
Deming, Dr. Armand Feigenbaum, and Dr. Joseph M Juran. Dr. W. Edwards Deming
developed the improvement cycle of ‘Plan-Do-Check-Act’, better known as the PDCA

4
cycle. Dr Joseph M. Juran gave to the world his ‘Quality Trilogy’ and it was Dr Armand
Feigenbaum who initiated the concepts of ‘Total Quality Control’ (TQC) [4]. Between
1960 and 1980, the Japanese understood that everyone in an organization is important
to maintain quality and so training programs were conducted for almost all employees
not considering the department they belong to. Any organization that is dynamically
working to build the theme of Six-Sigma and to put into practice, the concepts of Six-
Sigma, in its daily management activities, with noteworthy improvements in the process
performance and customer satisfaction is considered as a Six-Sigma organization [18].
2.1.1 What is Six-Sigma?
Six-Sigma in general is a fact-driven, disciplined and statistical approach that is
followed to eliminate defects and guide processes to reach perfection. Being a versatile
system in making business leadership perform better, Six-Sigma doesn’t work based on
any single theory/strategy. It is based on result driven strategies used in the past
century and many important management ideas, which lead the way in today’s
competitive money making world. There is no one single definition for Six-Sigma. It is a
statistical measure of performance of processes/products; a goal that reaches
perfection for performance improvement; a management system to achieve business
leadership and enhanced performance in a long run [18]. In simple words, Six-Sigma
combines best techniques of the recent past with the best management breakthroughs
and common sense. Three main areas of Six-Sigma focus are customer satisfaction,
reducing defects and eventually reducing cycle time. Team leader’s commitment, usage
of common language throughout the organization, process reengineering enforced by

5
aggressive engineering goals, fact based decision making, good communications to
keep the interest on Six-Sigma and its continuity on track and maintaining metrics to
evaluate past performance and assess future goals are some of the key success factors
of Six-Sigma [1].
Six-Sigma is a management language that institutionalizes a precise, closely
controlled, fact-based approach to deliver more money to the bottom line through
process improvement and process design projects. These design projects are selected
by top management and led by highly trained Six-Sigma Black Belts or Master Black
Belts with the intention to create ideal processes, products, and services all aligned to
delivering what the customers want [4]. From the above discussion it is clear that the
management’s commitment, which acts as the driving force for both breakthrough and
traditional improvements, is very essential in the journey towards successful
implementation of Six-Sigma methodology. In general mathematical terms Six-Sigma is
the relationship of manufacturing variability and product specifications. In statistical
terms, it means that no more than 3.4 DPMO (defects per million opportunities) is
possible when a process is at a Six-Sigma level of performance. A defect can be
defined as a measurable attribute of the process or its output that is not within the
standard acceptable limits, i.e., not conforming to specifications [5].
Customer focus, fact-driven management, process focus, down to business
management, boundary-less group effort and drive for excellence are the six critical
factors that are required for an organization to attain a quality level of Six-Sigma [19].
The eventual purpose of Six-Sigma is to raise profits by getting rid of variability,
discrepancies and wastes that weaken customer trustworthiness. Any organization like
6
manufacturing, engineering, R&D, sales and marketing, health care and government
agencies can utilize Six-Sigma for excellence in quality [4].
2.1.2 Motorola’s Six-Sigma Journey
In the 1980s Motorola was the leader in the market of its kind. But during the
mid-1980s Japanese high quality products made Motorola lose its feet in the market
once conquered by them. Customer discontent was like a pandemic with Motorola.
Making profit was out of reach for the reason that the operating costs were very high.
Once the head of purchasing from one of the customers was quoted as saying that
“Love, love, love the product; hate, hate, hate the company.” This ultimately
demonstrates that the business was not customer driven. Agreement reviews,
responses to demand for quotes, invoicing, response to customer grievances and other
administrative areas were in a weak position because of the weary administration of
management and disinterested workers. Response times were lengthy and not planned
for customer satisfaction. Customers experienced a high level of early-life failures of the
products. [16]
Inspired by the Japanese manufacturer’s success, Motorola arranged visits to
Japan to study the operating methods and product quality levels pursued by the
Japanese. What Motorola found was that the quality level of the products should be
quantified so as to improve the product’s quality. Motorola’s CEO Bob Galvin,
considered the pioneer of Six-Sigma at Motorola, visited major company sites worldwide
to instruct employees about Six-Sigma and encouraged them to integrate it into the day-
to-day business activities. The concept of opportunities-for-errors was developed to

7
account for differing complexities [16]. He along with Bill Smith, Motorola’s Vice-
President dedicated Motorola to a plan that would decide quality goals for improving the
corporation 10 times by 1989, 100 times by 1991. It was with his help that Motorola won
its first Malcolm Baldrige National Quality Award in 1989.
2.1.3 General Electric’s Six-Sigma Journey
Inspired by the success of Six-Sigma implementation in Allied Signals, Jack
Welch, CEO of General Electric (GE), went on to use Six-Sigma as a business
improvement strategy. Spending about $250 million GE educated and trained nearly
4,000 Black Belts and Master Belts and additional 60,000 Green Belts out of a total
work force of 60,000 in the year 1997. These trainings added to a $3,000 million as an
operating income for the year 1997. GE adopted Motorola’s ‘measure-analyze-improve-
control’ (MAIC) and added to ‘define’ to it to frame DMAIC approach. Also GE adopted
many other concepts and disciplines from Motorola. The improvement measures varied
from creating new design for a product from start to finish to saving billions of dollars in
a span of three years. GE Medical System used six-sigma principles to manufacture a
$1.25 million diagnostic scanner from start to finish, which ultimately reduced chest-
scanning time from 180 seconds to 17 seconds. GE Plastics improved production of
plastic by 1.1 billion pounds by implementing Six-Sigma technology. Inventory turns
increased from 5.8 to 9.2. During the period from 1996 to 1998, GE incurred $1 billion in
cost and the return on that investment was close to $1.75 billion [17, 19].

8
2.1.4 Misapprehensions about Six-Sigma
Though Six-Sigma has been proved to be successful there have always been
some misconceptions about it. Many people look upon it as a catchphrase of the month.
They fail to keep in mind that it is a strategy, which evolved through Deming’s
management philosophies and total quality management. It focuses on customer,
maintains complete training structure and delineates value from customer’s viewpoint
considering quality, service, and delivery. Another misconception is that the goal of 3.4
defectives per million is absolute and should be functional to every opportunity,
tolerance and specification. The idea is to use Pareto based analysis for selecting
projects that are like low hanging fruits, which will provide instant outcomes. The last
misconception is that Six-Sigma is only a quality program. From past literature it is
evident that Six-Sigma relates quality and customer obligations, meaning that it involves
all those who are accountable to deliver a final product to the customer [2].
2.2 Evolution of Lean
The concept of lean has been prevalent in the manufacturing sector for more
than 20 years. It is commonly known as a measure to reduce inventory and the number
of hands involved in any process. It is also associated with continuous improvement.
The main theme in the lean concept is waste reduction. Lean can also be referred to as
a production philosophy that foresees the supply chain that consists of receiving raw
material to sending out finished goods and from designing a product to customer
service. It is an idea of “hundred small improvements every day” than “one home run
once a year” [8]. It is a useful tool that helps in reducing waste of time, material, effort
9
and resources in any industry. The core approach of lean manufacturing is to produce a
product in the shortest possible cycle time and streamline the flow of processes.
According to the Lean institute, the fundamental objective of Lean is to offer value to the
customer through an ideal value added process that has zero waste. Based on a study
by the Massachusetts Institute of Technology, lean requires half as much effort in
design, development and time than a normal production process [23].
Unlike older manufacturing strategies like, craft manufacturing and mass
production, Lean depends on many frequent deliveries of limited quantities with a fewer
possible suppliers. The former philosophies resulted in large work in process inventory.
Creating value throughout the process stream and therefore eliminating waste is known
as ‘Lean management’. In mass production, the cost involved in fixing defects is less
than the cost the involved in producing defective parts in lots. Lean creates a
standardized work environment and minimizes the cycle time and variability in
production to meet the variability in demand. The other major variability in today’s
industrial environment is supplier variability, which can also be overcome by partnering
with suppliers and creating a supplier - producer cooperation [2]. The introduction of
lean manufacturing has changed the typical ways of measuring performance.
Performance measures like cycle time tracking, sales per employee hour and worker
participation have replaced measures like equipment utilization and labor variance.
Higher quality products can be delivered at reduced rework and inspection. Eliminating
excess inventory, excess floor space and unwanted movements result in achieving the
shortest possible cycle time. Hence, lean concepts, when implemented successfully,
can deliver a product with higher quality in a short period of time.
10
The main contributors that make designing, redesigning and parts manufacturing
simple in a short span of time are factory workforce, suppliers and capacity. Among
many, the common Lean practices include standardization, reduced cycle time, built in
quality, continuous improvement, and product based streamlined layout [20]. The
concept of zero defects in lean manufacturing includes mistake proofing (Poka Yoke),
source and automated inspection, production stoppage as soon as a defect is identified
and enduring setup conformance. As an essence, Lean production aims at increasing
the product flow velocity and throughput by eliminating all possible non-value added
activities [2]. The concept of Lean manufacturing relies mainly on manufacturing cells
that are capable of producing a variety of products and keeping the production facility
flexible enough to produce the exact mix and right quantity of products. Availability of a
right product in right quantity at the right time is also one way of describing Lean
manufacturing.
Unlike traditional forecast based production, lean manufacturing utilizes a pull
system where production is triggered by demand. The rate at which finished goods
leave the facility is what determines the rate of supply from suppliers or from a
preceding work center in the same facility [24]. Generally the following are termed as
the basic principles of lean, define value from customer’s standpoint, identify the value
stream, eliminate seven deadly wastes, pull the work and not push and pursue the
same to perfection [26]. An apt example of Lean implementation would be Toyota,
which incorporated Lean under its Toyota Production System. Just in time (JIT), and
autonomation (Jidoka) are considered the two pillars of this system. Value Stream
Management is a process by which planning and lean inventiveness through methodical
11
data collection and data analysis are linked. A value stream identifies all essential
members and information of a process or supply chain. Some of the essential
members/factors include suppliers, customers, process flow, mode of information flow
(electronic or manual) and information about cycle time, lead-time, customer
requirement, availability of resources, and net available time per operating period (day
or shift). The principle of cost reduction, knowledge about the seven deadly wastes, just
in time, autonomation, 5S and the stages of Lean implementation (demand, floe and
leveling) are the key notions and tools used in lean initiatives. These tools actually help
in developing an accurate value stream map.
One way to be profitable is to reduce waste from the system by effectively
utilizing the value stream and eventually by reducing the cost. This is how the cost
reduction principle works. The eventual intention of implementing Lean is to eliminate
wastes like overproduction, excessive waiting, excessive transport, unwanted
processing, more than required inventory, unwanted movement, and rejections. Just in
time and the continuous flow production process provide best value to customer by
supplying the required product in required quantity on time. Restocking one piece as the
customer pulls out one is an ideal behavior of JIT.
Autonomation, also known as Jidoka, is not complete automation but automation
with a human touch. It simply means using automated mistake proofing for preventing
defects and free up workers to perform multiple tasks within a work cell. This strategy
maintains a zero defect environment where a defective product is never allowed to flow
down the production stream and hence reducing the risk of customers receiving
defective parts. 5S (Sort – Set in order – Shine – Standardize - Sustain) is a process
12
designed for planned organizing and standardizing the workplace. 5S is an important
member of the lean implementation process by which the work area is maintained as a
neat and safe work place. Generally 5S audits are conducted on a regular basis to
maintain the standards of the work place. It promotes cleaning and maintaining the work
area, which makes it easy to identify and spot the required tools at the right time [17 &
26].
2.2.1 Misconceptions of Lean
Just like Six-Sigma, Lean also has some misconceptions in spite of its popularity
and success. Employee layoff is the most common misconception whenever the word
Lean is delivered. The thought that lean manufacturing is successful only in Japanese
sectors is another misconception. In fact some of the companies that have implemented
lean are non-Japanese. The third misconception is that only manufacturing
organizations can benefit from lean initiatives. Lean reflects on each step in the process
as a service step, which means that each activity is considered to be adding value to
customer’s expectation. While processing claims in the insurance industry, evaluating
loan applications at a bank would be an apt example [17].
13
2.3 Lean-Six Sigma integration:
Though both, six-sigma and Lean, have made improvements in organizations
individually, together they complimented each other. As a means to having a scientific
approach towards quality, lean organizations should make additional use of the data in
decision-making process. Companies that have benefited from lean manufacturing lack
six-sigma knowledge [13], which is important in training the management about the
involvement of people and requirement of resources. Lean techniques like value stream
mapping helps in identifying the various value added and non-value added activities
involved within a process based on definitions. Identifying Customer Critical-to-Quality
characteristics, a six-sigma tool, can further refine this list of value added and non-value
added activities. Value stream mapping helps in calculating the actual cycle time,
inventory levels and lead-time for any particular process. Six-Sigma, on the other hand,
ensures that there is less variation in the process.
General Electrics has considered Six-Sigma as the best initiative they have ever
come up with. But even now they accept that they have variance in their deliveries
between four to twenty days. Having Six-Sigma alone has not reduced the lead-time for
General Electrics. The point to be noted is that Lean and Six-Sigma should be
integrated for a combined improvement. Six-sigma does not address the process speed
and eventually looses site of customer due dates. On the other hand, Lean fails to
develop cultural infrastructure, which is important for its successful implementation.
Lean Six-Sigma is a methodology that maximizes shareholder value by achieving the
fastest rate of improvement in customer satisfaction, cost, quality, process speed and
invested cost [12]. The synthesis of six-sigma and lean production is necessary

14
because lean cannot bring a process under statistical control, SS cannot reduce lead-
time, and both enable the reduction of the cost of complexity [8].
Some questions that seem to be difficult to answer by both lean and Six-
Sigma are, which process to consider first? In what order should implementation be
carried out? How to attain high quality, improved lead-time and high cost savings
quickly? Lean Six-Sigma tends to increase profit by reducing quality costs and the
overall invested capital reduces inventory by bringing down the process lead-time. Lean
six-sigma’s relentless pursuit of high quality and speed lead to corporate success and
personal success for those who become part of the lean six-sigma journey [13].
2.3.1 Lean Six-Sigma at Lockheed Martin
Lockheed Martin is rooted in the production of aeronautical and space systems,
their integration and technology services. The company put lean six-sigma into practice
in the year 1998 under the name “LM21 Best Practices” [24]. This included thorough
and careful study of the process, proper differentiation of value-added and non value-
added processes, waste elimination and improvement measures. As a top-down
approach, the program started with the training of top management and went down in
the organizational structure. The company made it mandatory that anyone with
incentive compensation has to undergo the training. This includes people holding a
position of director or above. As per Lean concepts, the initial step in the process
enhancement plan was value stream mapping. It provided information about whether
customer expectations are met, presence of any gaps in meeting customer
requirements and availability of possible solutions to bridge the gaps. The entire
15
organization was involved in all the process improvement projects. Improvement
methods were a combination of tools from both Lean and Six-Sigma. Lockheed Martin
was loosing a huge sum of money just on inspection. They worked with critical suppliers
to integrate Lean and SS into their plants. By implementing Lean Six-Sigma Lockheed
Martin encompassed about 5000 projects, out of which a majority were improvement
projects. All started with the aim of reducing the cost by $3.7 billion over a four-year
period, which resulted in close to $4 billion of reduction in cost [24].
2.3.2 Lean Six-Sigma at Bank One
Lewis Fischer, the Division Executive of National Enterprise Operation (NEO)
encouraged the implementation Lean Six-Sigma ideology at NEO before the J P
Morgan, NEO merger. Being one among the top 10 banks back in the 1990s, they were
struggling hard for basic continued existence. He asserted that, “We were not striving
for best in class, just getting control over our operations” [13]. As a part of the
improvement process, focus was laid on performance measurement and opportunity
identification. Their problem solving approach was divided into different stages. The first
stage was to address all possible gaps in their network. The second stage focused
more on lean goals such as eliminating complexity and increasing process velocity. It
was based on kaizen, a series of continuous improvement events. The objective was to
first identify the value stream, spot the problems and resolve them by providing
solutions. One of the main and initial hurdles they had was to gain trust of their
employees. But eventually by empowering the people to facilitate the processes, the
organization managed to gain their trust. This paved the way for providing training for all
16
employees and creation of project oriented teams. The second stage started with the
top management being introduced to key concepts on Lean and Six-Sigma. They listed
opportunities, and prioritized projects. Other than forming cross-functional teams,
employees who were directly responsible for selected processes were involved in the
improvement cycle. Within a span of two years, there was a whole lot of change in the
work culture. Also there was a considerable reduction in the overall cycle time. Cycle
time improvements ranged from 30 percent to 75 percent, one administrative process
went from 20 minutes to12 minutes, a complaint resolution process dropped from 30
days to mere 8 days [13].
2.3.3 Tools used in Lean Six-Sigma
There are a variety of tools that can be used for lean six-sigma approach. It is not
required to use all tools at all times. Based on the nature of the process the selection of
tools may vary. Different tools can be used in different phases of the implementation
process. The usage of some of the common tools is discussed in the following section.
Flow Diagrams: This is a graphic representation of the series of steps followed in
the course of a process. These diagrams help examine the logic; or lack of logic, in the
sequence of steps that are used to produce output. It often helps in identifying
bottlenecks so that improvement teams working on projects can actually target these
areas first. In general it gives a good perspective of the process as a whole. Flow
diagrams can also be used to define the scope of a quality improvement project and the
boundaries of the team’s effort. [19]
17
Histograms: A histogram is used to graphically summarize and display the
distribution of data set. In a typical frequency histogram, the heights of the bars are
determined by the class frequency. Given that the bars in a histogram are of equal
width, the area of a particular bar is relative to the equivalent class relative frequency
[19].
Value Stream Mapping (VSM): Value stream management is a process of
planning and linking lean initiatives through systematic data capture and analysis. Value
stream mapping is a visual representation of material and information flow for a product
family (value stream). It is vital as a tool for visually managing process improvement
[26].
Brainstorming: Alex Osborn developed brainstorming technique in 1950s [14]. The
success of this technique is based on the quantity of ideas. It is a group technique for
generating new ideas and promoting creative thinking. According to Dr. Juran [19], there
are four rules of brainstorming such as no idea can be criticized, self-criticism and self-
judgment are suspended, team members are instructed to aim for large number of new
ideas in the shortest possible time, and team members should expand ideas. This
technique may be used to define a project, to develop theories for identifying symptoms
of the problem, and for designing solutions after identification of the root causes.
DMAIC
DMAIC stands for Define, Measure, Analyze, Improve and Control. It is a
systematic Six-Sigma approach that can be used for process improvement or redesign
[20].
18
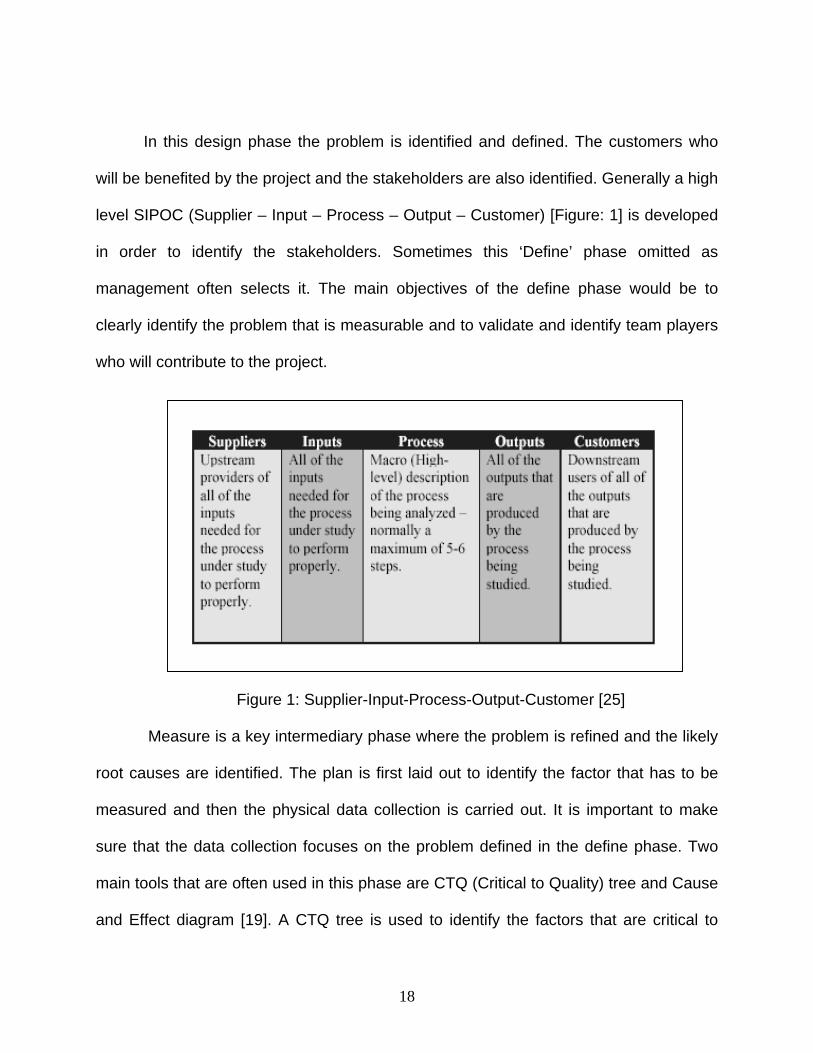
In this design phase the problem is identified and defined. The customers who
will be benefited by the project and the stakeholders are also identified. Generally a high
level SIPOC (Supplier – Input – Process – Output – Customer) [Figure: 1] is developed
in order to identify the stakeholders. Sometimes this ‘Define’ phase omitted as
management often selects it. The main objectives of the define phase would be to
clearly identify the problem that is measurable and to validate and identify team players
who will contribute to the project.
Figure 1: Supplier-Input-Process-Output-Customer [25]
Measure is a key intermediary phase where the problem is refined and the likely
root causes are identified. The plan is first laid out to identify the factor that has to be
measured and then the physical data collection is carried out. It is important to make
sure that the data collection focuses on the problem defined in the define phase. Two
main tools that are often used in this phase are CTQ (Critical to Quality) tree and Cause
and Effect diagram [19]. A CTQ tree is used to identify the factors that are critical to

19
customers. SIPOC plays a major role in developing a CTQ tree so as to identify quality
requirements of the customer. After the critical to quality factors are identified the cause
and effect (CE) diagram is constructed. A sample CE diagram is shown in Figure 2.
Though the CE diagram does not identify the potential causes it helps in understanding
the possible causes that contribute to the effect. The most important aspect or
characteristic of the CE diagram is that it will depict the relationship between all the
factors that may be potential contributors to the targeted problem. [19, 20]
Figure 2: Cause and Effect Diagram [21]
Analysis is generally of two types, process analysis and data analysis. Process
analysis is often related with factors that contribute to the out come of the process.
Cycle time, down time and rework time are some of the factors that are analyzed in
order to improve the process. Data analysis, on the other hand, is used to identify
trends and patterns incurred from the process output [19]. Tools like Pareto chart,
histogram and scatter plot can be used for such analysis. Figure 3 shows a sample

20
Pareto chart. A Pareto chart is one form of histogram or bar chart that is developed in
the decreasing order of occurrences of categories. It helps in identifying the category
that has a higher impact on the problem. A scatter plot helps in identifying the
relationship between various factors of significance. The main objective of the scatter
plot would be to develop an equation that helps in projecting the value of one variable
with respect to the other variable. There are different correlations that can be depicted
from a scatter plot.
Figure 3: Pareto Chart [7]
In the improve phase, solutions are obtained to improve the factors identified
based on the data analysis. Different solutions are documented in this phase and they
are tried on the process and the results are documented and analyzed once again to
determine any improvements. In the control phase of DMAIC, performance
improvements implemented in the improve phase are maintained and suitable
measures are taken to sustain them [19].
21
2.4 Applications in Aircraft industries:
The fundamental concerns bringing down the profit in aerospace segments are
industry wide and associated with remarkable demands. Over the past few decades, on
the business side of aircrafts, the returns from available-seat-mile have significantly
gone down. The capacity for air travel having grown immensely and the competition
around the globe has contributed in increased pressure among aerospace companies
[11]. Under these circumstances each manufacturer has been pushed to a situation
where high production and reduced cost are required to survive the competition.
The military side of aerospace industry is experiencing a different form of
pressure [11]. The aircraft manufacturers have to survive competition that may rise due
to new sophisticated and technical models. They have to continue controlling cost
factors, design factors and also the volume they make in order to meet the needs. The
industry can use its available development facilities as a base for the upcoming Lean
and Six-Sigma initiatives to generate a profitable quality product and thereby resulting in
business enhancement [11].
In 1998, when Boeing started to use their Arizona plant to assemble the AH-64D
Apache Longbow Helicopter, they experienced a heavy downfall in the overall
operational performance and high cycle time [27]. They decided to use Lean concepts
and use statistical tools to reduce cycle time and increase the performance of their
assembly operations. Using the Lean techniques the Arizona plant started deploying a
number of improvement initiatives. After the deployment, they were able to reduce the
number of internal defects by 58% and the cost associated with it by 61%. Since 1999
they have a 100% on-time delivery rate and have reduce the number of hours required

22
to build an aircraft by 48%. Above all the overall cycle time was reduced by more than
40%. The efforts and success of Boeing’s Arizona plant also earned them the
prestigious Shingo Prize for Manufacturing in 2005. Since winning the award, they
made a change to the layout of the assembly line. They were able to further reduce the
cycle time by 8%. Boeing’s success story represents a visible evidence of the benefits
that can be expected from the implementation of lean initiatives in an assembly unit.
[27]

23
CHAPTER 3
CASE STUDY
This chapter represents a case study performed at Bombardier Aerospace
Learjet, a leading aircraft manufacturing company
3.1 Company overview
It all started in the year 1960. When a Swiss aircraft company ceased all its
efforts in developing an unsuccessful fighter jet, Bill Lear and his team saw the effort as
a first step towards the development of a world-class business jet. The initial Lear jets
had their designs incorporated from a slightly changed one that was used by the
prototype aircrafts of the Swiss aircraft Company. By 1962, the base for developing the
aircraft and the tooling required for it were moved to Wichita, KS, U.S.A. the very next
year the company incurred its new name,” Lear Jet Corporation”. The next year, in
1963, the first flight of the Learjet 23 (six to eight seats) was recorded.
In 1967, the Gates Company acquired Bill Lear’s 60% shares of the company
and later in 1969 it was merged with its aviation partner and was renamed as ‘Gates
Learjet Corporation’. After launching different models with series numbers 25, 35, 54, 55
and 56 in 1987 Integrated Acquisition, Inc, acquired it and renamed it to Learjet
Corporation.
After going through different acquisitions, finally the Learjet Corporation was
acquired by ‘Bombardier Aerospace’ in the year 1990. After acquisition, future aircrafts
were promoted as ‘Bombardier Learjet Family’. The latest additions to the Learjet fleet
24
were the models 60 and 45. Recently the extended range versions of these two models
have also been launched.
3.2 Objectives
A case study was conducted in the Upper Door of Learjet Model 40/45 to analyze
the problems of late delivery and frequent occurrences of non-conformance in the final
aircraft assembly line. The Door Shop has two separate lines, one for the upper door
and another for the lower door assembly. The upper door has to go through 4 positions
in order to be ready for installation. Positions 1, 2 and 4 are at the door shop while
position 3 is at the foam shop where sealing and foaming is carried out. Each
manufacturing line has a specified move time that is associated with the move time of
the final assembly of the aircraft. Model 40/45 has a move time of four days. Therefore,
every four days, a completed door should leave the door shop and be installed on the
fuselage at the final assembly line.
In order for the door to be completed as per schedule, parts should be readily
available. Parts for this door assembly are delivered as kits. All the parts required for the
assembly of the door are collected together as a kit and supplied to the shop floor for
assembly. Material Control agents (Stock Room) provide the complete kit for
production. Each kit contains parts that are either made in house or purchased from an
outside vendor. When the purchased parts are short in supply, Procurement
department is notified for appropriate action. The final assembly of the Model-40/45
aircraft has 6 positions with a move time of 4 days. As per production schedule, the
doors should be installed in position 3. The doors were delivered to the final assembly

25
line only when the aircraft was in its position 5, which would be after 8 manufacturing
days. Even after the doors were available for installation, there were occurrences of
non-conformance on the upper door. At least 8-10 man hours were required to rework
the upper door assembly.
3.3 Problem Statement:
The Model 40/45 upper door is delivered late to the final assembly line after 2
move cycles (8 days) and in turn 8 to 10 hours are spent on the doors to rework non-
conformances.
3.4 Proposed Methodology
The methodology proposed here is an integrated approach of lean and six-
sigma. To start with, a high level should be developed for the process under study.
Possible improvement opportunities can be identified from this value stream map. All
possible opportunities should be identified here, irrespective of the nature of the
problem. DMAIC should be used for working on these opportunities. Since DMAIC is a
systematic approach it keeps the project on track. Based on the nature of the problem,
any of the available six-sigma tools or lean tools or both together can be used to
analyze and improve the problematic processes. Based on the nature and size of the
problem the usage of lean and six sigma tools could vary. For example, if the problem is
process based tools like Control charts, Pareto charts can be used and if the problem is
workplace related tools like 5-S and Kaizen can be used. A schematic representation of
the proposed methodology is shown in Figure 4.

26
Figure 4: Schematic representation of methodology
3.5 High Level Value Stream Map
As an initial step, a high-level value stream map was developed so as to prove
that there are lead-time related issues and non-conformances with the door delivered by
the door shop. The high-level value stream map in Figure 5 indicates when and in
which position the completed door is delivered at the final assembly line. The cycle time
and rework time recorded in assembling the door with the fuselage is also documented
and shown. As shown, the time taken to mount both the upper and lower doors and
perform some functional tests before the aircraft is moved to the sixth position is 25
hours.
Value Stream Map (To identify opportunities)
D M A I C
D M A I C
D M A I C
Lean and/or Six Sigma Tools Value Stream Map Kaizen 5-S Poke Yoke
Control Chart Pareto Chart Scatter plot

27
Figure 5: High Level Value Stream Map
28
From the value stream map, two opportunities were identified. One was to
ensure on-time delivery of the upper door to position 3, which is lead-time reduction.
The other was to reduce rework hours associated with the installation of the upper door
assembly on the fuselage. Having identified the improvement opportunities the next
step was to work on the two opportunities identified using DMAIC approach.
The entire project was divided into two phases. The first phase was to work on
lead-time reduction and the second phase was to work on and reduce the non-
conformances occurring due to the upper door when mounted on the fuselage. Lead-
time reduction was selected first in order to follow the order in which the opportunities
were identified.
3.6 Phase I: Lead-Time Reduction:
Define
It was reported by the final assembly crew that the completed doors have been
reaching the floor only when the aircraft reaches position 5. As per the master
production schedule, the doors have to be available when the aircraft is in position 3. In
order to define and quantify the issue with lead-time a current state value stream map
(VSM) [Figure: 6] was developed for the assembly of the upper door. The VSM included
the staging time and lead-time of the parts required for the assembly of the door. The
VSM also includes different positions (stages) in the assembly and their corresponding
cycle times. The VSM shows that there are kits waiting in between positions. Based on
the data on inventory level, the lead-time that resulted from this VSM is 26 days. These
26 days are inclusive of the 10 days of parts’ staging period in the stock room.

29
Figure 6: Current State Value Stream Map
Since the doors are assembled as per the master production schedule, the door
assembly line is already in a pull environment. In a pull environment there should be no
inventory in between positions. There are 4 kits waiting in between positions. Since the
30
move rate is 4 days, it is 16 days of inventory, which means that each kit spends at
least 16 days more than the actual 12 days. Whenever a part is missing from a kit, the
whole kit is set aside and the next available is taken and used. Hence, the kits are
waiting in between positions because of shortage of parts. Since part shortages were a
main player in late delivery of doors, the next step was to measure the shortage of
parts.
Measure
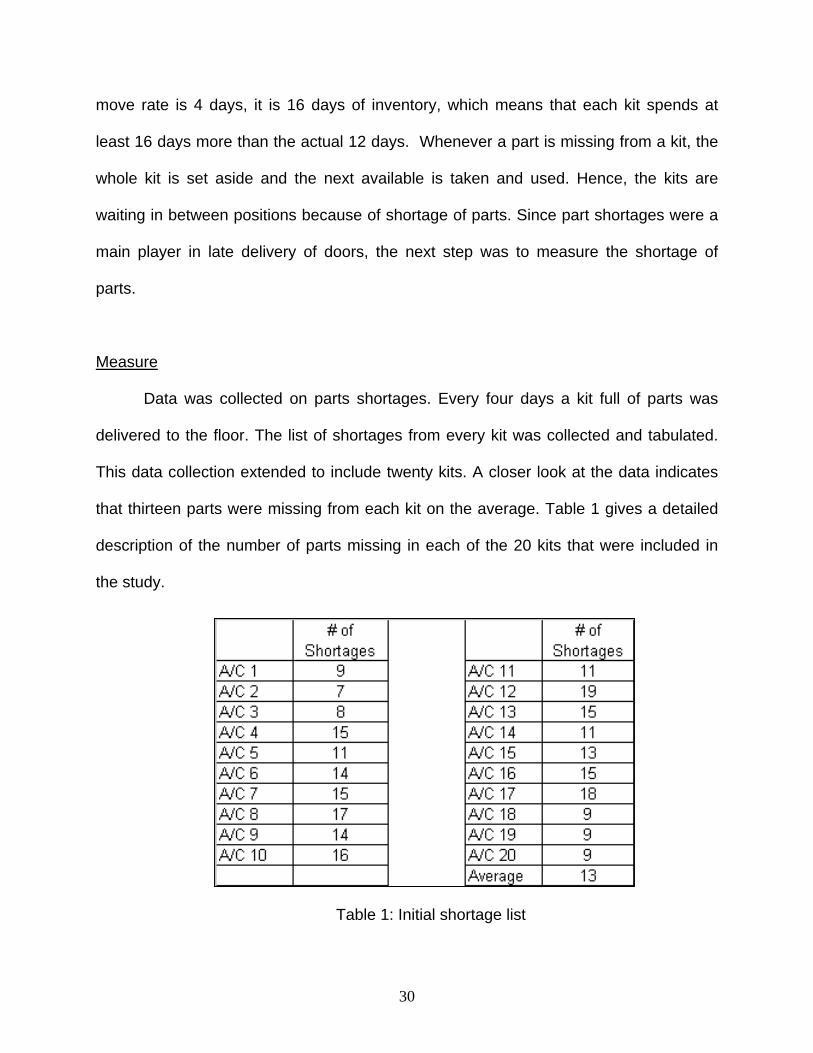
Data was collected on parts shortages. Every four days a kit full of parts was
delivered to the floor. The list of shortages from every kit was collected and tabulated.
This data collection extended to include twenty kits. A closer look at the data indicates
that thirteen parts were missing from each kit on the average. Table 1 gives a detailed
description of the number of parts missing in each of the 20 kits that were included in
the study.
Table 1: Initial shortage list

31
Analyze
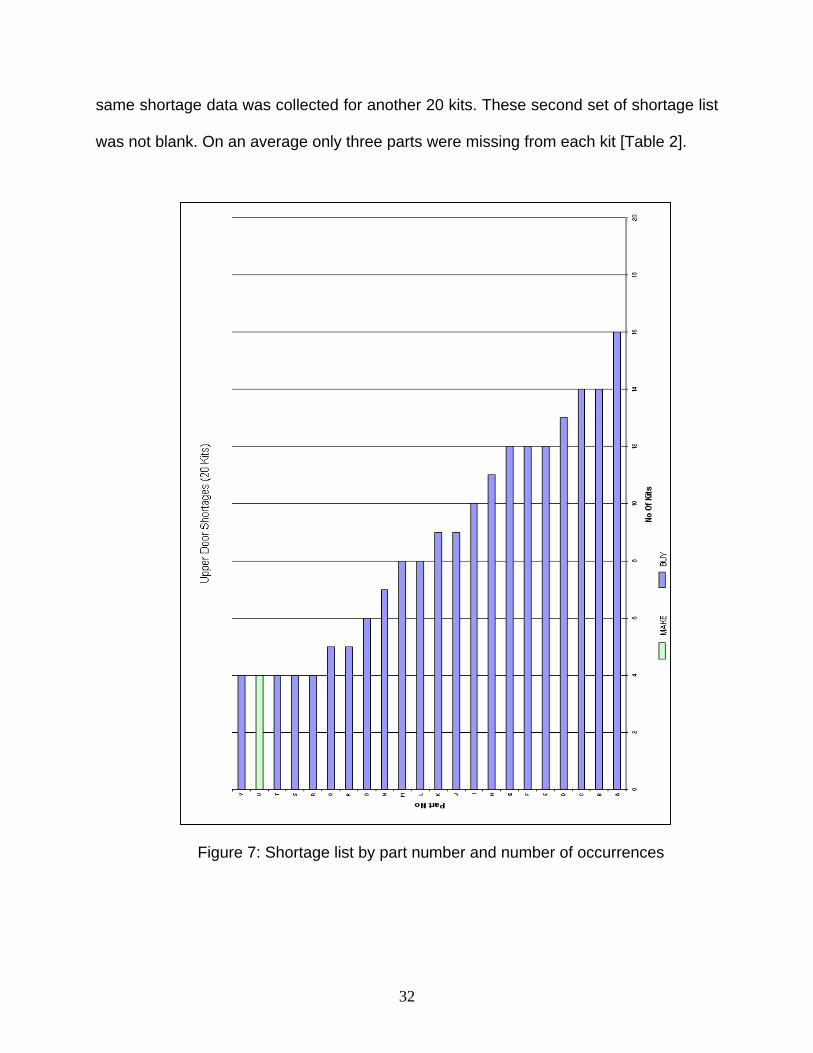
Apart from the frequency of parts missing from each kit, the trend of individual missing
parts was also considered. The make of the part, that is, weather the part was made in-
house (Learjet) or purchased from an outside vendor was also recorded. Using these
three different measures, namely number of parts missing in a kit, parts that were
missing repeatedly and the make of the part, the list of parts was sorted out and a chart
was plotted [Figure 7]. It is apparent from figure 7 that there is only one in-house part
which was found missing in 4 of the 20 kits. In order to get corrective action form the
vendors that supply the parts, the vendor names were retrieved from the database.
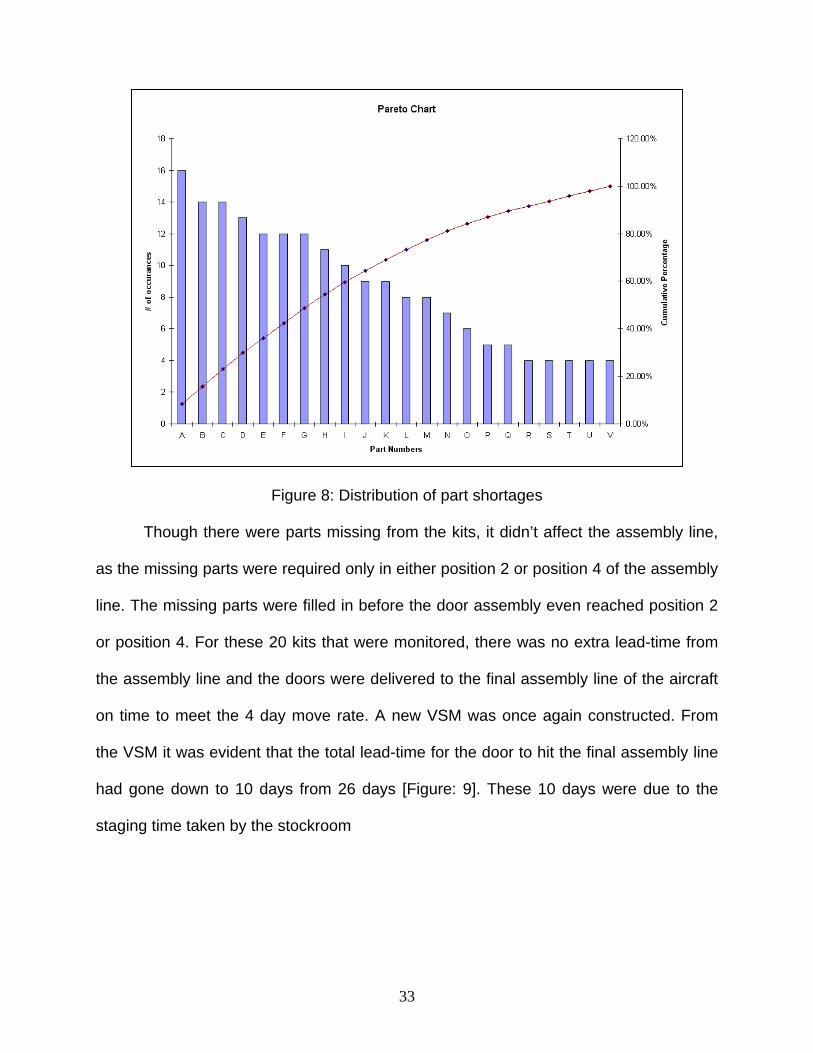
From the Pareto chart in Figure 8, it is evident that 8 parts where missing for at least
50% of the time. Hence, these 8 parts where considered for corrective action. Out of the
8 parts that were considered for corrective action, the same vendor supplied four parts.
Improve
The improve phase was nothing but identifying appropriate corrective actions to
reduce the shortage issues. Shortages were mainly with vendor parts. In order to get
corrective actions from the vendors, a team of material logistics agents from the Work
Material & Planning (WMP) department was formed. The team came up with the
corrective action of demanding the vendor to supply the parts on time failing which the
vendor might be replaced. With these data as evidence corrective actions were
demanded from the vendors with high shortage history. The vendor that supplied 4 of
the 8 parts was eventually replaced. After 3 move cycles (12 manufacturing days) the
32
same shortage data was collected for another 20 kits. These second set of shortage list
was not blank. On an average only three parts were missing from each kit [Table 2].
Figure 7: Shortage list by part number and number of occurrences
33
Figure 8: Distribution of part shortages
Though there were parts missing from the kits, it didn’t affect the assembly line,
as the missing parts were required only in either position 2 or position 4 of the assembly
line. The missing parts were filled in before the door assembly even reached position 2
or position 4. For these 20 kits that were monitored, there was no extra lead-time from
the assembly line and the doors were delivered to the final assembly line of the aircraft
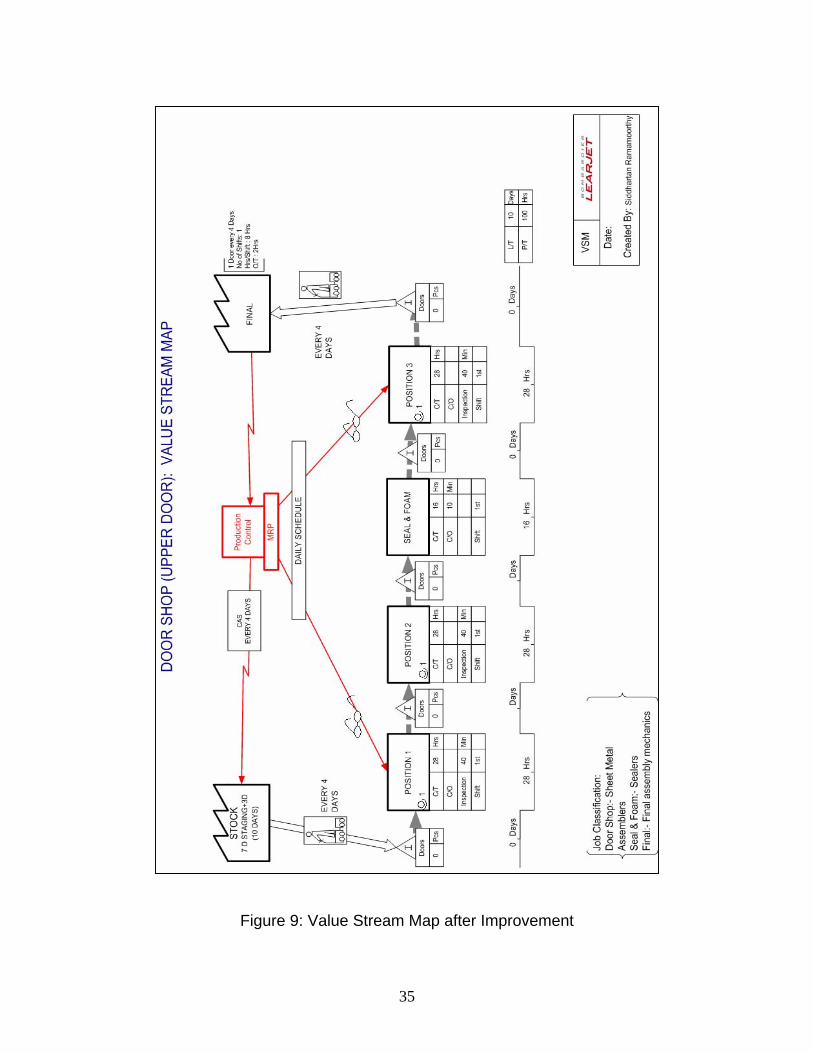
on time to meet the 4 day move rate. A new VSM was once again constructed. From
the VSM it was evident that the total lead-time for the door to hit the final assembly line
had gone down to 10 days from 26 days [Figure: 9]. These 10 days were due to the
staging time taken by the stockroom

34
Table 2: Shortage list after improvement
Control
The corrective actions taken were documented for future reference. The
corrective actions are controlled and monitored by the WMP department using the
Consolidated Applications System (CAS), a mainframe application that is used to
monitor the lead-time of the parts supplied by vendors. By monitoring the lead-time, the
WMP department would be able to demand corrective action from the suppliers
whenever their supply lead-time crosses the required production lead-time.
.
35
Figure 9: Value Stream Map after Improvement

36
3.7 Phase II: Non-conformance reduction:
Having reduced the lead-time associated with the delivery of completed Model
40/45 Upper Door, the next phase was to study the non-conformance from the doors
and reduce the rework hours associated with it. In the final assembly line, the wing,
which arrives from a different facility, is mated with the fuselage. Then the wind shields,
doors, flight controls and avionics equipments would be installed and the Aircraft would
be ready for a flight test.
Define
One of the most frequently noted non-conformances at the final assembly was
the deviation in the contour of the upper door. The completed door when installed on
the fuselage always had a deviation in contour with that of the fuselage. Each time this
deviation in contour was encountered, the door had to be reworked for alignment with
the fuselage. This contour issue was only noted with the Upper door and not the Lower
door. Since this was a repeating issue, this non-conformance was chosen for study and
analysis.
Measure
As a first step in the measure phase, ‘Defect Concentration Charts’ (DCC) were
used. A DCC is used to identify the area on a particular part where defect occurs the
most and also repeatedly. For this case study, the DCC chart was designed and
provided to the assembler. He was instructed to mark the DCC every time he
encounters a defect corresponding to the contour of the upper door. DCC was used for
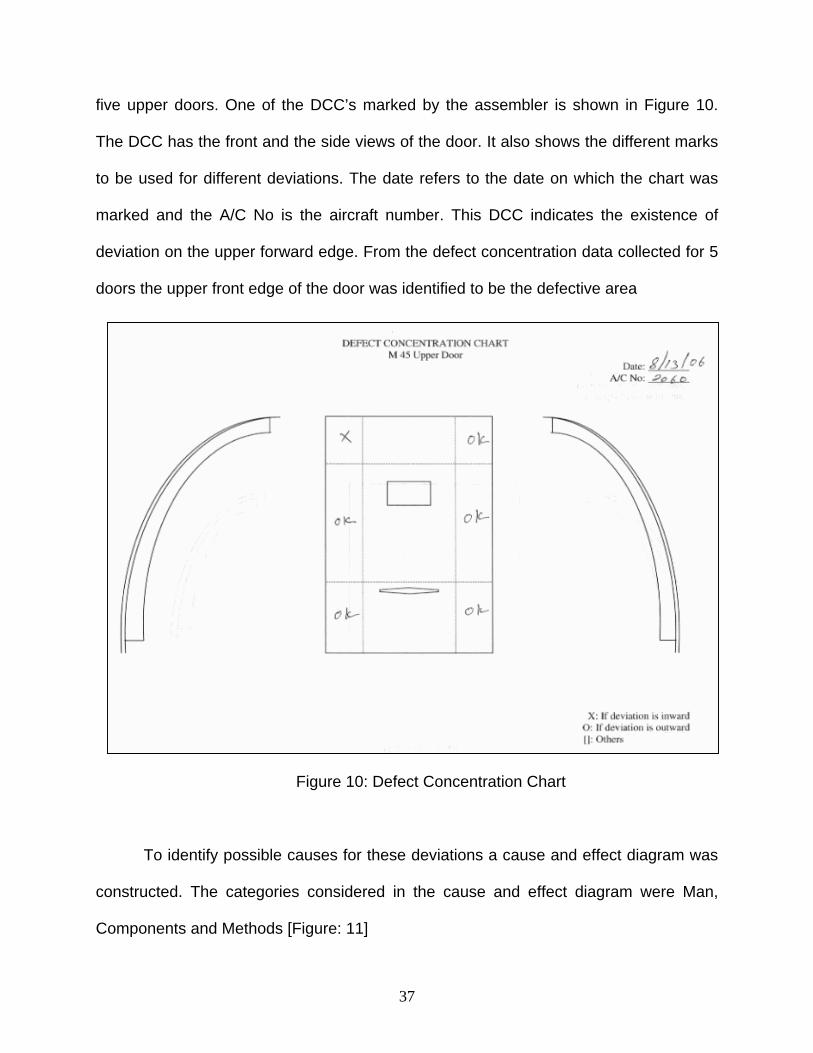
37
five upper doors. One of the DCC’s marked by the assembler is shown in Figure 10.
The DCC has the front and the side views of the door. It also shows the different marks
to be used for different deviations. The date refers to the date on which the chart was
marked and the A/C No is the aircraft number. This DCC indicates the existence of
deviation on the upper forward edge. From the defect concentration data collected for 5
doors the upper front edge of the door was identified to be the defective area
Figure 10: Defect Concentration Chart
To identify possible causes for these deviations a cause and effect diagram was
constructed. The categories considered in the cause and effect diagram were Man,
Components and Methods [Figure: 11]

38
Figure 11: Causes for deviation in contour
Under trained employees and inconsistent manning were considered as possible
causes. When enquired they were found to be skilled and experienced assemblers.
They have been working on doors in the door shop for at least eight years and thus the
cause of operators was ruled out. For Method, the standardization of work being
carried out was questioned. The entire process of assembling the upper door was
observed and documented. When compared with the engineering standards and work
instructions the operators appeared to be following the standard work instructions. It
was also evident that the process was not different from what was followed before
contour problems were experienced.

39
The jigs, fixtures and hand tools used for assembling the doors were considered
as a possible cause. Improper maintenance and out of calibration could be key factors.
The three different tools used in three different positions of the upper door assembly
were considered for dimensional check. Since the tools were being used for many years
there were possibilities for wearing out of the tools that might be the cause for defective
outputs. The certification history of the tools was collected. From the data it was found
out that the tools, jigs and fixtures were certified once every 16 door deliveries by the
tooling department as required by the FAA. Similarly all the hand tools were up to date
on calibration and certification. Hence the question of the tools being defective was also
ruled out.
The final inspection for the contour of the doors involved a contour template. This
contour template was a replica of the template that is used to measure the contour of
the fuselage. The contour template was checked for accuracy and found to be within
specifications. The main components that might contribute to the contour of the door are
the frames and the door skin. The stock room was requested to measure the parts that
were already in the stock for dimensional accuracy. As expected there were 3 sets of
these parts in stock. They were measured and found to be within engineering tolerance
limits. In order to measure the contour of the door, a portable CMM was used. In this
case a FARO Arm was used to measure the contour of the door. [Figure: 12]

40
Figure 12: Faro Arm – G08 – 02
Analyze
The procedure that was followed was to match the contour of the completed door
with the engineering drawing of the door. The output from the FARO arm is a digitized
image file. The IMAGE WARE – BUILD IT software was used as a medium of matching
the two files, namely one from the FARO arm and the other from the drawing. The
engineering drawing was available as a CATIA model. Both the CATIA model and the
.SAT file were imported to the IMAGE WARE software as IGES files. These two files
Model: Gold Series Model 08 Accuracy: ±0.002 inchesCal. Cycle: 120Days

41
were matched and the results were used to calculate the average deviation from the
engineering. Four doors were used for this study. The output of this contour matching
procedure is shown in Figure 13.
Figure 13: Sample output from IMAGE WARE
An average value was computed from the measurements made as shown in
Figure 14. The aero dynamical tolerance limit for contours is ±0.06 inches. From figure
16 it is evident that the average values of all the four contours are well within the
tolerance limits.

42
Figure 14: Mean Deviations on sample
In order to identify the other causes, the non-conformances reported during the
assembly of the door with the fuselage were collected. Interestingly, there was one
non-conformance that was repeatedly reported along with the contour deviation. It was
the force requirement in operating the door handle mechanism. As per Learjet
engineering standards, the maximum force that can be applied in operating the door
handle mechanism is 35 lbs. After assembling a complete door, the force requirement is
inspected at the final assembly line. When the door was mounted on the fuselage and
the force requirement was functionally tested, often more than 35 lbs was required to
operate the door handle. A 0-100 lbs spring gauge was used to measure the force
requirements in operating the door handle. The spring gauge is attached to the inner
43
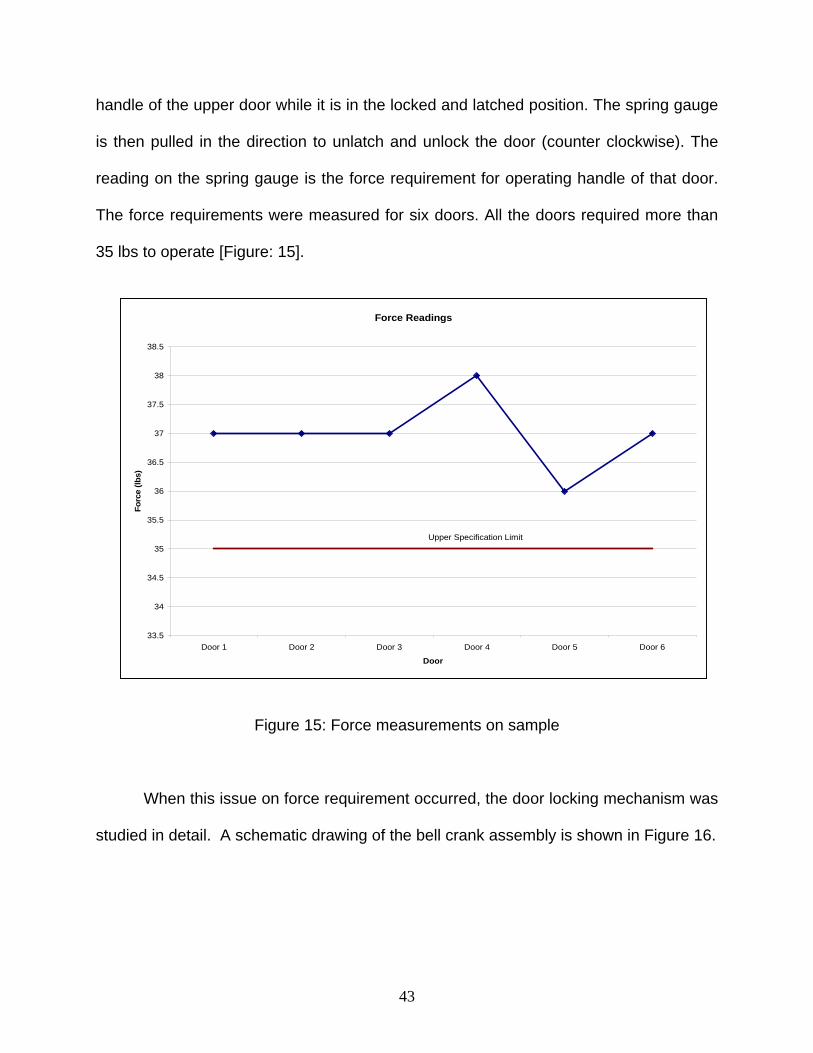
handle of the upper door while it is in the locked and latched position. The spring gauge
is then pulled in the direction to unlatch and unlock the door (counter clockwise). The
reading on the spring gauge is the force requirement for operating handle of that door.
The force requirements were measured for six doors. All the doors required more than
35 lbs to operate [Figure: 15].
Figure 15: Force measurements on sample
When this issue on force requirement occurred, the door locking mechanism was
studied in detail. A schematic drawing of the bell crank assembly is shown in Figure 16.
Force Readings
33.5
34
34.5
35
35.5
36
36.5
37
37.5
38
38.5
Door 1 Door 2 Door 3 Door 4 Door 5 Door 6
Door
Forc
e (lb
s)
Upper Specification Limit

44
Figure 16: Bell Crank Assembly
Improve
A team of process engineers and quality engineers was formed to identify the
root cause for the high force requirement in operating the door handle. The bell crank
pin not sliding into the bush at a straight angle was identified as the root cause by the
45
team. Interestingly, since the pin was not aligned with the bush, more force was
required to be applied on the door, which in turn aided in the door deviating from its
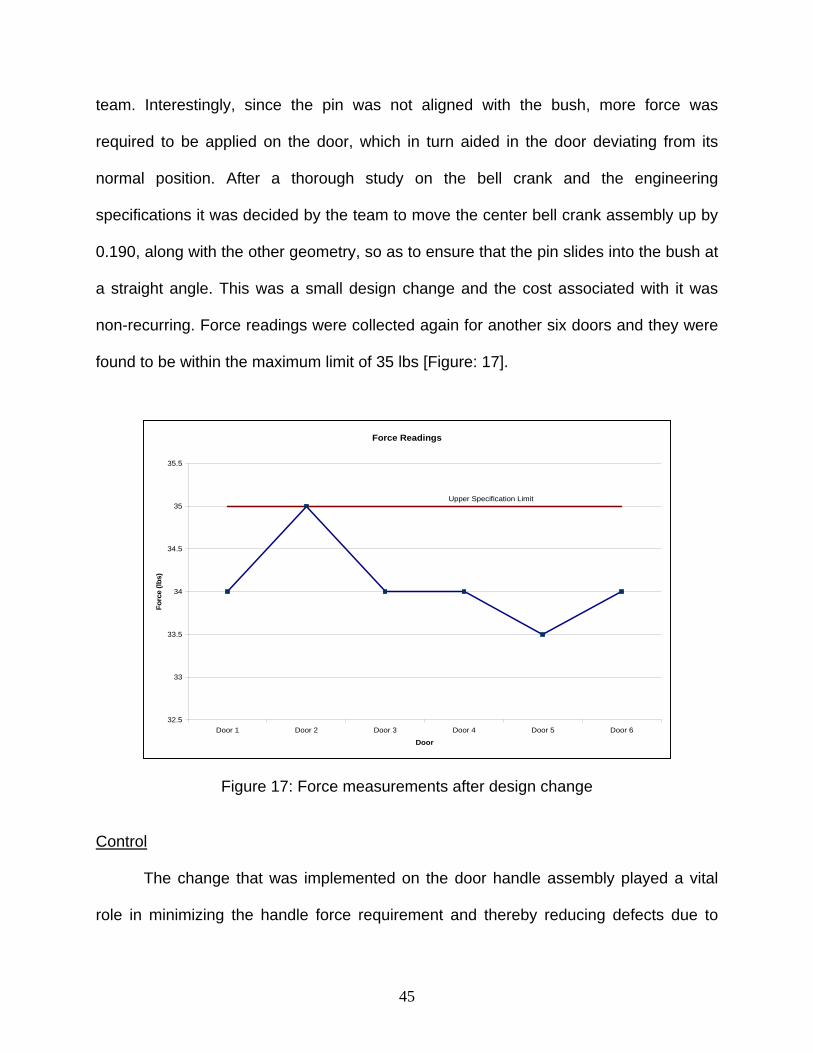
normal position. After a thorough study on the bell crank and the engineering
specifications it was decided by the team to move the center bell crank assembly up by
0.190, along with the other geometry, so as to ensure that the pin slides into the bush at
a straight angle. This was a small design change and the cost associated with it was
non-recurring. Force readings were collected again for another six doors and they were
found to be within the maximum limit of 35 lbs [Figure: 17].
Figure 17: Force measurements after design change
Control
The change that was implemented on the door handle assembly played a vital
role in minimizing the handle force requirement and thereby reducing defects due to
Force Readings
32.5
33
33.5
34
34.5
35
35.5
Door 1 Door 2 Door 3 Door 4 Door 5 Door 6
Door
Forc
e (lb
s)
Upper Specification Limit

46
contour mismatch. This change in design was documented as a DCN (Drawing Change
Notification). Figure 18 shows the drawing of the bell crank assembly after the design
change. This DCN would be used for future references. Since a DCN was issued the
future doors would be having the bell crank installed as per the new design change and
there wouldn’t be non-conformances related to force requirements.
Figure 18: Bell crank assembly after design changes
47
CHAPTER 5
RESULTS AND CONCLUSIONS
Lean Six-Sigma has evolved from individual practices of lean and six-sigma that
focus on reducing waste and variability to deliver a high quality product. The
effectiveness of this integrated approach has been tested in many occasions. Success
in most of the cases is evident from cited literature and case studies. Value stream
mapping, considered as a strong and effect lean manufacturing tool is often used to
visualize the flow of information and material involved in a certain process. Value
stream map also helps identify the possible improvement opportunities. The DMAIC, a
six-sigma approach, gives a finite sequence of steps to be followed in improving a
process.
This integrated approach of using lean and six-sigma tools was proposed and
evaluated through a case study. Using a high level value stream map two opportunities
for improvement were identified, namely lead-time and non-conformance reduction. The
first phase of the improvement, lead-time reduction, was actually a lean goal where a
detailed current state value stream map was utilized to calculate lead-time. Part
shortage was found to be the reason for high lead-time. After utilizing the DMAIC
procedure, corrective actions were taken the lead-time was reduced from 26 days to 10
days.
The next phase involves non-conformance reduction. Once again, DMAIC was
used as a systematic approach to reduce the non-conformances and thereby further
reduce the cycle time involved in assembling the fuselage.

48
The tools to be used in the DMAIC approach is not limited to what was used in
this case study. Depending on the nature and type of the application a suitable lean
and, or six-sigma tool can be utilized. As in this case study, engineering knowledge and
team approach are essential in identifying the root causes for defects. Without
engineering knowledge the actual cause of the defect might be either missed or
misinterpreted. While working on defects from assembly lines the actual cause of the
defect might be from another department. So forming a cross functional team with
members from departments that are affected by the defect would add value and reduce
the effort in identifying root causes. This Lean Six-Sigma integration was found to be an
effective problem solving approach. If used repetitively, more improvement opportunities
can be identified and studied. Systematic use of the proposed integrated approach can
ensure savings in terms of time and money.

49
REFERENCES
50
LIST OF REFERENCES
1. Adams, C. W., Gupta, P., & Wilson, C. E. Jr. (2003). Six Sigma Deployment. USA:
Butterworth-Heinemann.
2. Arnheiter, E. D., & Maleyeff, J. (2005). The integration of lean management and
Six Sigma, The TQM Magazine, 17, 5–18.
3. Banuelas, R., Antony, J., & Brace, M. (2005). An application of six-sigma to reduce
waste. Quality and Reliability Engineering International, 21, 553-570
4. Bertels, T. (2003). Rath & Strong’s Six Sigma Leadership Handbook. New Jersey:
John Wiley & Sons, Inc.
5. Bruce, G., & Launsby, R. G. (2003). Design for Six Sigma. New York: London
McGraw-Hill Professional.
6. Brunet, A.P., & New, S. (2003). Kaizen in Japan: an empirical study, International
Journal or Operations & Production Management, 23, 1426–1446.
7. Burr, J, T., (1990). The Tools of Quality -- Part VI: Pareto Charts. Quality Progress
23, 59-61.
8. Carreira, B. (2005). Lean Manufacturing that Works. New York: AMACOM.
9. Eckes, G. (2001). The Six-Sigma Revolution. New York: John Wiley & Sons, Inc.
10. Emiliani, M.L. (2006). Origins of lean management in America, Journal of
Management History, 12, 167-184
11. Fitzpatrick, D., Looney, M. (2003). A roadmap to greater efficiency in aerospace
operations through the application of Six Sigma and Lean manufacturing
techniques, Aircraft Engineering and Aerospace Technology, 75, 274-277
51
12. George, M. L. (2002). Lean Six Sigma: Combining Six Sigma Quality with Lean
Speed. New York: McGraw-Hill Companies, Inc.
13. George, M. L. (2003). Lean Six Sigma for Service. New York: McGraw-Hill
Companies.
14. Goldman, Henry. (2005). The Origins and Development of quality initiatives in
American business, The TQM Magazine, 17, 217–225.
15. Kaye, M., & Anderson, R. (1999). Continuous Improvement: the ten essential
criteria, International Journal of Quality and Reliability management, 16, 485–
506.
16. Larson, A. (2003). Demystifying Six Sigma. New York: AMACOM.
17. Monden, Y. (1998). Toyota Production System. Georgia: Engineering &
Management Press.
18. Pande, P. S., Neuman, R. P., & Cavanagh, R. R. (2000). The Six Sigma Way. New
York: The McGraw-Hill Companies, Inc.
19. Pande, P., & Holpp L. (2002). What is Six Sigma? New York: McGraw-Hill
Companies, Inc.
20. Pande, P. S., Neuman, R. P., & Cavanagh, R. R. (2002). The Six Sigma Way
Team Field book: An Implementation Guide for Project Improvement Teams.
New York: McGraw-Hill Professional.
21. Sarazen, J. S., (1990). The Tools of Quality -- Part II: Cause and Effect Diagrams.
Quality Progress 23, 59-62.
22. Shina, S. G. (2002). Six Sigma for Electronics Design and Manufacturing. New
York: McGraw-Hill Companies, Inc.
52
23. Standard, C., & Davis D. (1999). Running Today’s Factory. Cincinnati: Hanser
Gardner Publication.
24. Steinbrunner, D. (2005). The happy marriage of push and pull. Industrial
Management, 47, 27-30.
25. Supplier-Input-Process-Output-Customer. Retrieved April 20, 2007, from
www.pacepilot.com/sipoc1.shtml
26. Tapping, D., Luyster, T., & Shuker, T. (2002). Value Stream Management. New
York: Productivity, Inc.
27. Waurzyniak, P, (2005). Lean Machine, Manufacturing Engineering, 135, 5, L1 – 4.